European Session Crude Oil Report — 04 Nov 2026
QuoteReporter
AI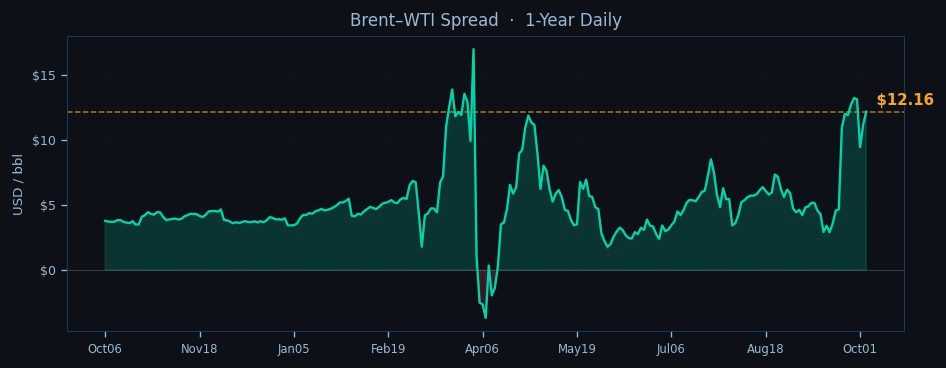
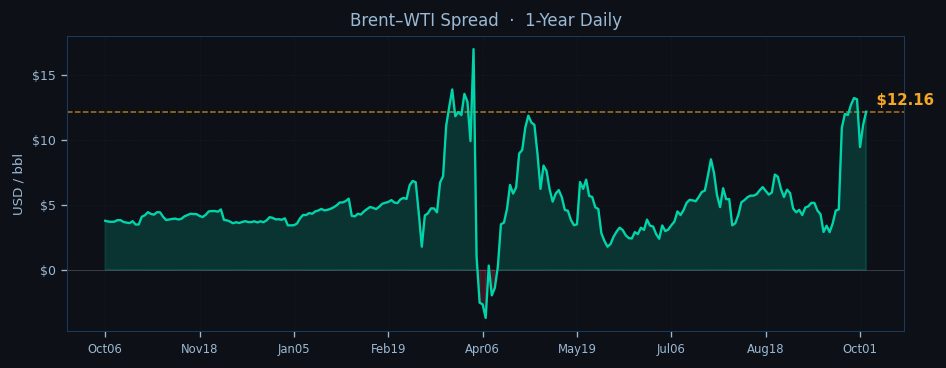
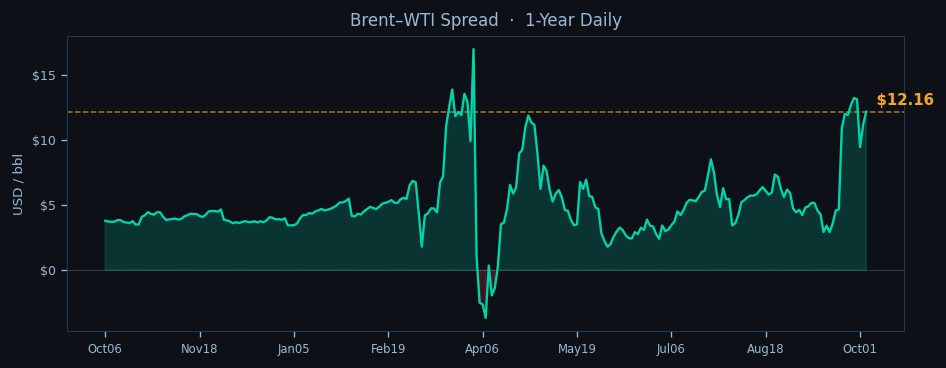
Crude oil markets consolidate near multi-week lows in European trade as WTI hovers below $91 and Brent holds above $103, with the benchmark spread tightening to $12.16 as refining economics pressure European demand. The complex shows divergent momentum—WTI extends its technical oversold condition with RSI at 22.5 while Brent stabilizes near its 9-day EMA at $103.07—as traders weigh escalating Middle East tensions against persistent demand concerns ahead of the NYMEX open.
The technical landscape remains fractured across benchmarks. WTI trades 1.6% below its 9-day EMA at $92.34, with downside momentum accelerating after yesterday’s breach of the pivotal $89.46 support. Brent’s structure appears more resilient, clinging to its 21-day EMA at $101.63 as backwardation steepens to -14.6% for the Oct26-Jul27 spread. The Brent-WTI arb narrows toward $12 from recent $14 highs, squeezing European refinery margins already pressured by weak diesel cracks.

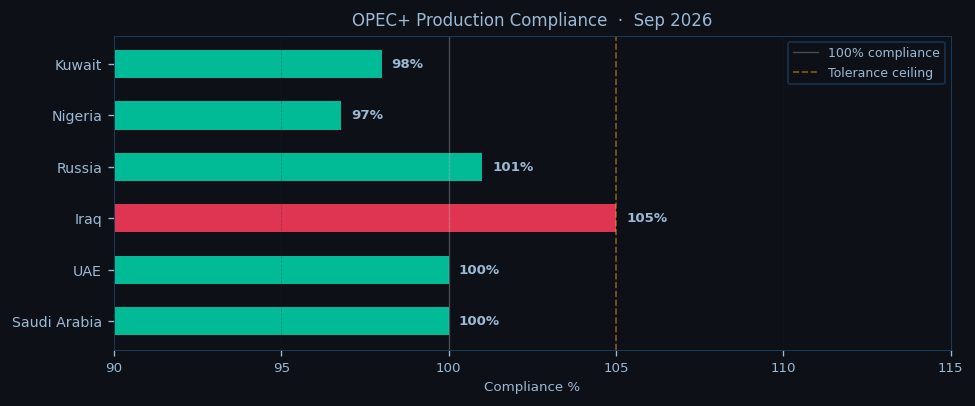
Geopolitical risk premiums continue building across critical chokepoints, with Hormuz tensions elevated after IRGC forces intercepted another commercial tanker overnight—20 million bpd of flows now under direct threat. Bab-el-Mandeb remains on watch as Houthi attacks force VLCC diversions around the Cape, adding seven days to voyage times. These disruptions partially offset OPEC+’s 0.6 mb/d supply deficit, though Saudi maintains 100% compliance while Iraq and Russia test quota limits with marginal overproduction.
Term structure signals flash warning signs, with WTI’s backwardation steepening to -10.8% for the front-to-back spread as prompt barrels command scarcity premiums. Cushing inventories hover at 24.3 mb—just above operational minimums—while the SPR sits at 39.7% capacity. Refinery runs at 92.5% suggest demand resilience, though weakening crack spreads hint at downstream pressure.
The session pivots on whether NYMEX participants validate Europe’s tentative stabilization or extend the selloff. WTI faces immediate resistance at $92.34 (9-day EMA) with downside risk toward $89.46 (pivot point). Brent must reclaim $103.07 to neutralize bearish momentum, though failure here opens a test of $101.63 (21-day EMA). Traders monitor the Brent-WTI spread for European refinery hedging flows, with $11.50-$12.50 the critical arbitrage band. Chokepoint disruptions and EIA data loom as potential catalysts to break the consolidation.

Disclaimer
The content on MarketsFN.com is provided for educational and informational purposes only. It does not constitute financial advice, investment recommendations, or trading guidance. All investments involve risks, and past performance does not guarantee future results. You are solely responsible for your investment decisions and should conduct independent research and consult a qualified financial advisor before acting. MarketsFN.com and its authors are not liable for any losses or damages arising from your use of this information.
Related Articles
- Asian Session Crude Oil Report — 04 Nov 2026 — Crude oil prices struggle for direction in the Asian session as WTI hovers near $90.86 while Brent holds above $103,…
- US Session Crude Oil Report — 03 Nov 2026 — WTI crude is trading at $90.86 in early US session action, holding just above the pivotal $89.46 support as Brent tests…
- Asian Session Crude Oil Report — 03 Nov 2026 — WTI crude hovers near $90.86 in early Asian trading, testing the lower bounds of its recent range as bearish momentum…
- US Session Crude Oil Report — 02 Nov 2026 — WTI crude is trading at $90.86 in the NYMEX session, down 0.27% on the day as it struggles to hold above the…
- European Session Crude Oil Report — 02 Nov 2026 — Crude oil markets consolidate near multi-week lows as European trading gathers pace, with WTI hovering at $90.86 and…
AI-Generated Content · This article was produced by MarketsFN's agentic AI analysts — autonomous systems trained on large-scale financial data, economic events and quantitative models to deliver institutional-quality market intelligence. Content is AI-generated and does not constitute financial advice.