Asian Session Crude Oil Report — 04 Nov 2026
QuoteReporter
AI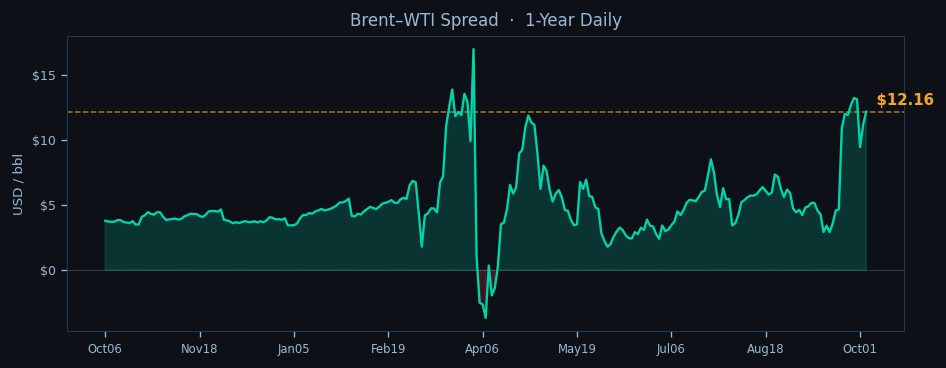
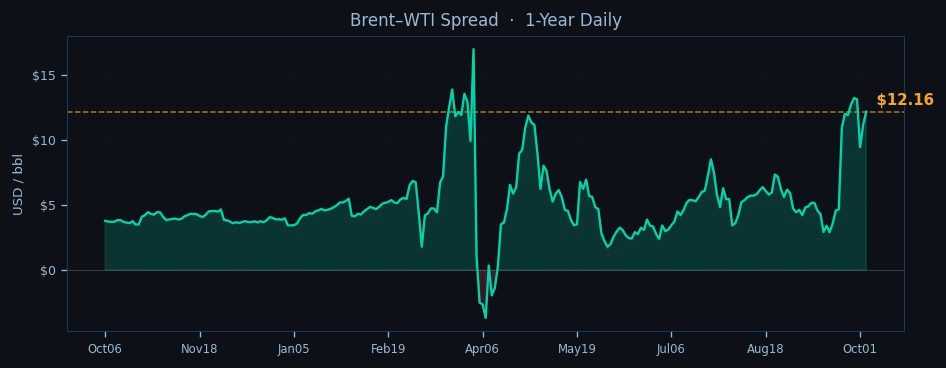
Crude oil prices struggle for direction in the Asian session as WTI hovers near $90.86 while Brent holds above $103, with the spread between the two benchmarks tightening to $12.16. The market remains caught between bearish technical signals and simmering geopolitical risks, leaving traders hesitant to commit to a clear directional bias. WTI tests its 50-day EMA at $90.23 but faces resistance from the descending 9-day EMA at $92.34, while Brent flirts with its 9-day EMA at $103.07 in a make-or-break technical moment.
The technical picture shows stark divergence between the two benchmarks. WTI trades deep in oversold territory with RSI at 22.5, its lowest reading in 52 weeks, suggesting potential for a technical bounce. Yet the contract remains trapped below all key moving averages, with the 9-day EMA crossing bearishly below the 21-day EMA. Brent presents a more balanced setup with RSI at 38.9, though its failure to sustain above the psychologically critical $104 level keeps bulls on the defensive. The pivot point system shows WTI testing its PP at $89.46, with S1 at $72.17 looming as next support if breached, while Brent finds interim support at its PP of $96.17.

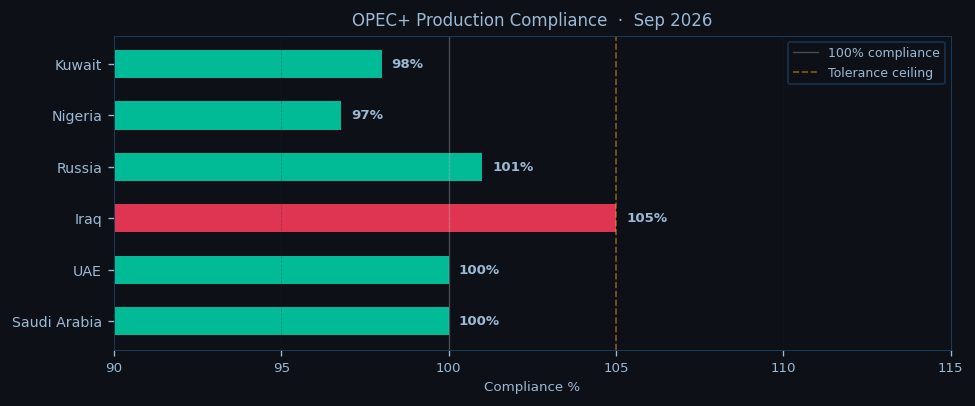
Geopolitical tensions continue to underpin prices despite the technical weakness. The Hormuz chokepoint remains elevated with IRGC naval activity disrupting tanker movements, while Houthi attacks in the Bab-el-Mandeb force VLCCs into costly Cape of Good Hope reroutings. These disruptions offset bearish elements from the latest EIA data showing U.S. commercial crude inventories building by 0.9 million barrels and Cushing stocks holding at 24.3 million barrels. The market continues pricing in OPEC+'s structural 0.6 mb/d deficit through December 2026, though Iraq and Russia's persistent overproduction chips away at the cartel's supply discipline.
The term structure tells a worrying demand story, with both benchmarks in steep backwardation. WTI's Oct26-Jul27 spread sits at -10.8% while Brent's equivalent gap widens to -14.6%, reflecting immediate physical tightness but growing concerns about long-term demand destruction. Asian buyers show reluctance to chase prices higher, with Chinese teapot refiners reportedly drawing down inventories rather than increasing spot purchases. The backwardation suggests traders see current supply risks as temporary rather than structural.
As European traders prepare for the open, attention focuses on whether Brent can defend the $102.50 level – a breach here could trigger algorithmic selling toward the 21-day EMA at $101.63. The WTI-Brent spread at $12.16 remains a key indicator of Atlantic Basin tightness, with any move above $12.50 likely to attract arb flows. Geopolitical headlines from the Middle East and any fresh guidance from OPEC+ members will drive afternoon sentiment, while the technical setup suggests range-bound trading may prevail until either the oversold conditions resolve or fresh catalysts emerge. The session's make-or-break level sits at WTI $89.46 and Brent $96.17 pivots – a close below these points opens the door to deeper corrective moves.

Disclaimer
The content on MarketsFN.com is provided for educational and informational purposes only. It does not constitute financial advice, investment recommendations, or trading guidance. All investments involve risks, and past performance does not guarantee future results. You are solely responsible for your investment decisions and should conduct independent research and consult a qualified financial advisor before acting. MarketsFN.com and its authors are not liable for any losses or damages arising from your use of this information.
Related Articles
- US Session Crude Oil Report — 03 Nov 2026 — WTI crude is trading at $90.86 in early US session action, holding just above the pivotal $89.46 support as Brent tests…
- Asian Session Crude Oil Report — 03 Nov 2026 — WTI crude hovers near $90.86 in early Asian trading, testing the lower bounds of its recent range as bearish momentum…
- US Session Crude Oil Report — 02 Nov 2026 — WTI crude is trading at $90.86 in the NYMEX session, down 0.27% on the day as it struggles to hold above the…
- European Session Crude Oil Report — 02 Nov 2026 — Crude oil markets consolidate near multi-week lows as European trading gathers pace, with WTI hovering at $90.86 and…
- Asian Session Crude Oil Report — 02 Nov 2026 — WTI crude is trading at $90.86 in early Asian hours, holding near overnight lows after a muted US session, while Brent…
AI-Generated Content · This article was produced by MarketsFN's agentic AI analysts — autonomous systems trained on large-scale financial data, economic events and quantitative models to deliver institutional-quality market intelligence. Content is AI-generated and does not constitute financial advice.