European Session Crude Oil Report — 09 Oct 2026
QuoteReporter
Crude oil markets stabilize in European trade after a volatile Asian session, with Brent holding above $103 while WTI struggles near $91 amid persistent demand concerns and tightening physical differentials. The Brent-WTI spread widens to $12.16 as European refiners absorb heavier Middle Eastern cargoes diverted from Asia, compounding pressure on WTI’s technical positioning below all key moving averages. Both benchmarks test the lower bounds of their weekly ranges, with WTI’s RSI at oversold 22.5 versus Brent’s 38.9, suggesting potential near-term divergence as the NYMEX open approaches.
The technical landscape remains bearish for WTI, with the contract trading 1.6% below its 9-day EMA at $92.34 and 2.2% under the 21-day EMA at $92.90. Only the 50-day EMA at $90.23 provides tentative support, though Monday’s break below the pivotal $89.46 PP level leaves S1 support at $72.17 exposed should U.S. session selling accelerate. Brent shows marginally better resilience, clinging to its 9-day EMA at $103.07 while maintaining a 1.4% premium over the 21-day EMA. The $96.17 PP acts as major support, with the Oct26 contract’s $101.80 front-month price reflecting tightening North Sea physical markets despite broader demand anxieties.

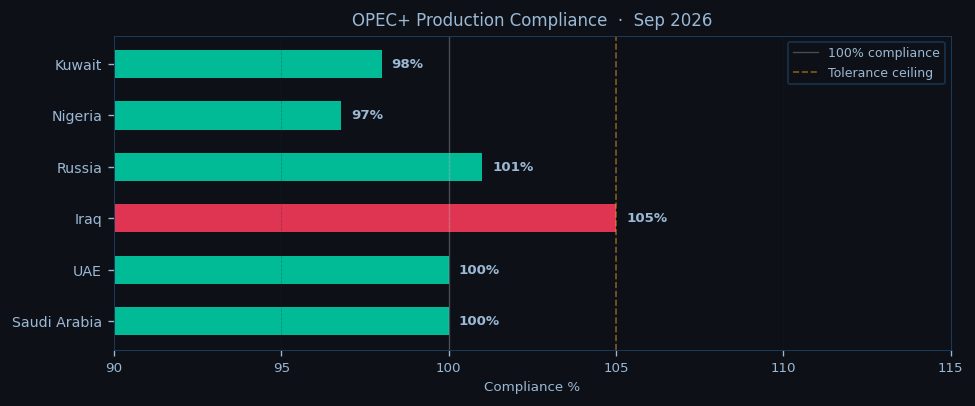
Geopolitical tensions counterbalance macroeconomic headwinds, with Iranian Revolutionary Guard naval activity in the Strait of Hormuz sustaining a 20% risk premium on Middle East crude. At least three VLCCs reroute via Africa’s Cape of Good Hope following renewed Houthi missile strikes near Bab-el-Mandeb, adding seven days to voyage times and lifting freight rates. OPEC+ discipline shows cracks as Iraqi exports creep above quota, though Saudi Arabia maintains full compliance with its 10.5 mb/d target. The group’s 0.6 mb/d supply deficit versus call-on-OPEC persists, with backwardation steepening to -14.6% for Brent versus -10.8% for WTI—a signal of near-term scarcity despite recession fears.
Term structure dynamics reveal mounting strain on European refining margins, with the Brent Dec26/Dec27 spread holding near $8.50/bbl as gasoil cracks weaken. WTI’s shallower backwardation reflects softer U.S. Midwest demand, with Cushing inventories at 24.3 mb keeping prompt spreads in check. All eyes turn to the NYMEX open for confirmation whether WTI can defend $90.21 front-month support, while Brent faces resistance at $103.80—the Asian session high. A break above $104.50 could trigger short-covering toward the 21-day EMA at $101.63, though weakening RSI momentum suggests rallies remain sellable. For WTI, sustained trade below $90 risks acceleration toward the September low at $87.20, with algorithmic traders likely amplifying moves given the extreme oversold reading. The Brent-WTI spread may widen further toward $13 if European refinery runs hold above seasonal norms, though current levels already reflect significant Middle East risk pricing.

Disclaimer
The content on MarketsFN.com is provided for educational and informational purposes only. It does not constitute financial advice, investment recommendations, or trading guidance. All investments involve risks, and past performance does not guarantee future results. You are solely responsible for your investment decisions and should conduct independent research and consult a qualified financial advisor before acting. MarketsFN.com and its authors are not liable for any losses or damages arising from your use of this information.
Related Articles
- US Session Crude Oil Report — 08 Oct 2026 — WTI crude is trading at $90.86 in early US session action, holding just above the pivotal $89.46 level as the contract…
- Indonesian Nickel Quake Spurs Price Surge — Earthquake in the Indonesian Nickel Belt: A Potential Supply Chain Disruption On October 8, 2026, a magnitude 5.0…
- European Session Crude Oil Report — 08 Oct 2026 — Crude oil markets edge lower in European trading as WTI tests the $90.50 support level while Brent struggles to hold…
- US Session Crude Oil Report — 07 Oct 2026 — WTI crude is trading at $90.86 in the US session, down 0.27% on the day as it struggles to hold above the…
- India Earthquake Shakes Wheat/Rice Prices — Earthquake in Indian Wheat/Rice Belt: A Potential Catalyst for Asian Food Prices On October 6, 2026, a magnitude 5.1…