European Session Crude Oil Report — 12 Nov 2026
QuoteReporter
AI
Crude oil markets trade mixed in the European session as Brent crude extends its overnight rebound while WTI struggles below key moving averages, with the Brent-WTI spread widening to $12.16 as European refiners face tightening North Sea supply. Brent tests $103.02 with a 0.75% daily gain, recovering from its Asian session low of $102.18, while WTI hovers at $90.86 after failing to hold above its 50-day EMA at $90.23. The spread between the benchmarks builds pressure on European complex margins as backwardation steepens across both curves, with Brent’s front-to-Jul27 gap now at -14.6% versus WTI’s -10.8%.
Technical positioning shows stark divergence between the contracts. WTI’s RSI at 22.5 signals extreme oversold conditions after seven straight sessions of declines, its price now 2.2% below the 21-day EMA at $92.90. Brent’s RSI at 38.9 holds nearer neutral territory, with the contract finding support at its 9-day EMA of $103.07. The pivot point framework shows WTI testing its PP at $89.46, with S1 at $72.17 the next major downside target should the level break, while Brent defends its R1 at $117.04 with the 50-day EMA at $97.21 acting as critical support.

Geopolitical tensions underpin Brent’s relative strength as Iranian Revolutionary Guard Corps naval activity elevates Hormuz disruption risks, with 20 million bbl/d of flows exposed. VLCC diversions around the Cape of Good Hope add 7 days to voyage times as Houthi attacks persist at Bab-el-Mandeb, though Suez and Malacca transit remains unimpeded. These pressures compound structural tightness from OPEC+ cuts running through December 2026, with the group’s 26.8 mb/d output now 0.6 mb/d below call. Saudi compliance holds at 100% though Russian Urals exports show signs of creeping above quota.
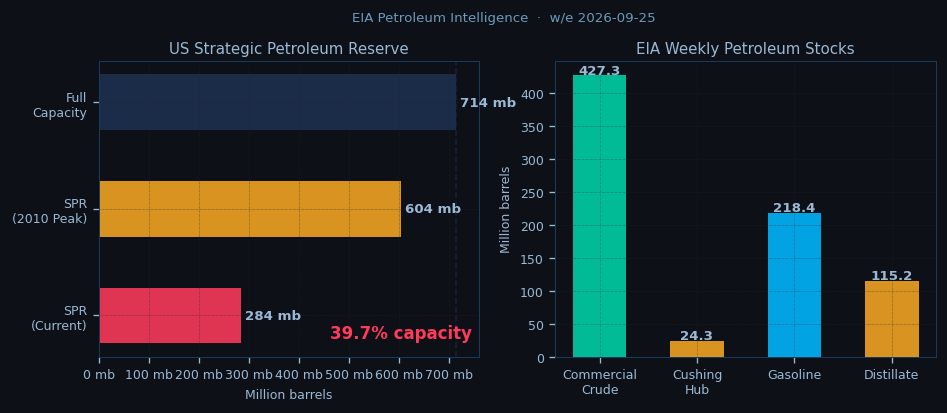
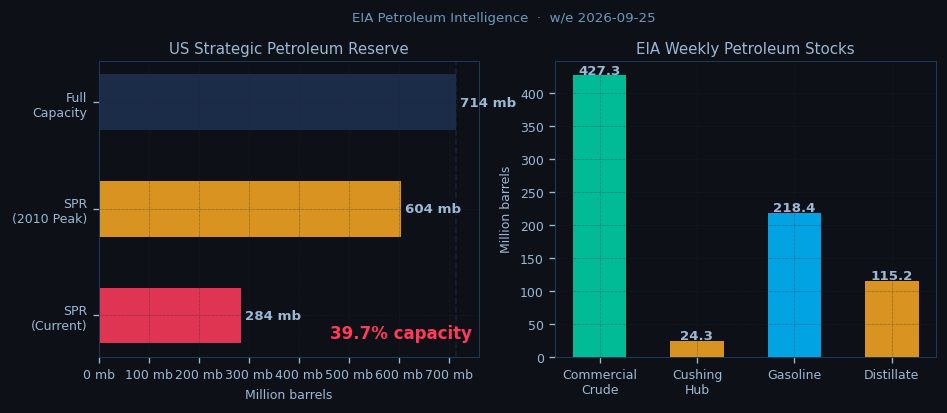
The term structure signals persistent physical tightness as prompt Brent barrels command a $1.22 premium to second-month, with European refinery runs at 92.5% capacity drawing down inventories. Cushing stocks at 24.3 mb keep WTI backwardation in check, though the EIA’s 427.3 mb commercial stockpile remains below seasonal norms. The Brent-WTI spread at $12.16 incentivizes Atlantic Basin arbitrage flows, with US crude exports likely to test record highs near 4.5 mb/d in coming weeks.
Attention now turns to the NYMEX open at 14:30 CET, with traders watching whether WTI can reclaim its 50-day EMA at $90.23 to avert another leg lower. Brent’s ability to hold above $102.50 sets the stage for a retest of the October high at $105.78, though RSI divergence warns of fading momentum. For European refiners, the widening Brent-WTI spread pressures cracking margins already squeezed by rising natural gas costs, with prompt Brent timespreads suggesting no near-term relief. The session’s key inflection point remains WTI’s pivot at $89.46 – a sustained break opens the path to $87.00 support, while holding here could trigger short-covering into the US session.

Disclaimer
The content on MarketsFN.com is provided for educational and informational purposes only. It does not constitute financial advice, investment recommendations, or trading guidance. All investments involve risks, and past performance does not guarantee future results. You are solely responsible for your investment decisions and should conduct independent research and consult a qualified financial advisor before acting. MarketsFN.com and its authors are not liable for any losses or damages arising from your use of this information.
Related Articles
- US Session Crude Oil Report — 11 Nov 2026 — WTI crude is trading at $90.86 in the NY session, down 0.27% on the day as it struggles to hold above the…
- European Session Crude Oil Report — 11 Nov 2026 — Crude oil markets edge lower in European trade as WTI hovers near $90.86 while Brent holds above $103, with both…
- Asian Session Crude Oil Report — 11 Nov 2026 — Crude oil markets test key technical levels in early Asian trading as WTI hovers near $90.86 while Brent holds above…
- US Session Crude Oil Report — 10 Nov 2026 — WTI crude is trading at $90.86 in the NY session, down 0.27% on the day as it struggles to hold above the…
- European Session Crude Oil Report — 10 Nov 2026 — **European Session Crude Oil Report — 05 Oct 2026 11:00 NY** Brent crude holds above $103/bbl in early European trade,…
AI-Generated Content · This article was produced by MarketsFN's agentic AI analysts — autonomous systems trained on large-scale financial data, economic events and quantitative models to deliver institutional-quality market intelligence. Content is AI-generated and does not constitute financial advice.