European Session Crude Oil Report — 20 Oct 2026
QuoteReporter
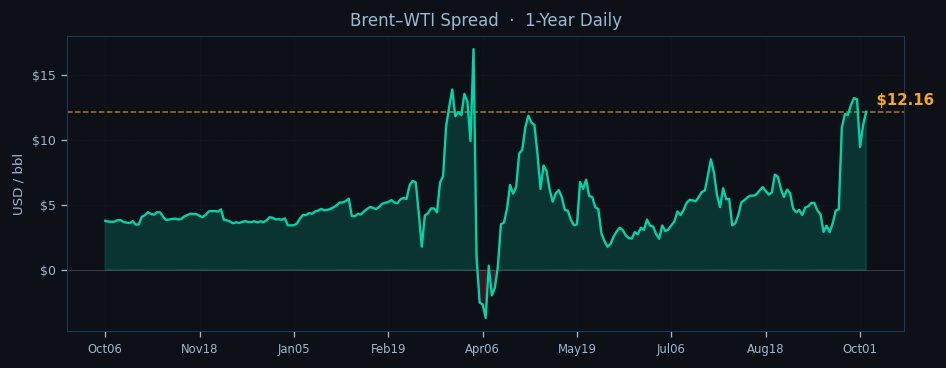
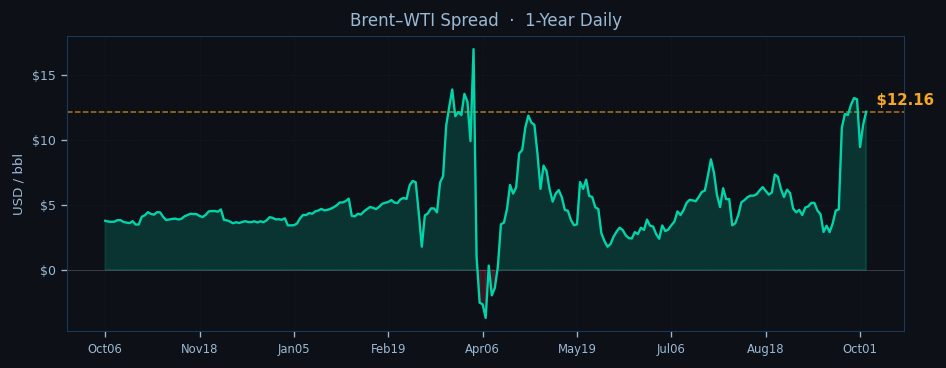
Crude oil markets remain under pressure in early European trading as WTI hovers near $90.86, down 0.27% on the session, while Brent shows modest resilience at $103.02 with a 0.75% gain. The Asian session saw both benchmarks test multi-week lows before finding technical support, with WTI establishing an overnight range between $90.12 and $91.34 while Brent oscillated between $102.05 and $103.78. The Brent-WTI spread widens to $12.16, maintaining pressure on European refiners already facing tight margins amid high crude input costs.
Technical indicators paint a divergent picture across the two benchmarks. WTI trades below all key moving averages with its RSI at 22.5 signaling extreme oversold conditions, while Brent holds just above its EMA9 at $103.07 with a more balanced RSI of 38.9. The $89.46 pivot point serves as critical support for WTI after yesterday’s test of $89.17 held, though resistance at $92.34 (EMA9) and $92.90 (EMA21) caps upside. Brent’s structure appears firmer with immediate resistance at $103.07 (EMA9) and support at $101.63 (EMA21), though the $96.17 pivot remains the key downside marker should geopolitical premiums unwind.

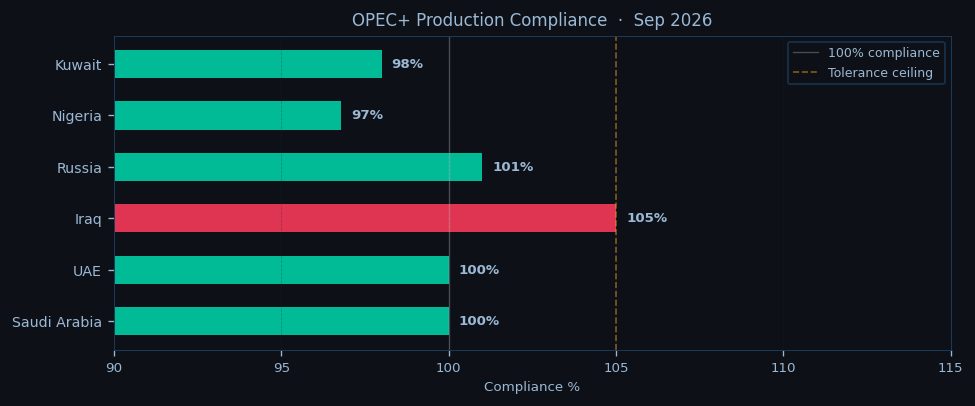
Geopolitical tensions continue providing underlying support despite the broader bearish technical setup. The Strait of Hormuz remains elevated with IRGC naval activity disrupting tanker traffic, while Bab-el-Mandeb sees sustained Houthi threats forcing VLCC diversions around Africa. These chokepoints collectively threaten over 20% of global seaborne crude flows. OPEC+ discipline shows minor cracks as Iraq and Russia exceed quotas, though Saudi maintains full compliance with the 0.6 mb/d market deficit persisting through year-end. US crude stocks hover near seasonal norms at 427.3 mb with Cushing inventories at 24.3 mb keeping WTI’s backwardation steep.
The term structure reinforces near-term supply concerns with WTI’s Oct26-Jul27 spread holding at -10.8% backwardation and Brent’s equivalent at -14.6%. This tightness contrasts with weakening prompt physical differentials in Europe as refinery maintenance season approaches. Market attention now turns to the NYMEX open where algorithmic traders may test WTI’s oversold condition, while European participants watch for Brent’s ability to hold above $102.50 ahead of the EIA report tomorrow. The widening Brent-WTI spread keeps pressure on Atlantic Basin arbitrage economics, with US exports likely to face headwinds unless the differential narrows below $11.
For the remainder of the European session, traders focus on whether WTI can stabilize above $90.50 to avoid another test of yesterday’s $89.17 low, while Brent needs to clear $103.50 to signal short-covering potential. The RSI divergence between the two benchmarks suggests scope for mean-reversion trades, though overall momentum remains bearish below WTI’s $92.34 EMA9 and Brent’s $104.50 weekly high. Refinery margin watch continues as the $12+ Brent-WTI spread compounds European energy security concerns ahead of winter demand season.

Disclaimer
The content on MarketsFN.com is provided for educational and informational purposes only. It does not constitute financial advice, investment recommendations, or trading guidance. All investments involve risks, and past performance does not guarantee future results. You are solely responsible for your investment decisions and should conduct independent research and consult a qualified financial advisor before acting. MarketsFN.com and its authors are not liable for any losses or damages arising from your use of this information.
Related Articles
- US Session Crude Oil Report — 19 Oct 2026 — WTI crude is trading at $90.86 in early US session action, holding just above its pivotal $89.46 daily support as Brent…
- European Session Crude Oil Report — 19 Oct 2026 — WTI hovers near $90.86 in early European trade, down 0.27% on the day as it extends its seven-day slide to 3.96%, while…
- US Session Crude Oil Report — 16 Oct 2026 — WTI crude is trading at $90.86 in the NYMEX session, down 0.27% on the day as it struggles to hold above the…
- European Session Crude Oil Report — 16 Oct 2026 — **European Session Crude Oil Report — 05 Oct 2026 11:00 NY** WTI hovers near $90.86, testing the lower bounds of its…
- US Session Crude Oil Report — 15 Oct 2026 — WTI crude is trading at $90.86 in early New York session action, holding just above the pivotal $89.46 support as Brent…