European Session Crude Oil Report — 27 Oct 2026
QuoteReporter
Crude oil markets hover near multi-week lows in the European session as WTI struggles below $91 while Brent holds above $103, with both benchmarks extending their technical downtrends amid persistent demand concerns and mixed supply signals. The Brent-WTI spread widens to $12.16, pressuring European refinery margins as arbitrage economics discourage Atlantic Basin crude flows. WTI tests its 50-day EMA at $90.23 with downside momentum accelerating – the RSI at 22.5 signals severely oversold conditions – while Brent’s RSI at 38.9 shows less extreme positioning despite trading flat against its 9-day EMA.
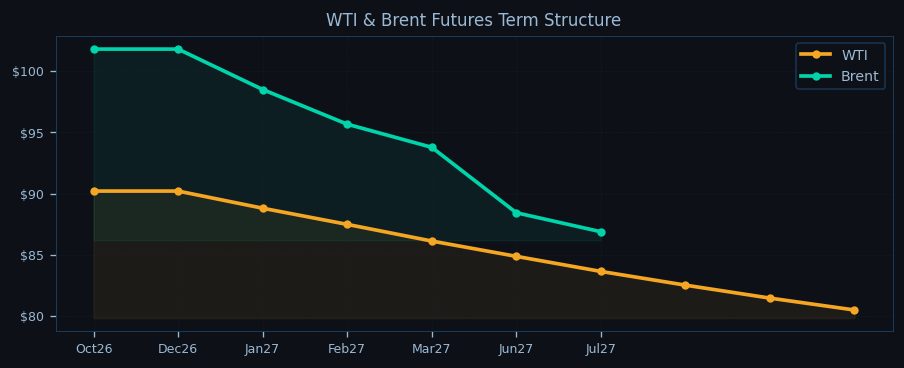
The technical landscape shows WTI breaking below all key moving averages as the 9-day EMA crosses bearishly under the 21-day at $92.34, with immediate support at the pivot point of $89.46 vulnerable given the steep backwardation in the WTI curve. Brent’s structure appears more resilient with the front month holding its 9-day EMA at $103.07, though the deeper 14.6% backwardation to July 2027 contracts signals tightening prompt supply. Both benchmarks trade near the lower Bollinger Band extremes, suggesting potential for a technical rebound if geopolitical risks escalate.

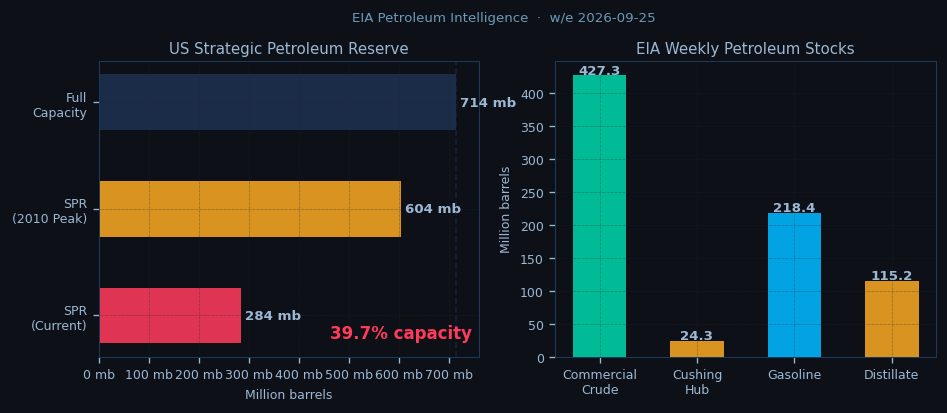
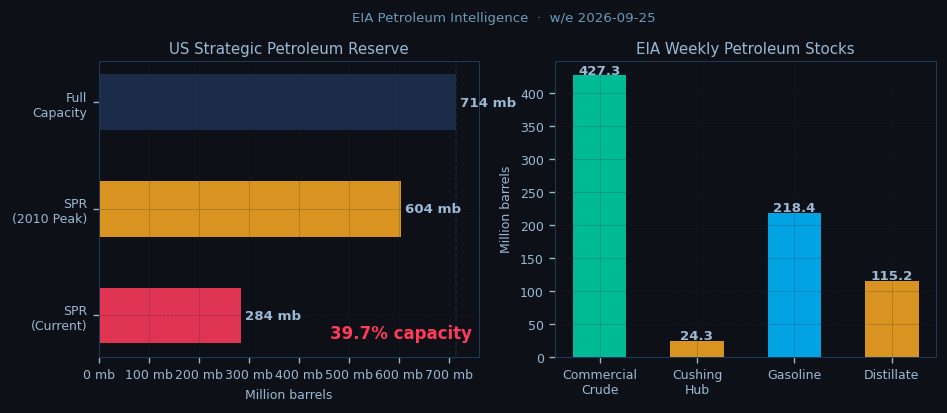
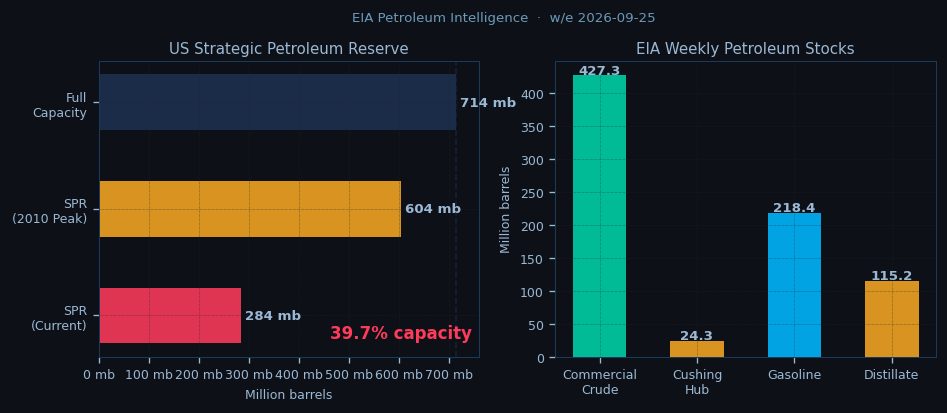
Geopolitical tensions simmer with Iranian Revolutionary Guard Corps naval activity disrupting Hormuz transits, while Houthi attacks force VLCCs to divert around Africa – adding $1-2 per barrel to freight costs. OPEC+ maintains production cuts through December 2026, but the 0.6 mb/d deficit versus call on OPEC fails to lift prices as US shale output holds near 13.95 mb/d and refinery utilization dips to 92.5%. Cushing inventories at 24.3 mb provide no immediate storage squeeze, though backwardation suggests physical tightness persists. The EIA’s 427.3 mb commercial stockpile leaves ample buffer for now.
The term structure tells diverging tales – WTI’s 10.8% backwardation to July 2027 reflects softer long-term US demand expectations, while Brent’s steeper 14.6% drop signals stronger European appetite for prompt barrels. The widening Brent-WTI spread now tests the upper bounds of its 12-month range, incentivizing US crude exports but straining European refiners reliant on Brent-linked feedstocks.
As New York open approaches, traders eye whether WTI can defend $89.46 pivot support ahead of potential algorithmic buying at RSI extremes. Brent faces resistance at its 9-day EMA, with upside capped unless the spread narrows toward $10. All eyes remain on Hormuz and Bab-el-Mandeb transit risks – any escalation could trigger short-covering into the oversold conditions. The session’s key inflection points: WTI $89.46 (PP support) and Brent $103.07 (EMA9 resistance), with the spread dynamics likely dictating intraday direction as European refiners adjust procurement strategies.

Disclaimer
The content on MarketsFN.com is provided for educational and informational purposes only. It does not constitute financial advice, investment recommendations, or trading guidance. All investments involve risks, and past performance does not guarantee future results. You are solely responsible for your investment decisions and should conduct independent research and consult a qualified financial advisor before acting. MarketsFN.com and its authors are not liable for any losses or damages arising from your use of this information.
Related Articles
- Asian Session Crude Oil Report — 27 Oct 2026 — WTI crude hovers near $90.86 in early Asian trading, testing the lower bounds of its recent range as bearish momentum…
- US Session Crude Oil Report — 26 Oct 2026 — WTI crude holds near session lows at $90.86 as the US session struggles to find bullish momentum, testing the 200-day…
- European Session Crude Oil Report — 26 Oct 2026 — Crude oil markets enter the European session with WTI hovering near $90.86 while Brent holds above $103, as the complex…
- US Session Crude Oil Report — 23 Oct 2026 — WTI crude is trading at $90.86 in early New York trading, holding just above the pivotal $89.46 support as Brent tests…
- European Session Crude Oil Report — 23 Oct 2026 — Crude oil markets remain under pressure in the European session as WTI hovers near $90.86, down 0.27% on the day, while…