Nasdaq 100 2026 YTD Highs & Lows Radar: AMGEN (AMGN), Astrazeneca ADR (AZN) and more
MarketsFN Team

Nasdaq 100 2026 YTD Highs & Lows Radar: AMGEN (AMGN), Astrazeneca ADR (AZN) and more
Screening all 101 Nasdaq 100 constituents for stocks nearest to their 2026 year-to-date high and their 2026 YTD low. Data as of August 14, 2026. % Realized = total return since Jan 1 2026.
Legend: RSI > 70 = overbought · RSI < 30 = oversold · Green % Realized = positive YTD return · Red = negative.
📈 Nearest to 2026 High
Sectors represented: Technology (3), Healthcare (1), Consumer Cyclical (1)
| Ticker | Company | Sector | Price Last | % Realized | 2026 YTD High Date | RSI | % above MA200 | Trend |
|---|---|---|---|---|---|---|---|---|
| AMGN | AMGEN Inc | Healthcare | $417.84 | +27.53% | 2026-08-13 | 66.7 | +19.6% | Above MA20, MA50, MA200 |
| PANW | Palo Alto Networks Inc | Technology | $396.00 | +120.77% | 2026-08-13 | 70.7 | +78.0% | Above MA20, MA50, MA200 |
| ADP | Automatic Data Processing Inc | Technology | $276.23 | +9.23% | 2026-08-13 | 63.1 | +17.4% | Above MA20, MA50, MA200 |
| CRWD | Crowdstrike Holdings Inc | Technology | $225.53 | +98.89% | 2026-08-13 | 67.6 | +64.4% | Above MA20, MA50, MA200 |
| SBUX | Starbucks Corp | Consumer Cyclical | $108.55 | +29.27% | 2026-08-13 | 60.1 | +13.1% | Above MA20, MA50, MA200 |
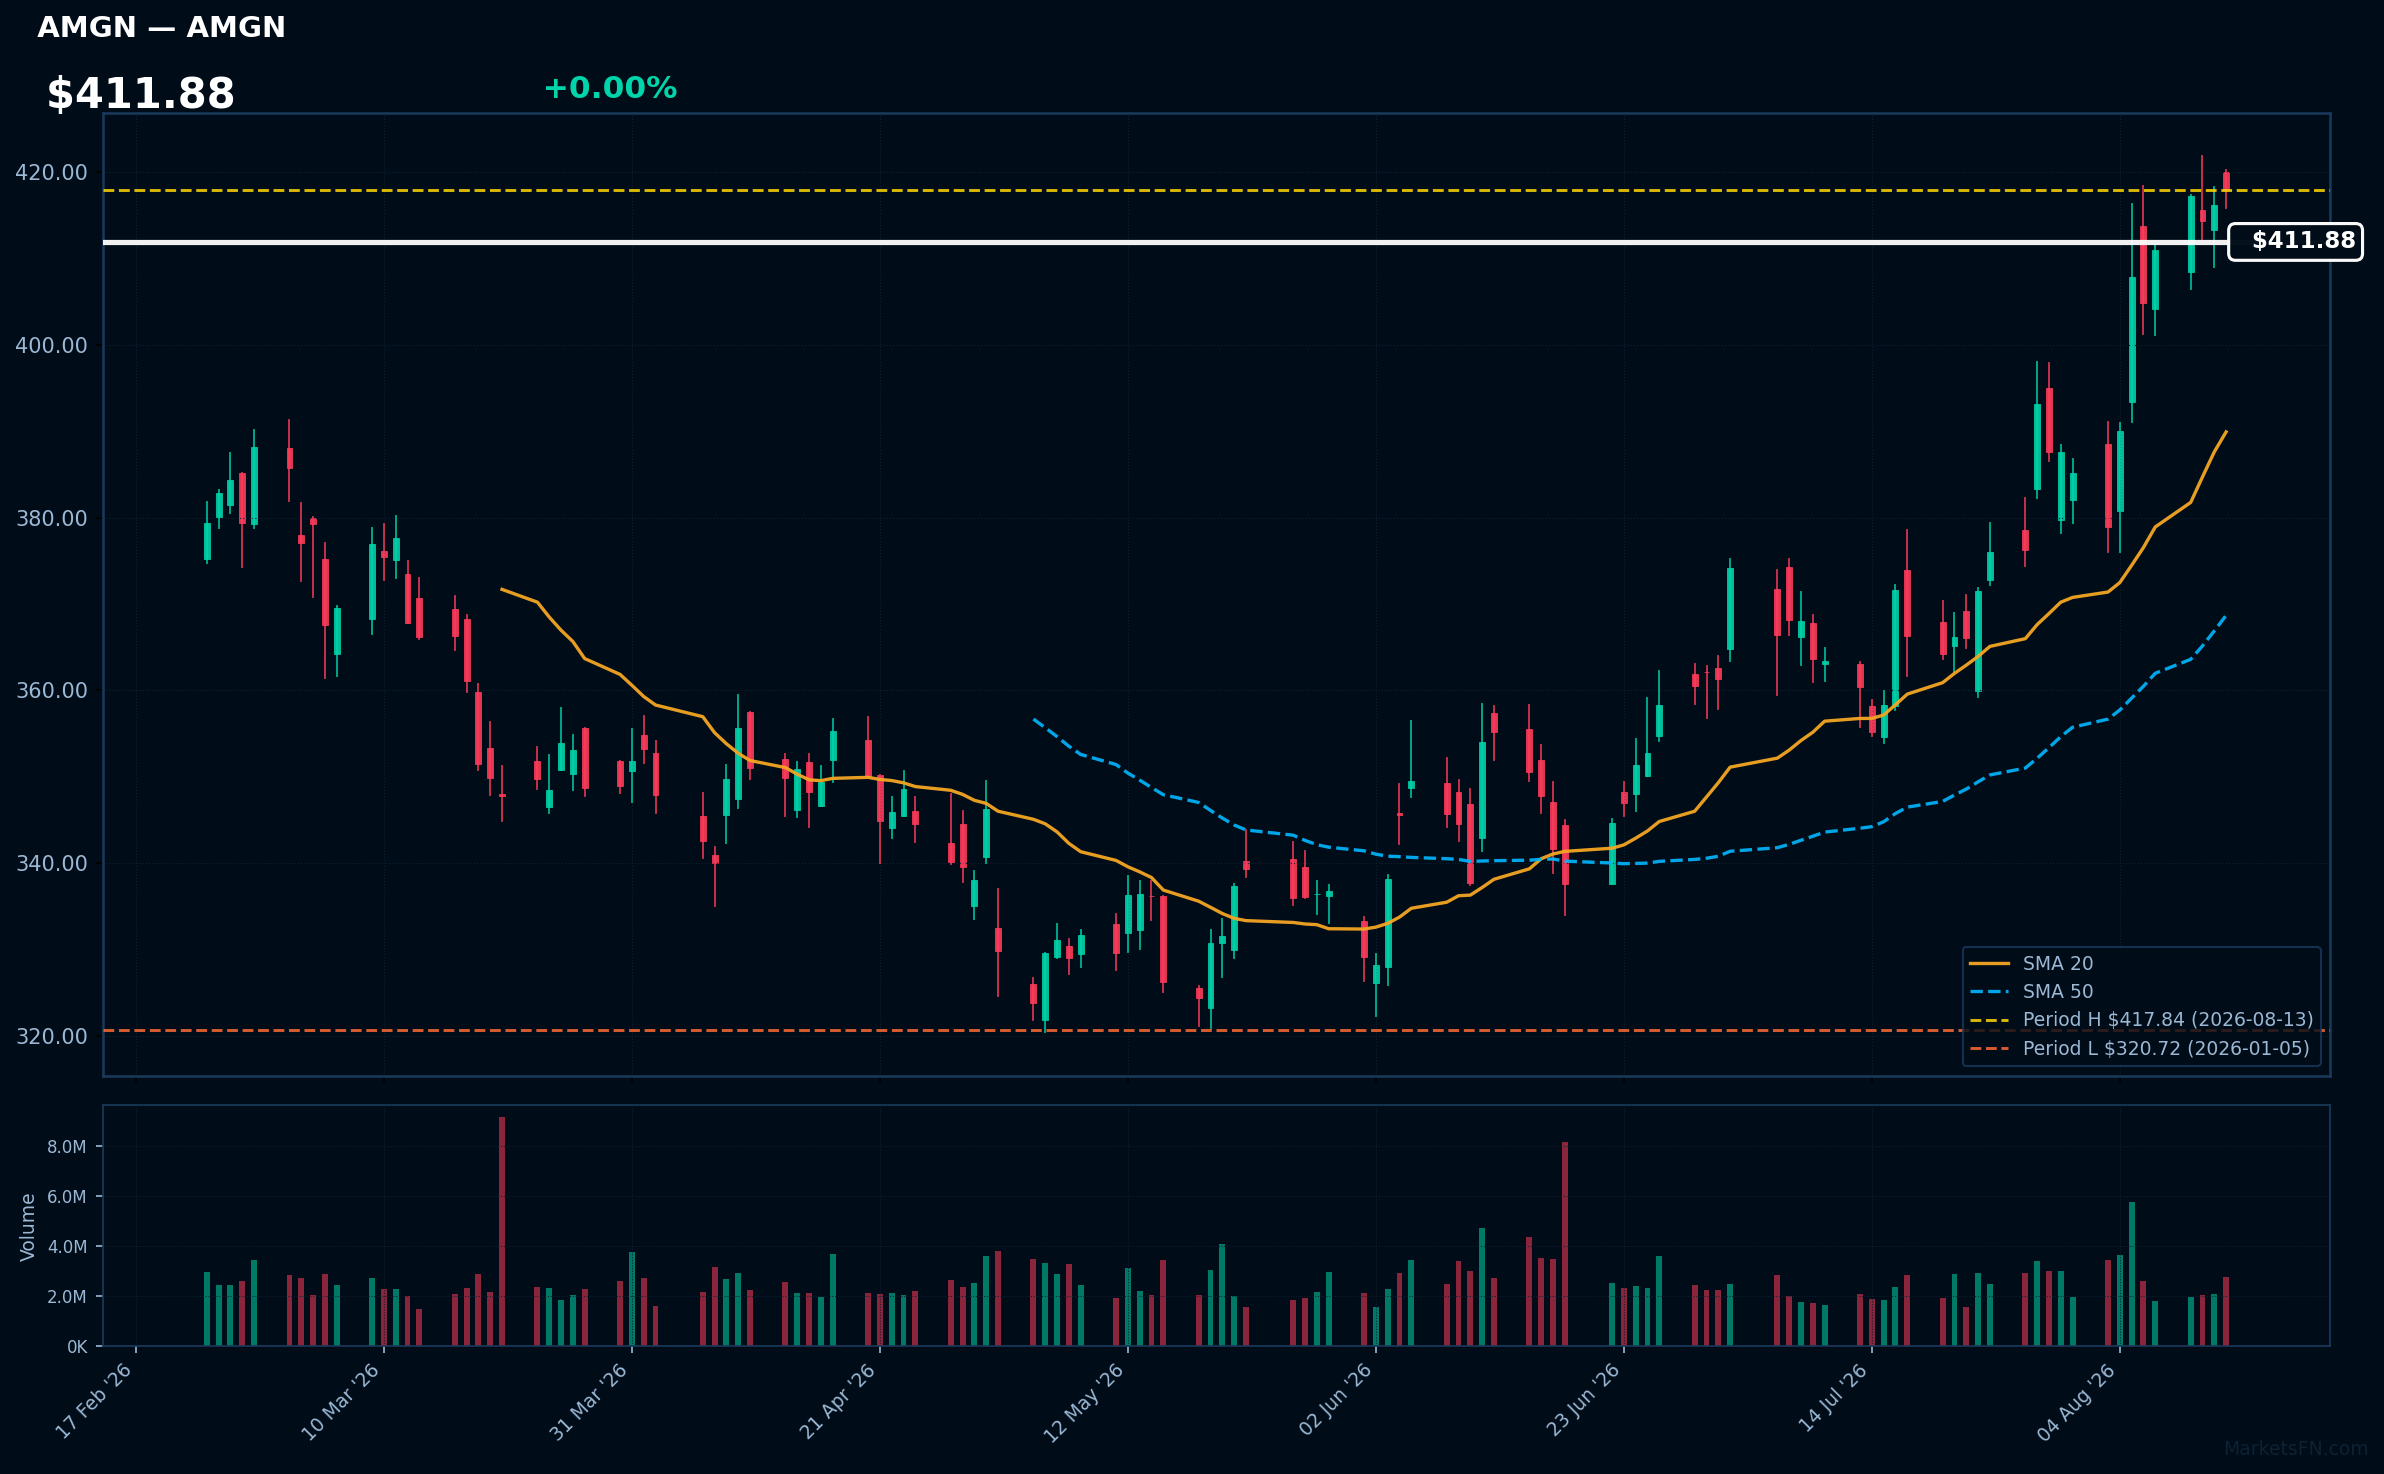
AMGN | AMGEN Inc | Healthcare | Price Last: $417.84 | % Realized: +27.53% | RSI: 66.7 | % above MA200: +19.6% | Trend: Above MA20, MA50, MA200
AMGEN Inc (AMGN) is a biotechnology company focused on developing innovative therapies for serious illnesses, particularly in oncology and cardiovascular diseases. Investors should care due to its strong pipeline and potential for significant market impact, driving long-term growth and profitability.
AMGN shows bullish momentum with an RSI(14) of 66.7 and a strong MA alignment: price > MA20 > MA50 > MA200. The stock is 0.0% below its 2026 YTD high, indicating a potential breakout level.
Related headlines
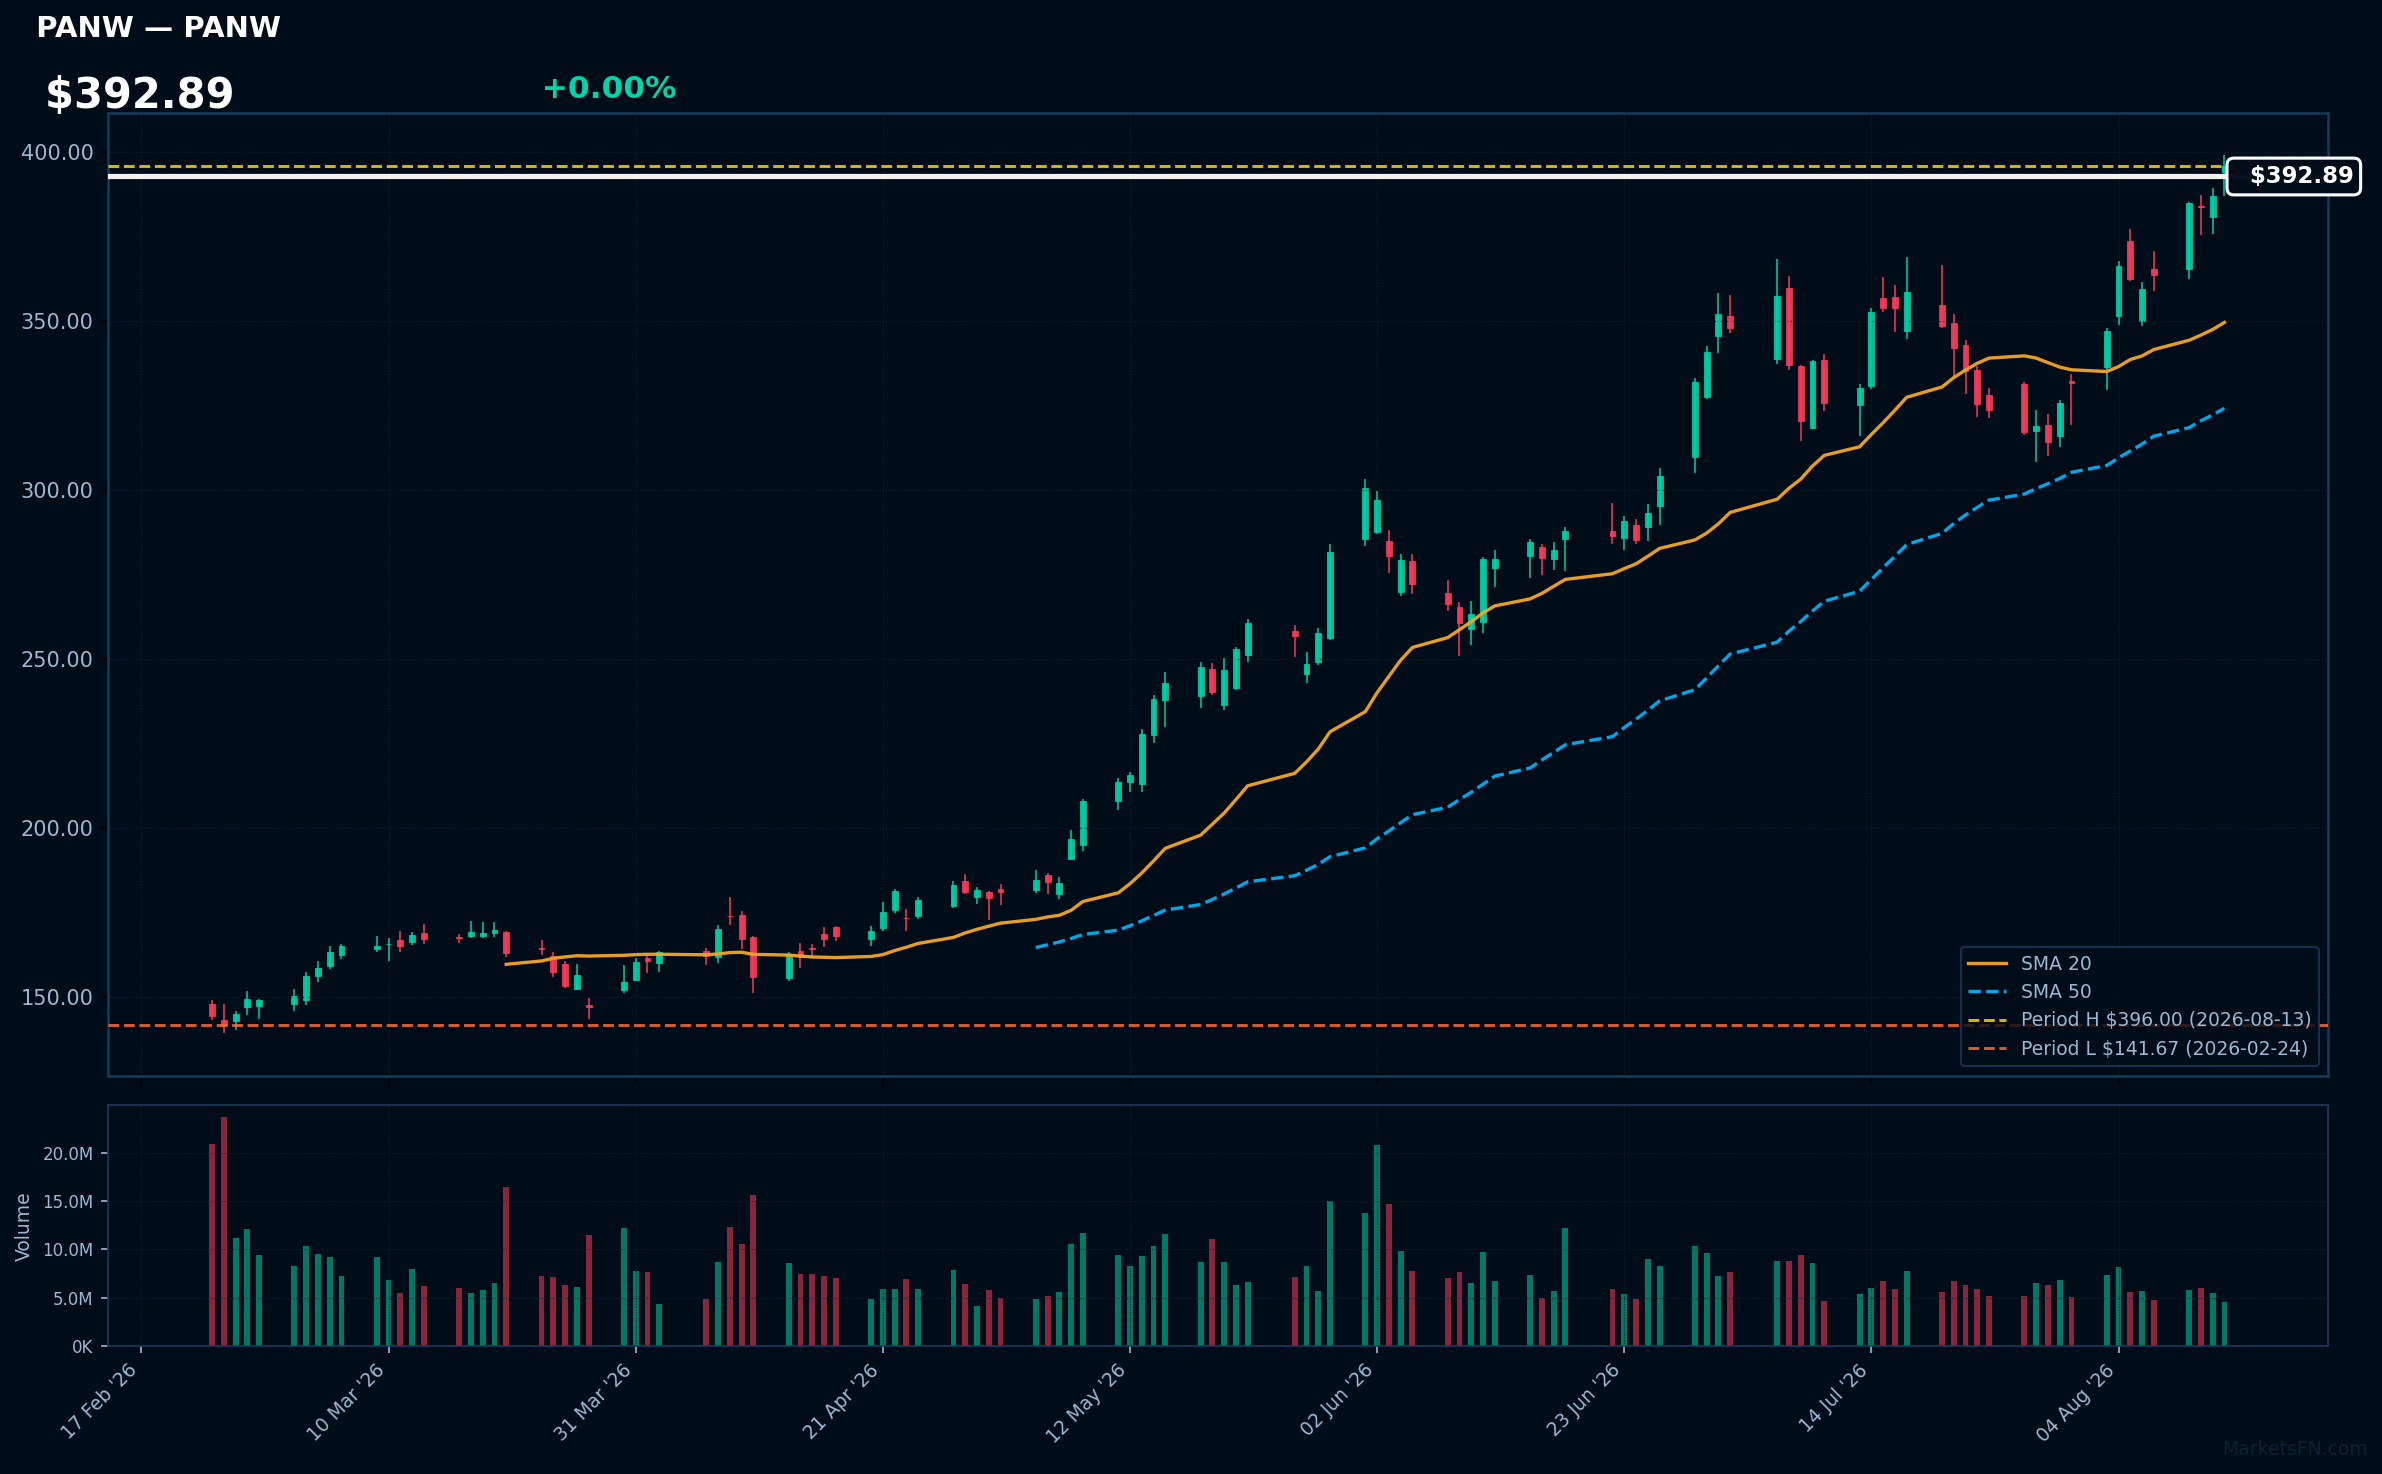
PANW | Palo Alto Networks Inc | Technology | Price Last: $396.00 | % Realized: +120.77% | RSI: 70.7 | % above MA200: +78.0% | Trend: Above MA20, MA50, MA200
Palo Alto Networks Inc specializes in cybersecurity solutions, providing advanced firewalls and cloud-based security services. Investors should care due to the increasing demand for cybersecurity amid rising digital threats, positioning the company for sustained growth and market relevance.
The current technical situation shows bullish momentum with an RSI(14) of 70.7 and a strong MA alignment: price > MA20 > MA50 > MA200. The stock is 0.0% below its 2026 YTD high, indicating a potential breakout.
Related headlines
- Dan Niles Says Workday Deal Could Put A Floor Under Software Stocks Palo Alto CEO Says AI Is No 'Existential Threat' To Cybersecurity
- Why Did PANW, NET, HPQ Stocks Jump To 52-Week Highs Today?
- Why Did PANW, SNOW, EAT Stocks Surge To 52-Week Highs Today?
- Palo Alto Networks Stock Ran On A Threat That Management Had Already Named
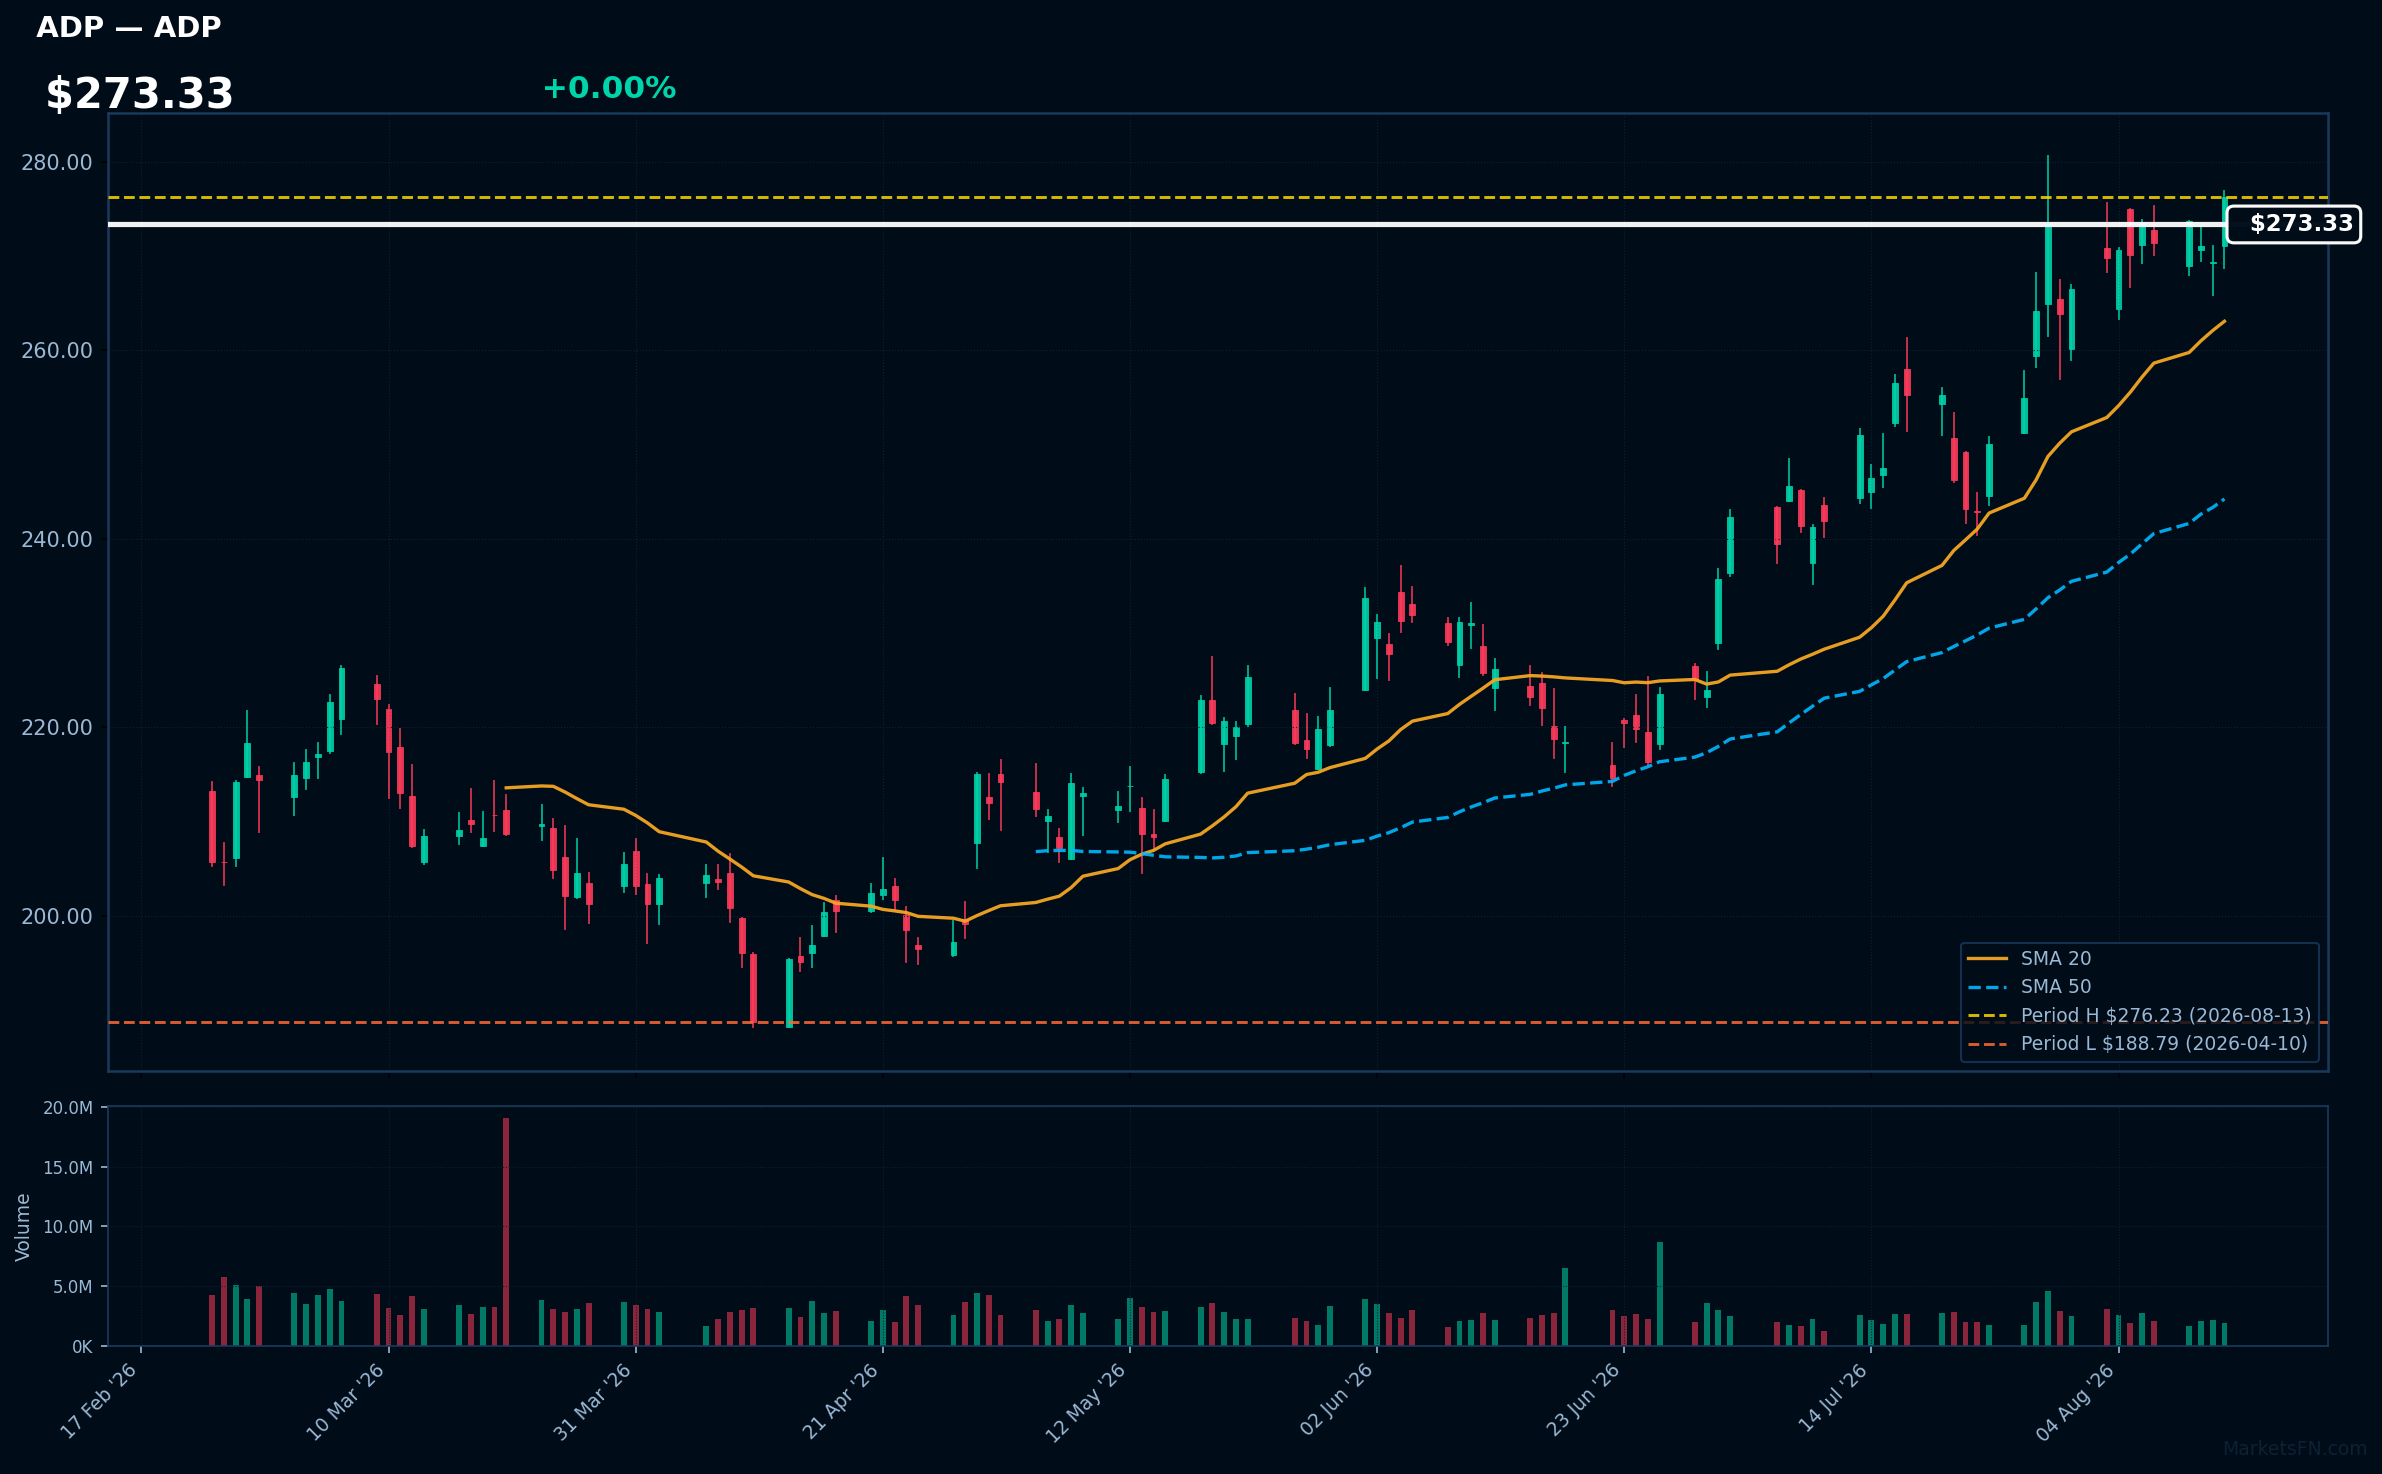
ADP | Automatic Data Processing Inc | Technology | Price Last: $276.23 | % Realized: +9.23% | RSI: 63.1 | % above MA200: +17.4% | Trend: Above MA20, MA50, MA200
Automatic Data Processing Inc (ADP) provides payroll and human capital management solutions, enabling businesses to streamline workforce management and compliance. Investors should care due to its strong market position and consistent demand for its services, which can drive revenue growth.
The current technical situation indicates bullish momentum, with an RSI(14) of 63.1 and a bullish MA alignment: price > MA20 > MA50 > MA200. The stock is also 0.0% below its 2026 YTD high, suggesting a potential breakout.
Related headlines
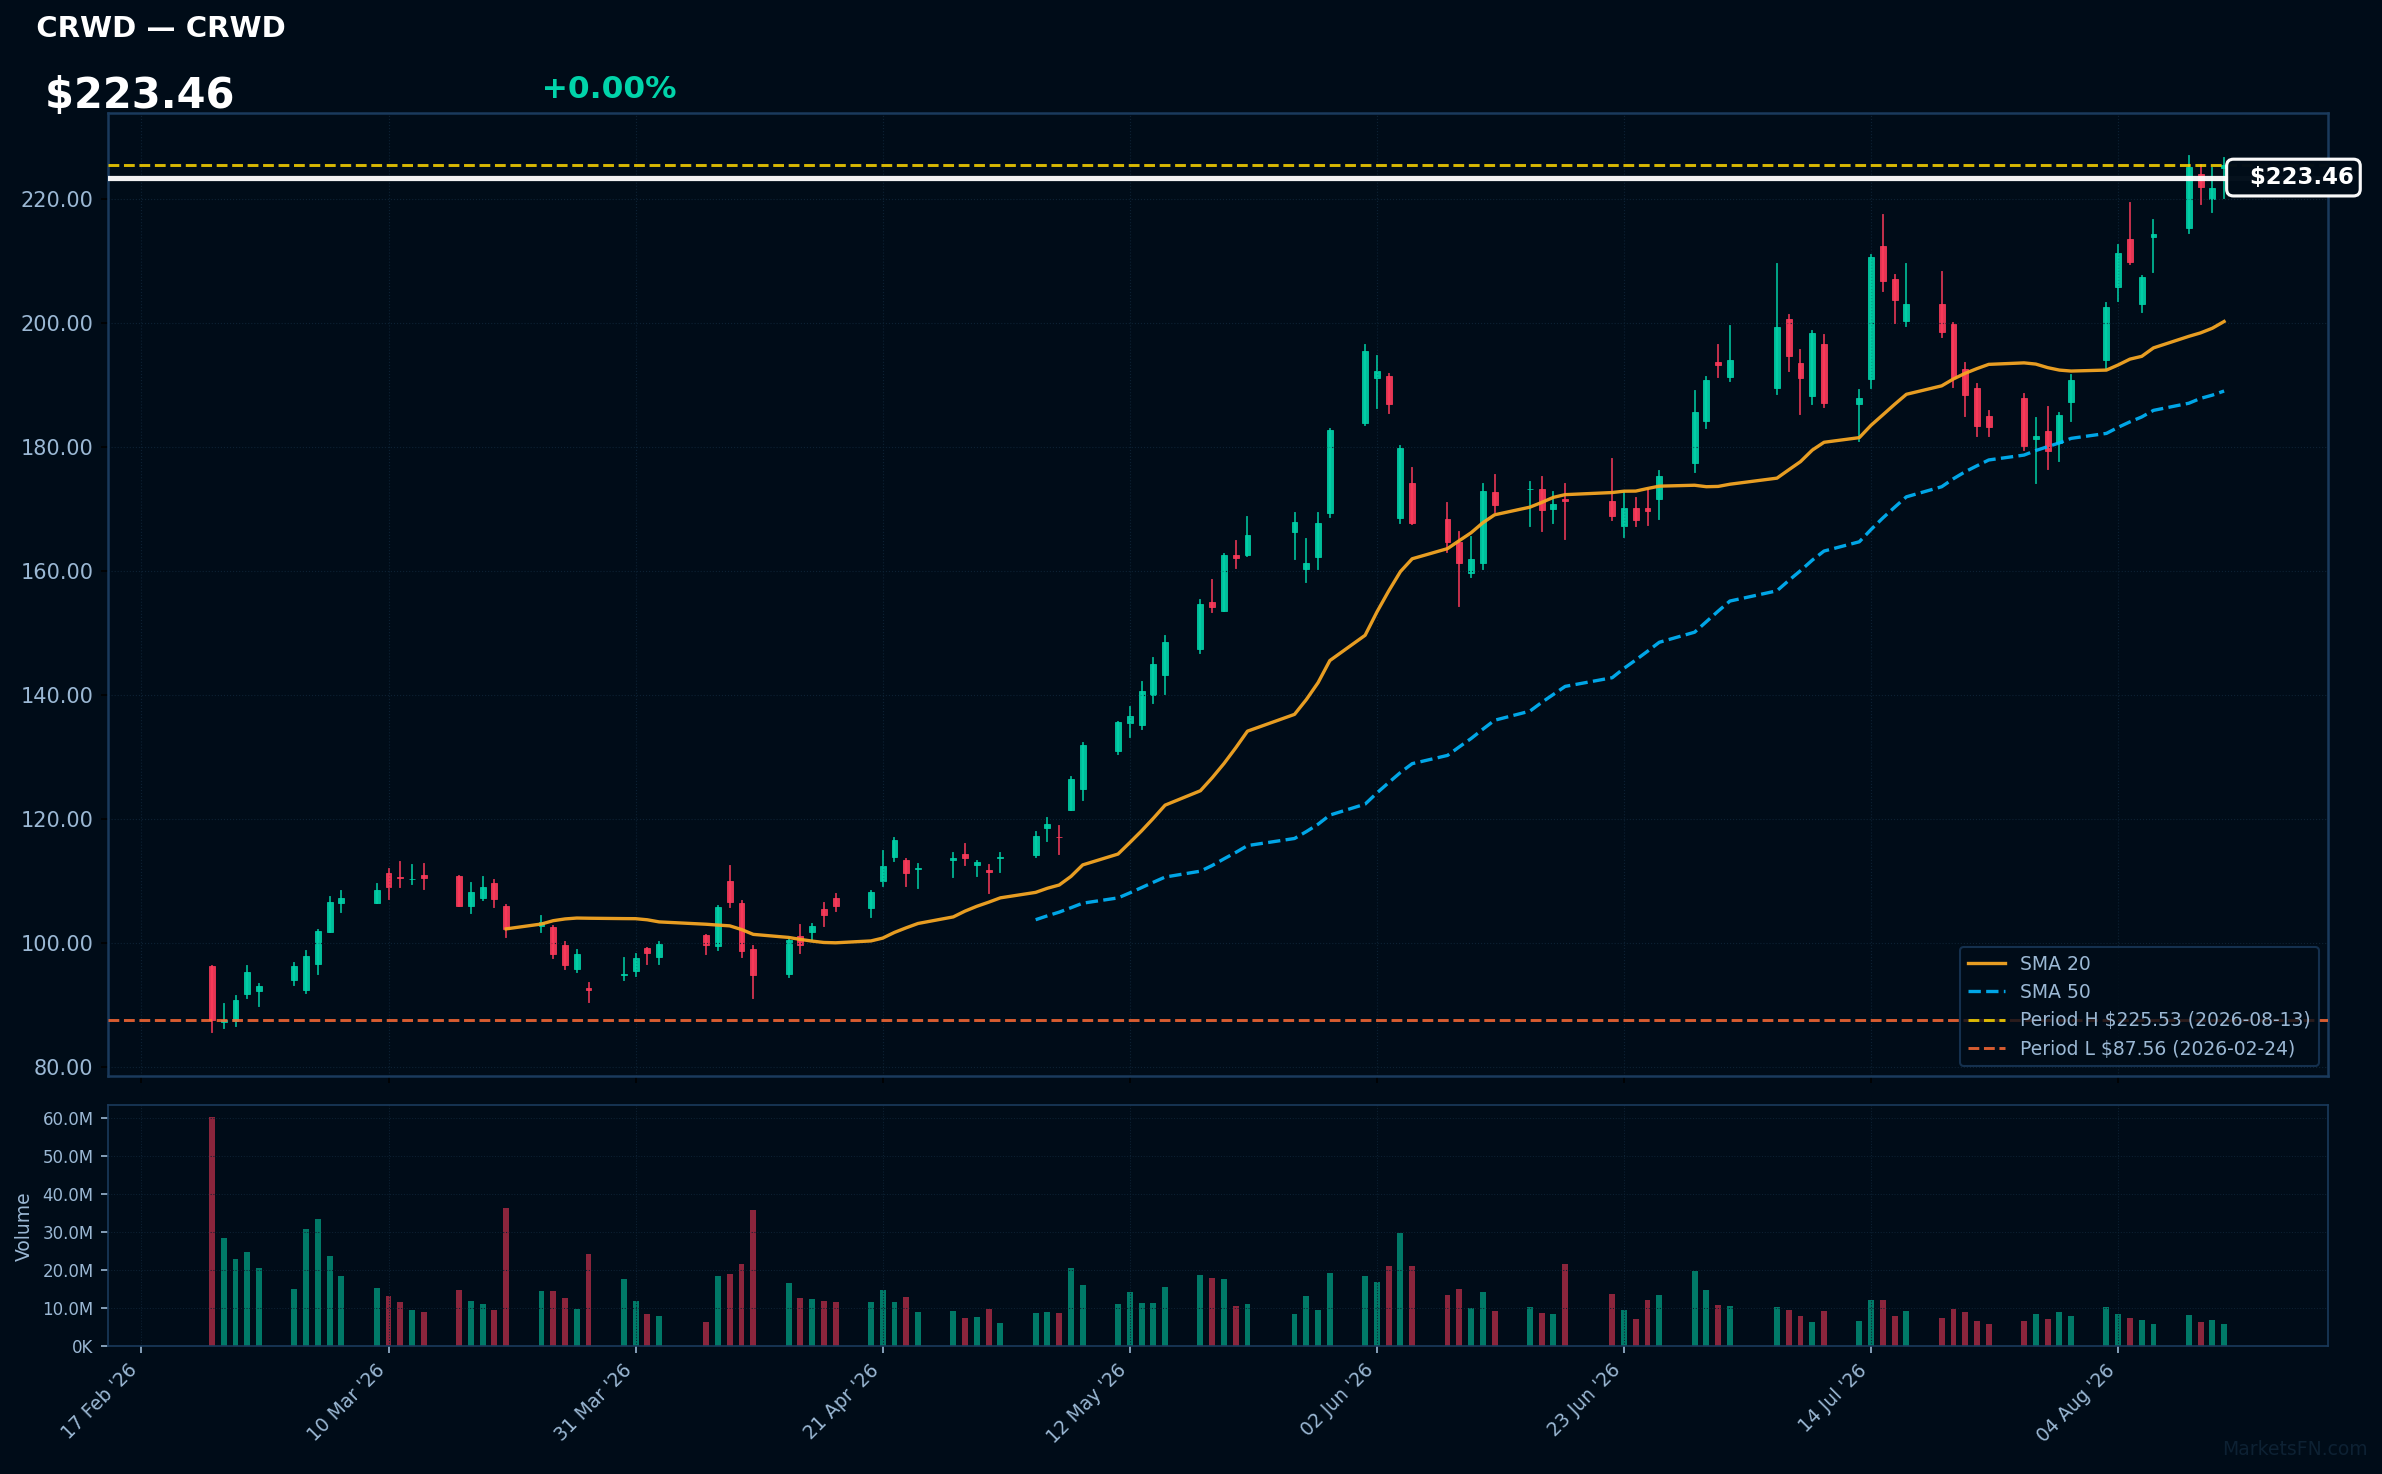
CRWD | Crowdstrike Holdings Inc | Technology | Price Last: $225.53 | % Realized: +98.89% | RSI: 67.6 | % above MA200: +64.4% | Trend: Above MA20, MA50, MA200
Crowdstrike Holdings Inc specializes in cybersecurity solutions, providing cloud-delivered endpoint protection and threat intelligence. Investors should care due to its innovative approach to combating cyber threats, which is increasingly critical as digital transformation accelerates across industries.
The current technical situation shows bullish momentum with an RSI(14) of 67.6 and a strong MA alignment: price > MA20 > MA50 > MA200. The stock is 0.0% below its 2026 YTD high, indicating a potential breakout.
Related headlines
- CrowdStrike Expands Project QuiltWorks to SMBs, Extending Frontier AI Risk Protection to Organizations of Every Size
- Top Research Reports for Meta, Texas Instruments & CrowdStrike
- CrowdStrike Stock's Surge Showed Up In Its Bookings Two Reports Early
- CrowdStrike Named a Leader in the 2026 IDC MarketScape for MDR/MXDR for the Enterprise Vendor Assessment
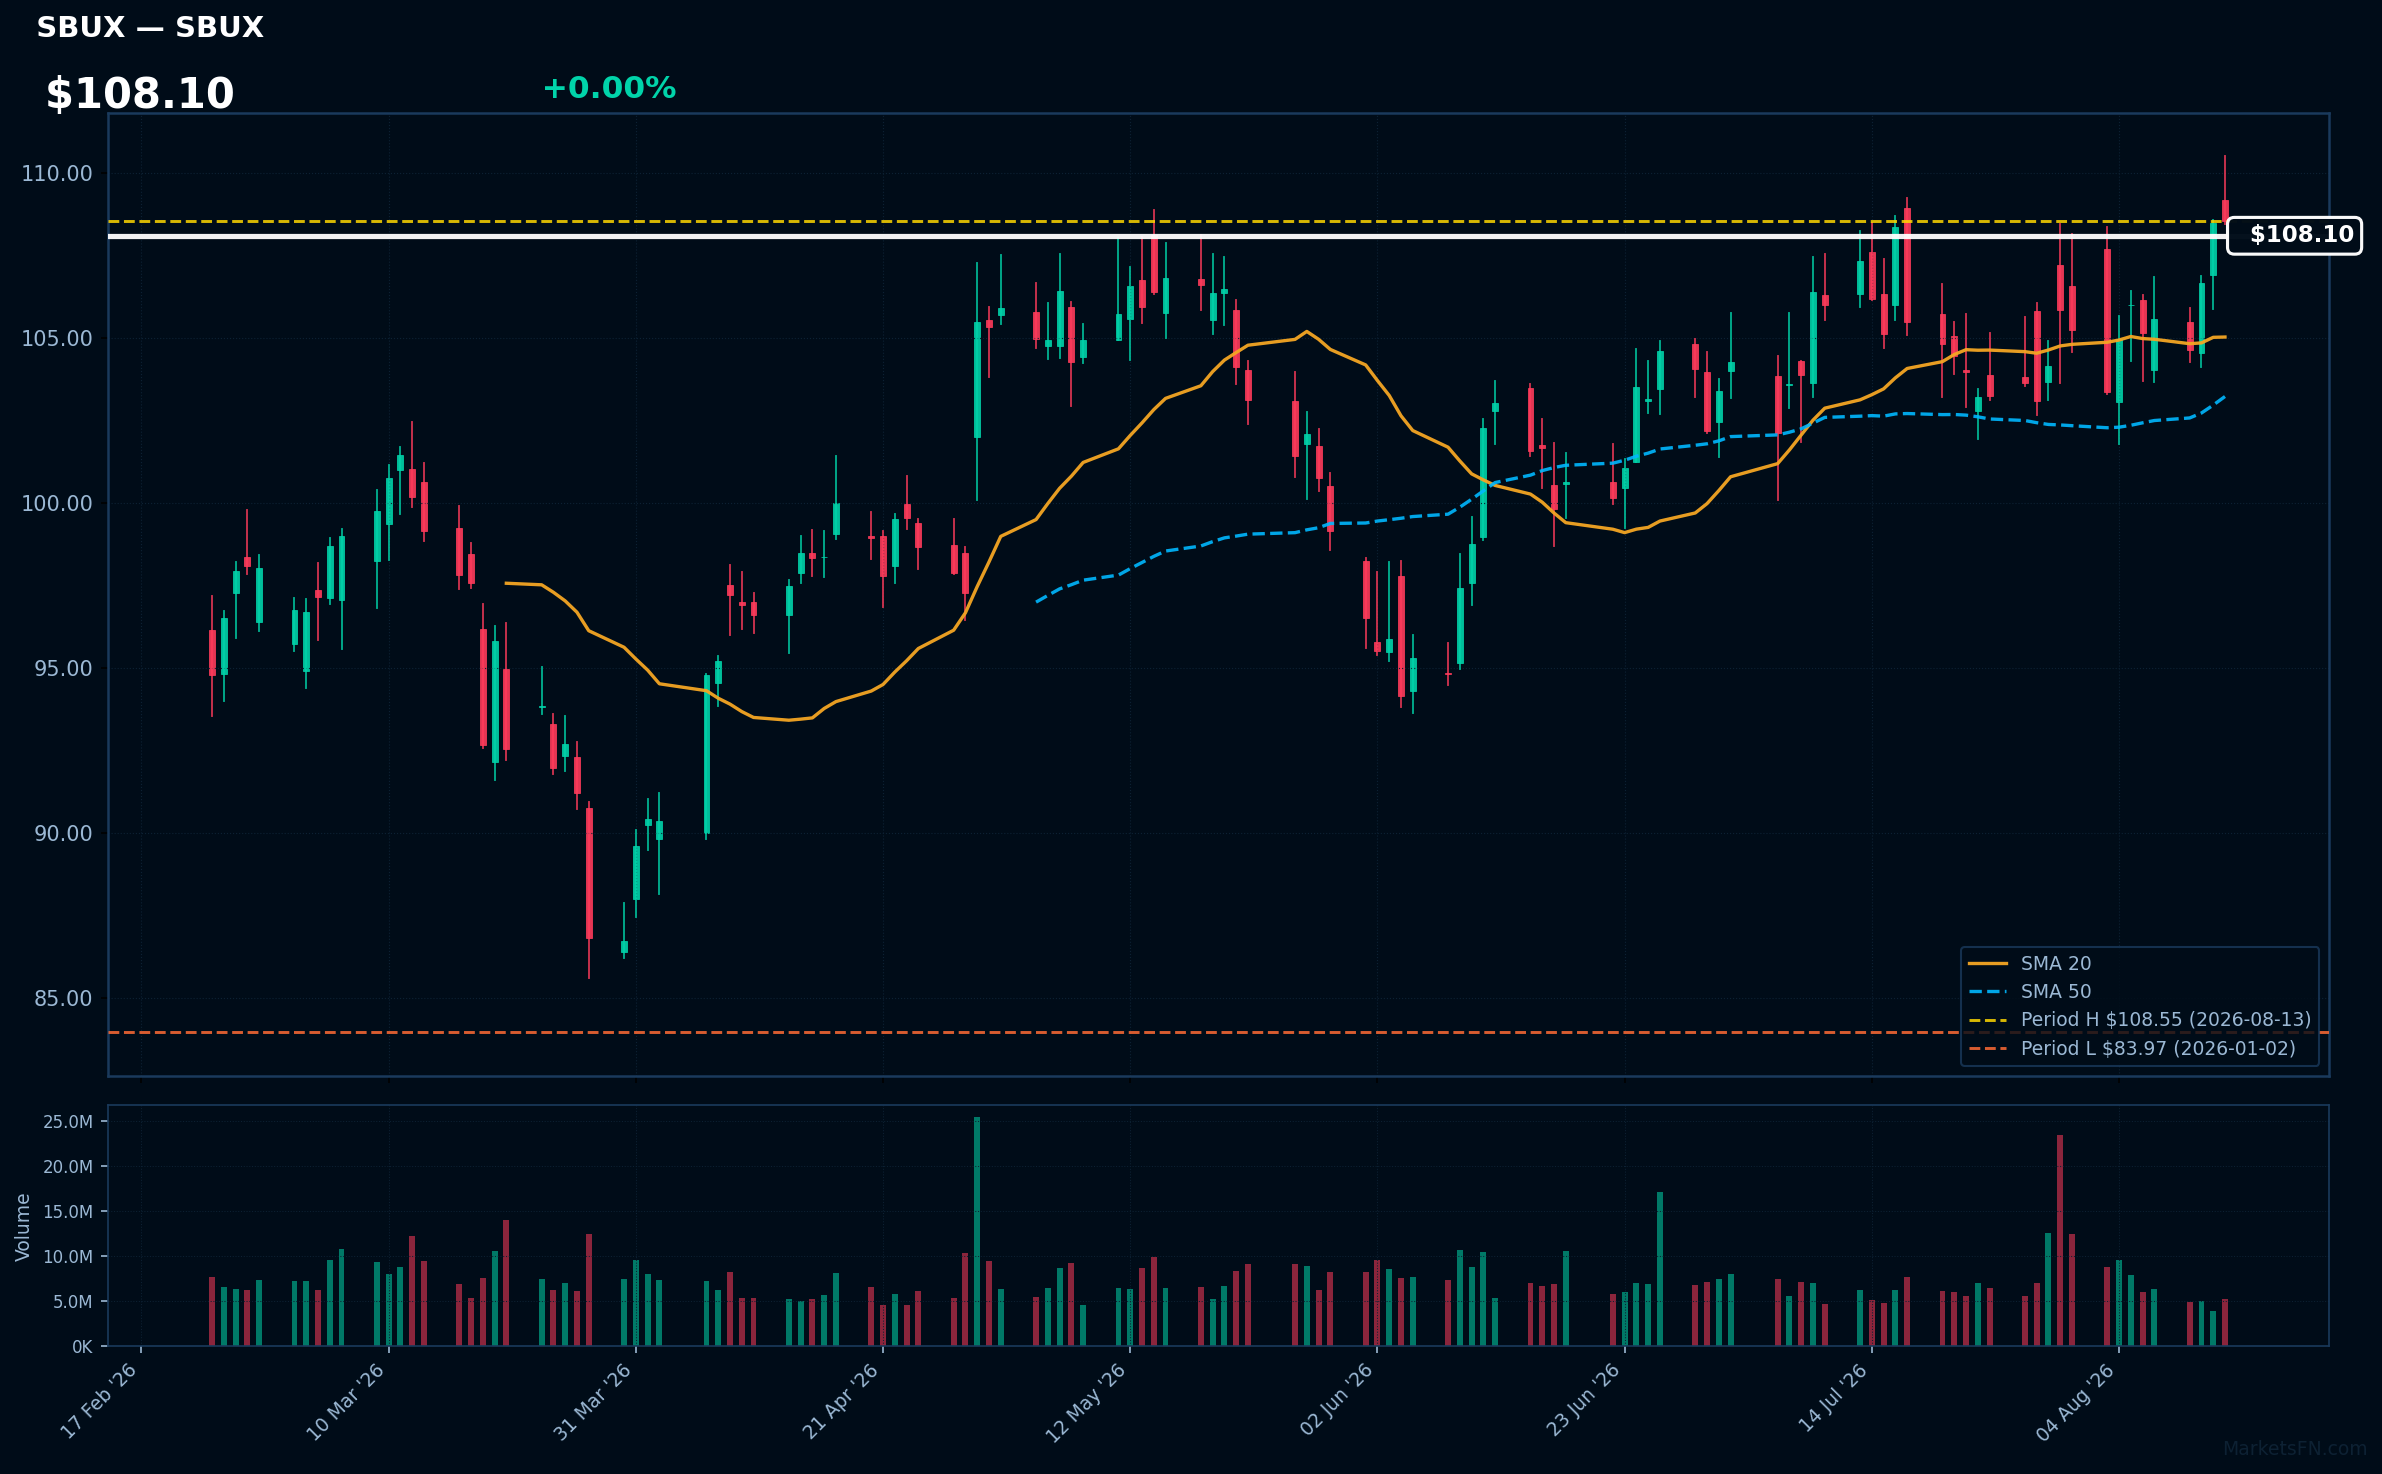
SBUX | Starbucks Corp | Consumer Cyclical | Price Last: $108.55 | % Realized: +29.27% | RSI: 60.1 | % above MA200: +13.1% | Trend: Above MA20, MA50, MA200
Starbucks Corp (SBUX) operates a global chain of coffeehouses, offering premium coffee, beverages, and food items. Investors should care due to its strong brand loyalty, consistent revenue growth, and expansion strategies that position it well in the competitive beverage market.
Starbucks shows bullish momentum with an RSI(14) of 60.1 and a strong MA alignment: price > MA20 > MA50 > MA200. The stock is 0.0% below its 2026 YTD high, indicating potential for a breakout.
Related headlines
📉 Nearest to 2026 Low
Sectors represented: Consumer Defensive (2), Healthcare (1), Communication Services (1), Utilities (1)
| Ticker | Company | Sector | Price Last | % Realized | 2026 YTD Low Date | RSI | % above MA200 | Trend |
|---|---|---|---|---|---|---|---|---|
| AZN | Astrazeneca plc ADR | Healthcare | $157.24 | -14.14% | 2026-08-04 | 33.5 | -14.7% | Below MA20, MA50, MA200 |
| MNST | Monster Beverage Corp | Consumer Defensive | $46.68 | -38.71% | 2026-08-11 | 12.0 | -42.2% | Below MA20, MA50, MA200 |
| APP | Applovin Corp | Communication Services | $312.67 | -49.43% | 2026-08-12 | 31.8 | -38.5% | Below MA20, MA50, MA200 |
| PEP | PepsiCo Inc | Consumer Defensive | $140.62 | -1.13% | 2026-07-23 | 53.6 | -5.7% | Above MA20, MA50 · Below MA200 |
| EXC | Exelon Corp | Utilities | $45.60 | +3.83% | 2026-01-12 | 48.5 | -1.0% | Below MA20, MA50, MA200 |
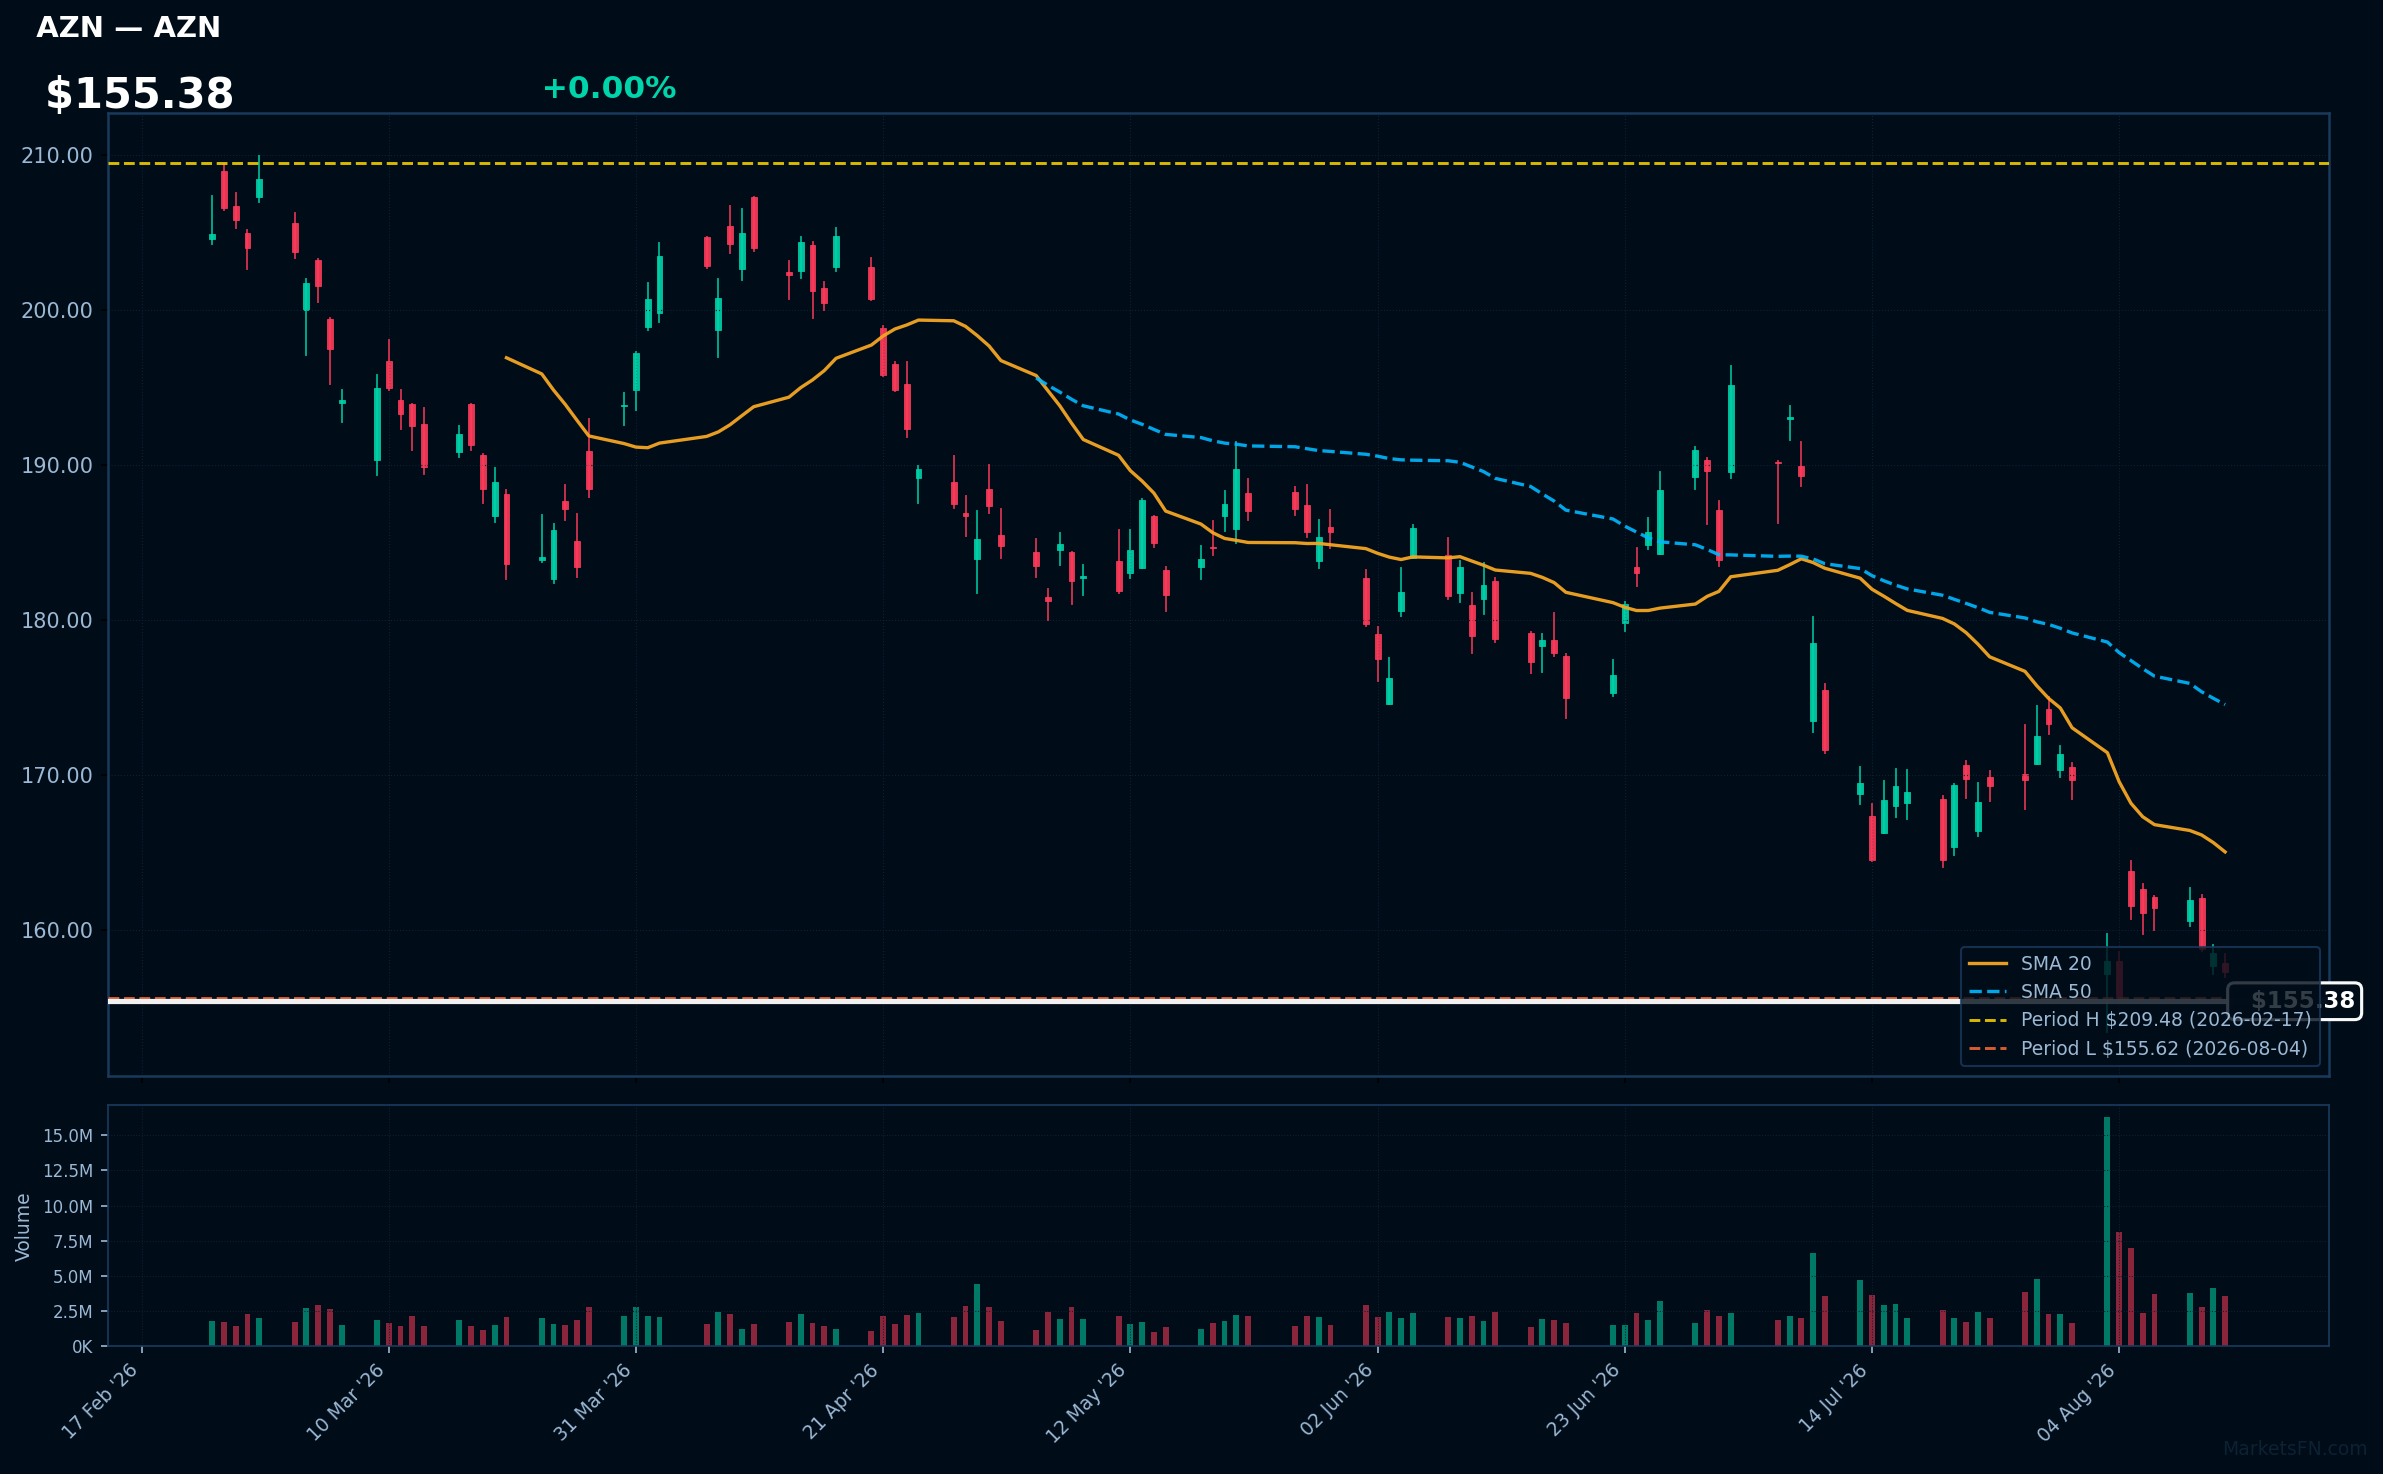
AZN | Astrazeneca plc ADR | Healthcare | Price Last: $157.24 | % Realized: -14.14% | RSI: 33.5 | % above MA200: -14.7% | Trend: Below MA20, MA50, MA200
Astrazeneca plc ADR is a global biopharmaceutical company focused on the discovery, development, and commercialization of prescription medicines, particularly in oncology, cardiovascular, and respiratory diseases. Investors should care due to its significant role in addressing critical health challenges and potential for growth in these therapeutic areas.
The current technical situation indicates a bearish trend, with an RSI(14) of 33.5 and a MA alignment showing price < MA20 < MA50 < MA200. The stock is also testing major support, being only 1.0% above its 2026 YTD low.
Related headlines
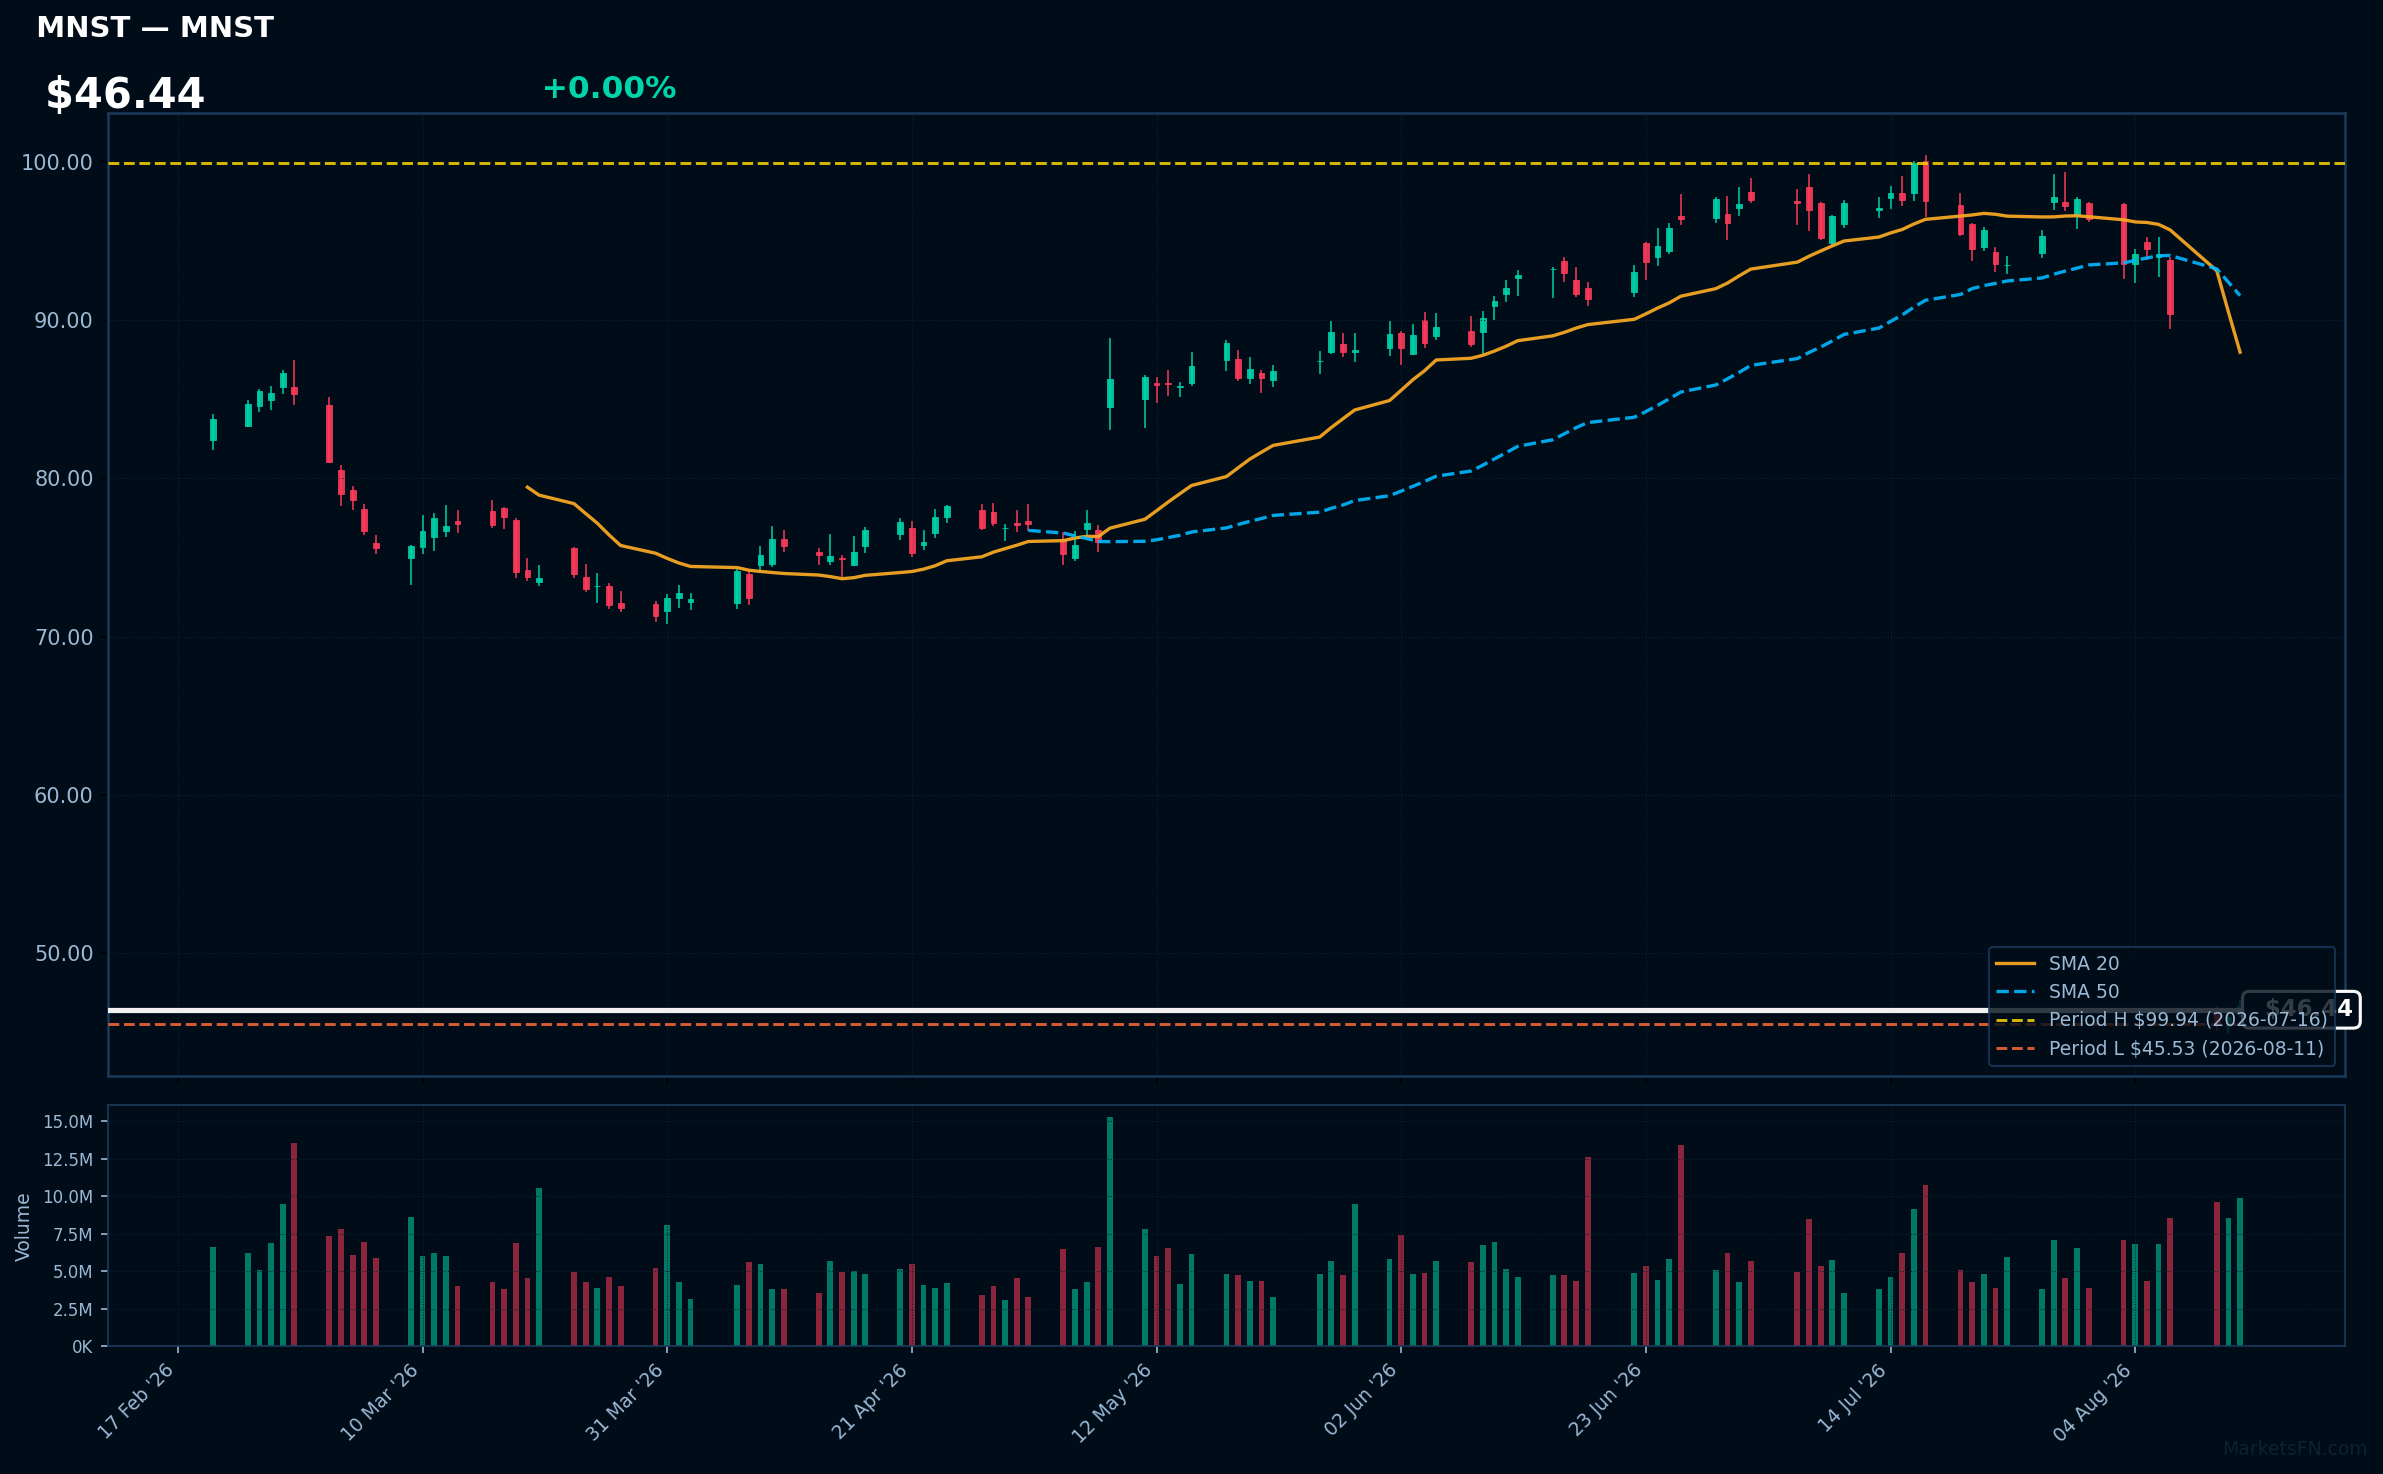
MNST | Monster Beverage Corp | Consumer Defensive | Price Last: $46.68 | % Realized: -38.71% | RSI: 12.0 | % above MA200: -42.2% | Trend: Below MA20, MA50, MA200
Monster Beverage Corp (MNST) specializes in energy drinks, offering a diverse portfolio that includes energy shots and non-carbonated beverages. Investors should care due to its significant market presence and potential for growth in the expanding energy drink sector.
The current technical situation shows a warning sign with an RSI(14) of 12.0, indicating oversold conditions, and mixed signals as the stock is below MA20/MA50/MA200, testing major support just 2.5% above its 2026 YTD low.
Related headlines
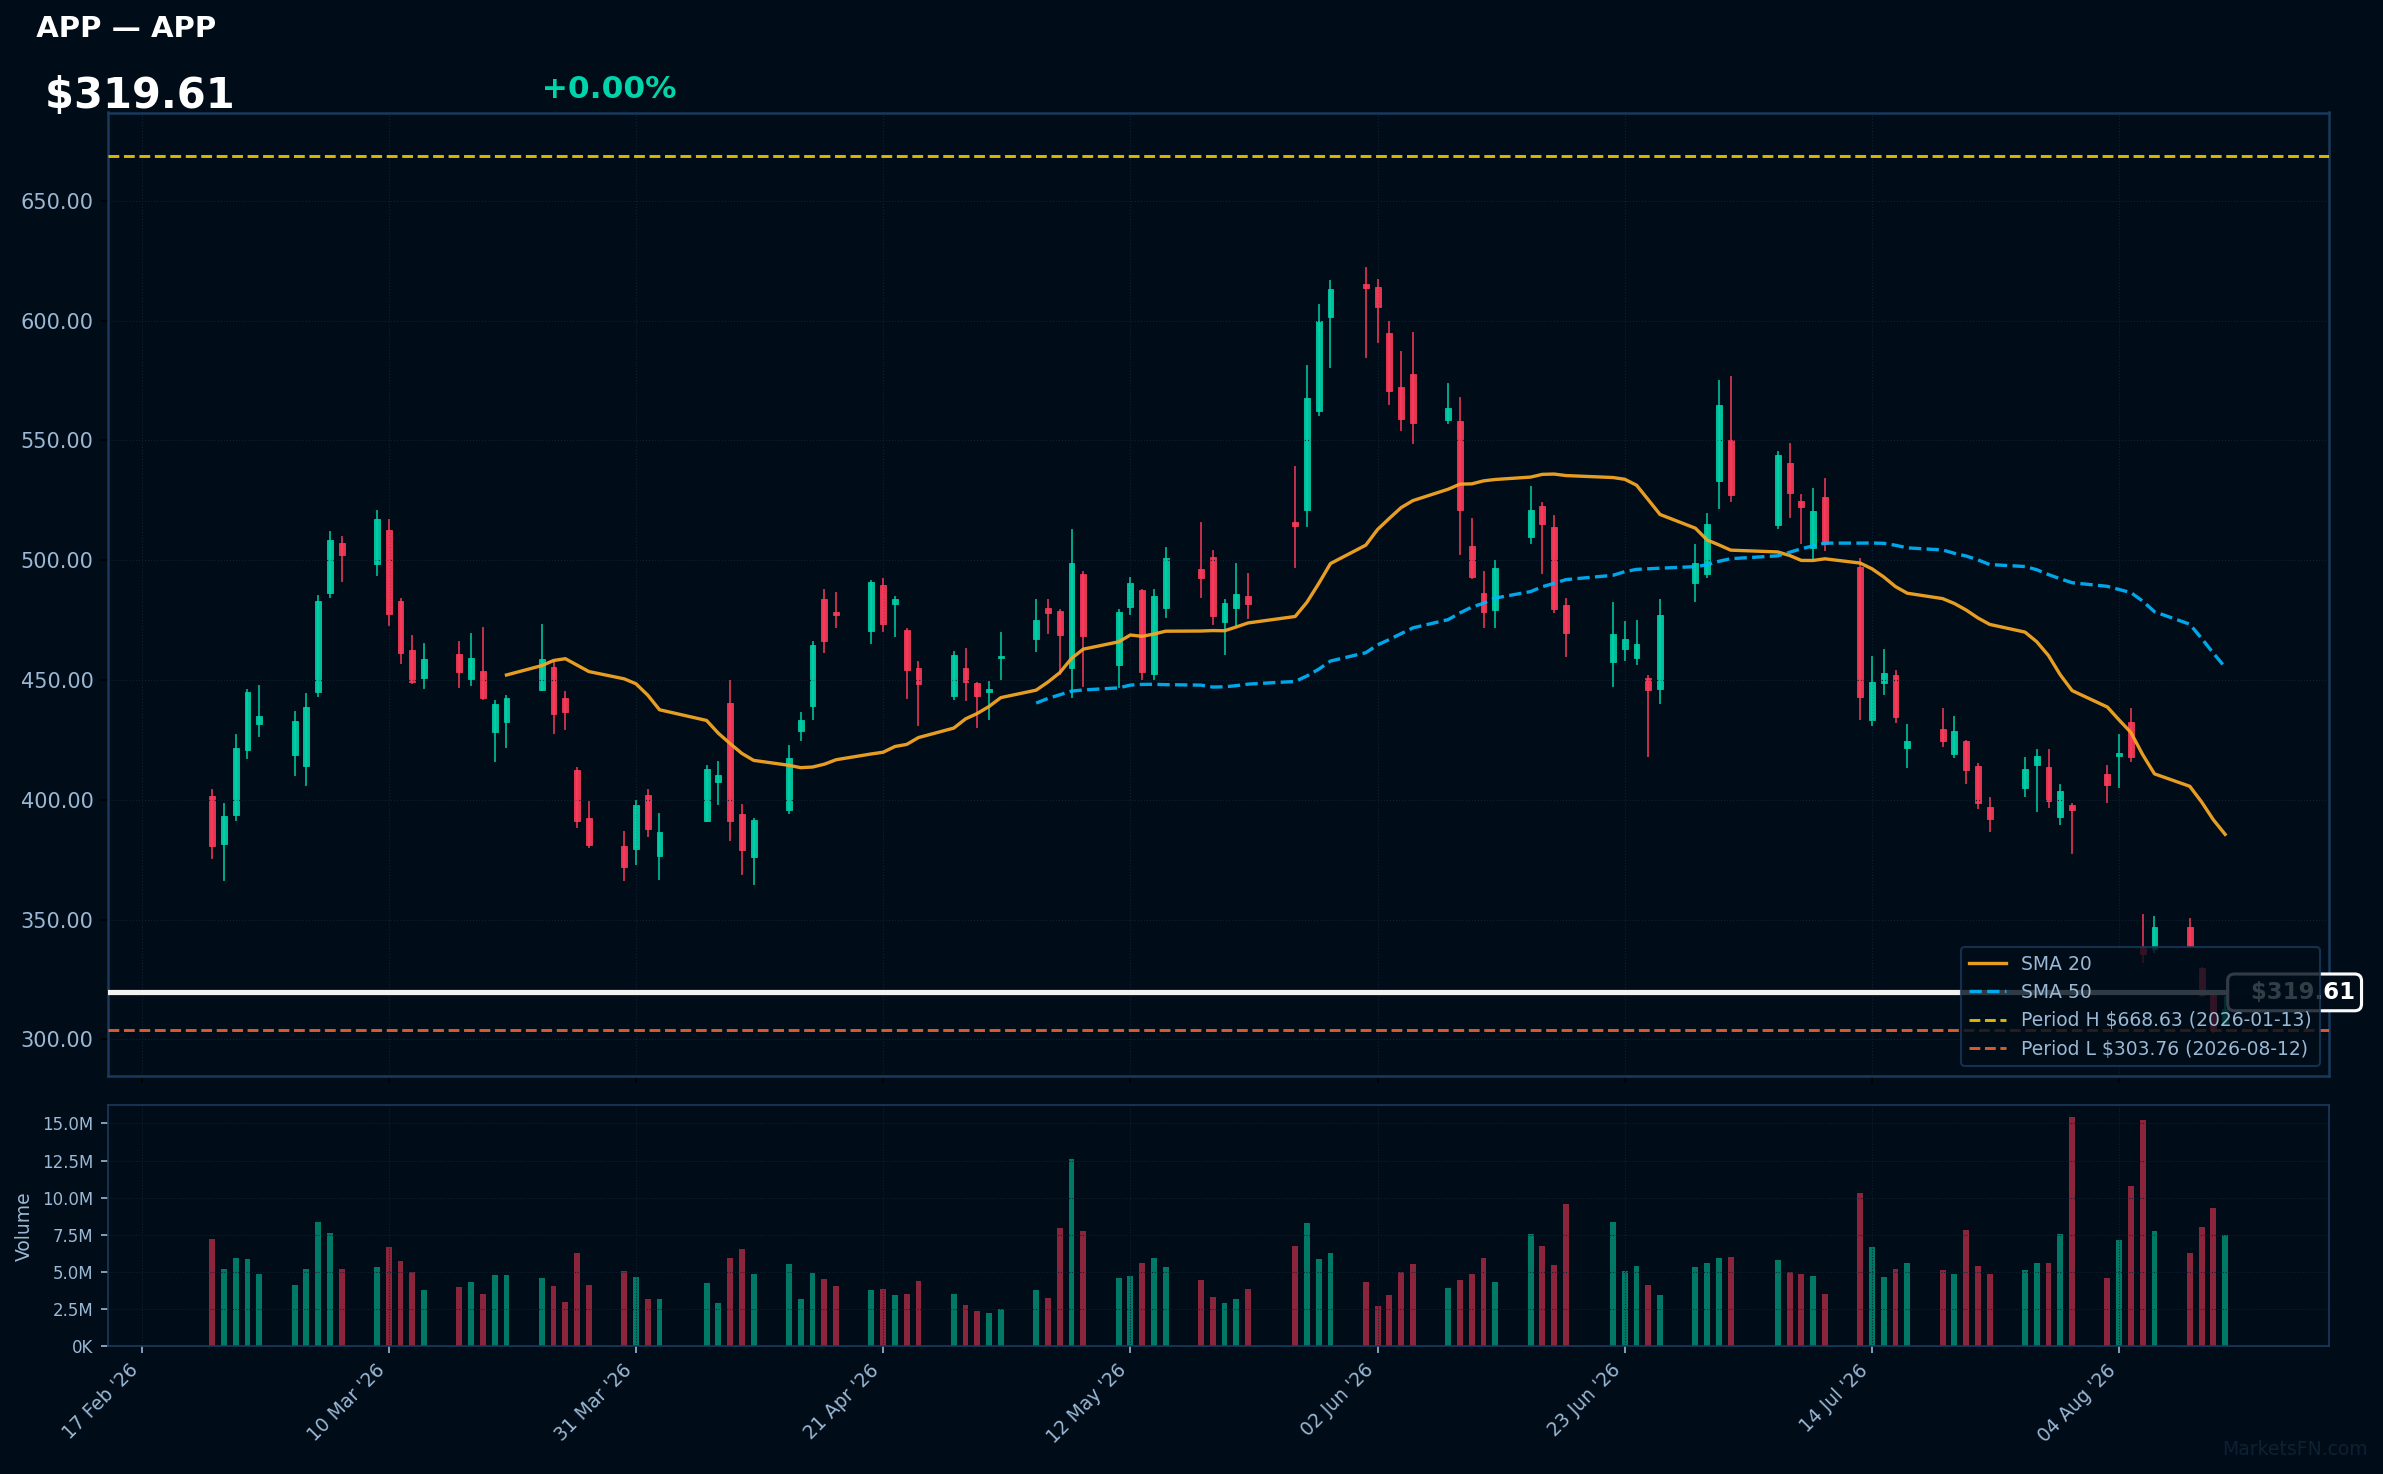
APP | Applovin Corp | Communication Services | Price Last: $312.67 | % Realized: -49.43% | RSI: 31.8 | % above MA200: -38.5% | Trend: Below MA20, MA50, MA200
Applovin Corp (APP) specializes in mobile app marketing and monetization solutions, enabling developers to grow their businesses through targeted advertising and analytics. Investors should care due to its significant market position in the rapidly evolving mobile app ecosystem.
The current technical situation indicates a bearish trend, with an RSI(14) of 31.8 and a MA alignment of price < MA20 < MA50 < MA200, suggesting sustained downtrend and testing major support just 2.9% above its 2026 YTD low.
Related headlines
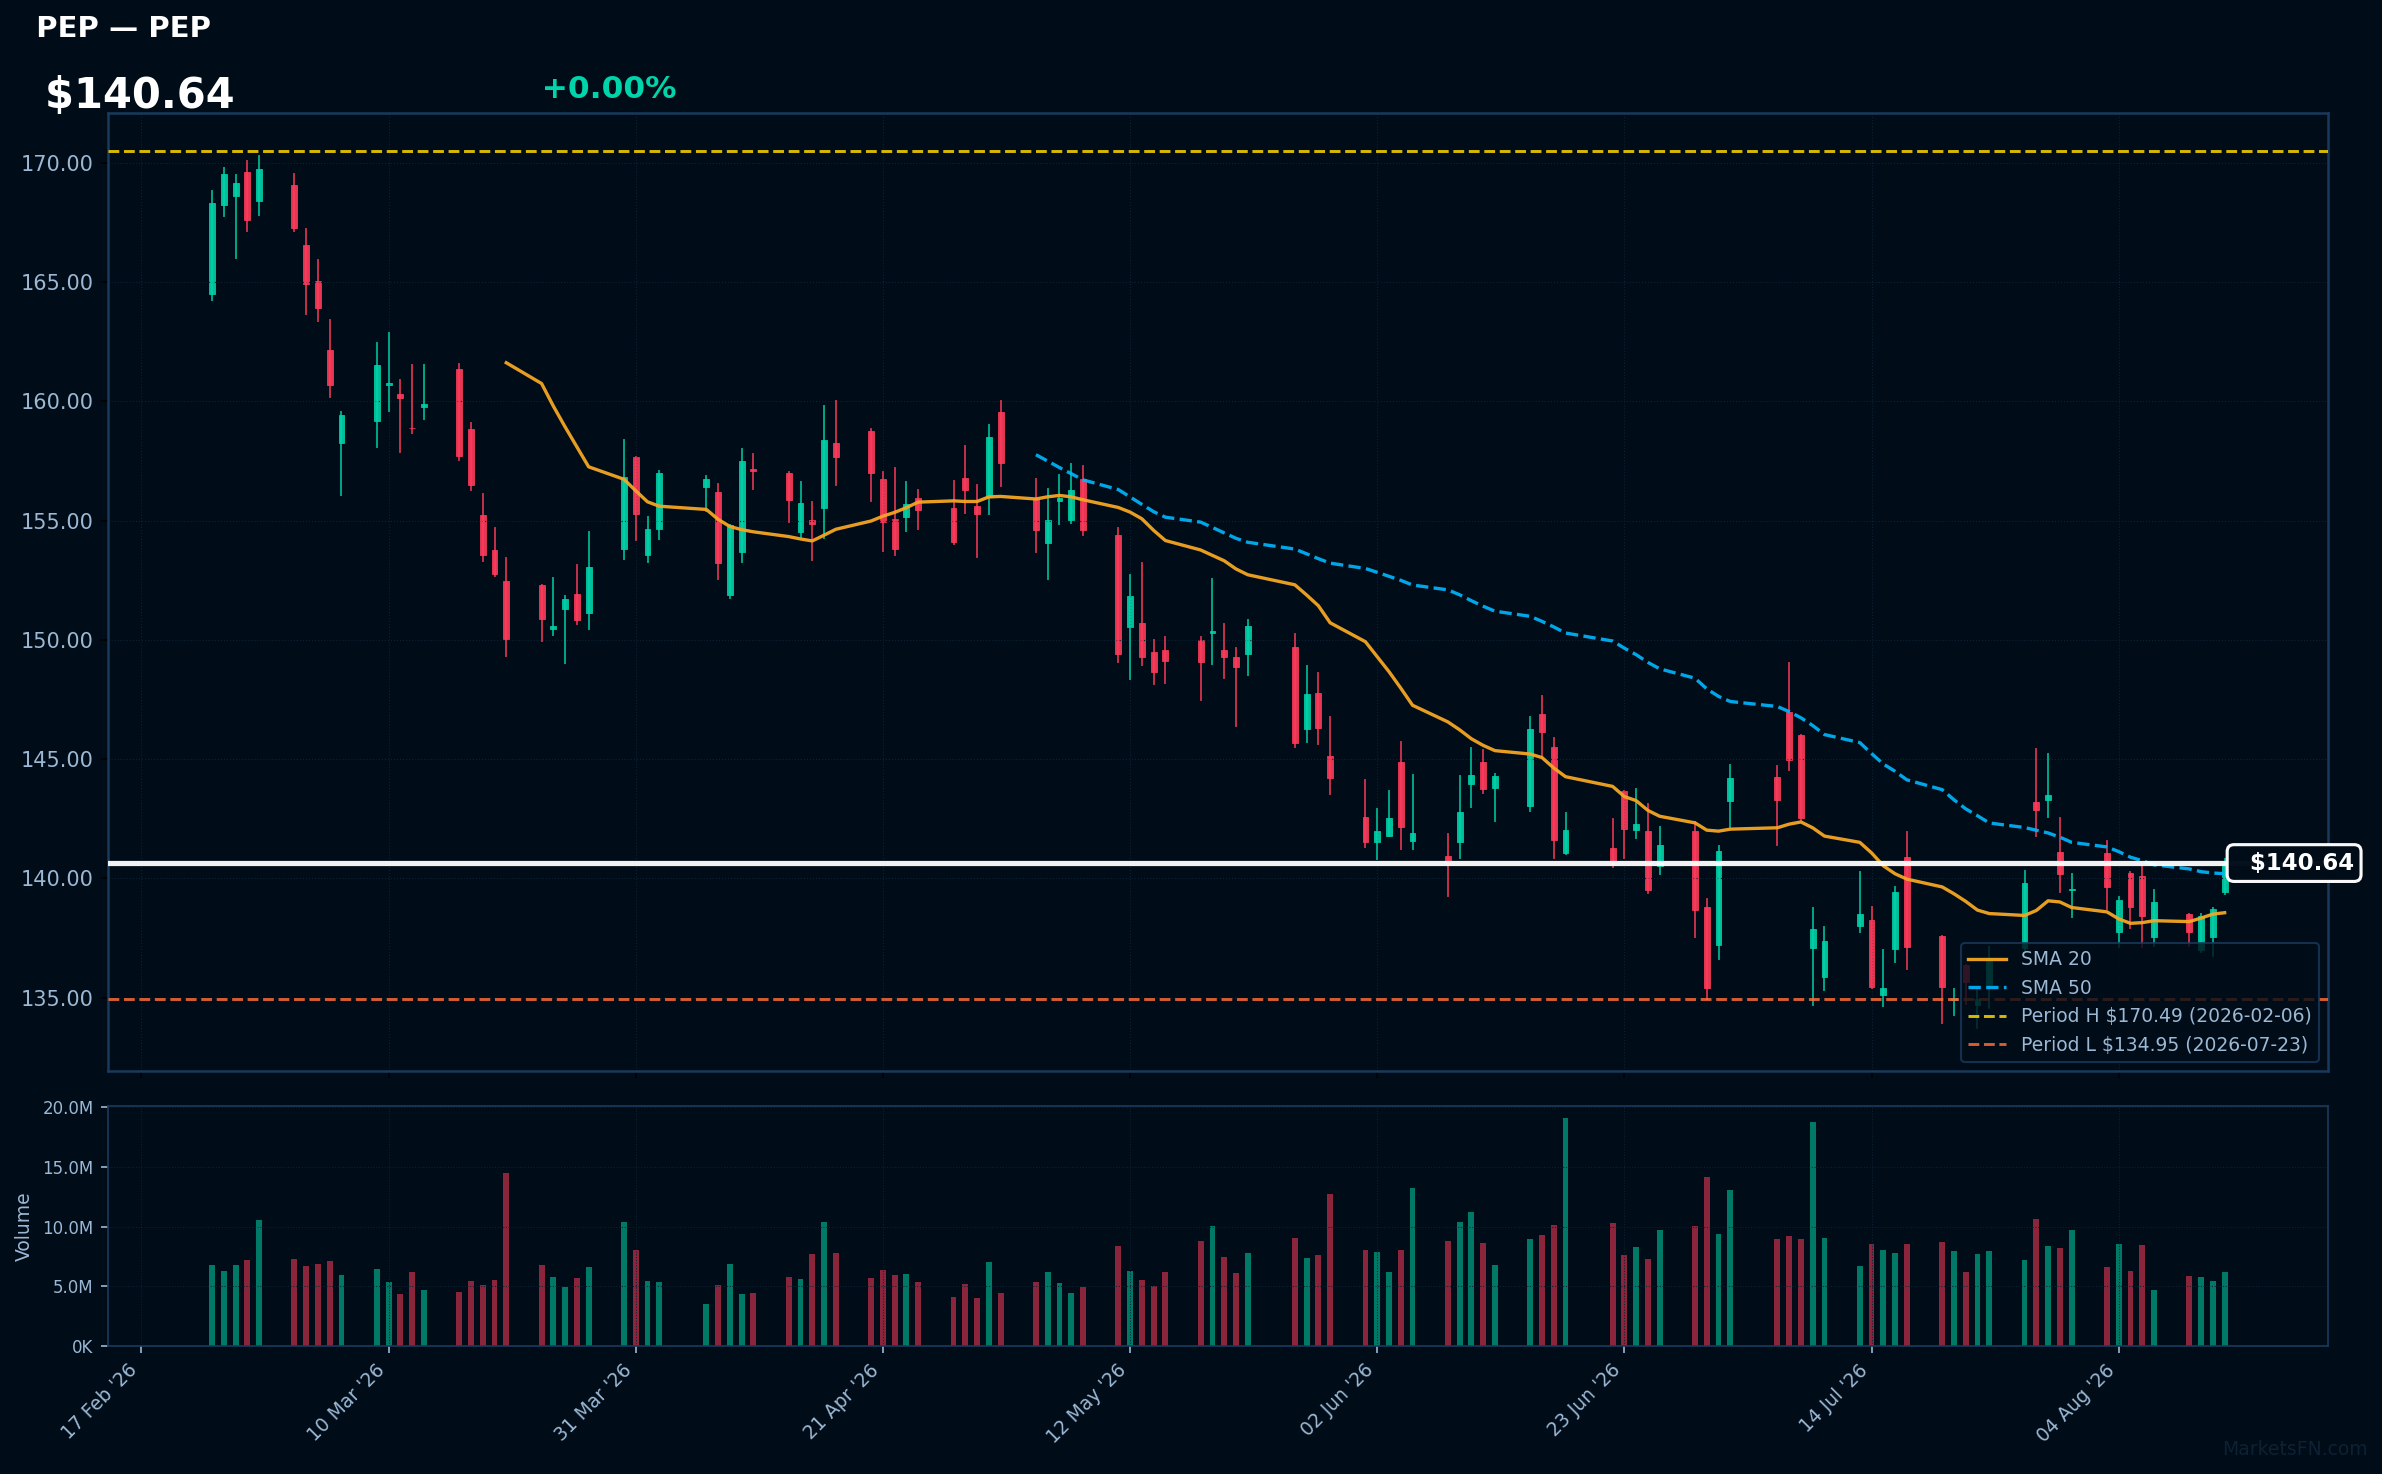
PEP | PepsiCo Inc | Consumer Defensive | Price Last: $140.62 | % Realized: -1.13% | RSI: 53.6 | % above MA200: -5.7% | Trend: Above MA20, MA50 · Below MA200
PepsiCo Inc (PEP) is a global leader in the food and beverage industry, known for its diverse portfolio including snacks, soft drinks, and health-focused products. Investors should care due to its strong market presence and potential for growth in emerging health trends.
Currently, PEP shows mixed technical signals with an RSI(14) of 53.6, price above MA20/MA50 but below MA200. The stock is testing major support, being only 4.2% above its 2026 YTD low, indicating caution.
Related headlines
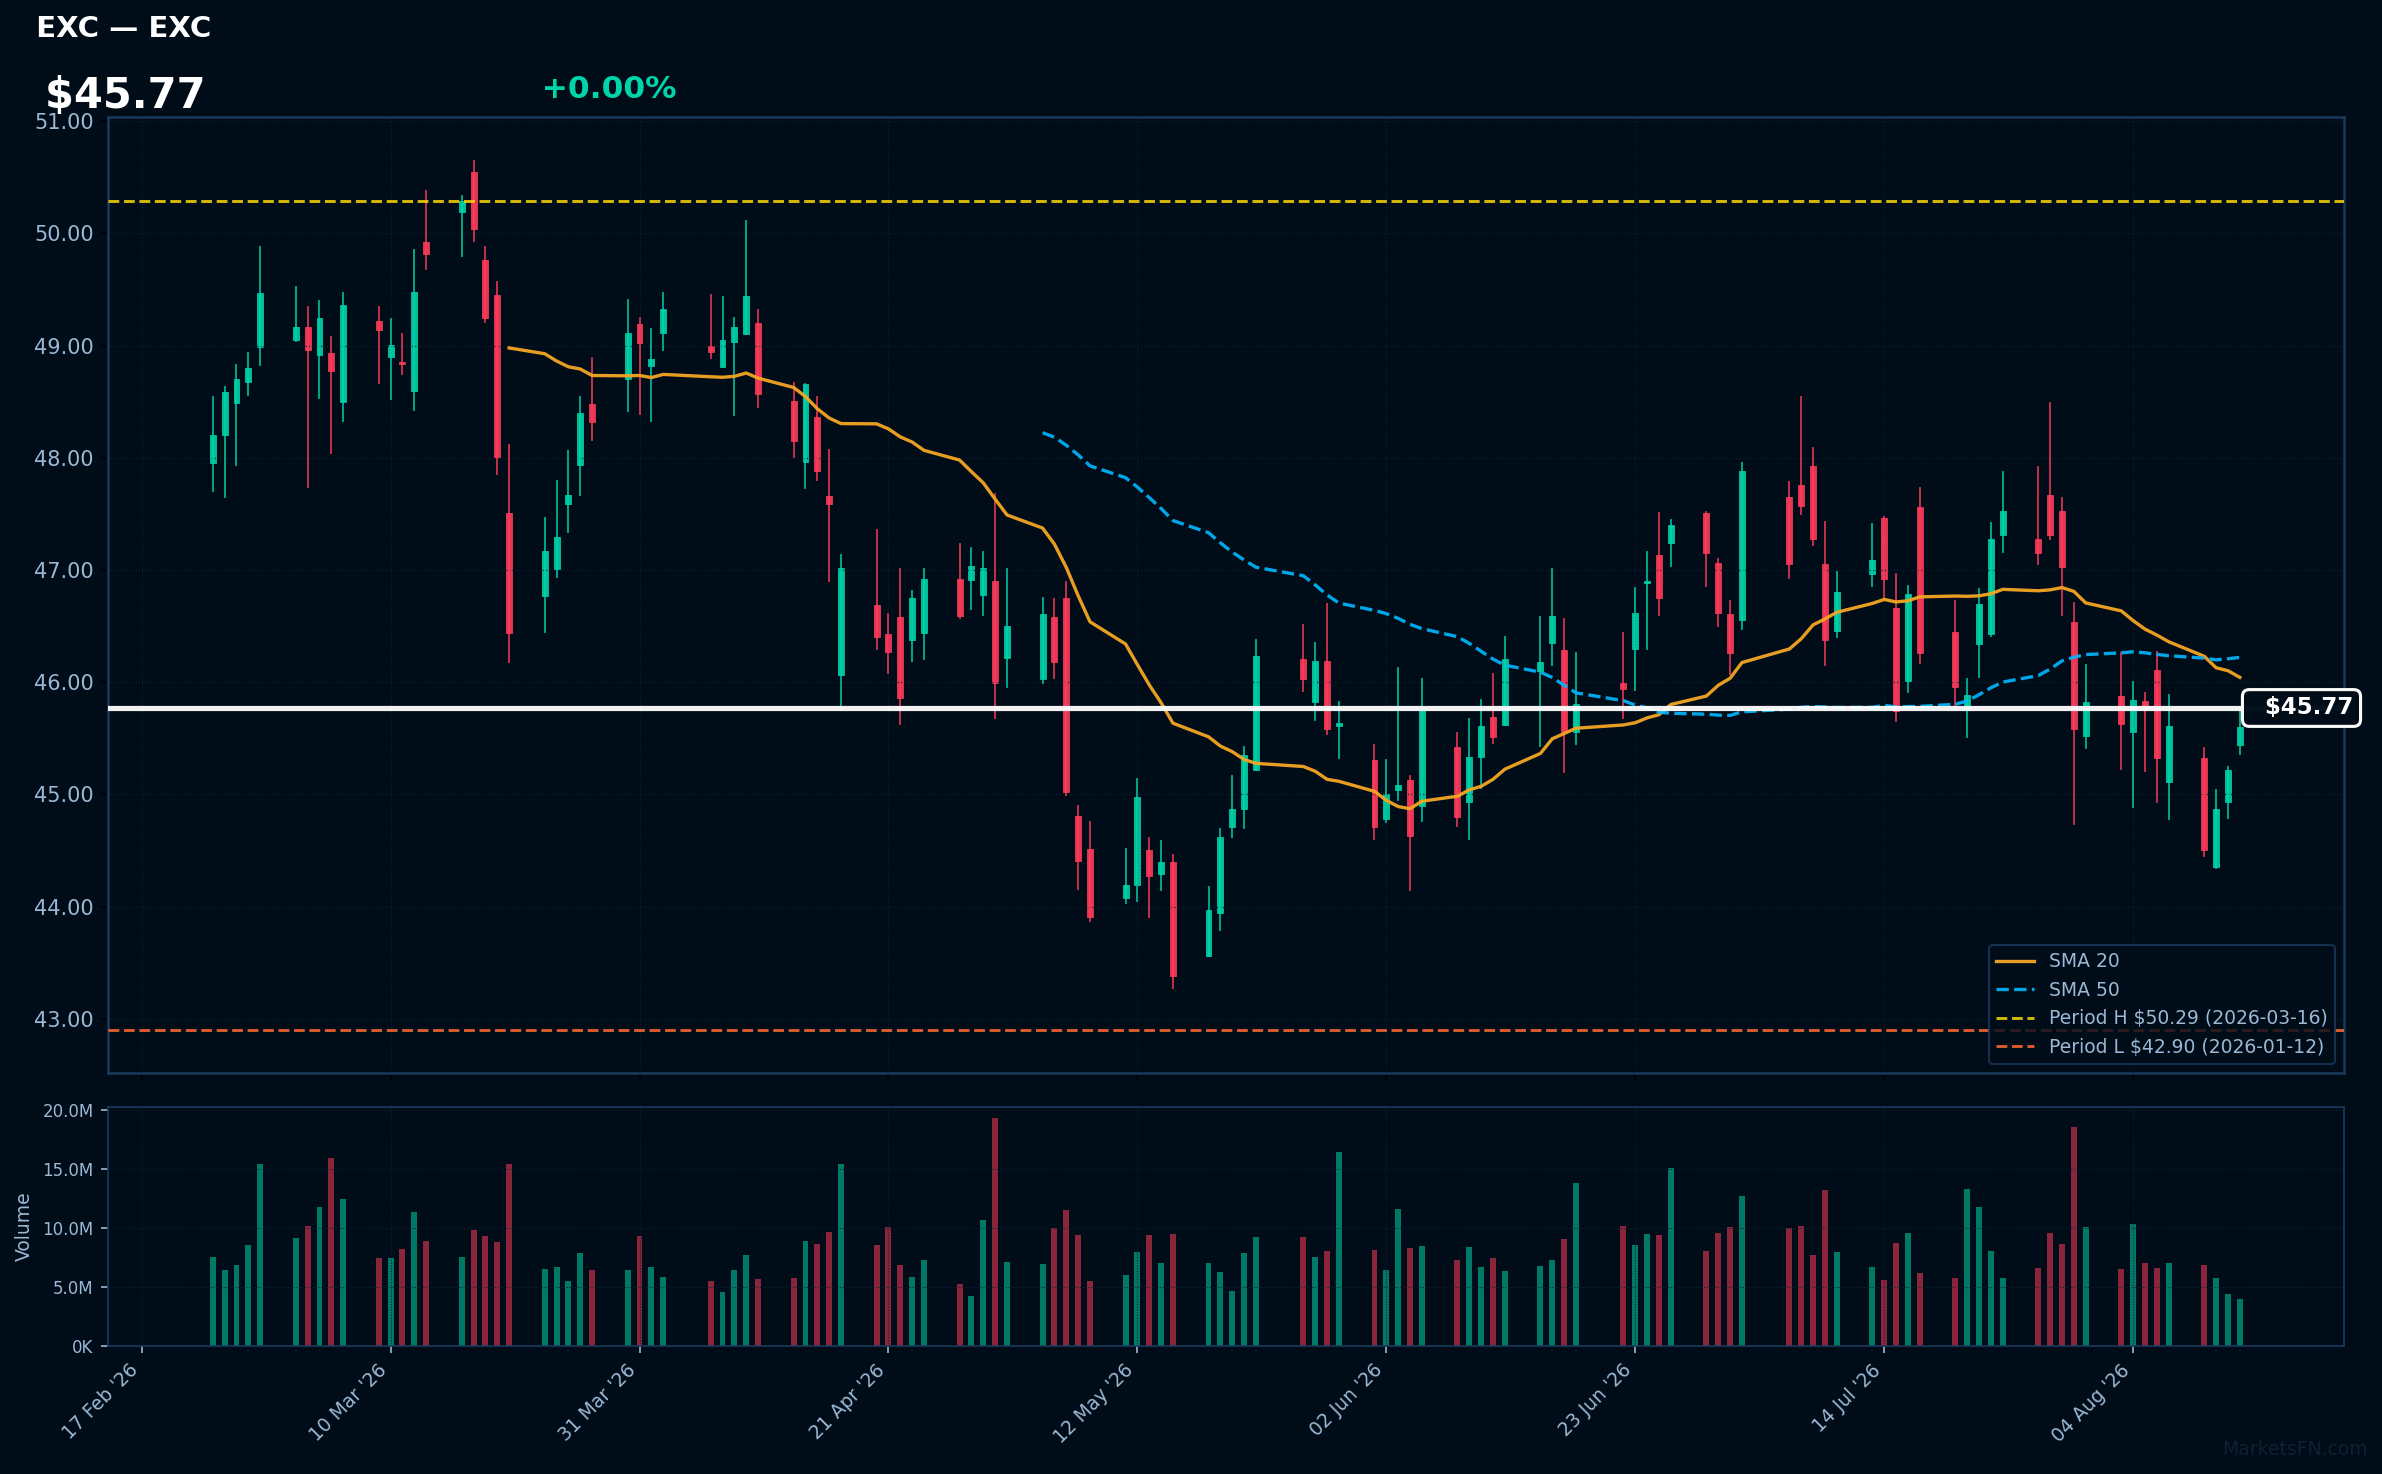
EXC | Exelon Corp | Utilities | Price Last: $45.60 | % Realized: +3.83% | RSI: 48.5 | % above MA200: -1.0% | Trend: Below MA20, MA50, MA200
Exelon Corp (EXC) is a leading energy provider, focusing on nuclear and renewable energy generation. Investors should care due to its significant role in the transition to cleaner energy, which positions it well for future growth amid increasing demand for sustainable power solutions.
Currently, EXC shows mixed signals with an RSI(14) of 48.5 and is below MA20/MA50/MA200. The stock is testing major support, being only 6.3% above its 2026 YTD low, indicating potential caution for investors.
Related headlines
- Exelon Secures More Than $1 Billion in Customer Protections Through Pioneering Transmission Security Agreements
- Exelon high probability data center load falls 40%
- Exelon Corp (EXC) (Q2 2026) Earnings Call Highlights: Navigating Regulatory Hurdles and Data ...
- Exelon Corporation Q2 2026 Earnings Call Summary
Market Commentary
The fact that several Nasdaq 100 tech stocks are near their 2026 highs indicates strong market momentum and investor confidence in these companies. Stocks like AMGN, PANW, ADP, CRWD, and SBUX are currently at 0.0% from their highs, suggesting they are performing exceptionally well relative to their recent price history. This proximity to peak levels may attract further investment, as traders often seek to capitalize on upward trends.
Several technology sector themes and macroeconomic conditions are likely driving these movements. The ongoing digital transformation across industries, increased demand for cybersecurity solutions, and robust consumer spending in sectors like food and beverage are contributing factors. Additionally, favorable interest rates and a generally positive economic outlook may be supporting higher valuations for these tech stocks.
Investors and traders should closely monitor upcoming earnings reports and economic indicators that could impact market sentiment. Key metrics such as inflation rates, employment data, and consumer confidence will be critical in assessing whether these stocks can maintain their upward trajectory. Furthermore, any shifts in regulatory policies or technological advancements could also influence future performance.
Methodology: All 101 Nasdaq 100 constituents screened. Close prices downloaded from 2026-01-01. Period high = highest close since Jan 1 2026; period low = lowest close since Jan 1 2026. Distance = (current price / period extreme − 1) × 100. Technical indicators computed on up to 1 year of daily OHLCV data.
Disclaimer: For informational purposes only. Not investment advice. Past performance is not indicative of future results.

