Nasdaq 100 2026 YTD Highs & Lows Radar: Apple (AAPL), Tesla (TSLA) and more
MarketsFN Team

Nasdaq 100 2026 YTD Highs & Lows Radar: Apple (AAPL), Tesla (TSLA) and more
Screening all 101 Nasdaq 100 constituents for stocks nearest to their 2026 year-to-date high and their 2026 YTD low. Data as of July 29, 2026. % Realized = total return since Jan 1 2026.
Legend: RSI > 70 = overbought · RSI < 30 = oversold · Green % Realized = positive YTD return · Red = negative.
📈 Nearest to 2026 High
Sectors represented: Technology (2), Industrials (2), Consumer Cyclical (1)
| Ticker | Company | Sector | Price Last | % Realized | 2026 YTD High Date | RSI | % above MA200 | Trend |
|---|---|---|---|---|---|---|---|---|
| AAPL | Apple Inc | Technology | $336.91 | +24.32% | 2026-07-27 | 69.7 | +21.7% | Above MA20, MA50, MA200 |
| CTAS | Cintas Corporation | Industrials | $210.98 | +14.12% | 2026-07-27 | 77.7 | +14.3% | Above MA20, MA50, MA200 |
| PCAR | Paccar Inc | Industrials | $133.44 | +19.61% | 2026-07-27 | 74.3 | +15.9% | Above MA20, MA50, MA200 |
| ROST | Ross Stores, Inc | Consumer Cyclical | $243.35 | +33.17% | 2026-07-27 | 70.4 | +21.4% | Above MA20, MA50, MA200 |
| PAYX | Paychex Inc | Technology | $115.48 | +6.34% | 2026-07-27 | 74.1 | +11.3% | Above MA20, MA50, MA200 |
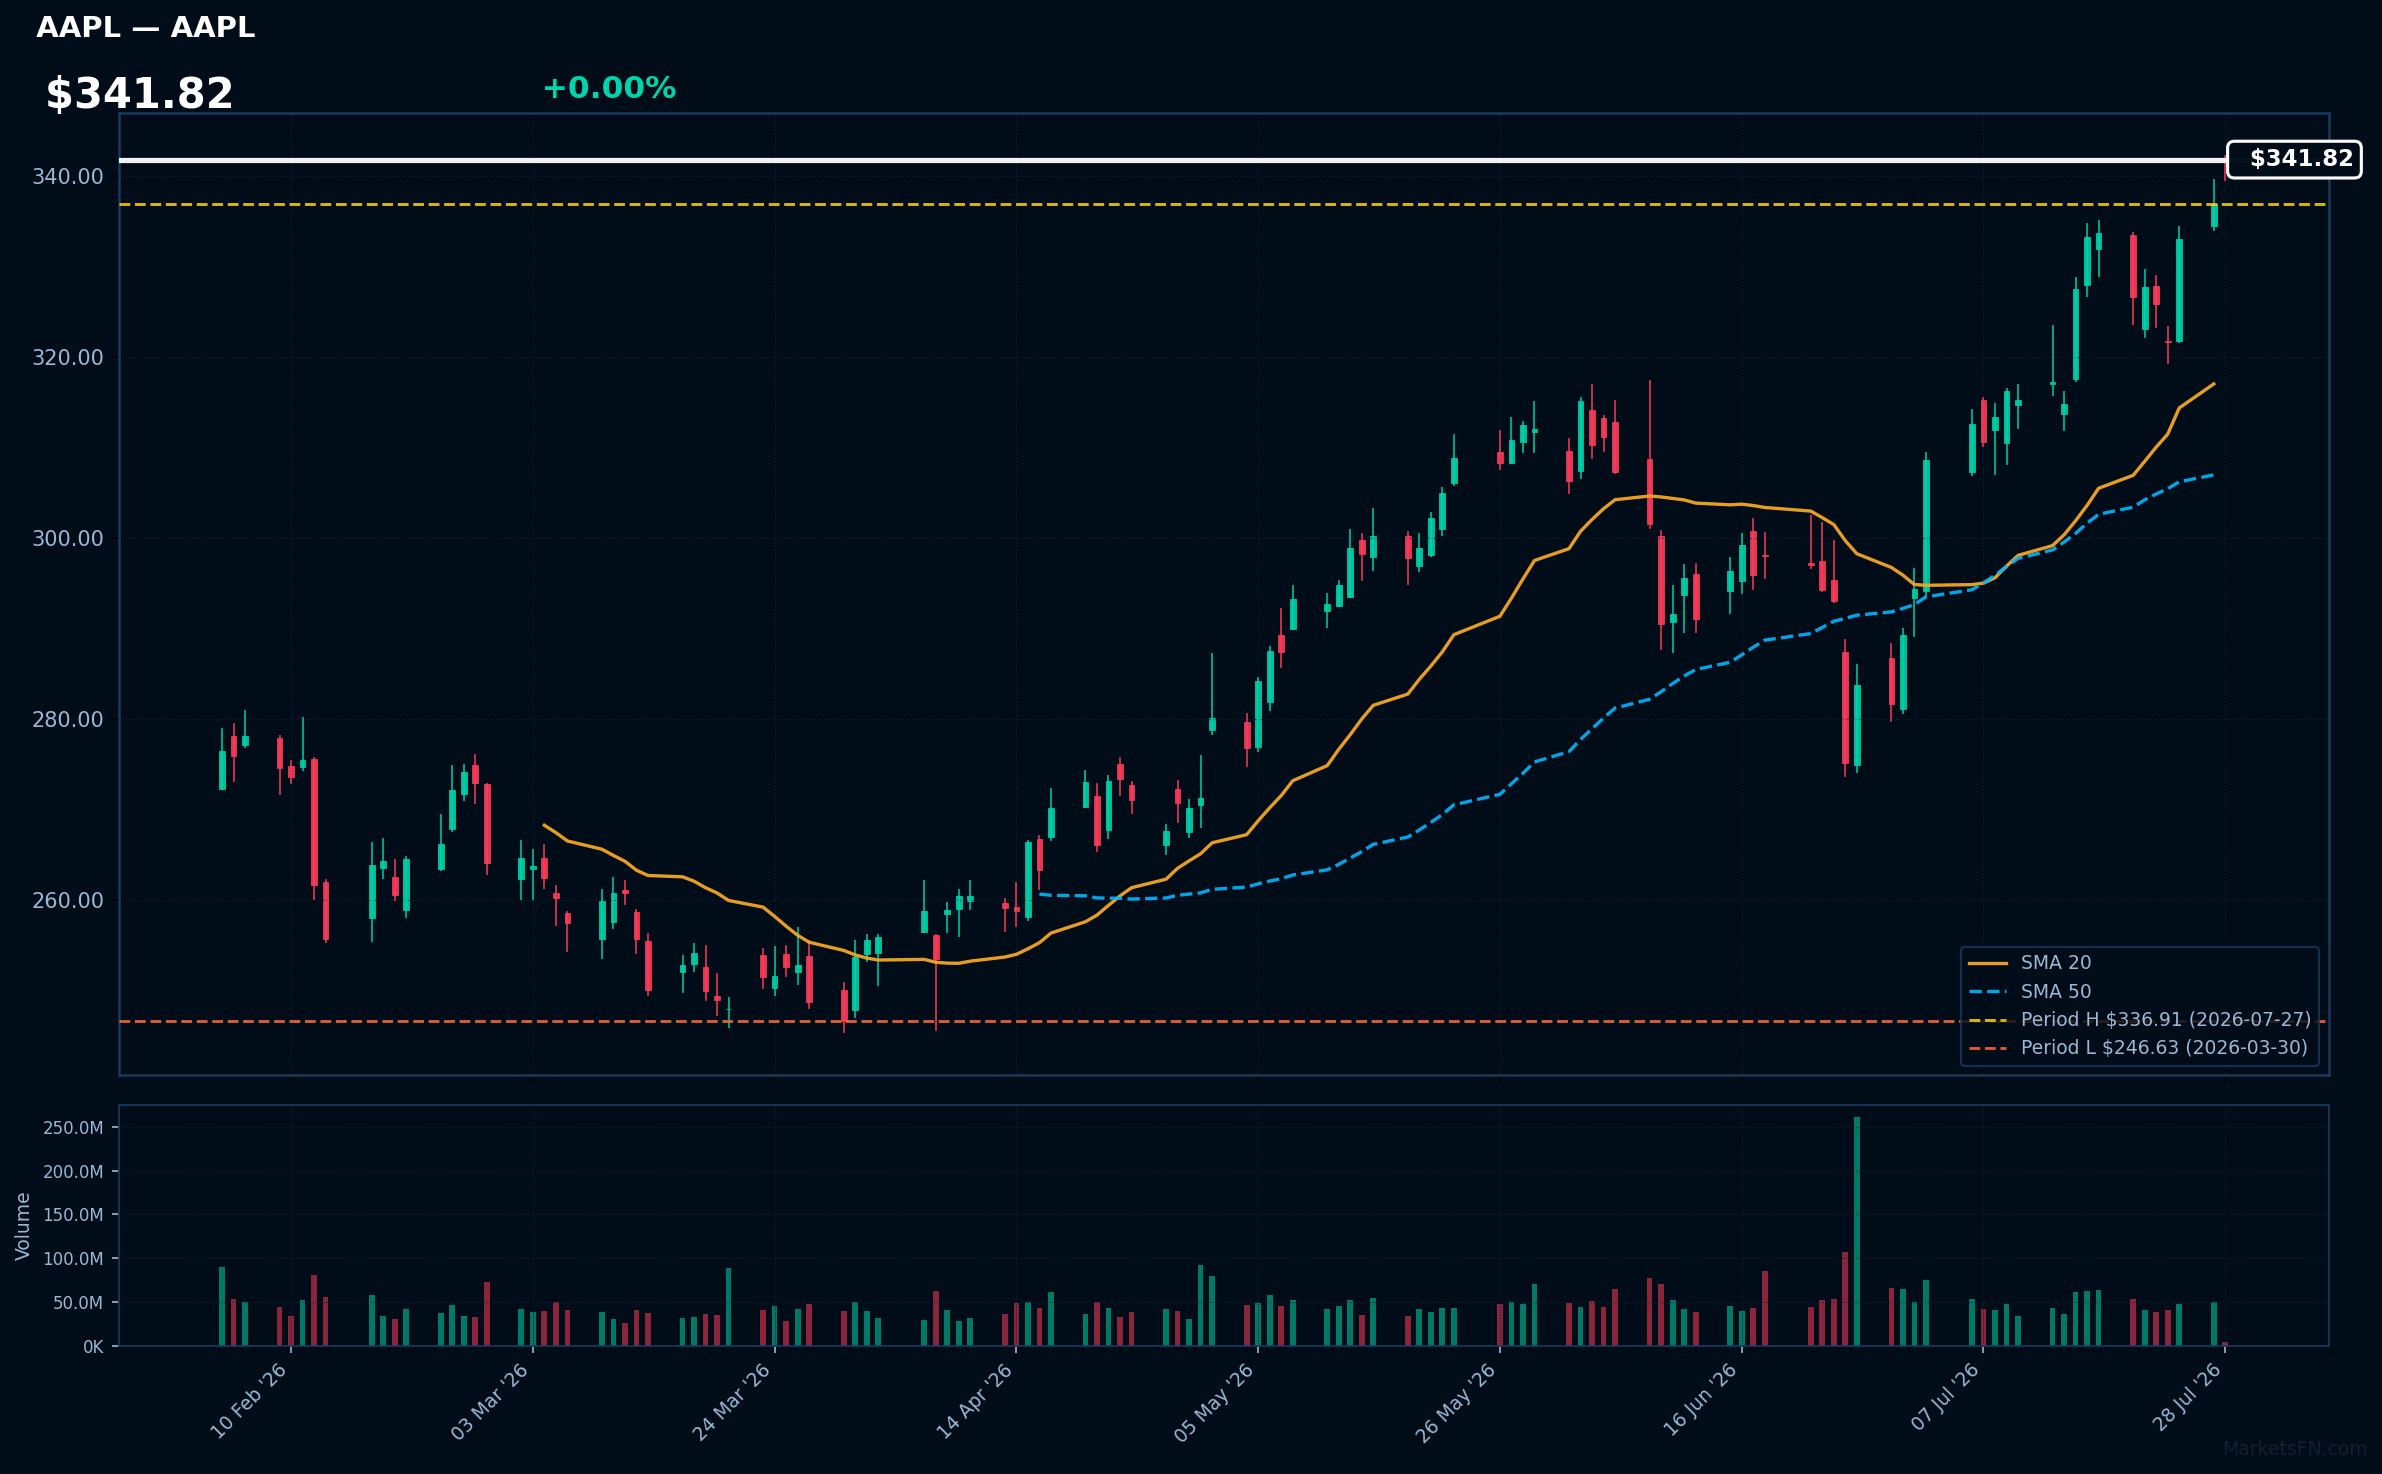
AAPL | Apple Inc | Technology | Price Last: $336.91 | % Realized: +24.32% | RSI: 69.7 | % above MA200: +21.7% | Trend: Above MA20, MA50, MA200
Apple Inc designs, manufactures, and markets consumer electronics, software, and services. Investors care about its innovative product ecosystem, services growth, and profitability. Specific areas of interest include iPhone sales, Services segment expansion, and wearables growth.
AAPL's RSI(14) is 69.7, nearing overbought territory. The MA alignment is bullish with price > MA20 > MA50 > MA200, indicating a sustained uptrend. The stock is 0.0% below its 2026 YTD high, suggesting a potential breakout.
Related headlines
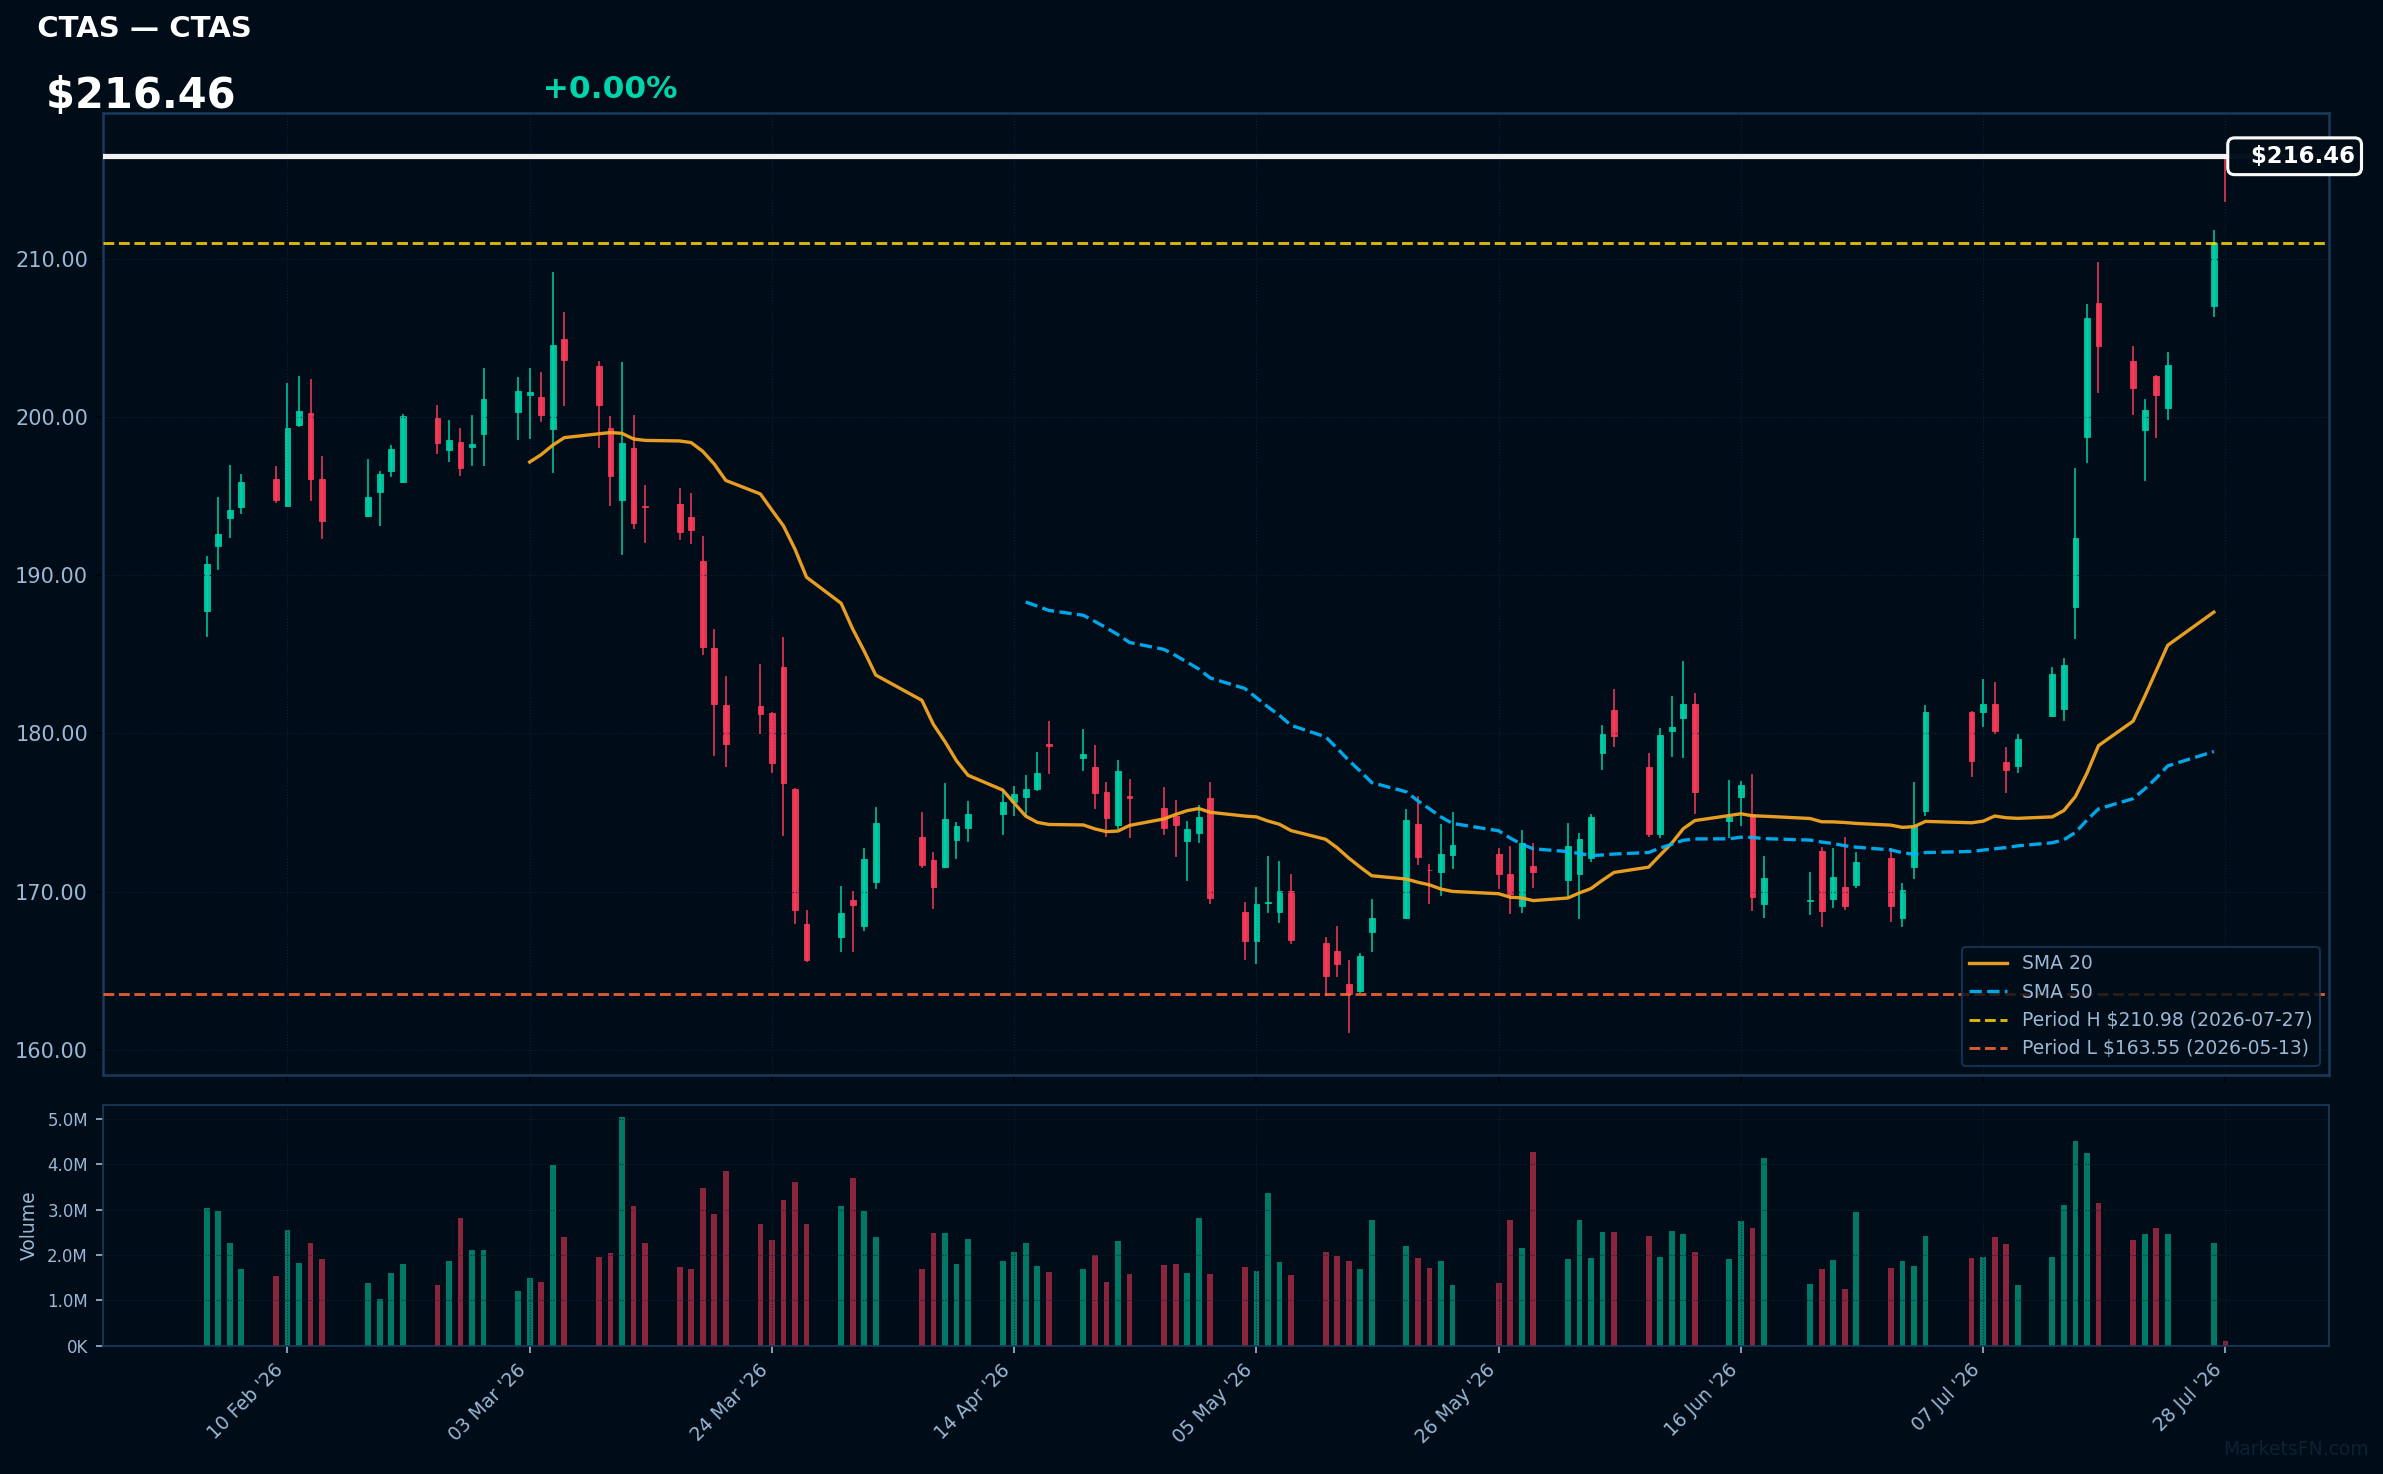
CTAS | Cintas Corporation | Industrials | Price Last: $210.98 | % Realized: +14.12% | RSI: 77.7 | % above MA200: +14.3% | Trend: Above MA20, MA50, MA200
Cintas Corporation (CTAS) is a leading provider of corporate identity uniforms and related services. Investors should care because its steady demand and pricing power drive consistent revenue growth, making it an attractive stock for income investors seeking stability.
Cintas Corporation's RSI(14) is 77.7, indicating strong momentum as it's above MA20, MA50, and MA200. The stock is 0.0% below its 2026 YTD high, suggesting a potential breakout. The 14.1% 2026 YTD return reinforces this momentum signal.
Related headlines
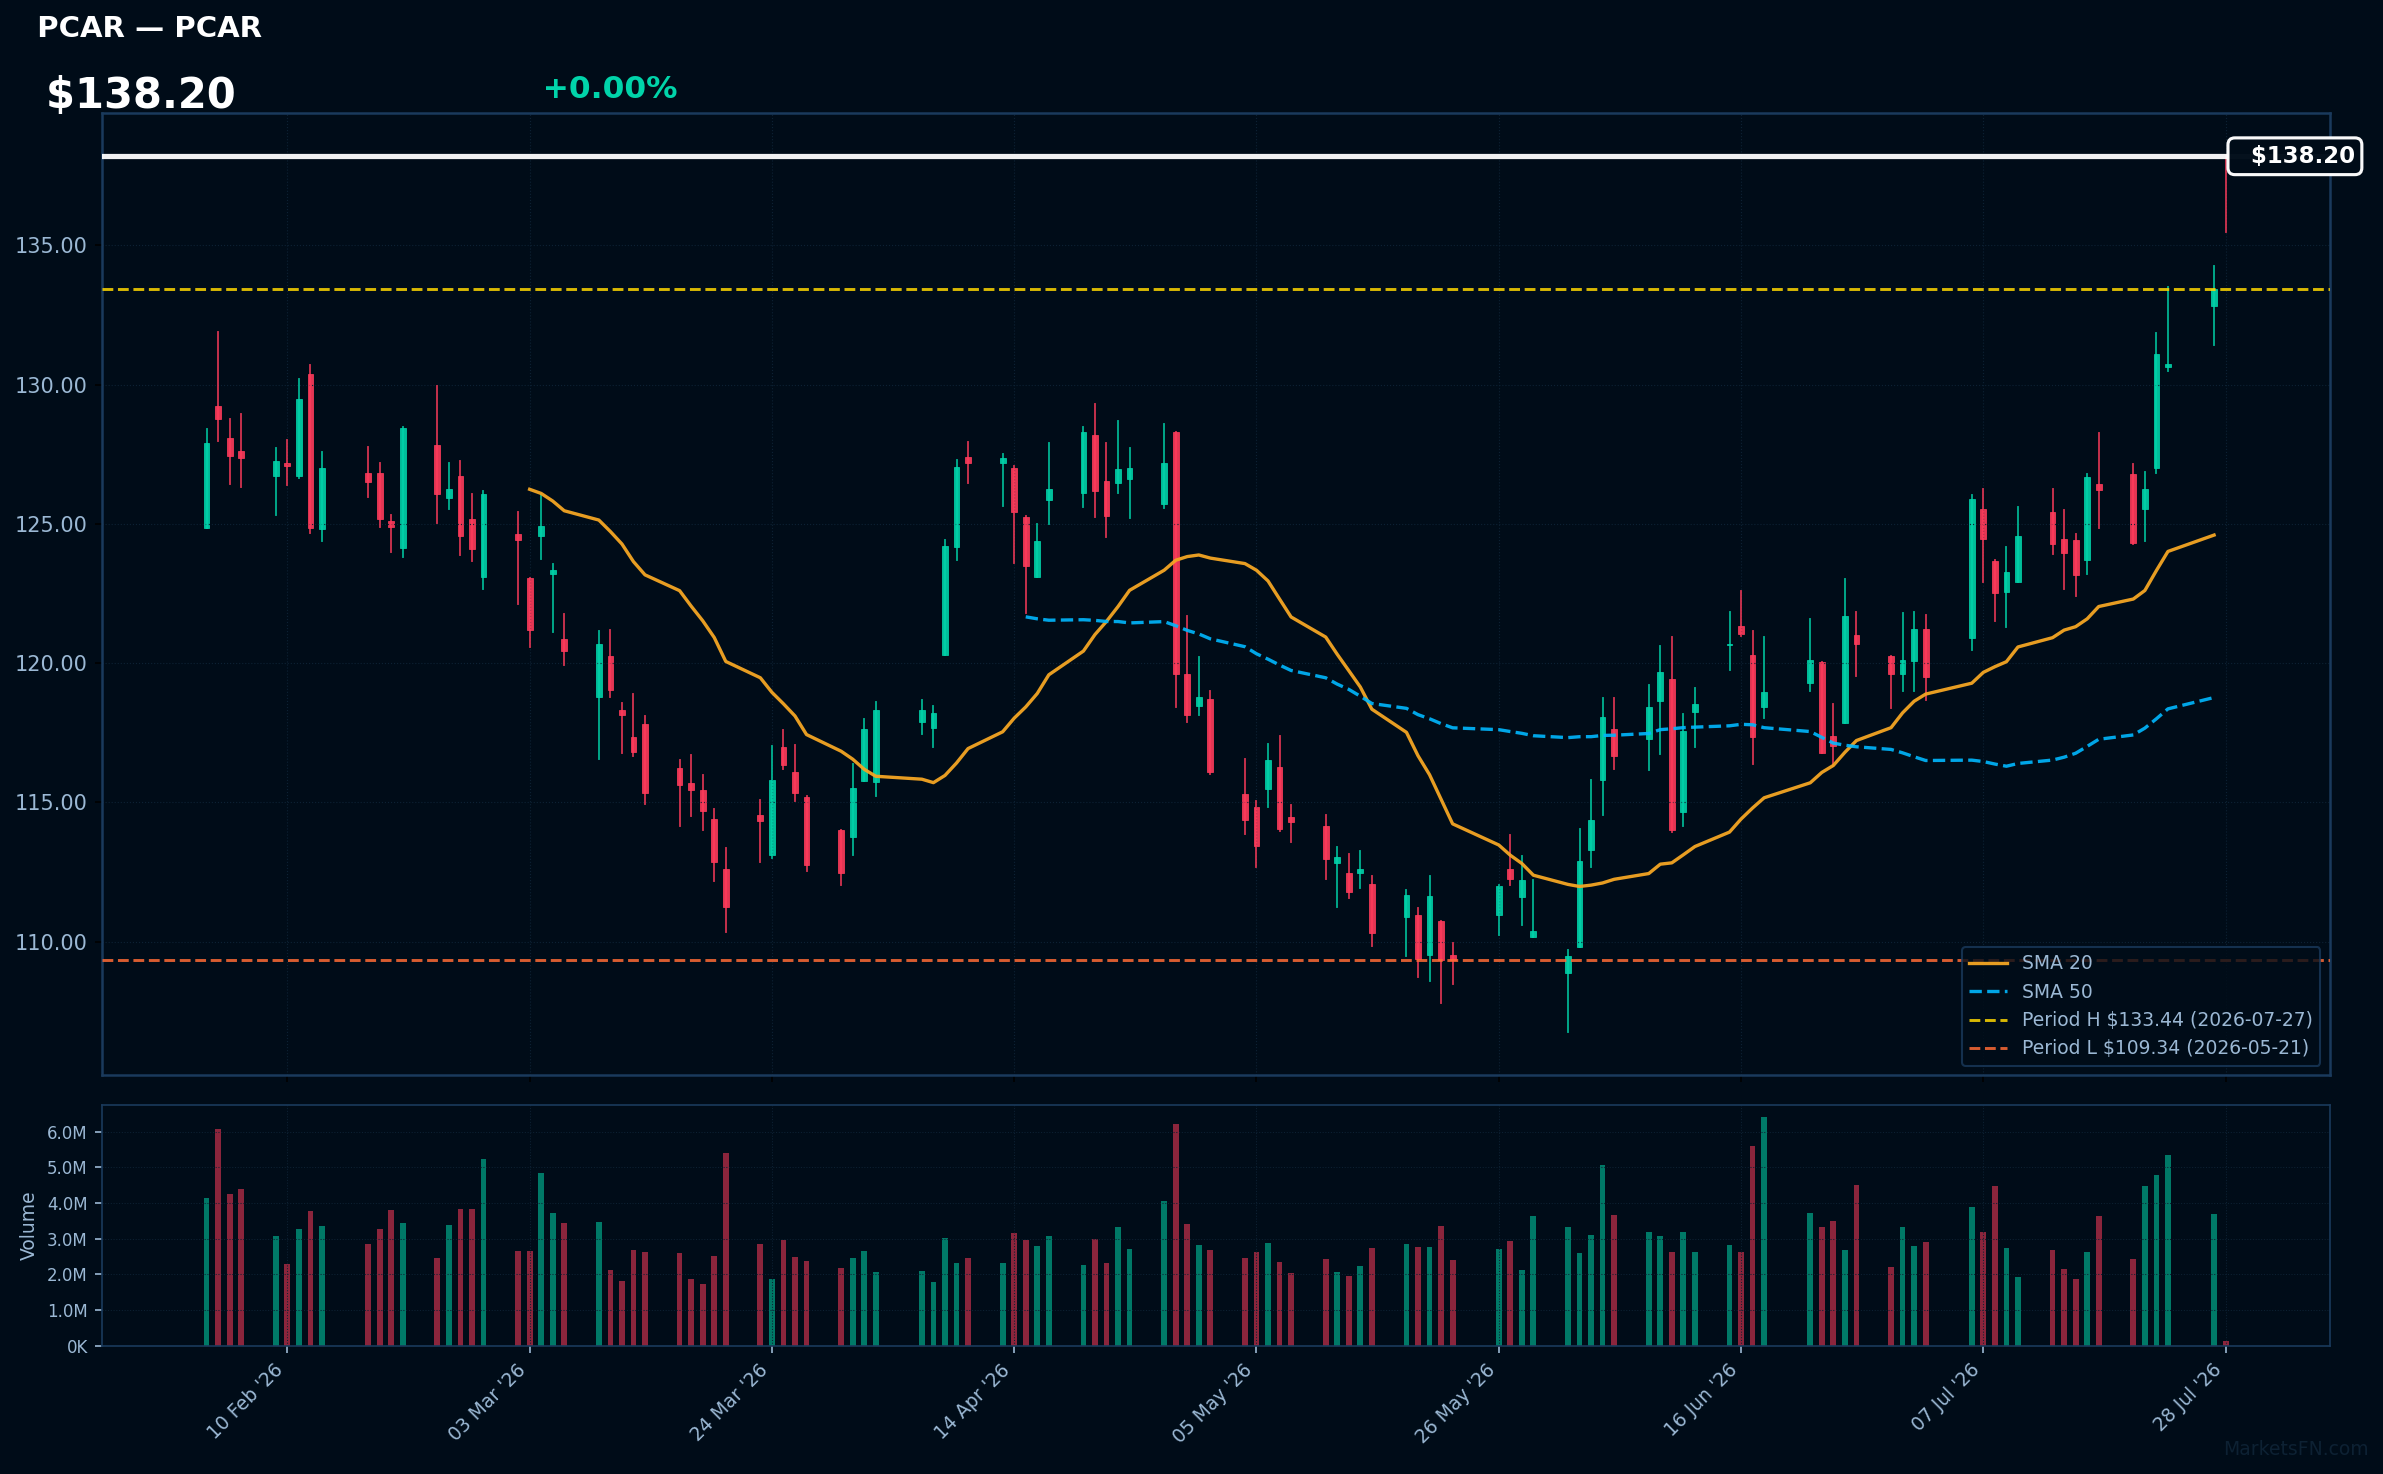
PCAR | Paccar Inc | Industrials | Price Last: $133.44 | % Realized: +19.61% | RSI: 74.3 | % above MA200: +15.9% | Trend: Above MA20, MA50, MA200
Paccar Inc designs and manufactures light-, medium-, and heavy-duty trucks under brands like Kenworth and Peterbilt. Investors should care because the company's truck sales are sensitive to economic cycles, making its performance a potential indicator of broader economic trends.
Paccar Inc's RSI(14) is 74.3, indicating strong momentum. The stock is in a sustained uptrend with price > MA20 > MA50 > MA200. It's 0.0% below its 2026 YTD high, suggesting a potential breakout.
Related headlines
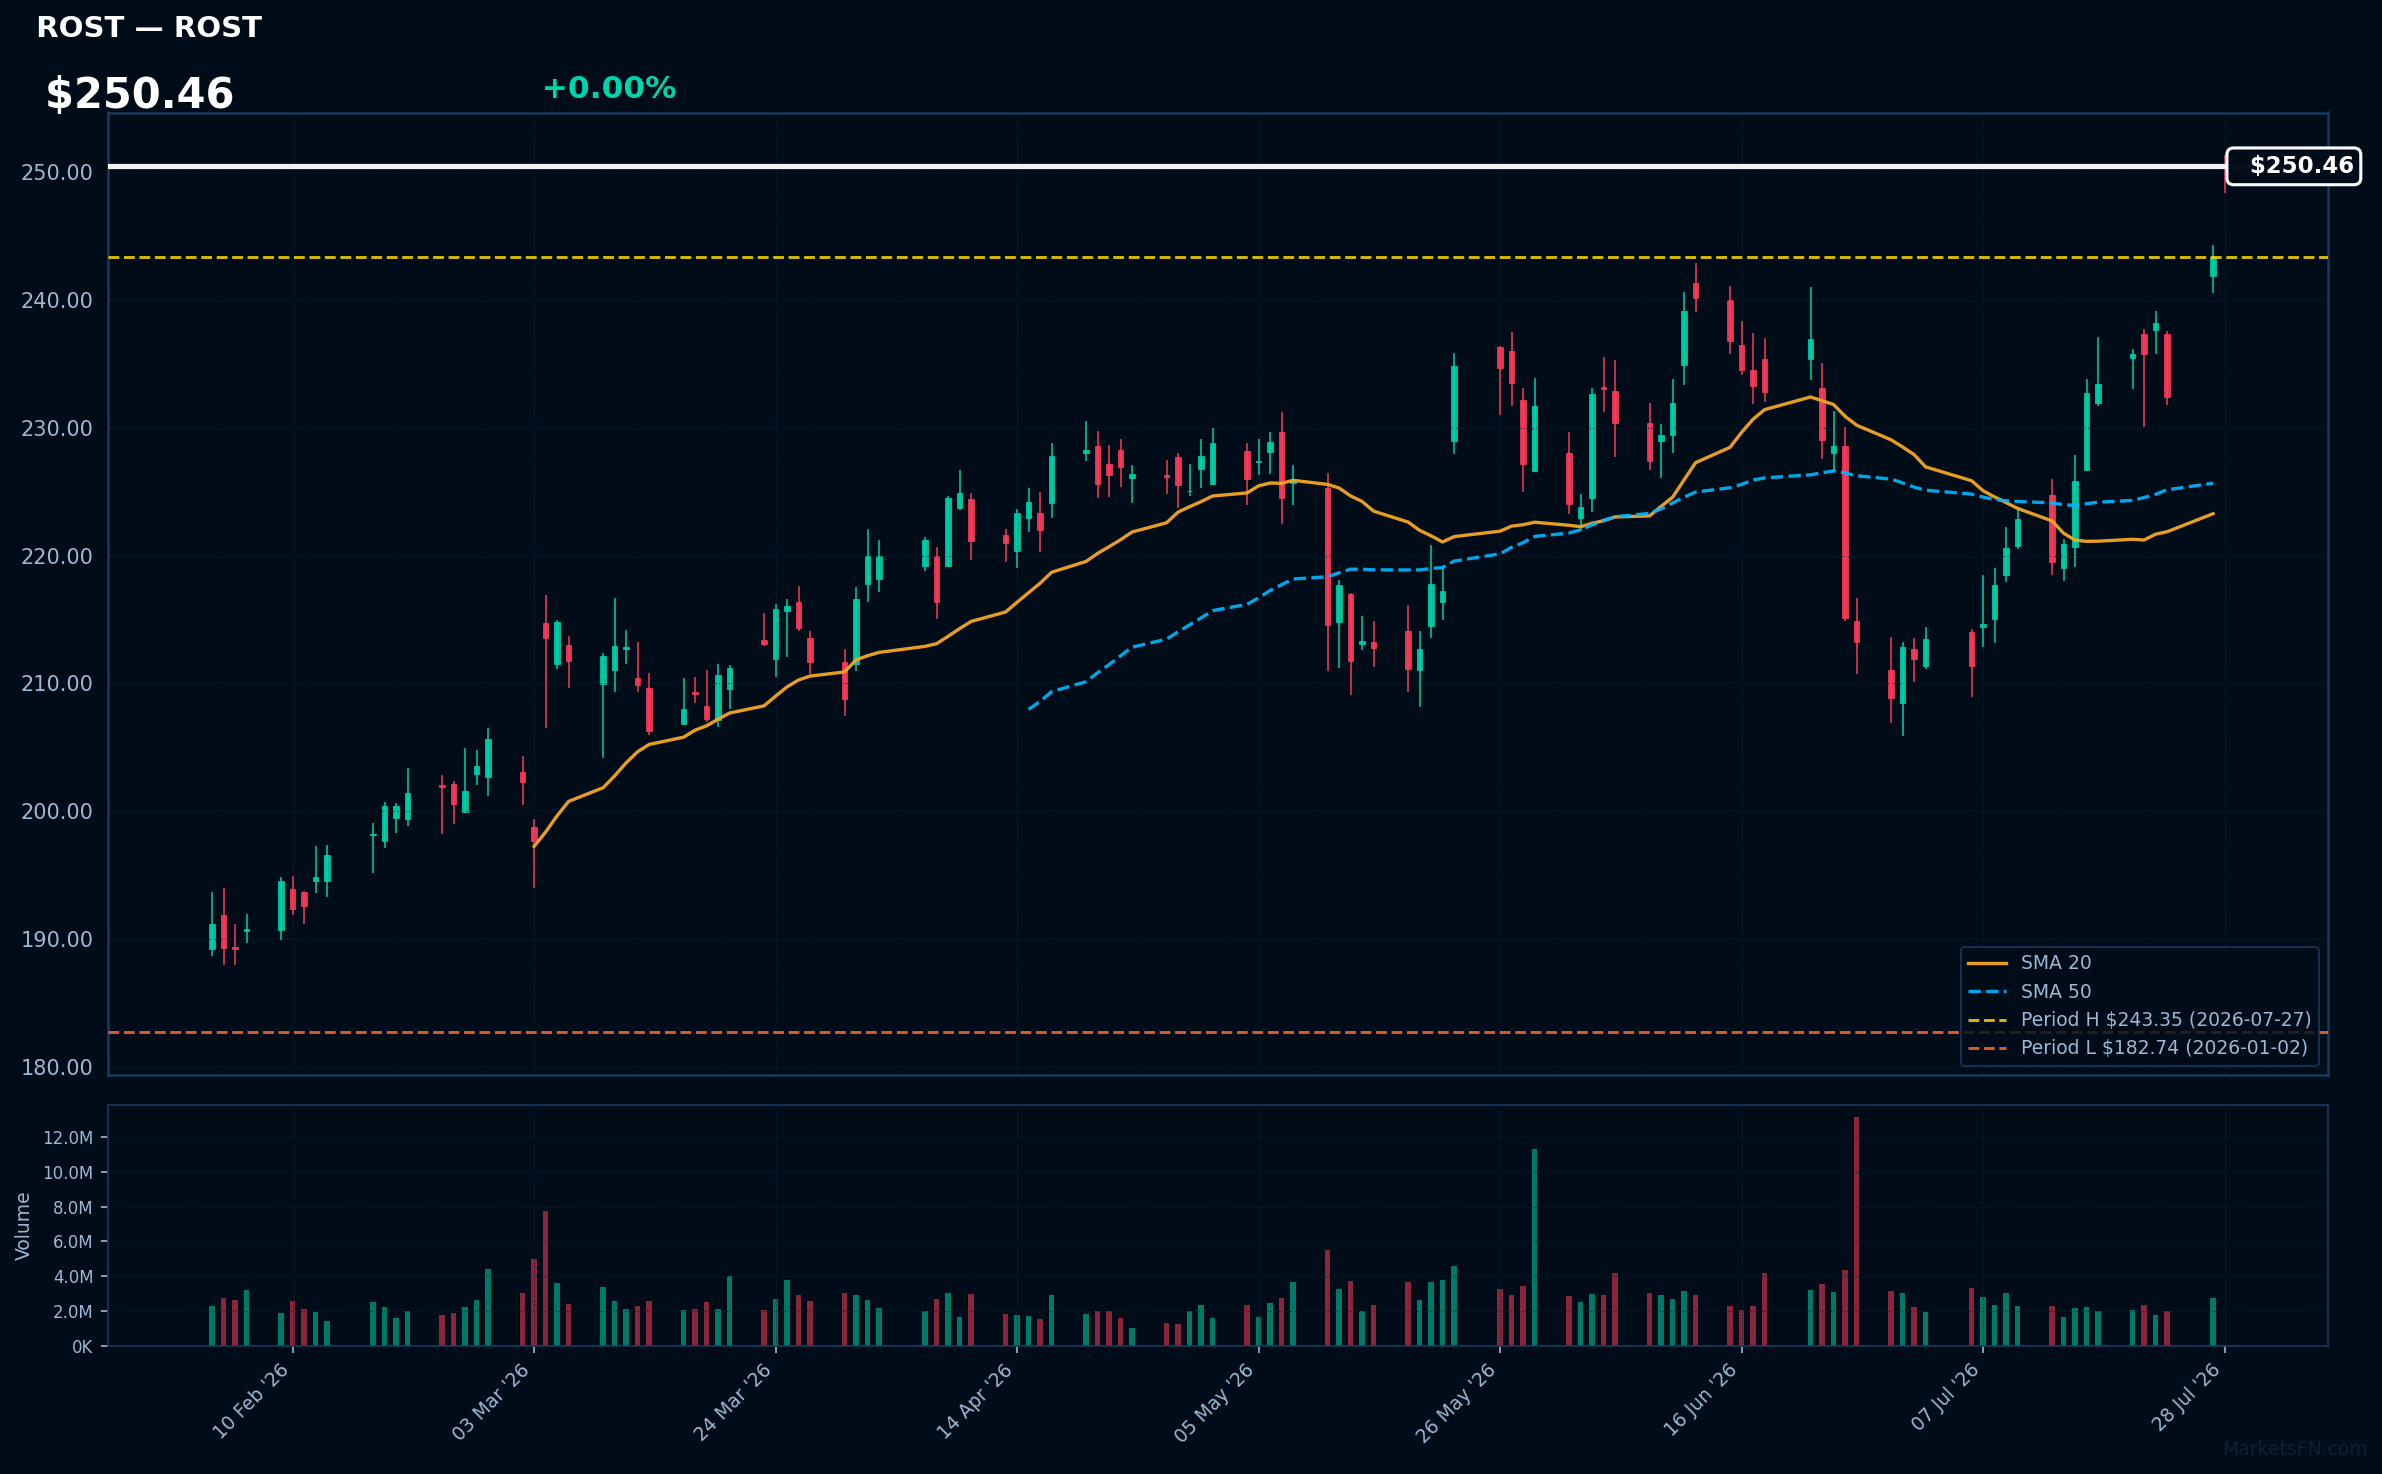
ROST | Ross Stores, Inc | Consumer Cyclical | Price Last: $243.35 | % Realized: +33.17% | RSI: 70.4 | % above MA200: +21.4% | Trend: Above MA20, MA50, MA200
Ross Stores, Inc operates as an off-price retailer, offering discounted apparel, home furnishings, and accessories. Investors should care about its ability to maintain margins and same-store sales growth amidst competitive retail landscape.
Ross Stores, Inc is near a potential breakout, with RSI(14) at 70.4 and price above MA20/MA50/MA200. The stock is 0.0% below its 2026 YTD high, indicating strong momentum; however, high RSI may signal overbought conditions.
Related headlines
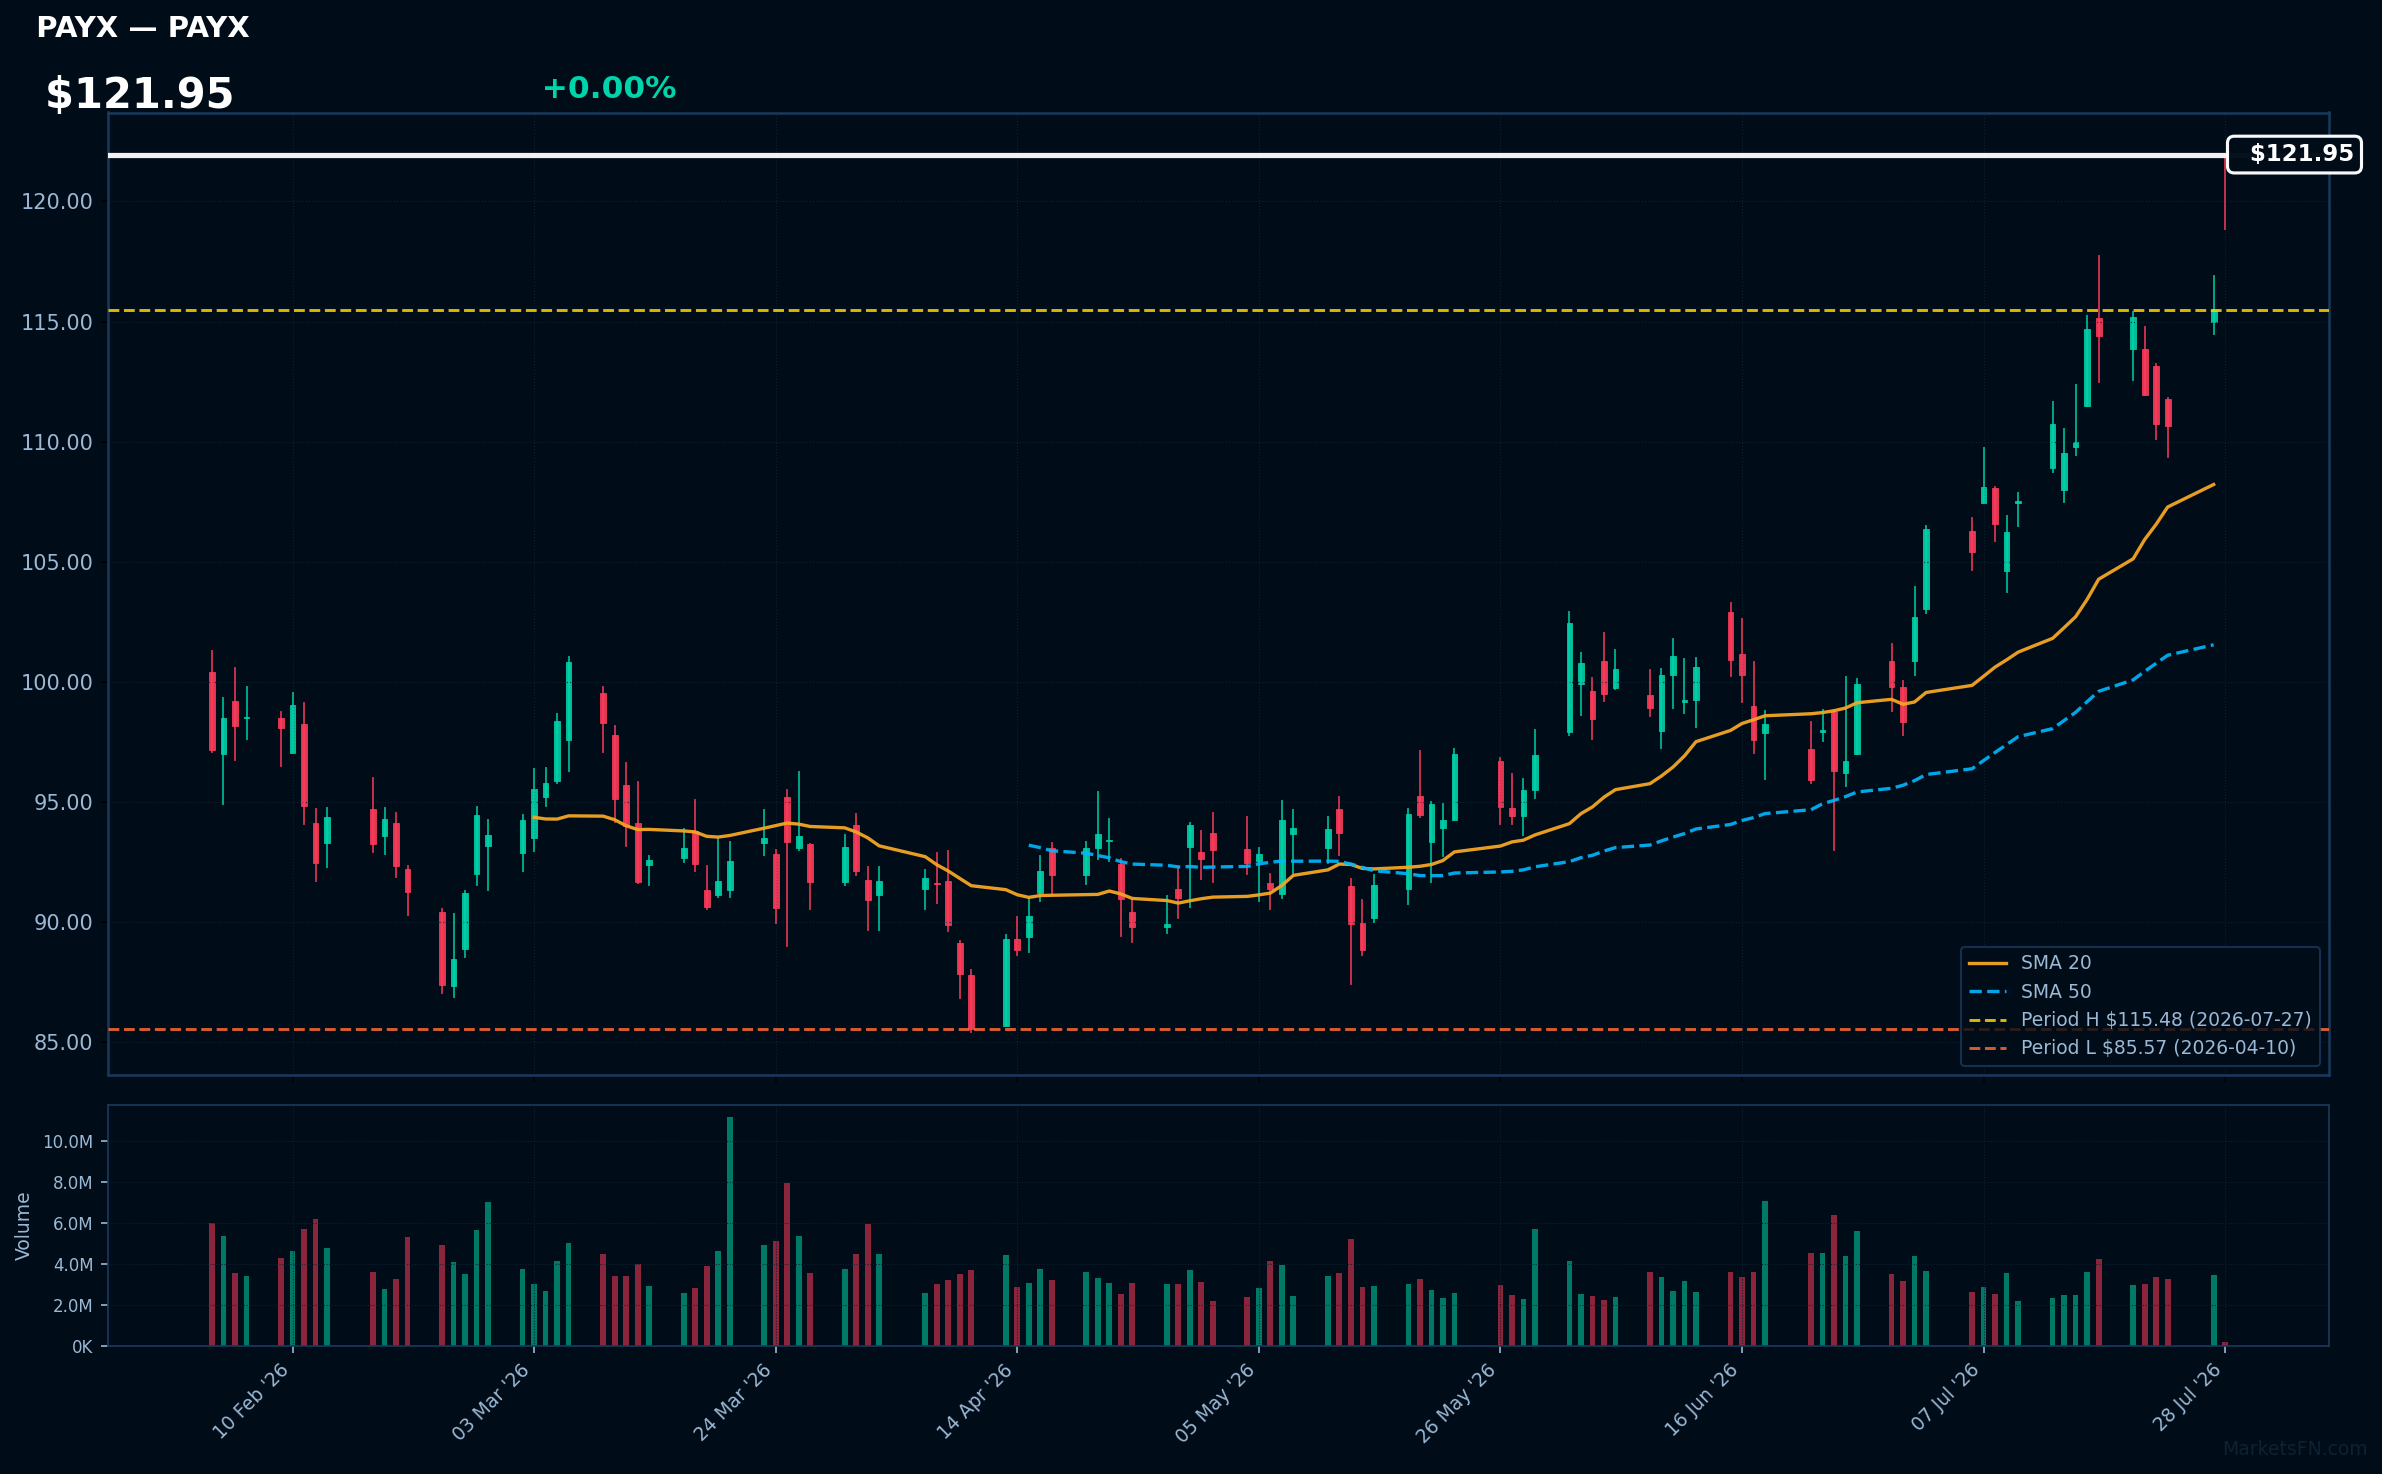
PAYX | Paychex Inc | Technology | Price Last: $115.48 | % Realized: +6.34% | RSI: 74.1 | % above MA200: +11.3% | Trend: Above MA20, MA50, MA200
Paychex Inc provides payroll processing, HR services, and benefits administration to small and medium-sized businesses, helping them manage complex regulatory requirements and administrative tasks, which is crucial as labor laws and tax regulations continue to evolve.
Paychex Inc's RSI(14) is 74.1, indicating strong momentum as it's above MA20, MA50, and MA200. The stock is near its 2026 YTD high, 0.0% below, suggesting a potential breakout; its 6.3% 2026 YTD return reinforces this momentum.
Related headlines
📉 Nearest to 2026 Low
Sectors represented: Healthcare (2), Consumer Cyclical (1), Communication Services (1), Consumer Defensive (1)
| Ticker | Company | Sector | Price Last | % Realized | 2026 YTD Low Date | RSI | % above MA200 | Trend |
|---|---|---|---|---|---|---|---|---|
| TSLA | Tesla Inc | Consumer Cyclical | $309.22 | -29.41% | 2026-07-27 | 26.7 | -25.2% | Below MA20, MA50, MA200 |
| WBD | Warner Bros. Discovery Inc | Communication Services | $25.28 | -11.33% | 2026-07-27 | 39.3 | -4.0% | Below MA20, MA50, MA200 |
| GEHC | GE HealthCare Technologies Inc | Healthcare | $61.12 | -26.20% | 2026-04-29 | 66.1 | -16.4% | Below MA20, MA50, MA200 |
| AZN | Astrazeneca plc ADR | Healthcare | $169.64 | -7.37% | 2026-07-14 | 48.0 | -8.2% | Below MA20, MA50, MA200 |
| PEP | PepsiCo Inc | Consumer Defensive | $139.79 | -1.72% | 2026-07-23 | 58.2 | -6.7% | Above MA20 · Below MA50, MA200 |
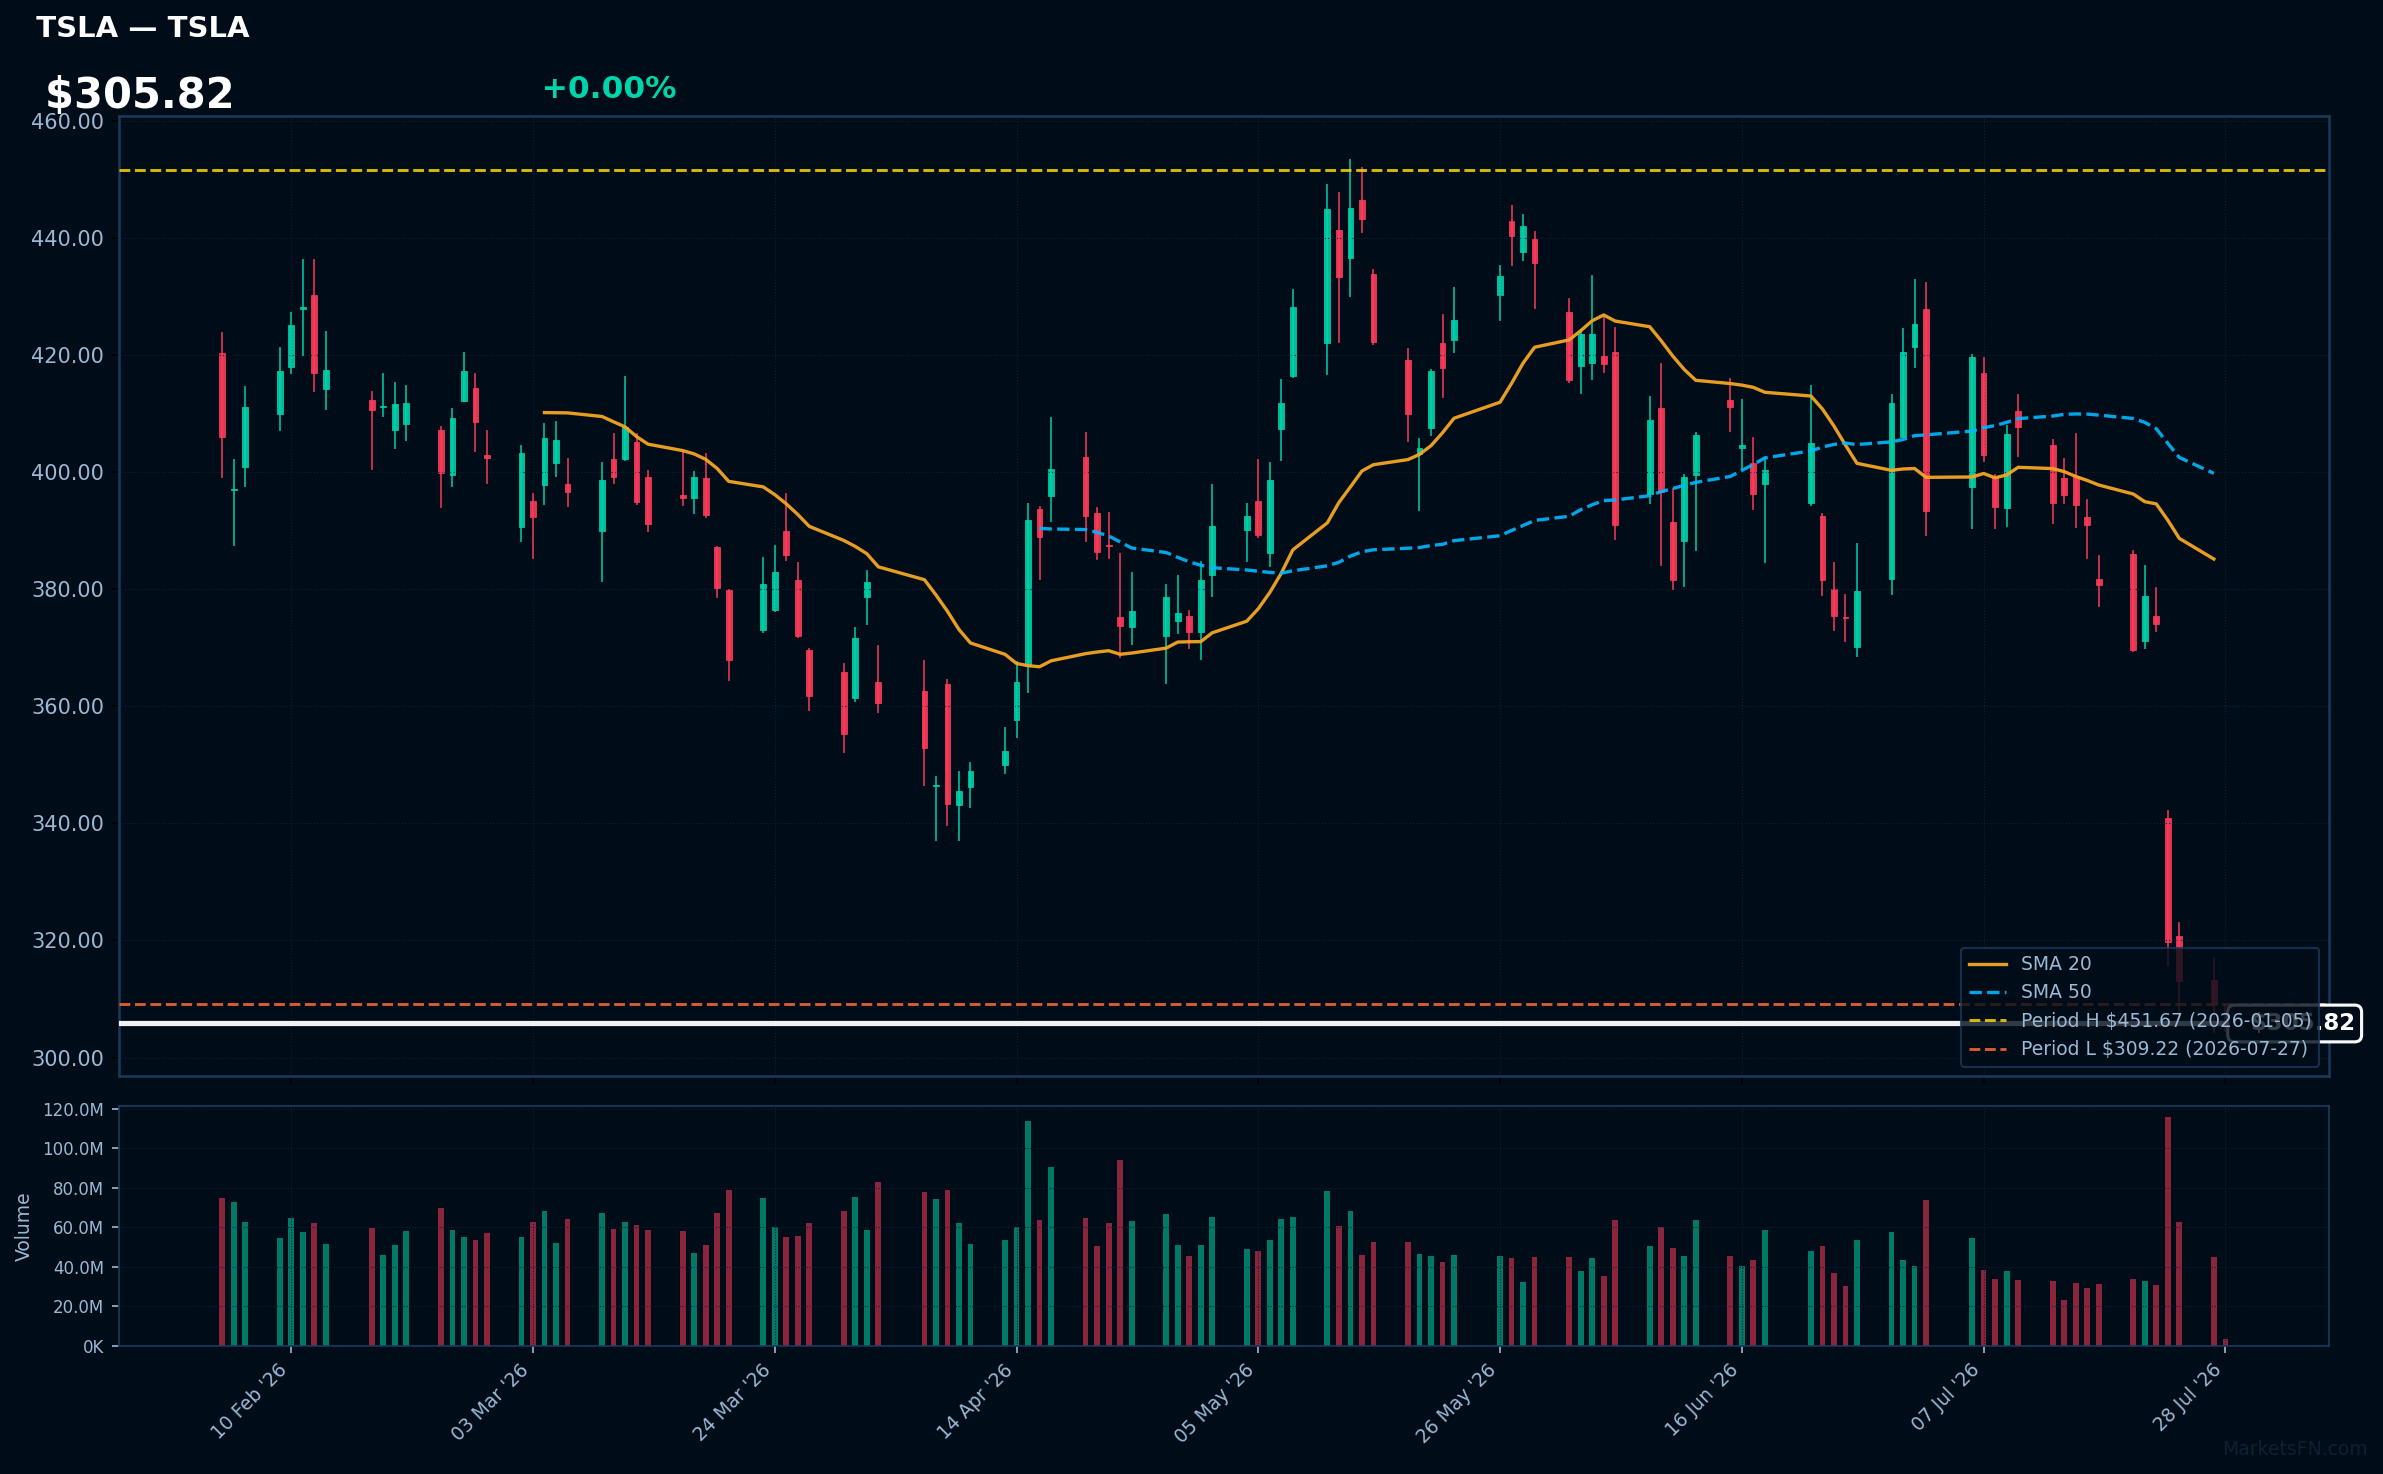
TSLA | Tesla Inc | Consumer Cyclical | Price Last: $309.22 | % Realized: -29.41% | RSI: 26.7 | % above MA200: -25.2% | Trend: Below MA20, MA50, MA200
Tesla Inc is an electric vehicle manufacturer and clean energy company. Investors should care because its innovative products and market leadership in EVs drive growth and disruption in the automotive and energy sectors.
Tesla's technical situation shows a sustained downtrend with price ($305.82) below MA20, MA50, and MA200. RSI(14) is 26.7, near oversold territory. The stock is testing major support at its 2026 YTD low, having fallen 29.4% YTD, indicating a warning sign.
Related headlines
- Direxion unveils options income ETF suite tied to Nvidia, Tesla and other megacap
- Tesla Stock Falls Again, Putting Trillion-Dollar Status at Risk
- Tesla, ContourGlobal sign 1TWh/year PPA for Project Sterling in Arizona
- A Potential Tesla-SpaceX Merger Could Create Orbit-To-Ground AI Powerhouse With Over $1 Trillion In Chip Savings, Says Analyst
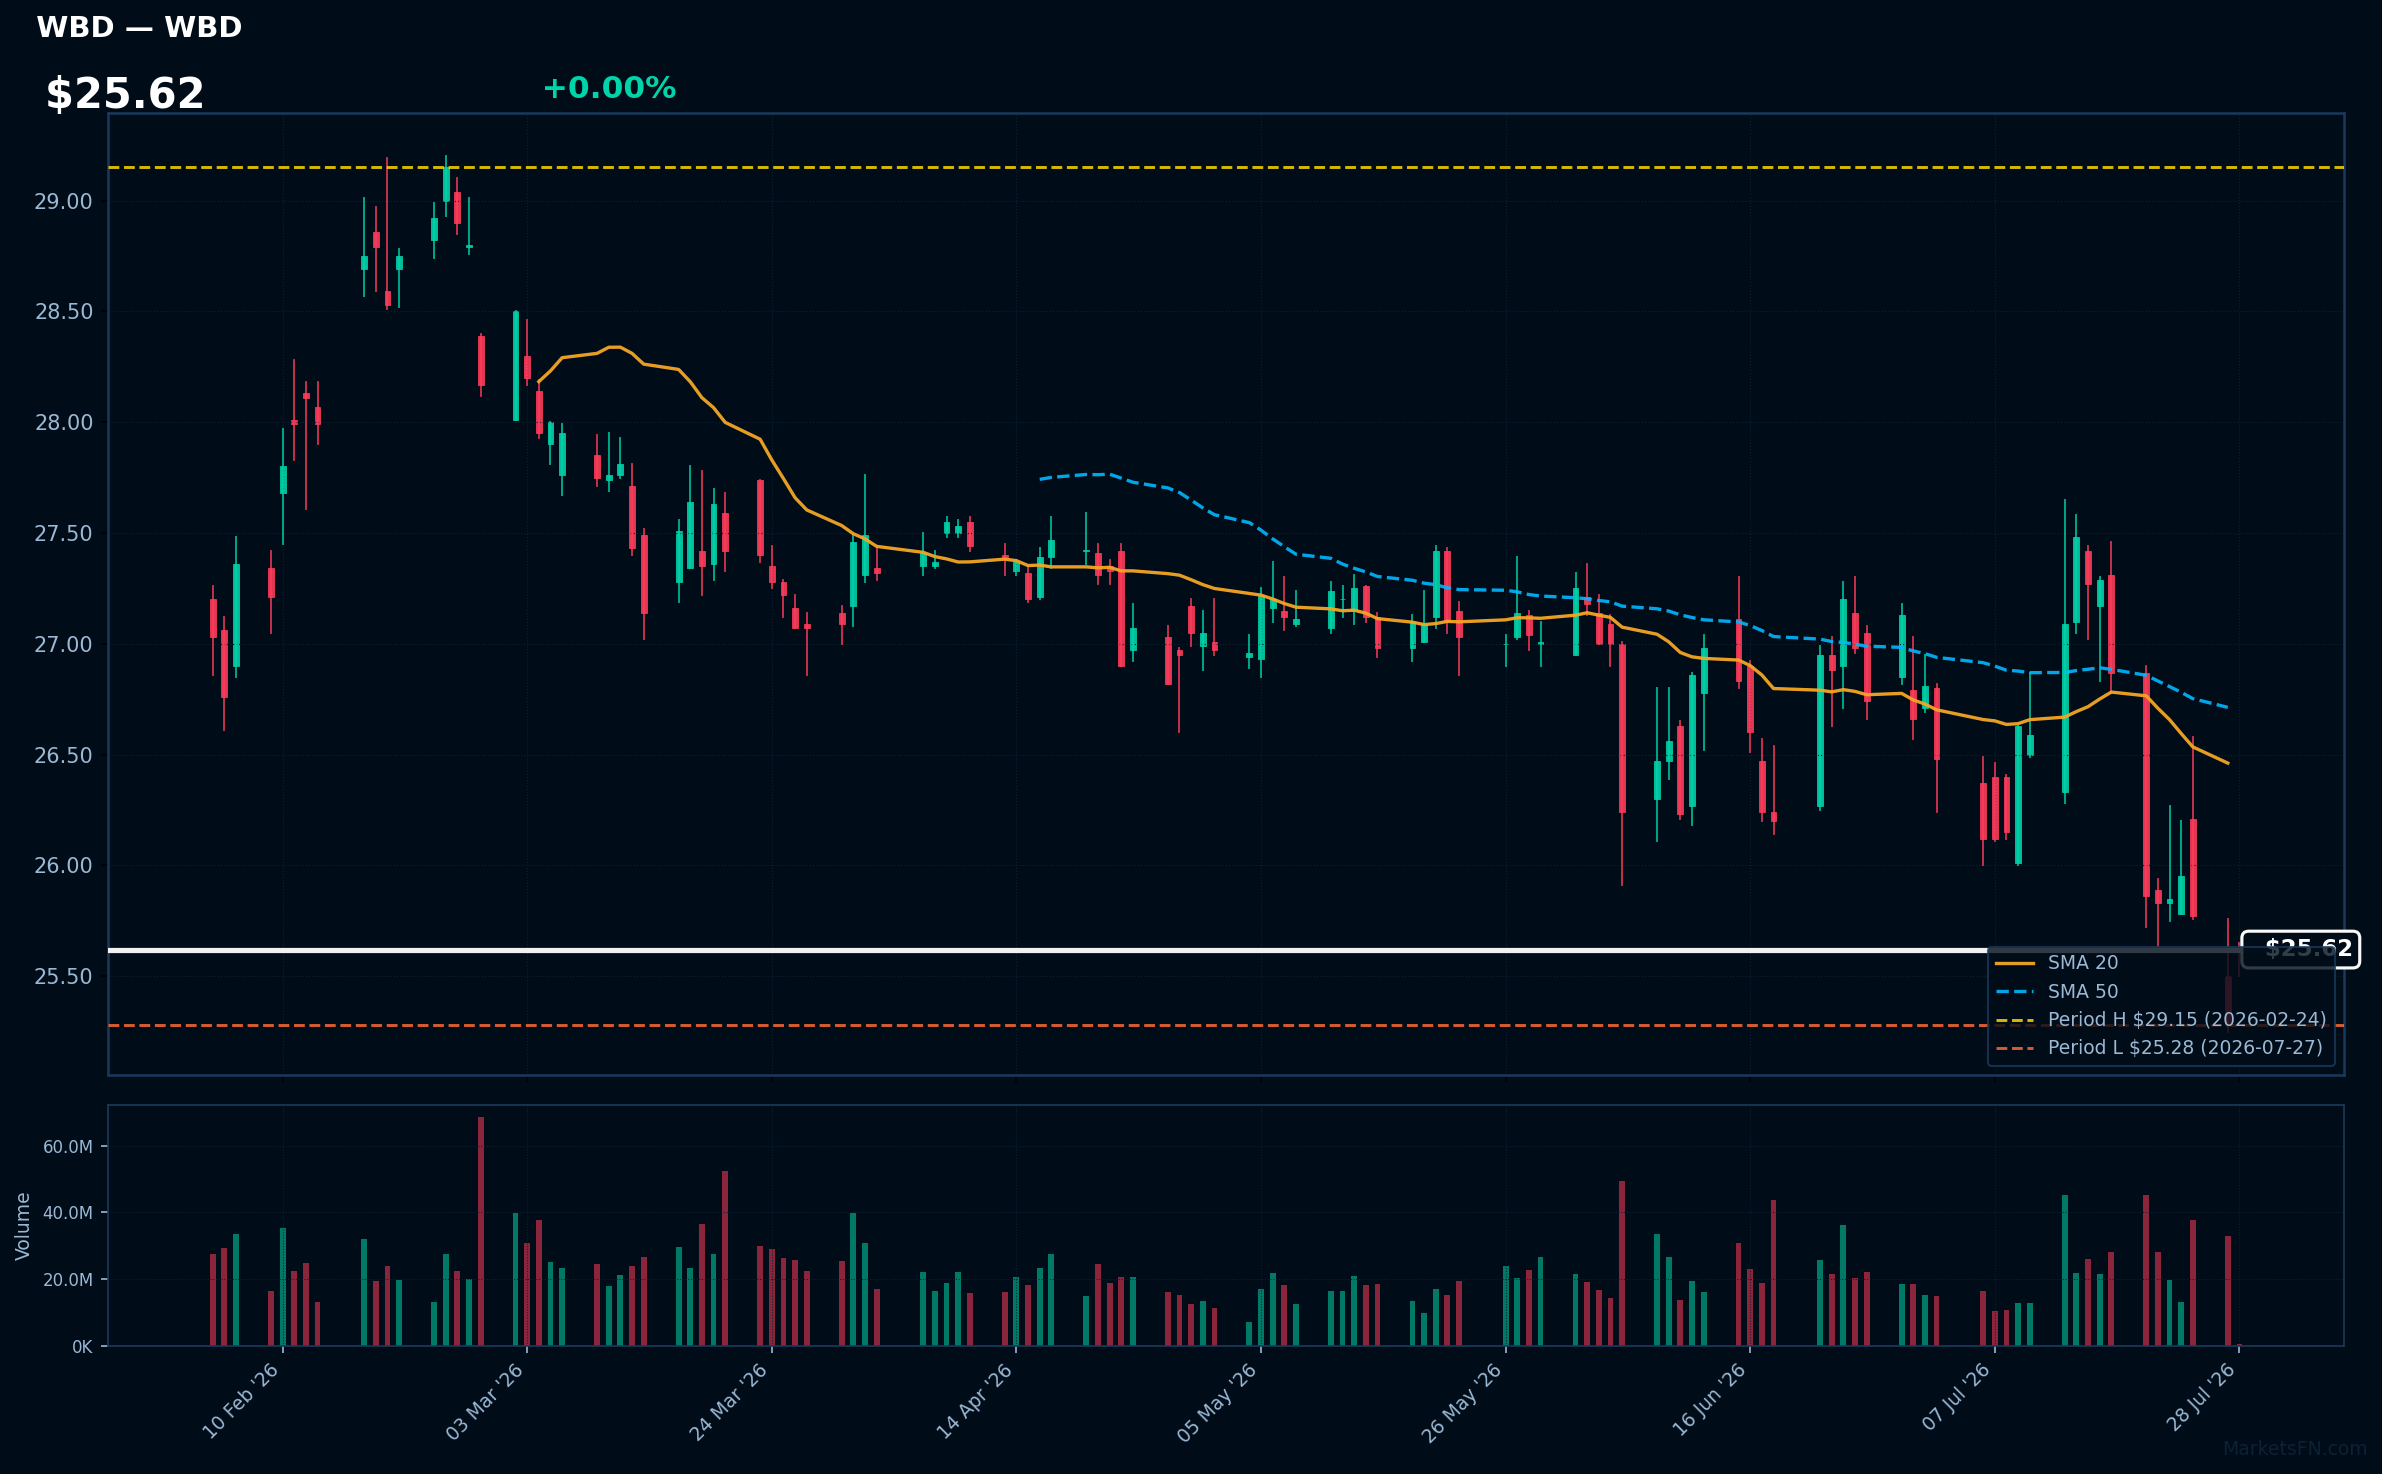
WBD | Warner Bros. Discovery Inc | Communication Services | Price Last: $25.28 | % Realized: -11.33% | RSI: 39.3 | % above MA200: -4.0% | Trend: Below MA20, MA50, MA200
Warner Bros. Discovery Inc is a media conglomerate with a diverse portfolio of entertainment and news assets, including HBO, Warner Bros., and Discovery Channel, making it a significant player in content creation and distribution, which is crucial for investors tracking the media industry's evolution.
Warner Bros. Discovery Inc's current technical situation is bearish, with an RSI(14) of 39.3 indicating oversold conditions, and the stock price below MA20, MA50, and MA200, signaling potential further downside; it's currently testing major support at its 2026 YTD low.
Related headlines
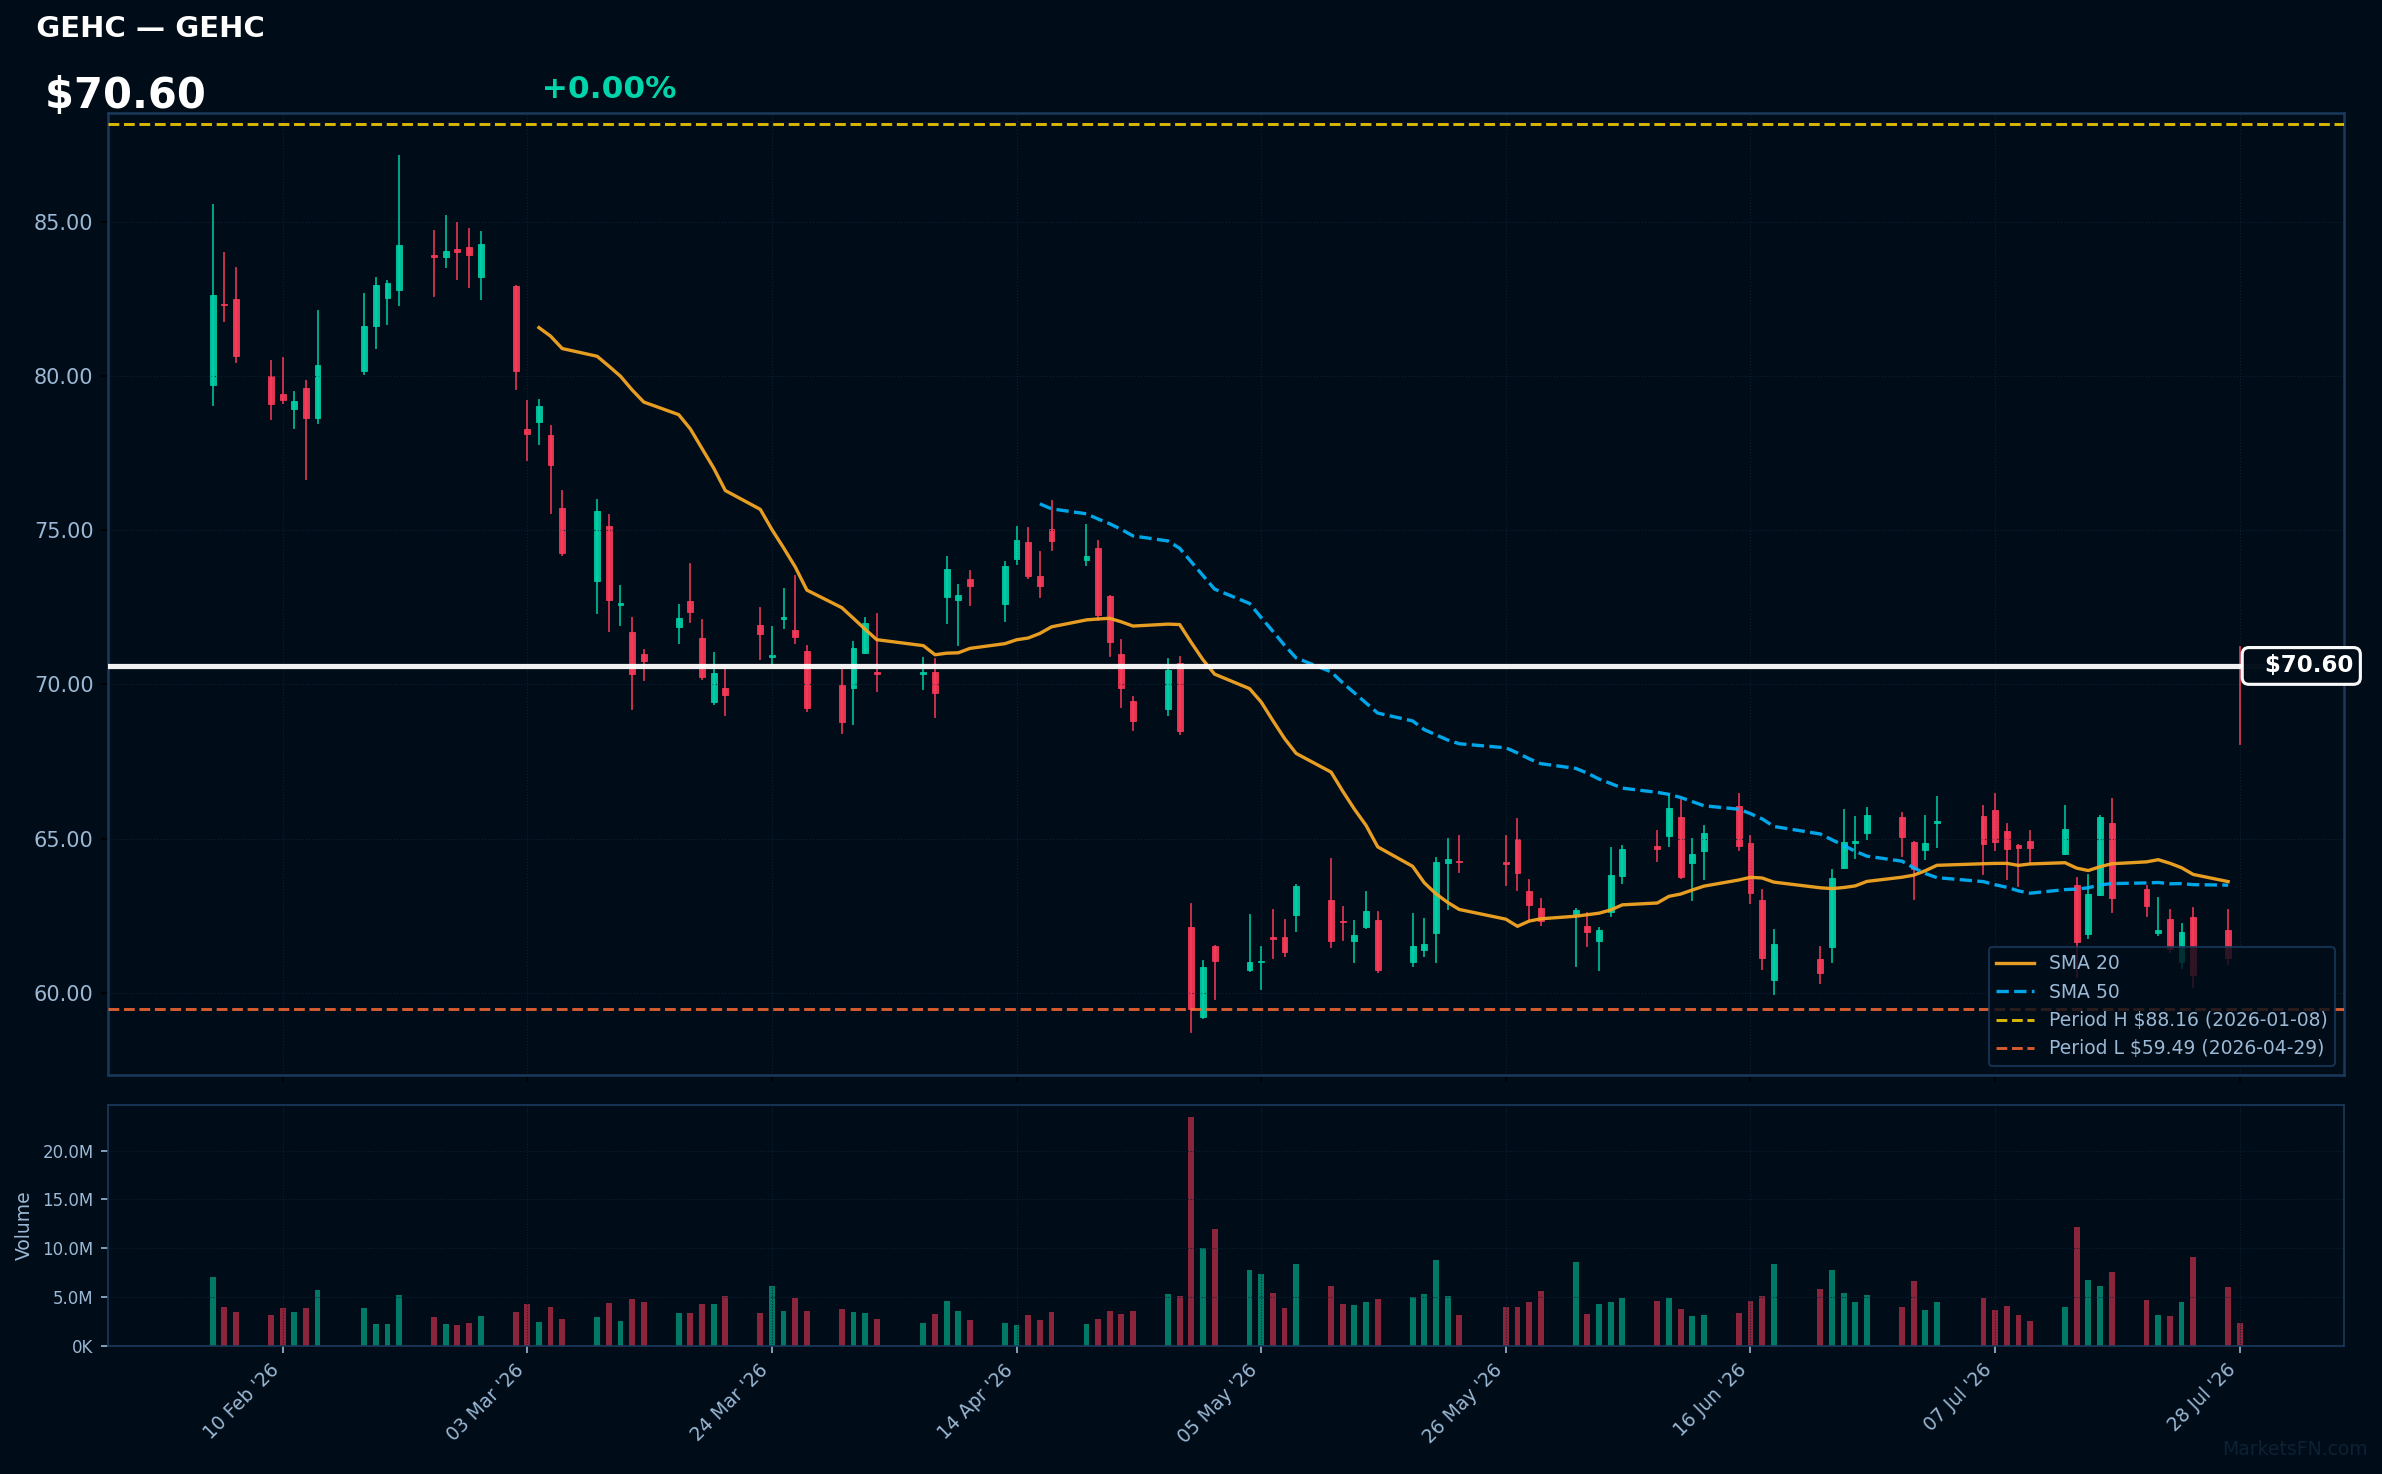
GEHC | GE HealthCare Technologies Inc | Healthcare | Price Last: $61.12 | % Realized: -26.20% | RSI: 66.1 | % above MA200: -16.4% | Trend: Below MA20, MA50, MA200
GE HealthCare Technologies Inc is a healthcare technology company; investors should care about its performance as it indicates the company's ability to innovate and serve the growing healthcare market.
GEHC's RSI is 66.1, indicating rising momentum; it's above MA20/MA50 but below MA200. Being only 2.7% above its 2026 YTD low, it tests major support, showing mixed signals.
Related headlines
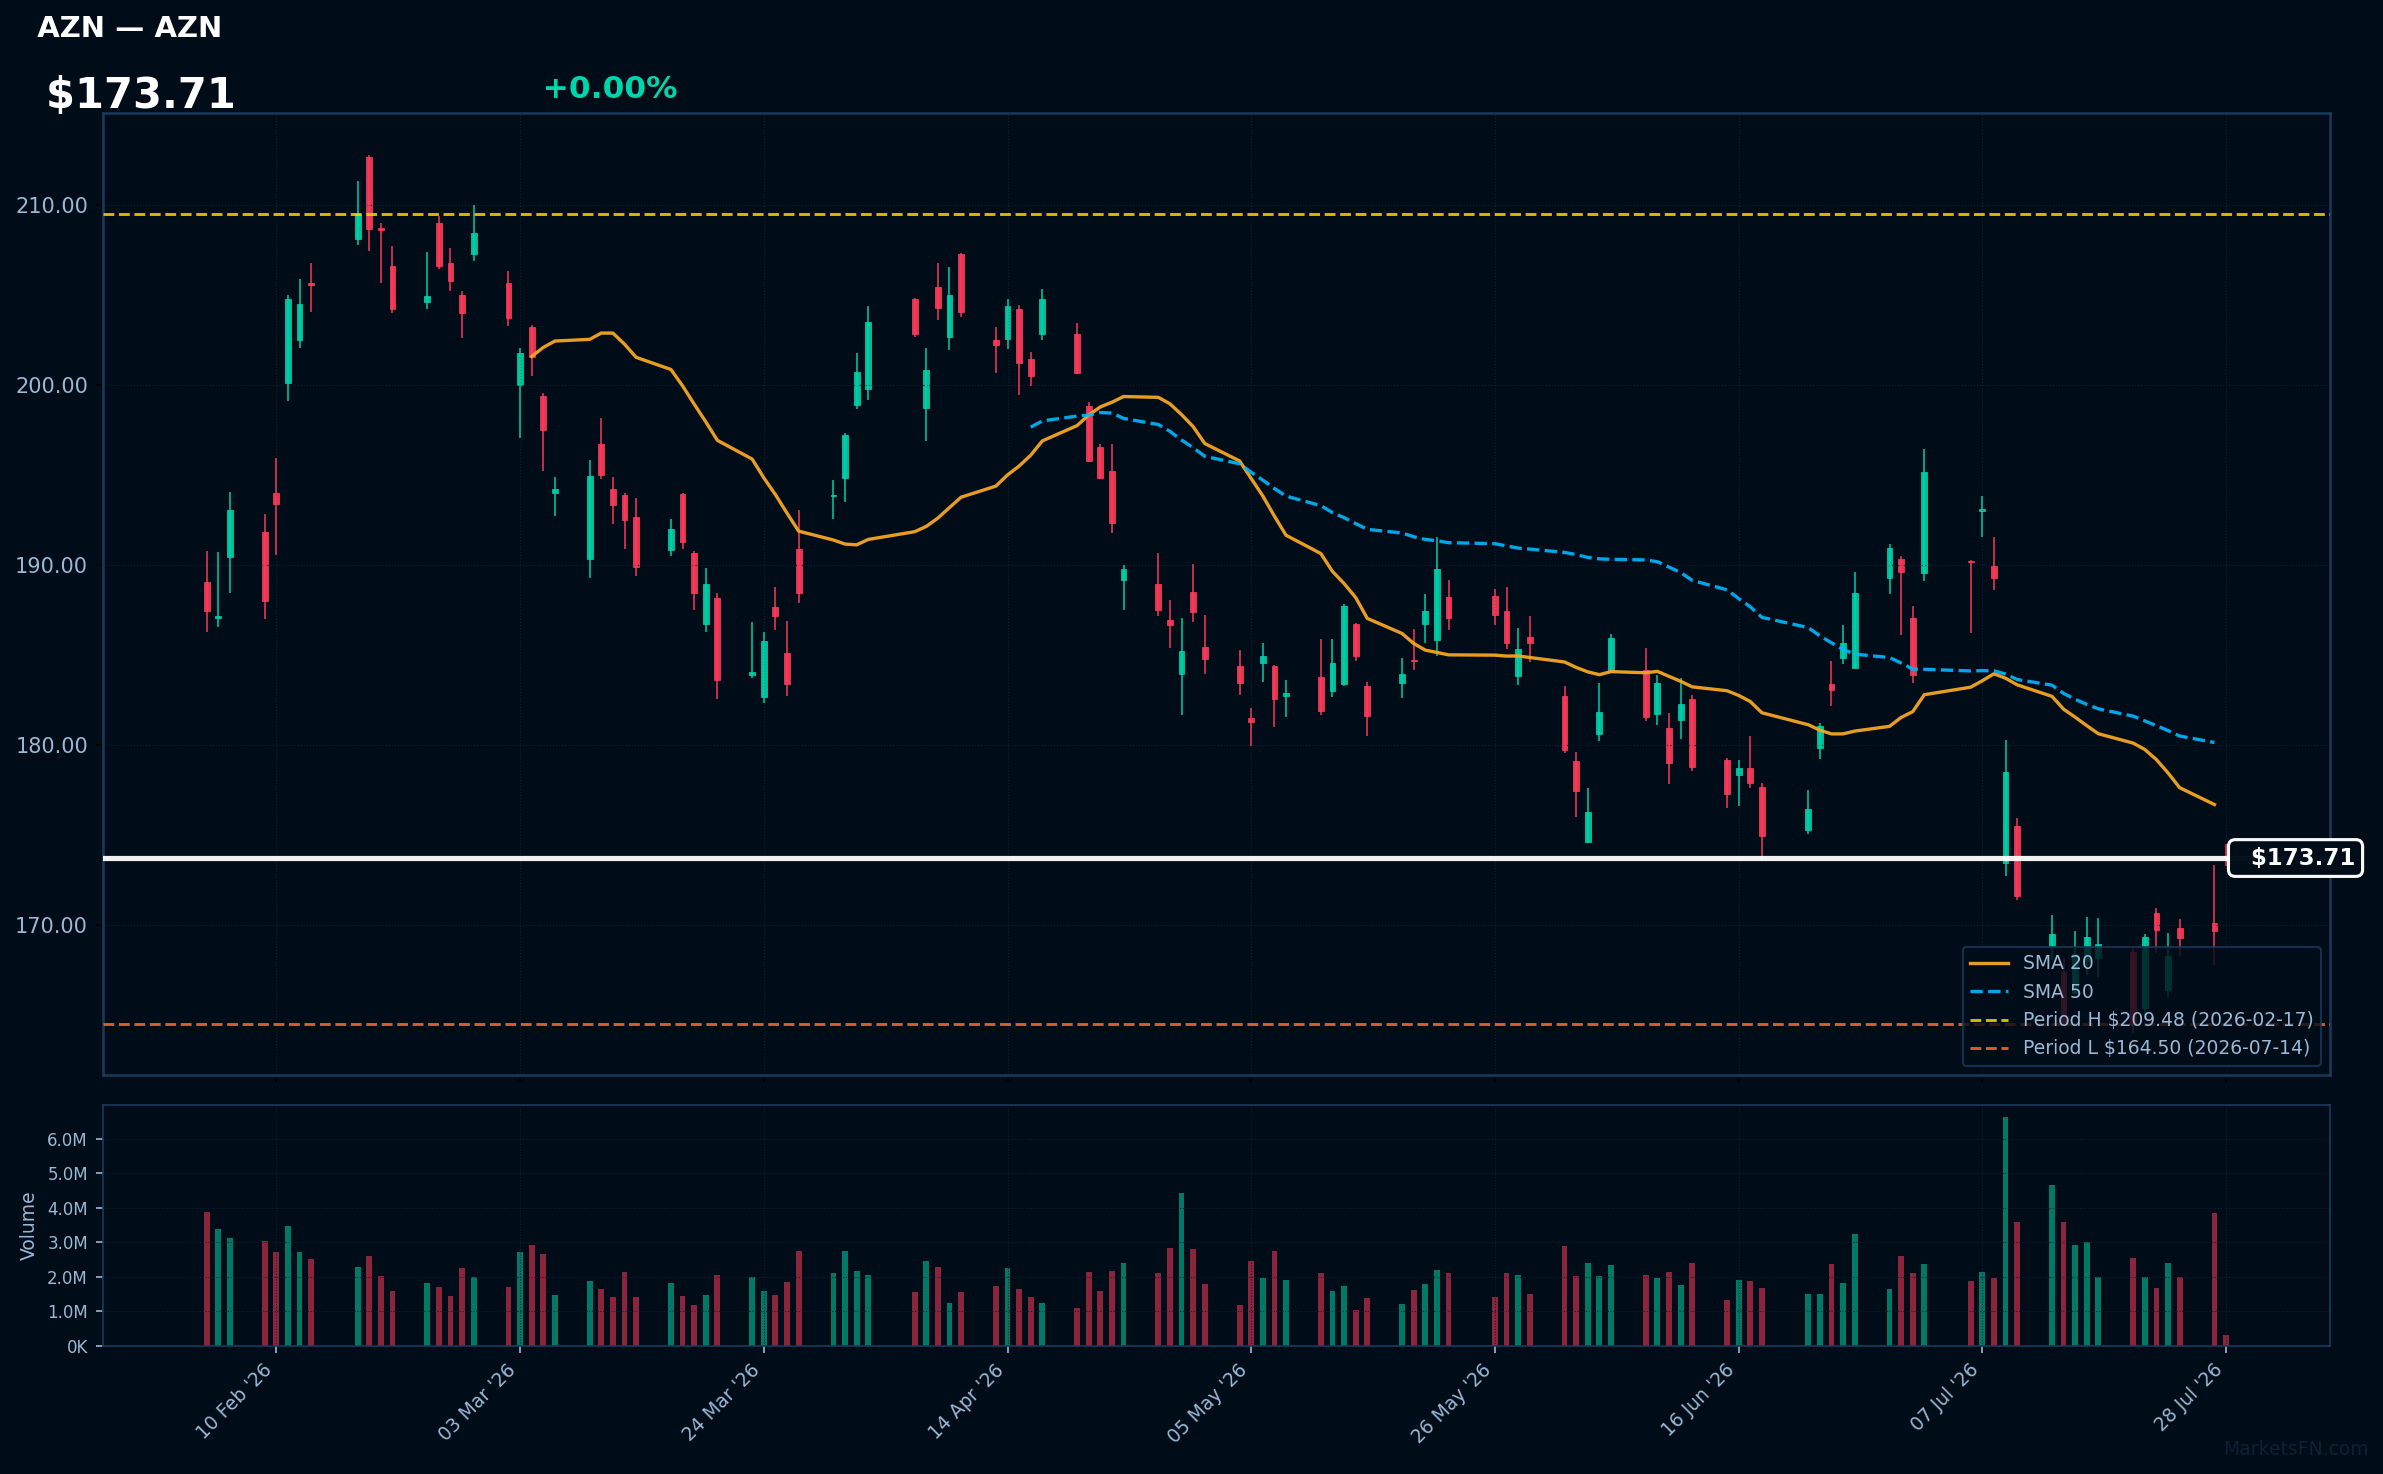
AZN | Astrazeneca plc ADR | Healthcare | Price Last: $169.64 | % Realized: -7.37% | RSI: 48.0 | % above MA200: -8.2% | Trend: Below MA20, MA50, MA200
Astrazeneca plc ADR is a biopharmaceutical company that develops and commercializes medicines for various therapeutic areas, including oncology, cardiovascular, and respiratory diseases. Investors care due to its pipeline and market presence in life-saving treatments.
Astrazeneca's current technical situation shows a sustained downtrend with price ($173.71) below MA20, MA50, and MA200. RSI(14) is 48.0, nearing oversold territory. The stock is 3.1% above its 2026 YTD low, indicating a potential support test, with a -7.4% 2026 YTD return.
Related headlines
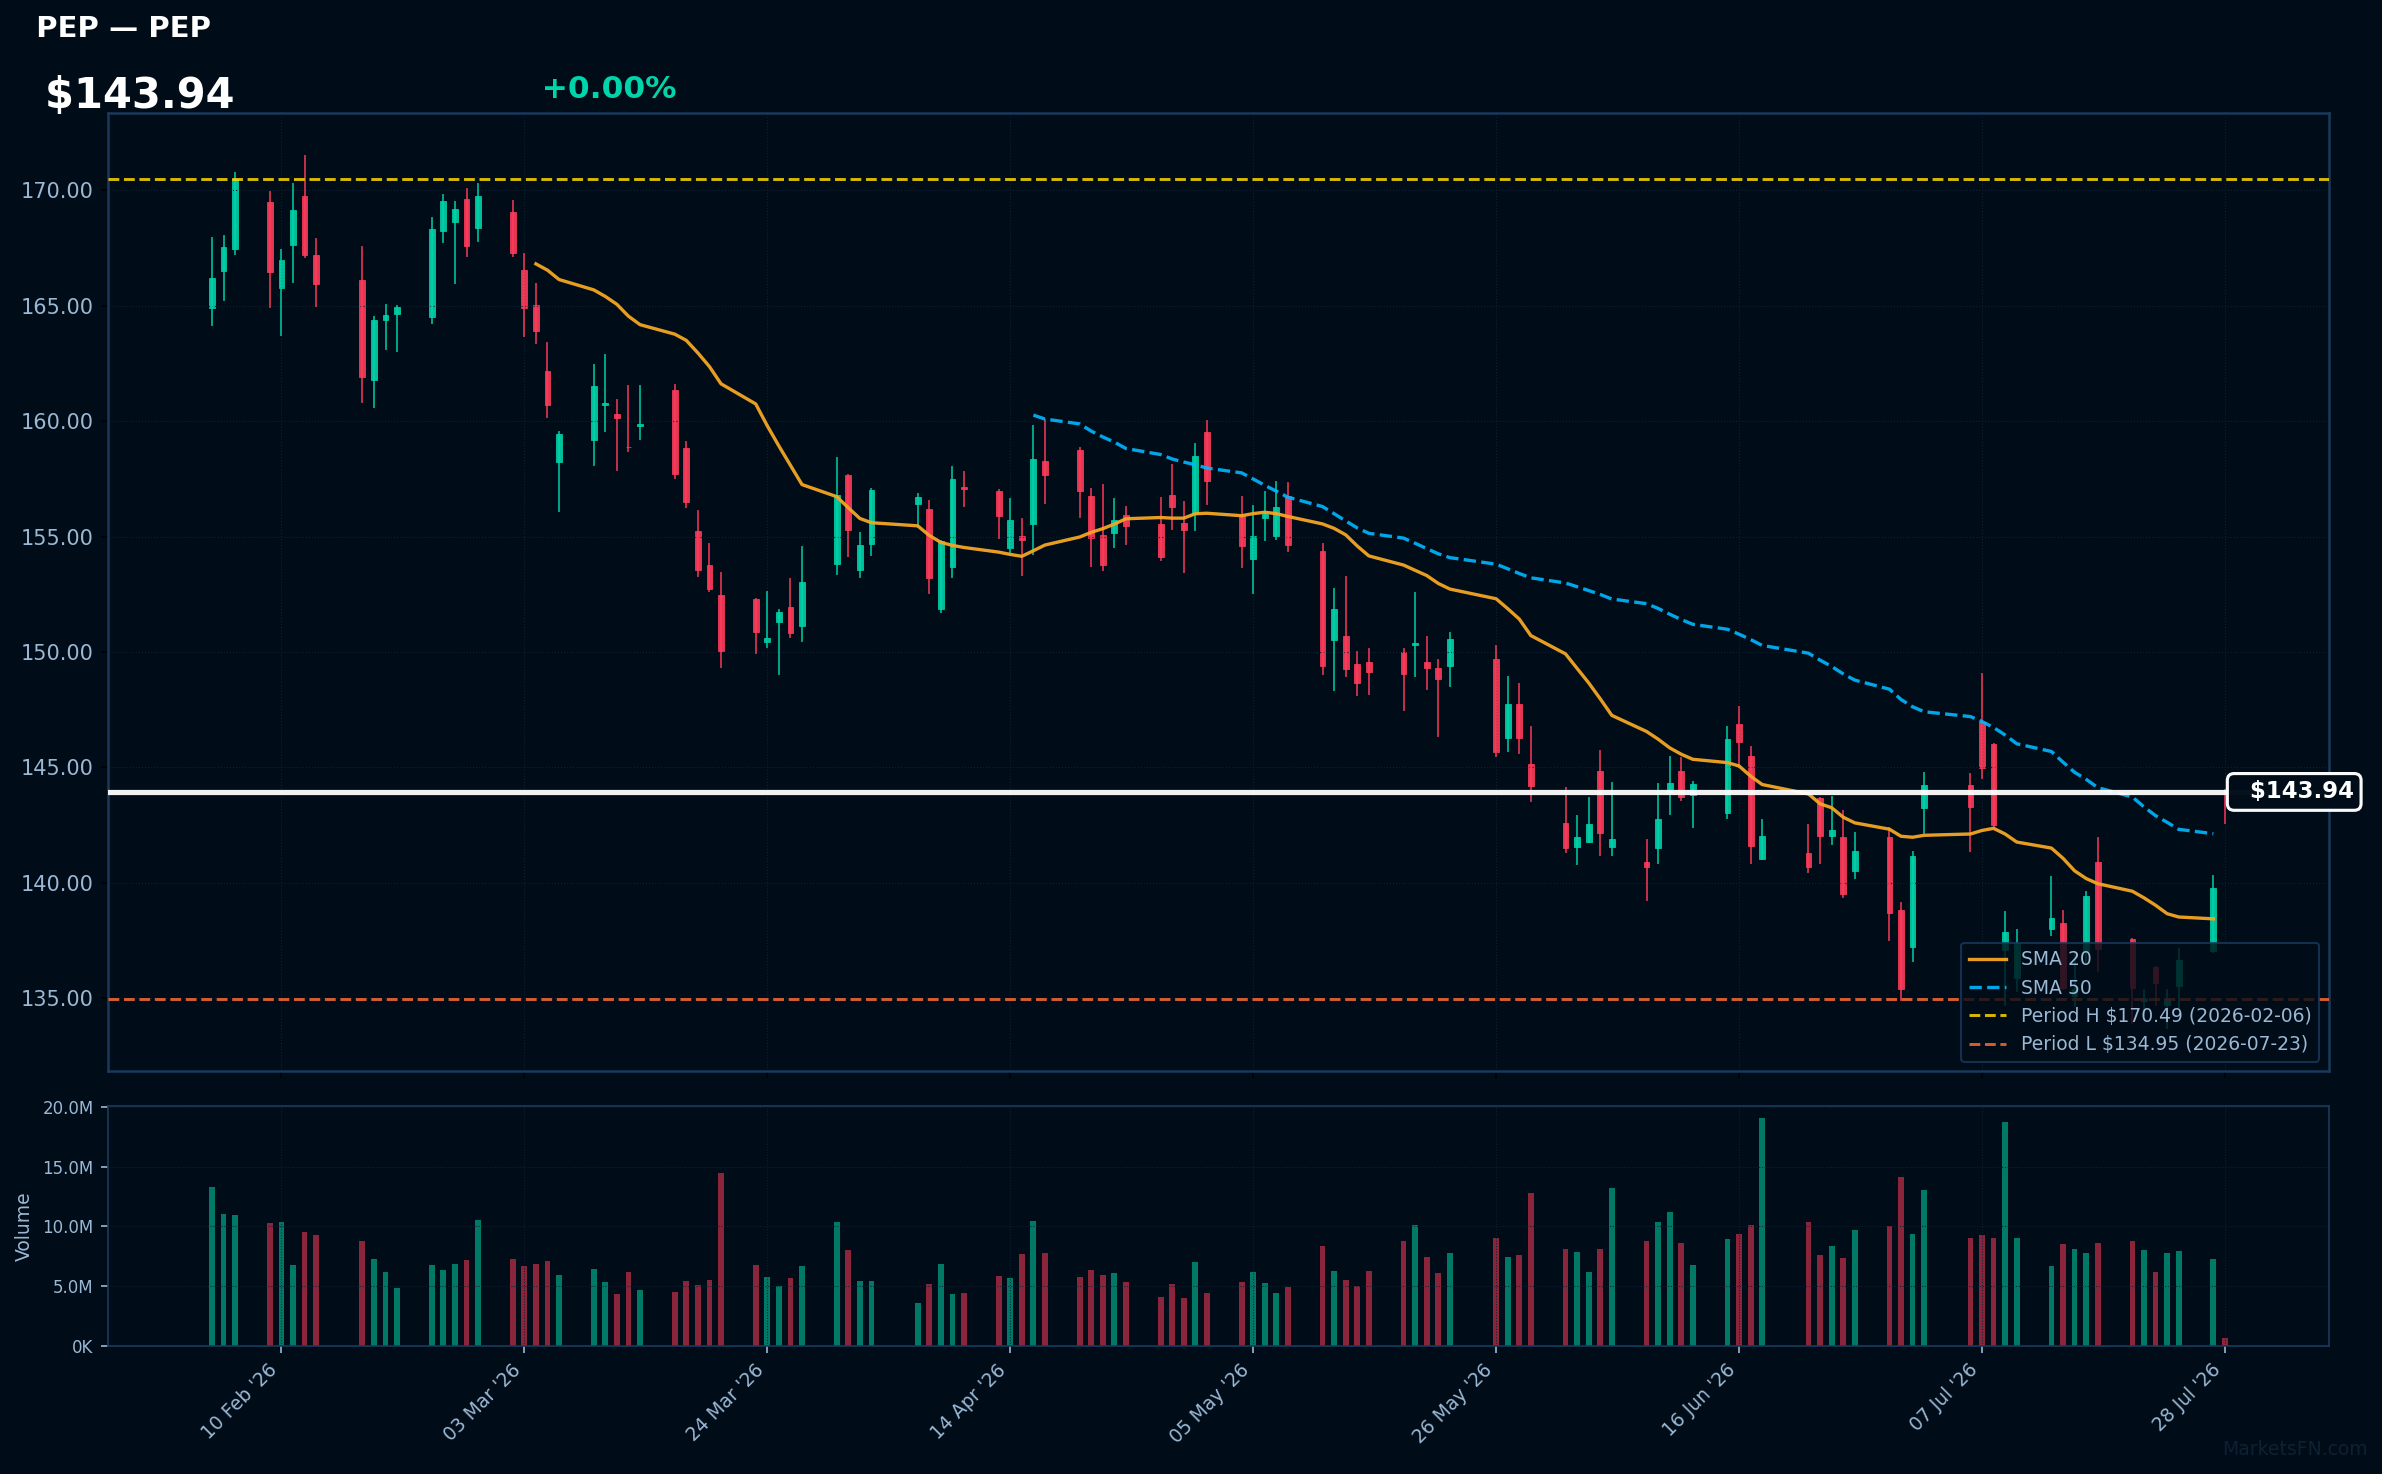
PEP | PepsiCo Inc | Consumer Defensive | Price Last: $139.79 | % Realized: -1.72% | RSI: 58.2 | % above MA200: -6.7% | Trend: Above MA20 · Below MA50, MA200
PepsiCo Inc is a diversified food and beverage company with brands like Pepsi, Lay's, and Gatorade, generating revenue through beverage sales, snack foods, and other categories, making it a significant player in the consumer staples sector.
PepsiCo's current technical situation shows mixed signals: RSI(14) at 58.2, price above MA20/MA50 but below MA200. It's 3.6% above its 2026 YTD low, indicating a test of major support with a -1.7% 2026 YTD return, suggesting a potential warning sign.
Related headlines
Market Commentary
The provided data indicates that certain Nasdaq 100 stocks are near their 2026 year-to-date (YTD) extremes. Stocks like AAPL, CTAS, PCAR, ROST, and PAYX are at their 2026 YTD highs, while TSLA and WBD are at their YTD lows, with GEHC, AZN, and PEP slightly above their lows.
The technology sector and related stocks are influenced by various macro conditions and themes. The fact that some stocks are at their YTD highs or lows may be driven by factors such as earnings reports, industry trends, and overall market sentiment. For instance, the performance of AAPL, a technology giant, being at its YTD high, could be indicative of positive sentiment towards the tech sector.
Investors and traders should monitor the factors driving these stocks to their extremes, including upcoming earnings reports, macroeconomic indicators, and sector-specific news. Watching how stocks like TSLA and WBD, currently at their YTD lows, respond to potential catalysts could provide insights into the broader market direction. The slight recovery of GEHC, AZN, and PEP from their YTD lows also warrants observation for potential trend reversals or continuations.
Methodology: All 101 Nasdaq 100 constituents screened. Close prices downloaded from 2026-01-01. Period high = highest close since Jan 1 2026; period low = lowest close since Jan 1 2026. Distance = (current price / period extreme − 1) × 100. Technical indicators computed on up to 1 year of daily OHLCV data.
Disclaimer: For informational purposes only. Not investment advice. Past performance is not indicative of future results.

