Nasdaq 100 2026 YTD Highs & Lows Radar: Automatic Data Processing (ADP), Tesla (TSLA) and more
MarketsFN Team

Nasdaq 100 2026 YTD Highs & Lows Radar: Automatic Data Processing (ADP), Tesla (TSLA) and more
Screening all 101 Nasdaq 100 constituents for stocks nearest to their 2026 year-to-date high and their 2026 YTD low. Data as of July 30, 2026. % Realized = total return since Jan 1 2026.
Legend: RSI > 70 = overbought · RSI < 30 = oversold · Green % Realized = positive YTD return · Red = negative.
📈 Nearest to 2026 High
Sectors represented: Technology (2), Industrials (1), Consumer Defensive (1), Consumer Cyclical (1)
| Ticker | Company | Sector | Price Last | % Realized | 2026 YTD High Date | RSI | % above MA200 | Trend |
|---|---|---|---|---|---|---|---|---|
| ADP | Automatic Data Processing Inc | Technology | $273.37 | +8.10% | 2026-07-29 | 64.9 | +15.8% | Above MA20, MA50, MA200 |
| CTAS | Cintas Corporation | Industrials | $216.53 | +17.12% | 2026-07-29 | 65.0 | +17.1% | Above MA20, MA50, MA200 |
| MDLZ | Mondelez International Inc | Consumer Defensive | $64.99 | +21.14% | 2026-07-29 | 58.2 | +10.8% | Above MA20, MA50, MA200 |
| ROST | Ross Stores, Inc | Consumer Cyclical | $251.96 | +37.88% | 2026-07-29 | 70.0 | +24.8% | Above MA20, MA50, MA200 |
| PAYX | Paychex Inc | Technology | $122.13 | +12.46% | 2026-07-29 | 64.6 | +17.8% | Above MA20, MA50, MA200 |
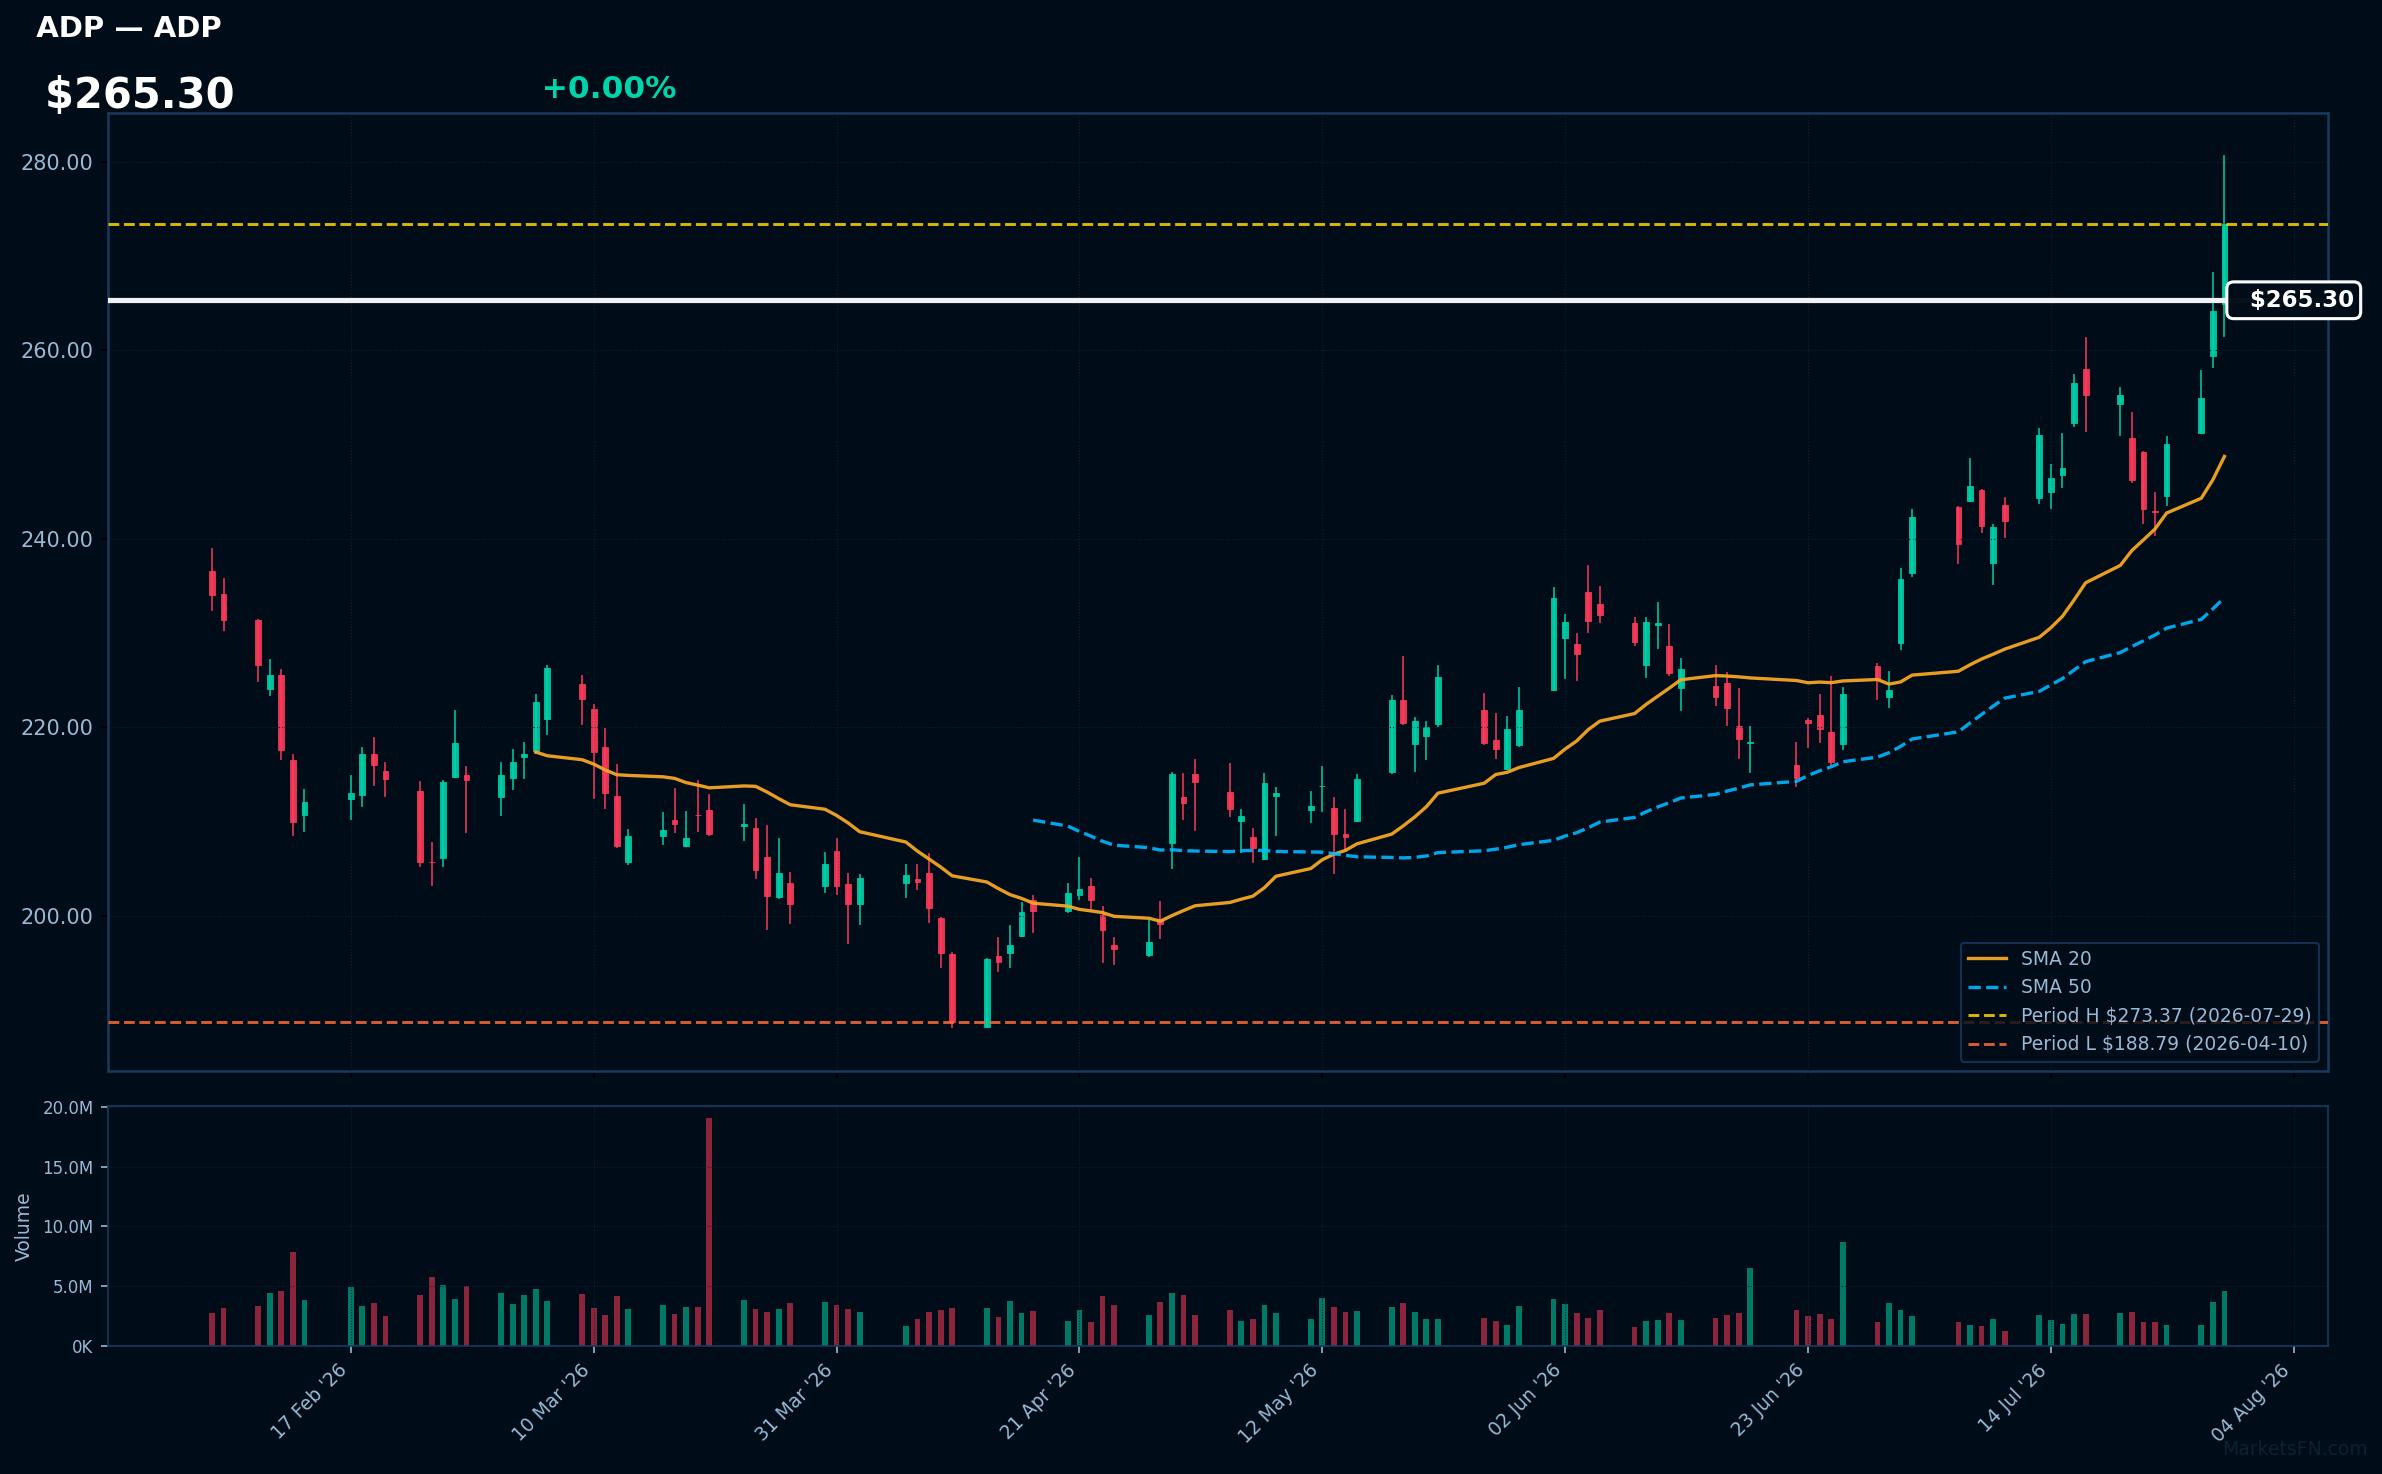
ADP | Automatic Data Processing Inc | Technology | Price Last: $273.37 | % Realized: +8.10% | RSI: 64.9 | % above MA200: +15.8% | Trend: Above MA20, MA50, MA200
Automatic Data Processing Inc provides payroll processing, human capital management, and data analytics services, making it a critical infrastructure player for businesses; investors care about its stable revenue growth and market dominance.
The stock's RSI(14) is 64.9, indicating moderate momentum; it's above MA20, MA50, and MA200, showing a bullish trend. With the price 0.0% below its 2026 YTD high, it suggests a potential breakout.
Related headlines
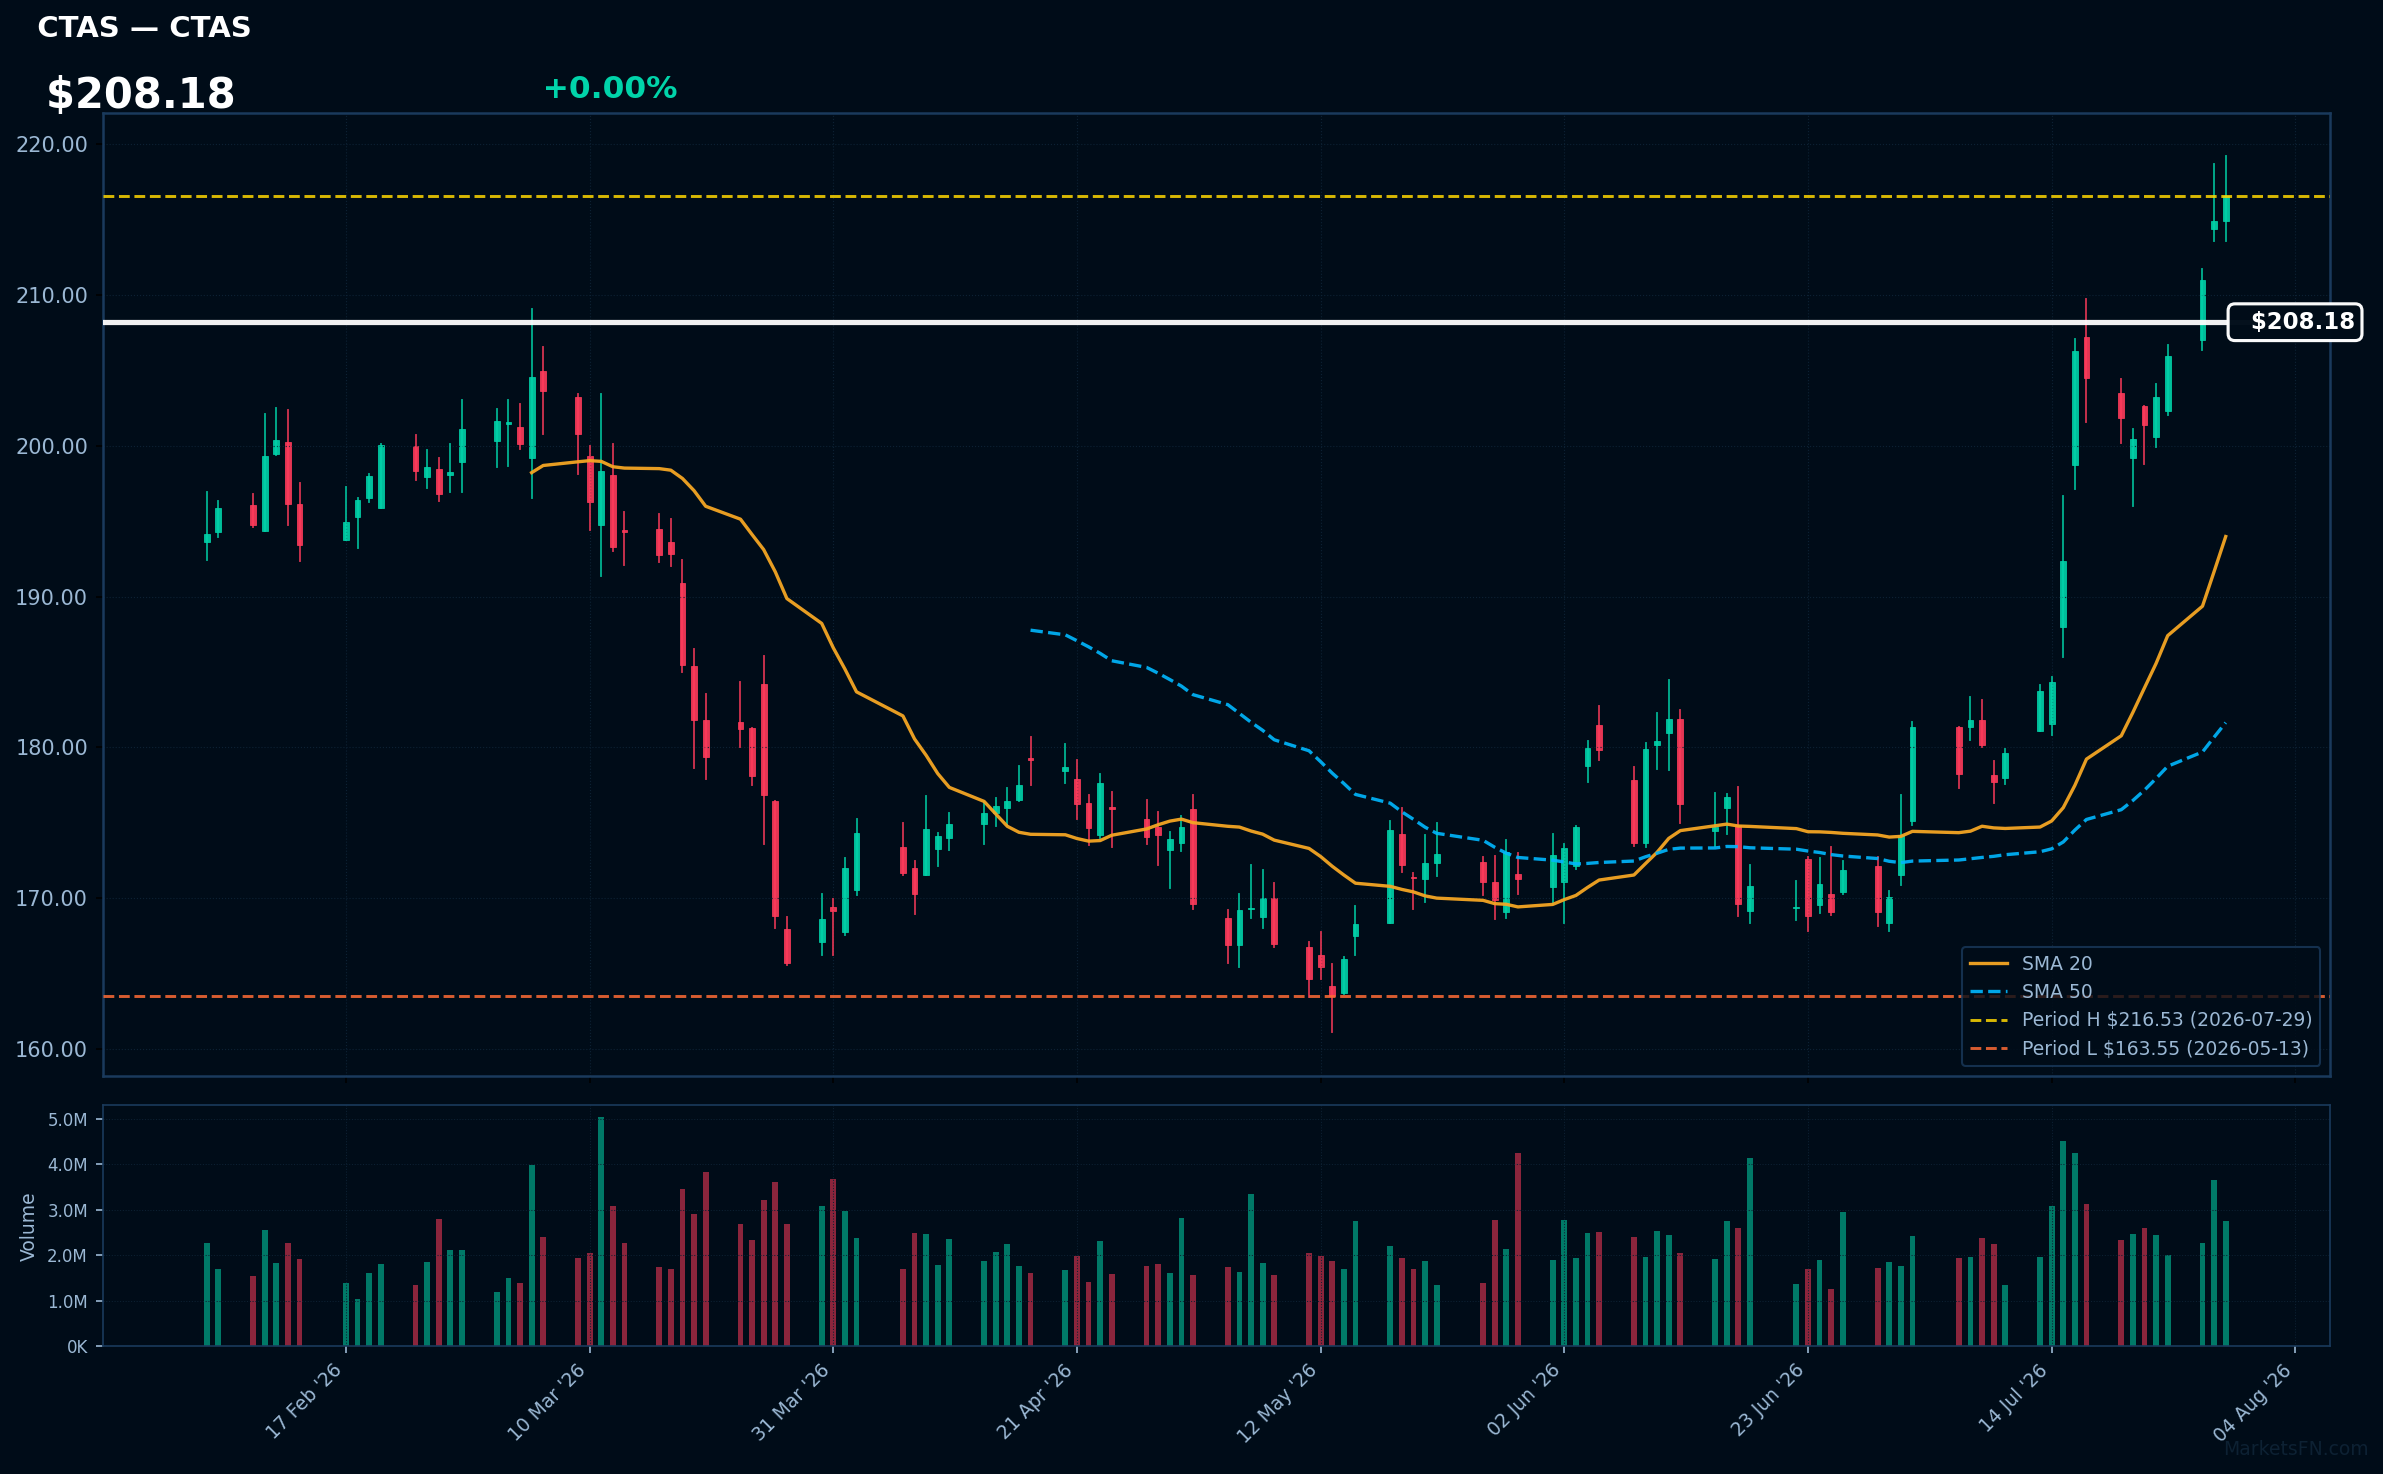
CTAS | Cintas Corporation | Industrials | Price Last: $216.53 | % Realized: +17.12% | RSI: 65.0 | % above MA200: +17.1% | Trend: Above MA20, MA50, MA200
Cintas Corporation (CTAS) is a leading provider of corporate identity uniforms and related services. Investors should care because its steady demand and pricing power drive consistent revenue growth, making it an attractive stable investment.
Cintas Corporation's RSI(14) is 65.0, indicating rising momentum. With the price above MA20, MA50, and MA200, it shows strong technical alignment. The stock is near its 2026 YTD high, up 17.1% YTD, suggesting potential for further breakout.
Related headlines
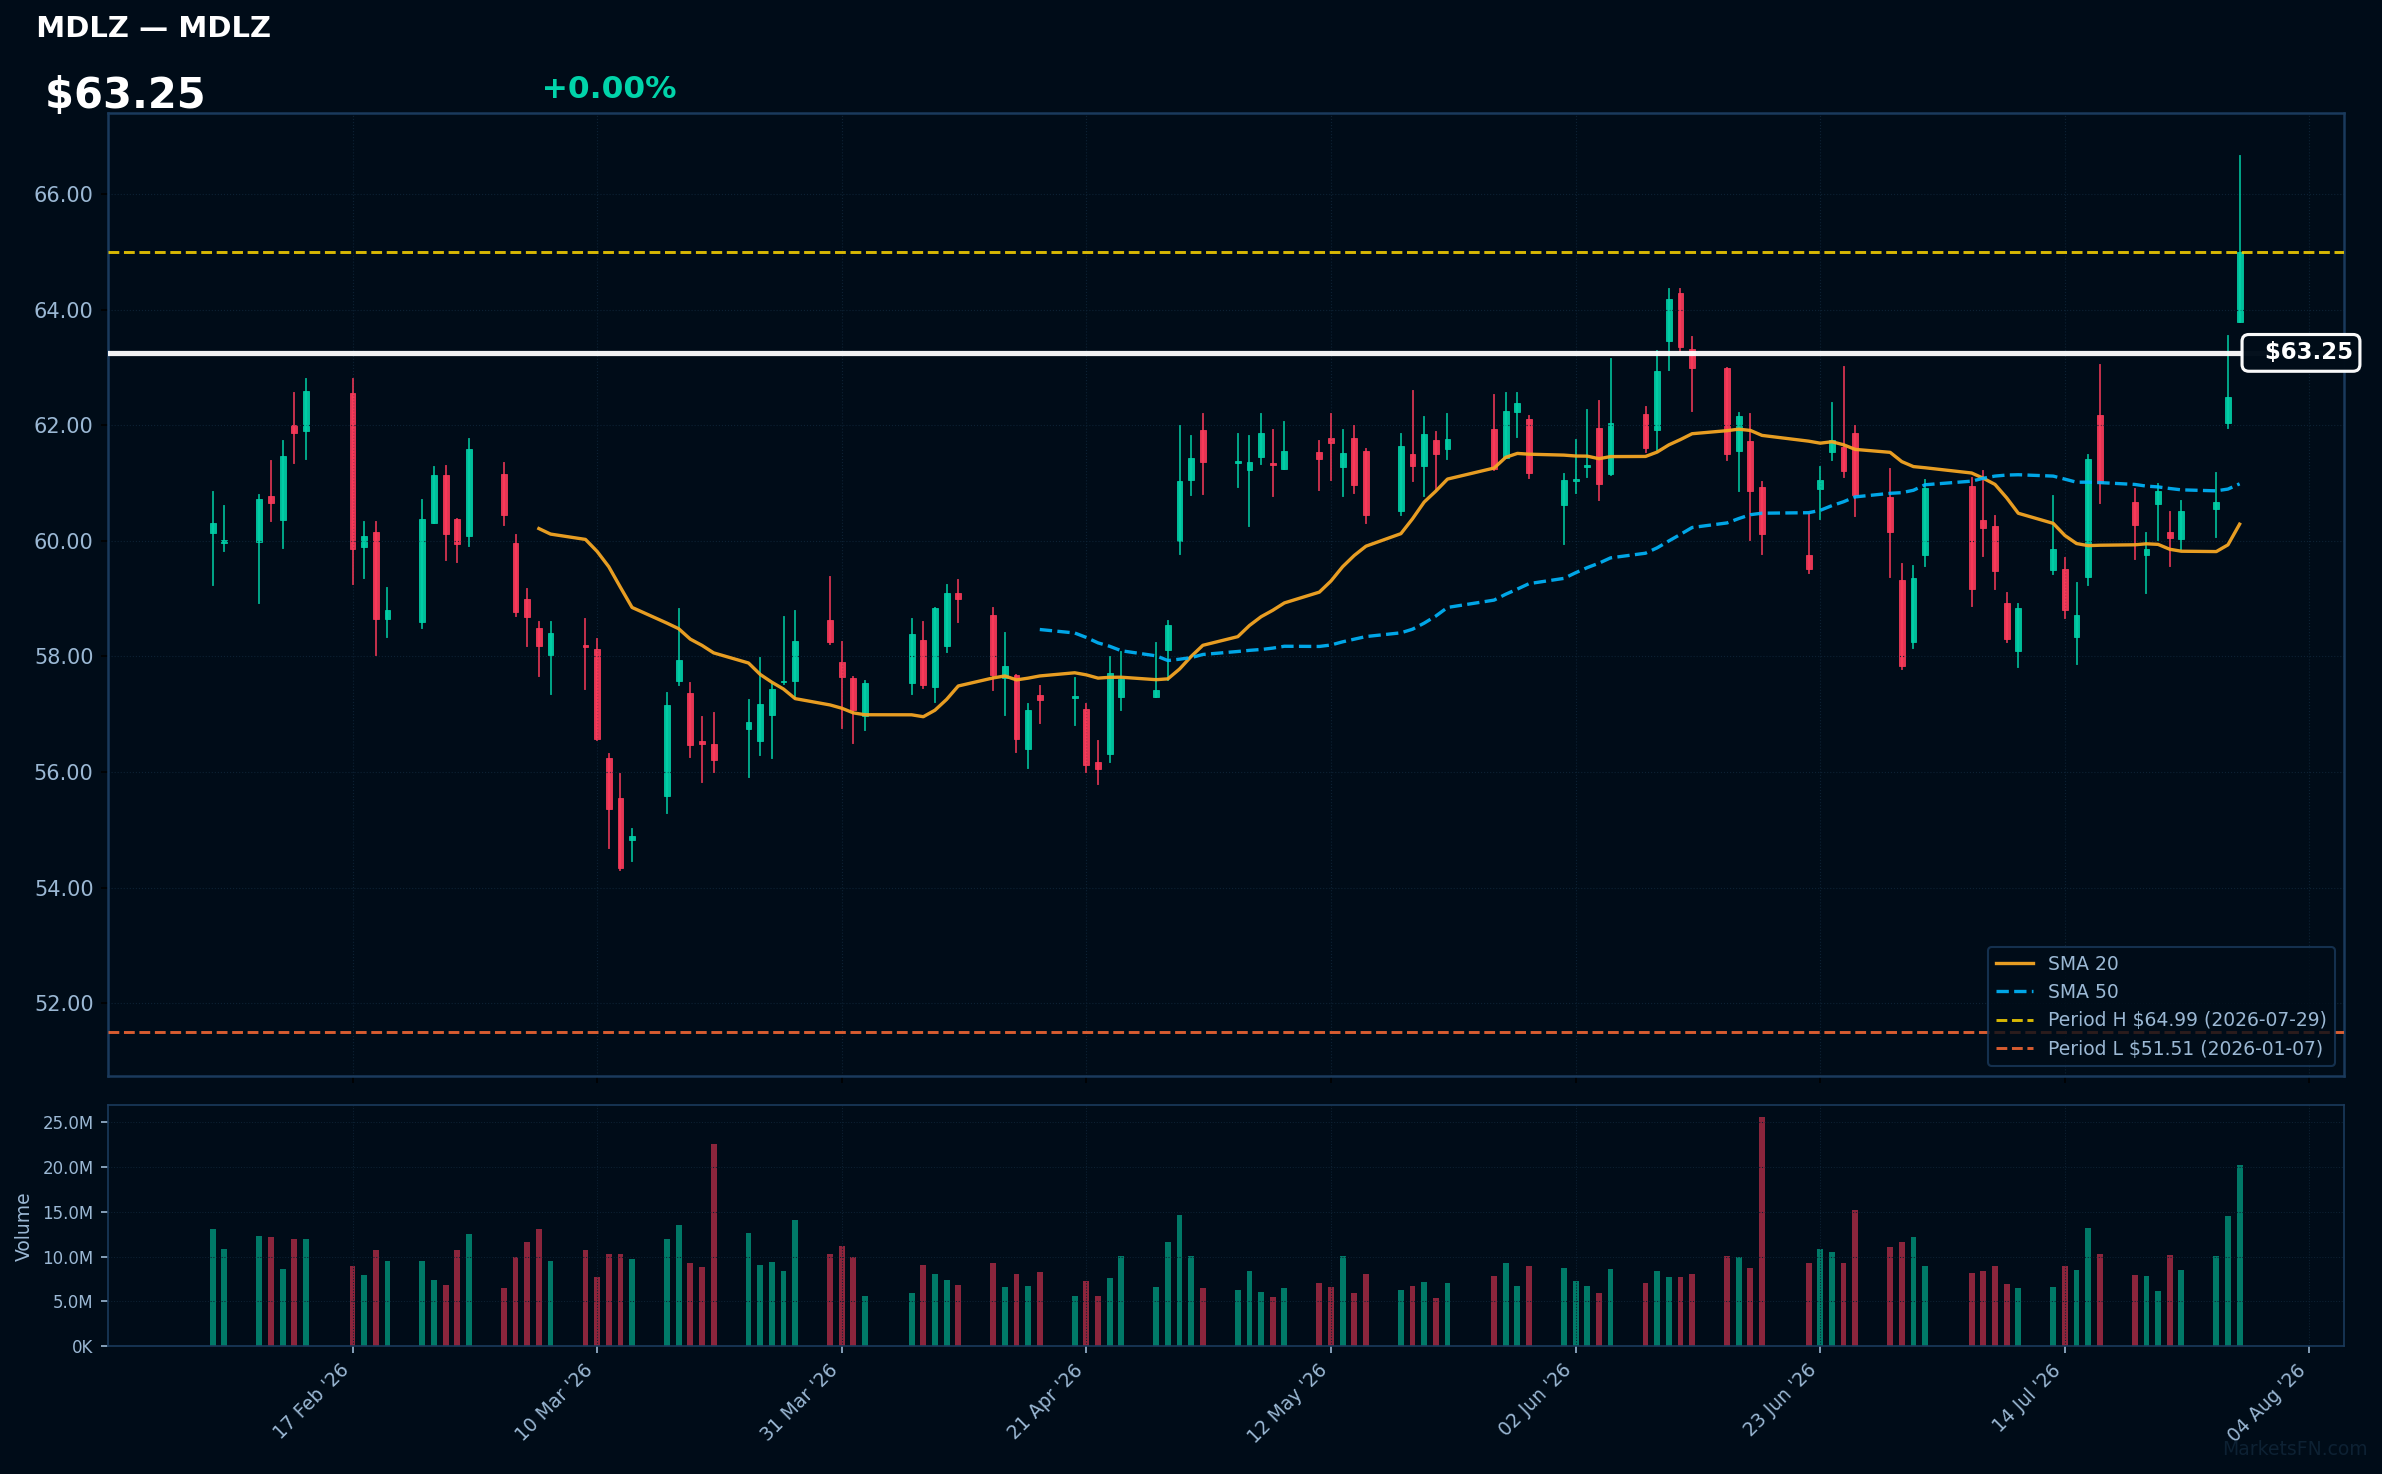
MDLZ | Mondelez International Inc | Consumer Defensive | Price Last: $64.99 | % Realized: +21.14% | RSI: 58.2 | % above MA200: +10.8% | Trend: Above MA20, MA50, MA200
Mondelez International Inc is a global snacking powerhouse with brands like Oreo and Chips Ahoy. Investors should care about its ability to drive growth through premiumization and geographic expansion, potentially leading to sustained revenue and profit momentum.
MDLZ shows mixed technical signals: RSI(14) at 58.2 indicates moderate momentum, while the price above MA20/MA50/MA200 suggests bullish trend. With the stock at its 2026 YTD high, a 21.1% YTD return may signal a potential breakout, but proximity to the high warrants caution.
Related headlines
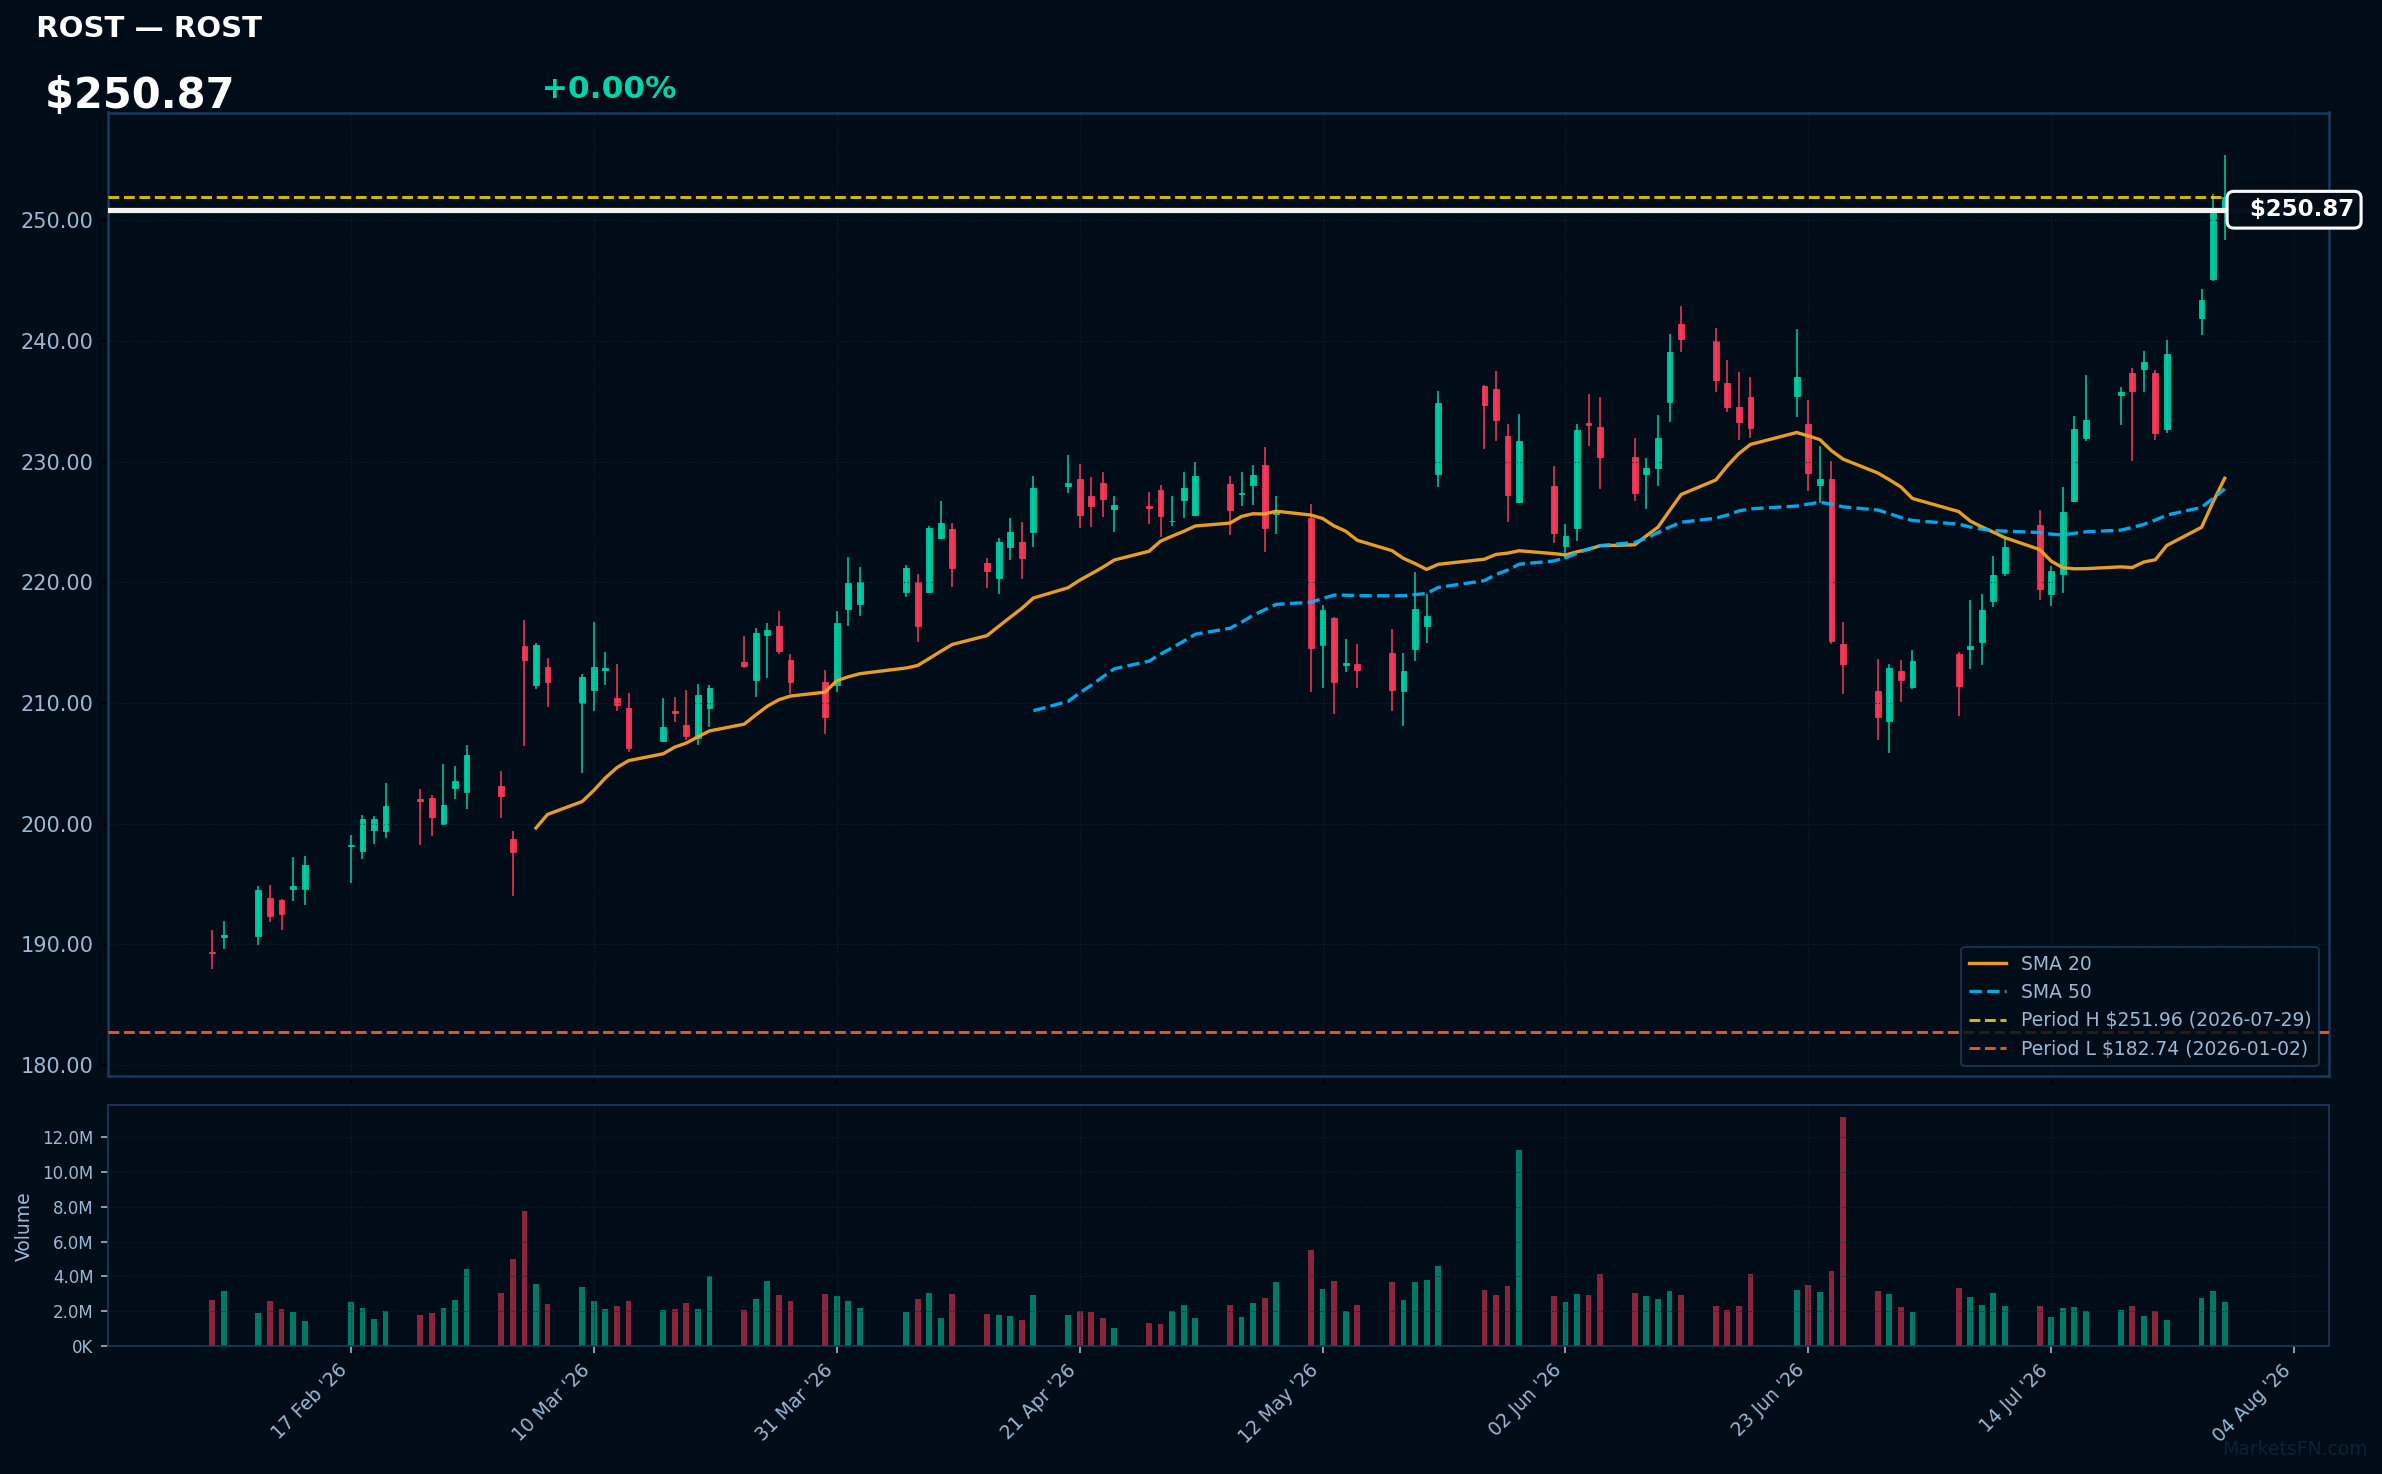
ROST | Ross Stores, Inc | Consumer Cyclical | Price Last: $251.96 | % Realized: +37.88% | RSI: 70.0 | % above MA200: +24.8% | Trend: Above MA20, MA50, MA200
Ross Stores, Inc operates as an off-price retailer, offering discounted apparel, home furnishings, and accessories. Investors should care because its business model thrives on opportunistic purchasing and efficient inventory management, driving profitability.
The stock exhibits bullish MA alignment with price > MA20 > MA50 > MA200, RSI(14) at 70.0, indicating strong momentum; it's near a potential breakout level, 0.0% below its 2026 YTD high, with a 37.9% 2026 YTD return.
Related headlines
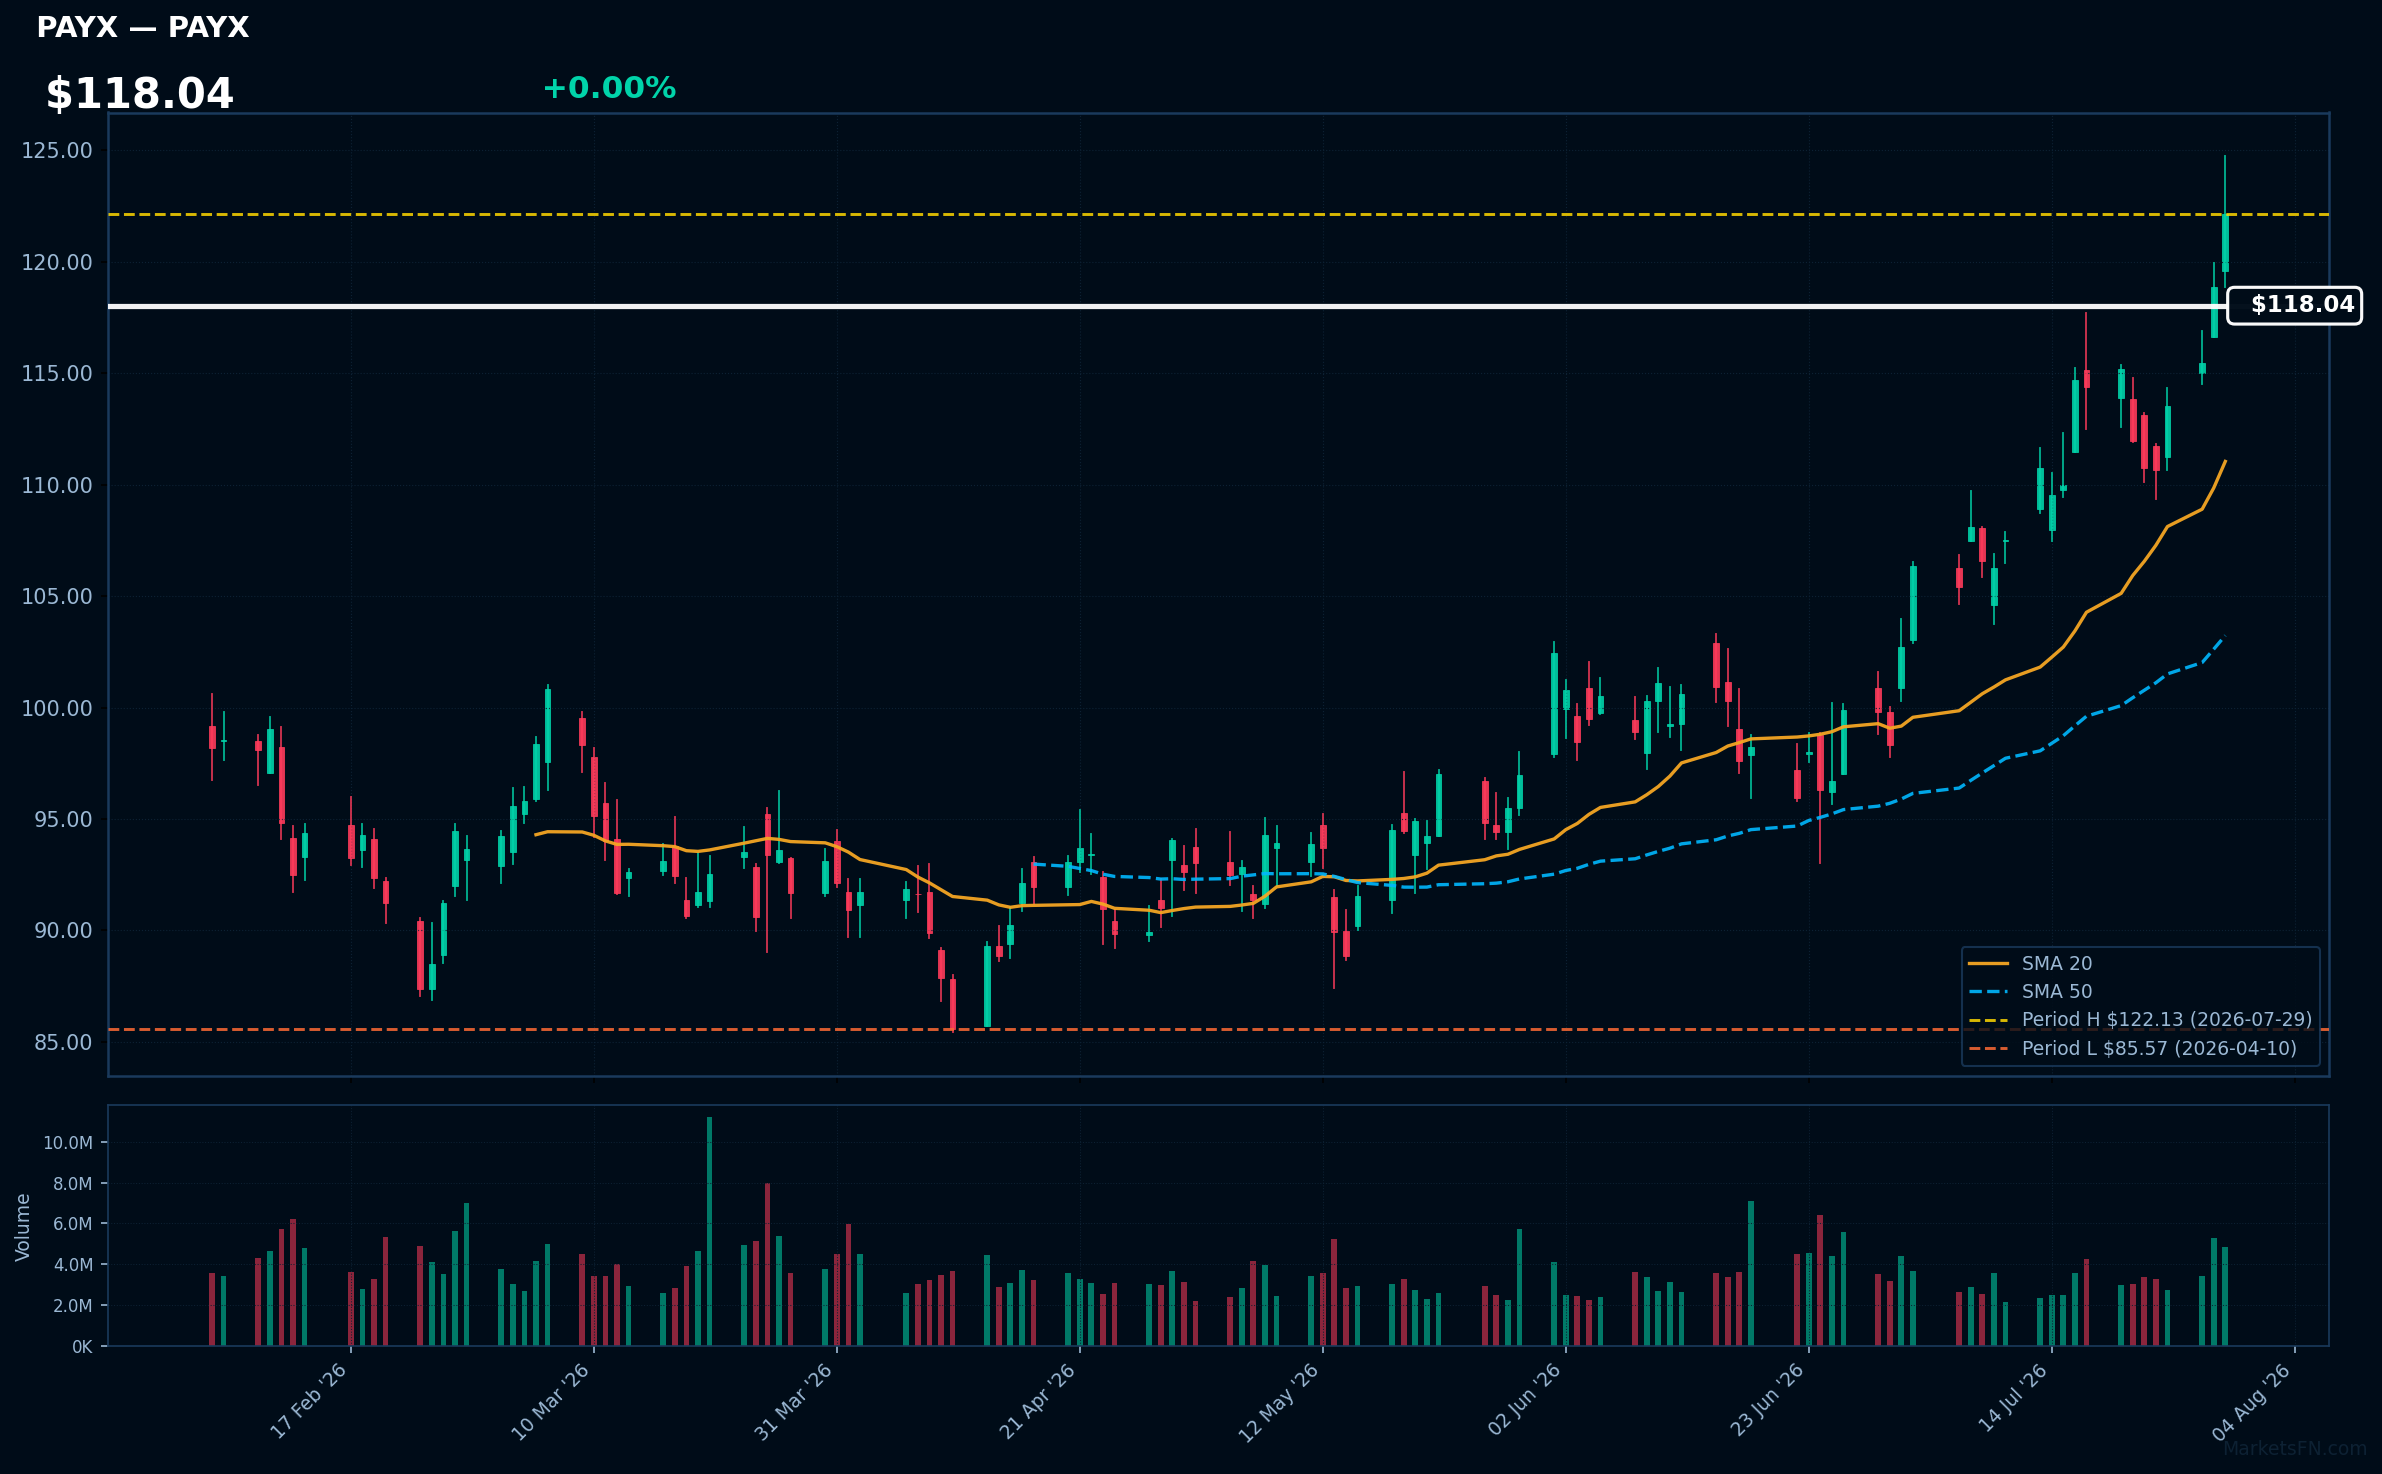
PAYX | Paychex Inc | Technology | Price Last: $122.13 | % Realized: +12.46% | RSI: 64.6 | % above MA200: +17.8% | Trend: Above MA20, MA50, MA200
Paychex Inc provides payroll processing, HR services, and benefits administration to small and medium-sized businesses, generating recurring revenue through subscription-based models. Investors care due to the company's stable cash flows and potential for long-term growth.
Paychex Inc's current technical situation indicates momentum, with RSI(14) at 64.6 and a bullish MA alignment (price > MA20 > MA50 > MA200). The stock is 0.0% below its 2026 YTD high, suggesting a potential breakout.
Related headlines
📉 Nearest to 2026 Low
Sectors represented: Communication Services (2), Consumer Cyclical (1), Technology (1), Healthcare (1)
| Ticker | Company | Sector | Price Last | % Realized | 2026 YTD Low Date | RSI | % above MA200 | Trend |
|---|---|---|---|---|---|---|---|---|
| TSLA | Tesla Inc | Consumer Cyclical | $298.32 | -31.90% | 2026-07-29 | 29.1 | -27.6% | Below MA20, MA50, MA200 |
| SNPS | Synopsys, Inc | Technology | $373.69 | -22.22% | 2026-07-24 | 31.2 | -16.9% | Below MA20, MA50, MA200 |
| WBD | Warner Bros. Discovery Inc | Communication Services | $25.64 | -10.07% | 2026-07-27 | 39.3 | -3.0% | Below MA20, MA50, MA200 |
| AZN | Astrazeneca plc ADR | Healthcare | $173.30 | -5.37% | 2026-07-14 | 43.9 | -6.2% | Below MA20, MA50, MA200 |
| EA | Electronic Arts, Inc | Communication Services | $208.91 | +2.20% | 2026-02-04 | 72.0 | +3.1% | Above MA20, MA50, MA200 |
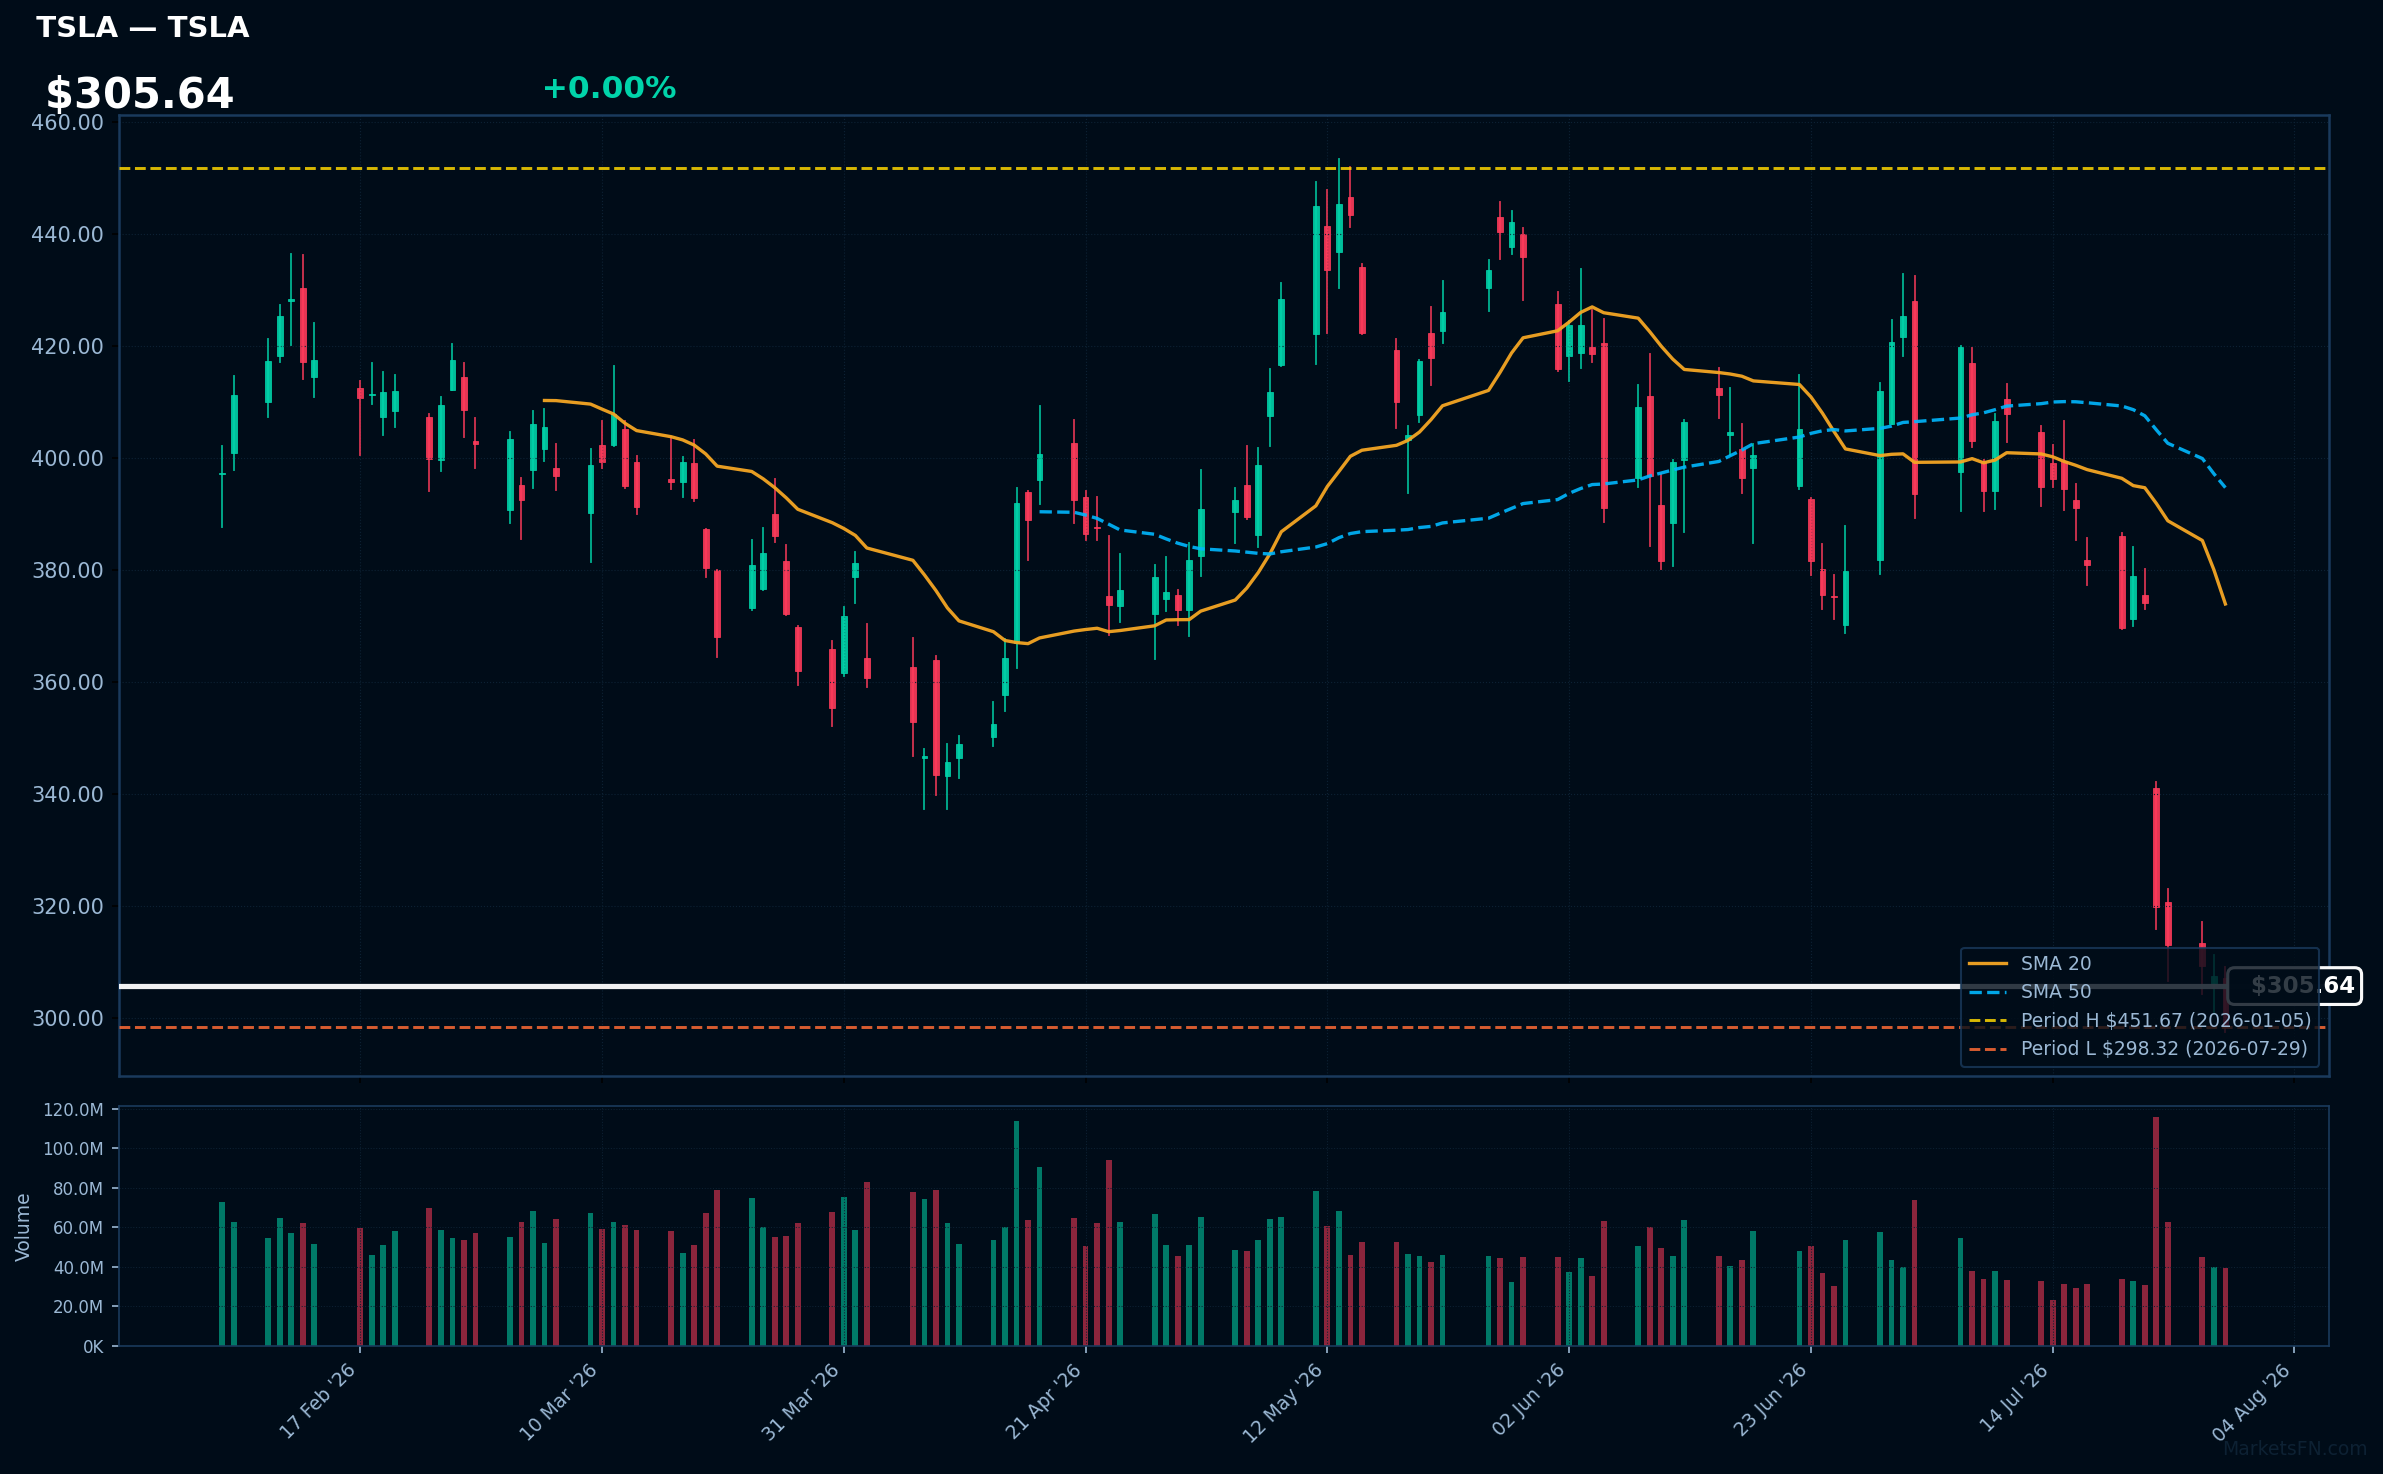
TSLA | Tesla Inc | Consumer Cyclical | Price Last: $298.32 | % Realized: -31.90% | RSI: 29.1 | % above MA200: -27.6% | Trend: Below MA20, MA50, MA200
Tesla Inc is an electric vehicle manufacturer and clean energy company. Investors should care because its innovative products and market leadership in EVs drive growth and disruption in the automotive and energy sectors.
Tesla's technical situation is bearish, with RSI(14) at 29.1 indicating oversold conditions, and a sustained downtrend as price ($305.64) remains below MA20, MA50, and MA200, with a -31.9% 2026 YTD return and testing major support at its YTD low.
Related headlines
- Tesla Stock Is Trying to End a Six-Day Losing Streak. Microsoft Is Coming to the Rescue.
- Tesla's Six-Day Losing Streak Took the Stock Below $300 for the First Time in a Year
- Trumps FCC Just Cleared the Field for Teslas Robots
- Tesla Stock Eyes Mag 7s Worst July Gordon Johnson Says Q2 Numbers Expose FSDs Ridiculous Valuation
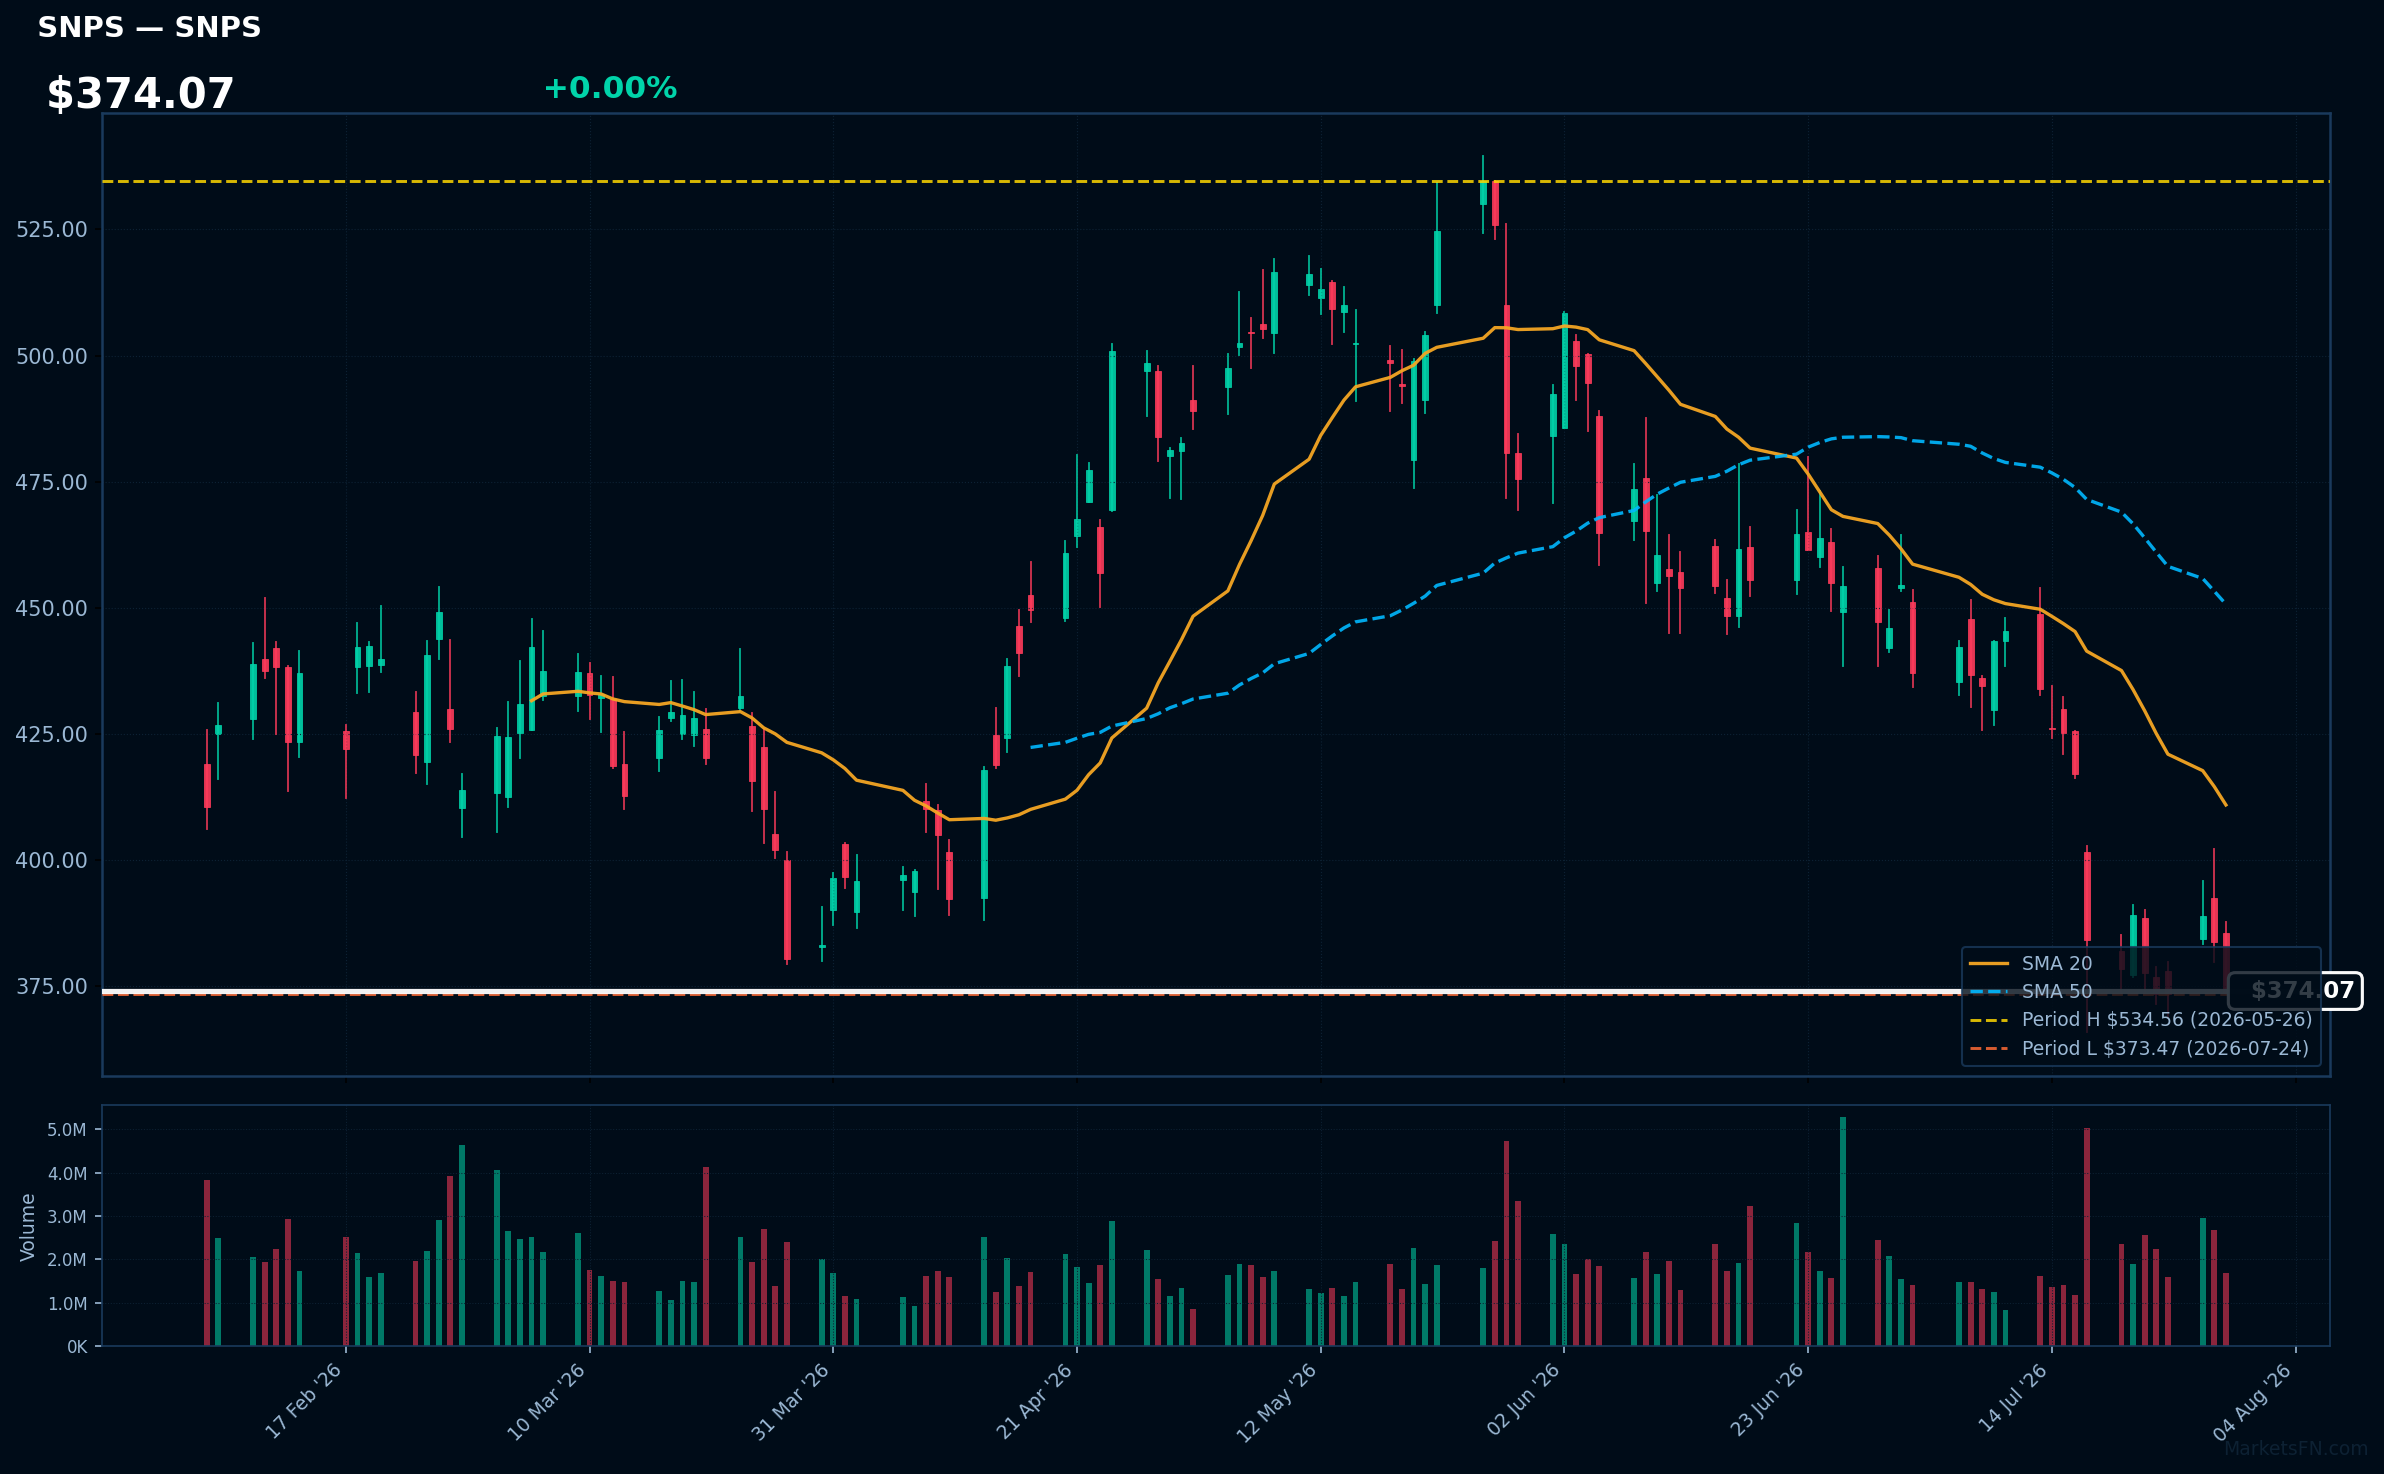
SNPS | Synopsys, Inc | Technology | Price Last: $373.69 | % Realized: -22.22% | RSI: 31.2 | % above MA200: -16.9% | Trend: Below MA20, MA50, MA200
Synopsys, Inc (SNPS) is a leading provider of electronic design automation (EDA) software and semiconductor intellectual property (IP), crucial for chip design and manufacturing. Investors care due to its dominant position in the growing semiconductor industry.
SNPS is in a sustained downtrend with price ($374.07) < MA20 < MA50 < MA200, RSI(14) at 31.2, indicating oversold conditions. Testing major support 0.1% above 2026 YTD low; 2026 YTD return is -22.2%. This signals a potential warning sign.
Related headlines
- Synopsys unveils autonomous chip design workflows with Microsoft and AMD collaboration
- Synopsys and Intel Foundry Fast-Track Customer Readiness from Silicon to Systems on Intel 14A
- Synopsys Advances Agentic AI Chip Design with AMD and Microsoft
- Synopsys Showcases Comprehensive Autonomous Engineering Workflows from Silicon to Systems, Developed with NVIDIA Technology
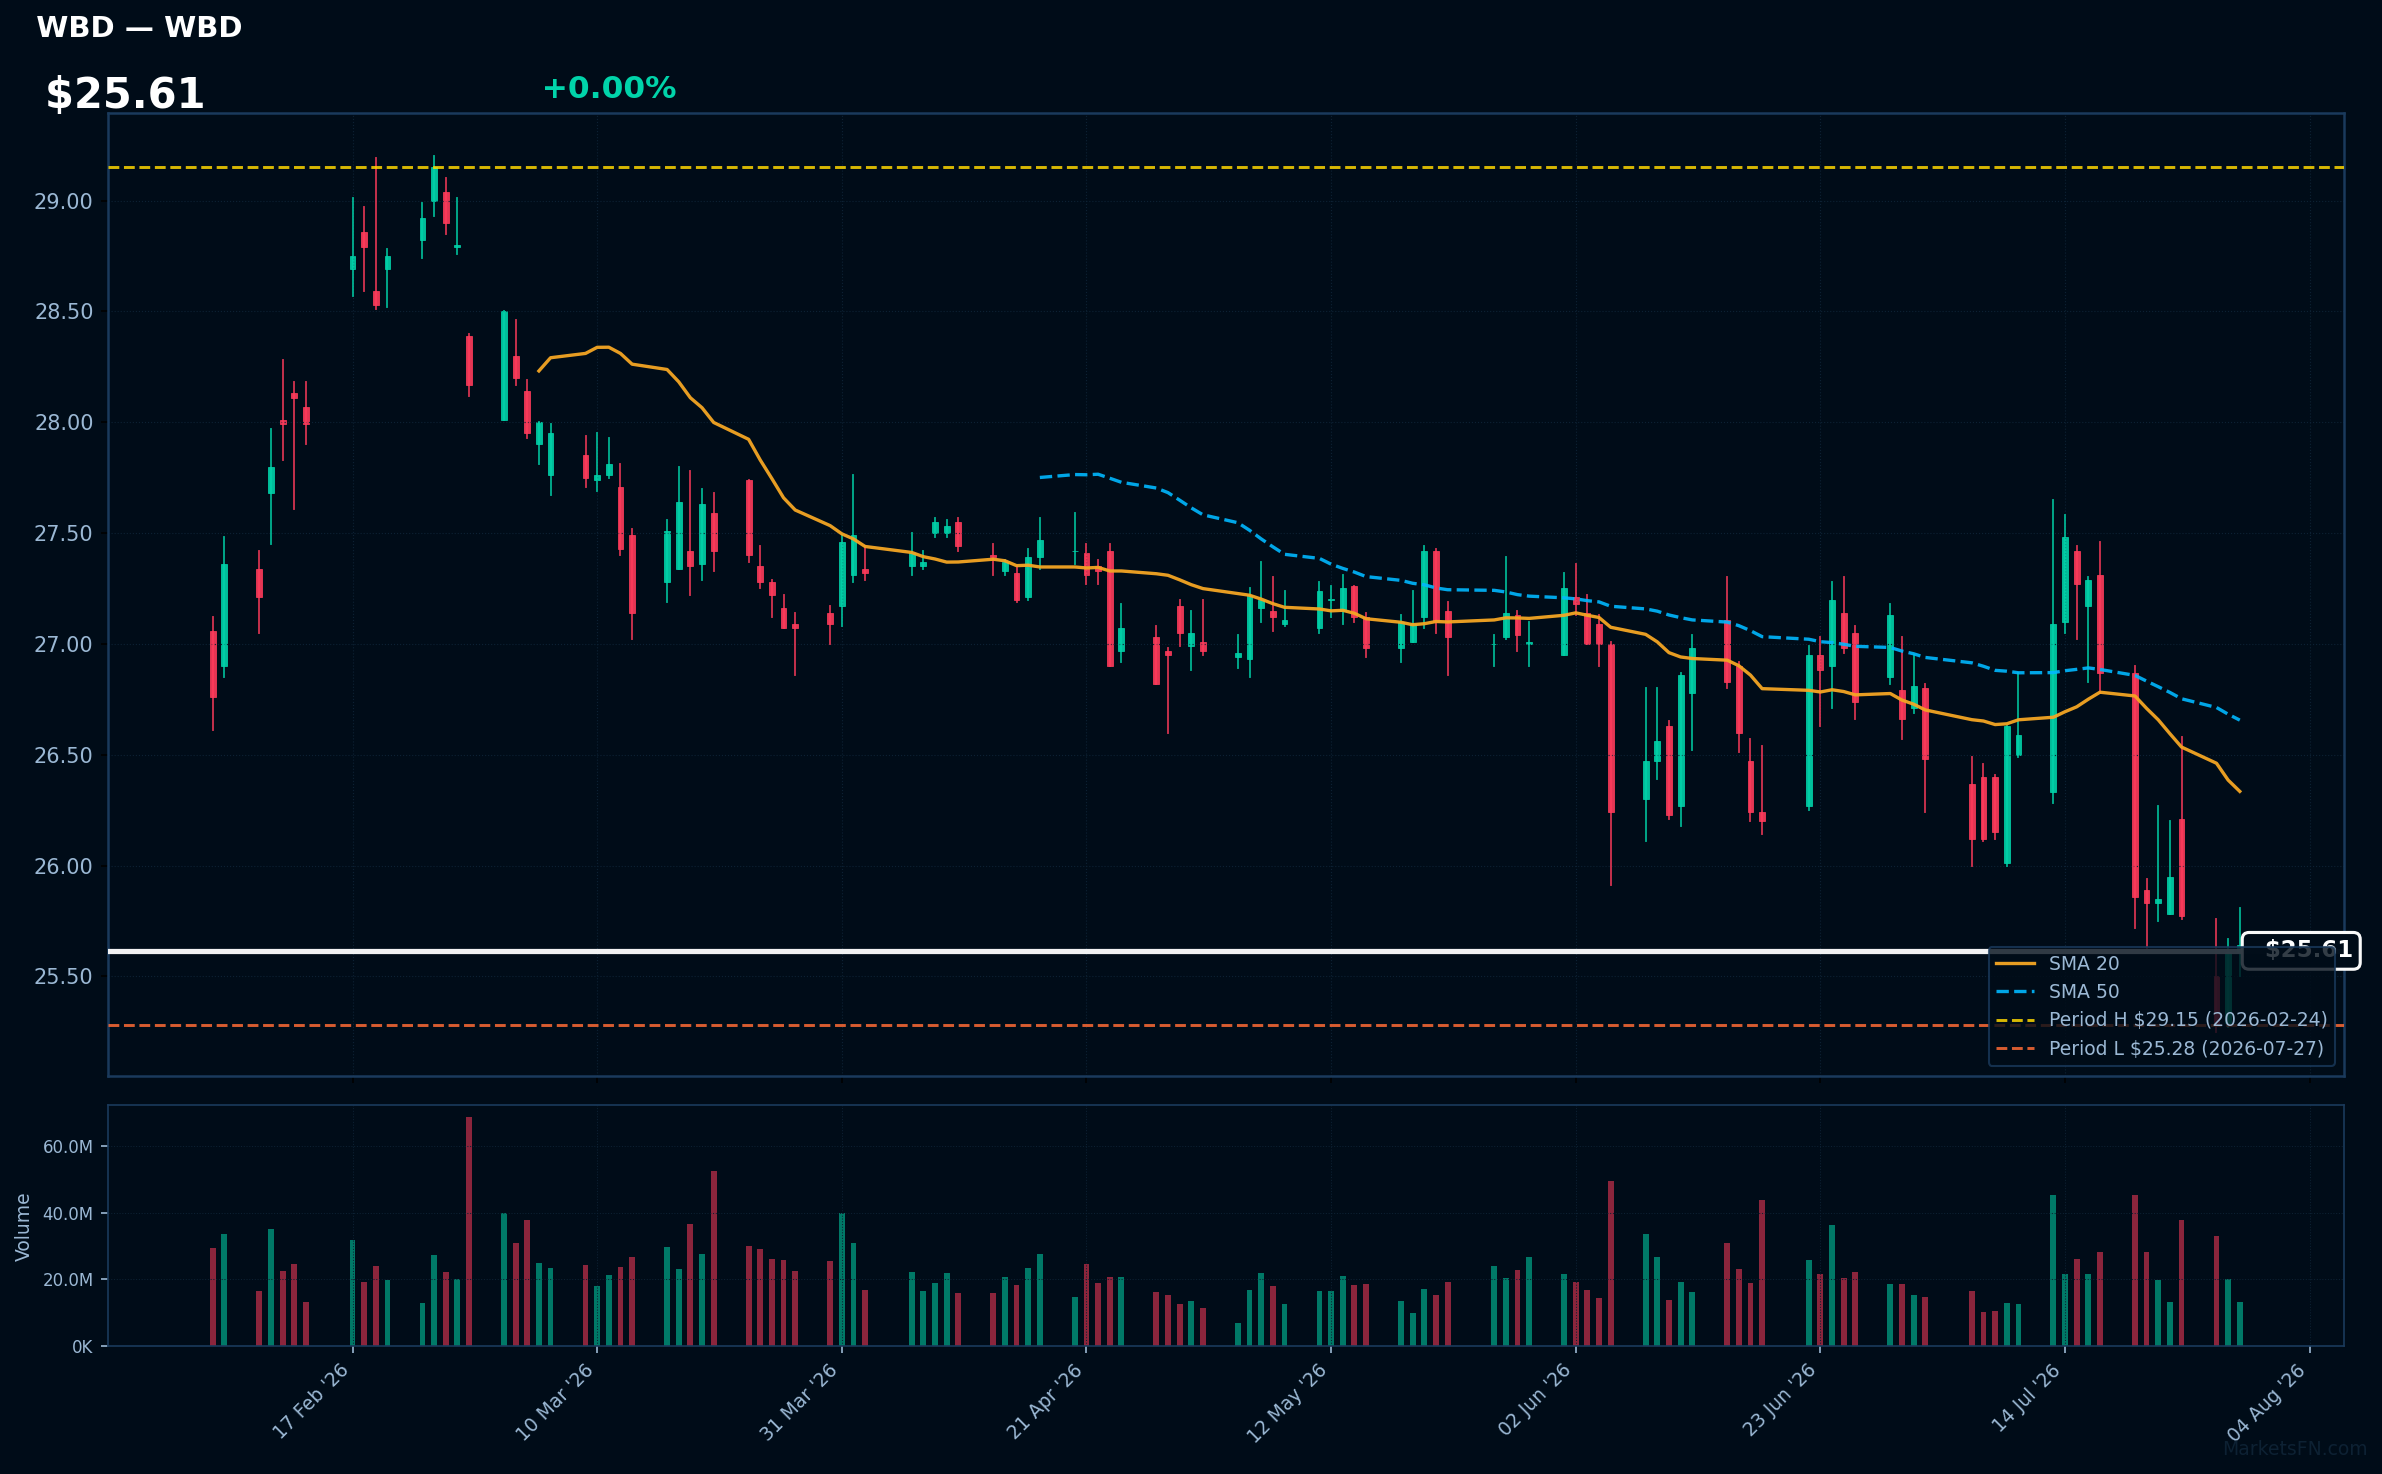
WBD | Warner Bros. Discovery Inc | Communication Services | Price Last: $25.64 | % Realized: -10.07% | RSI: 39.3 | % above MA200: -3.0% | Trend: Below MA20, MA50, MA200
Warner Bros. Discovery Inc is a media conglomerate with significant holdings in film, television, and streaming through brands like HBO, Warner Bros., and Discovery. Investors should care due to its influence on entertainment content and potential for streaming growth.
WBD's RSI(14) is 39.3, indicating bearish momentum. The stock is below MA20, MA50, and MA200, showing mixed signals. It's 1.4% above its 2026 YTD low, testing major support, with a -10.1% return over the 2026 YTD period, a warning sign.
Related headlines
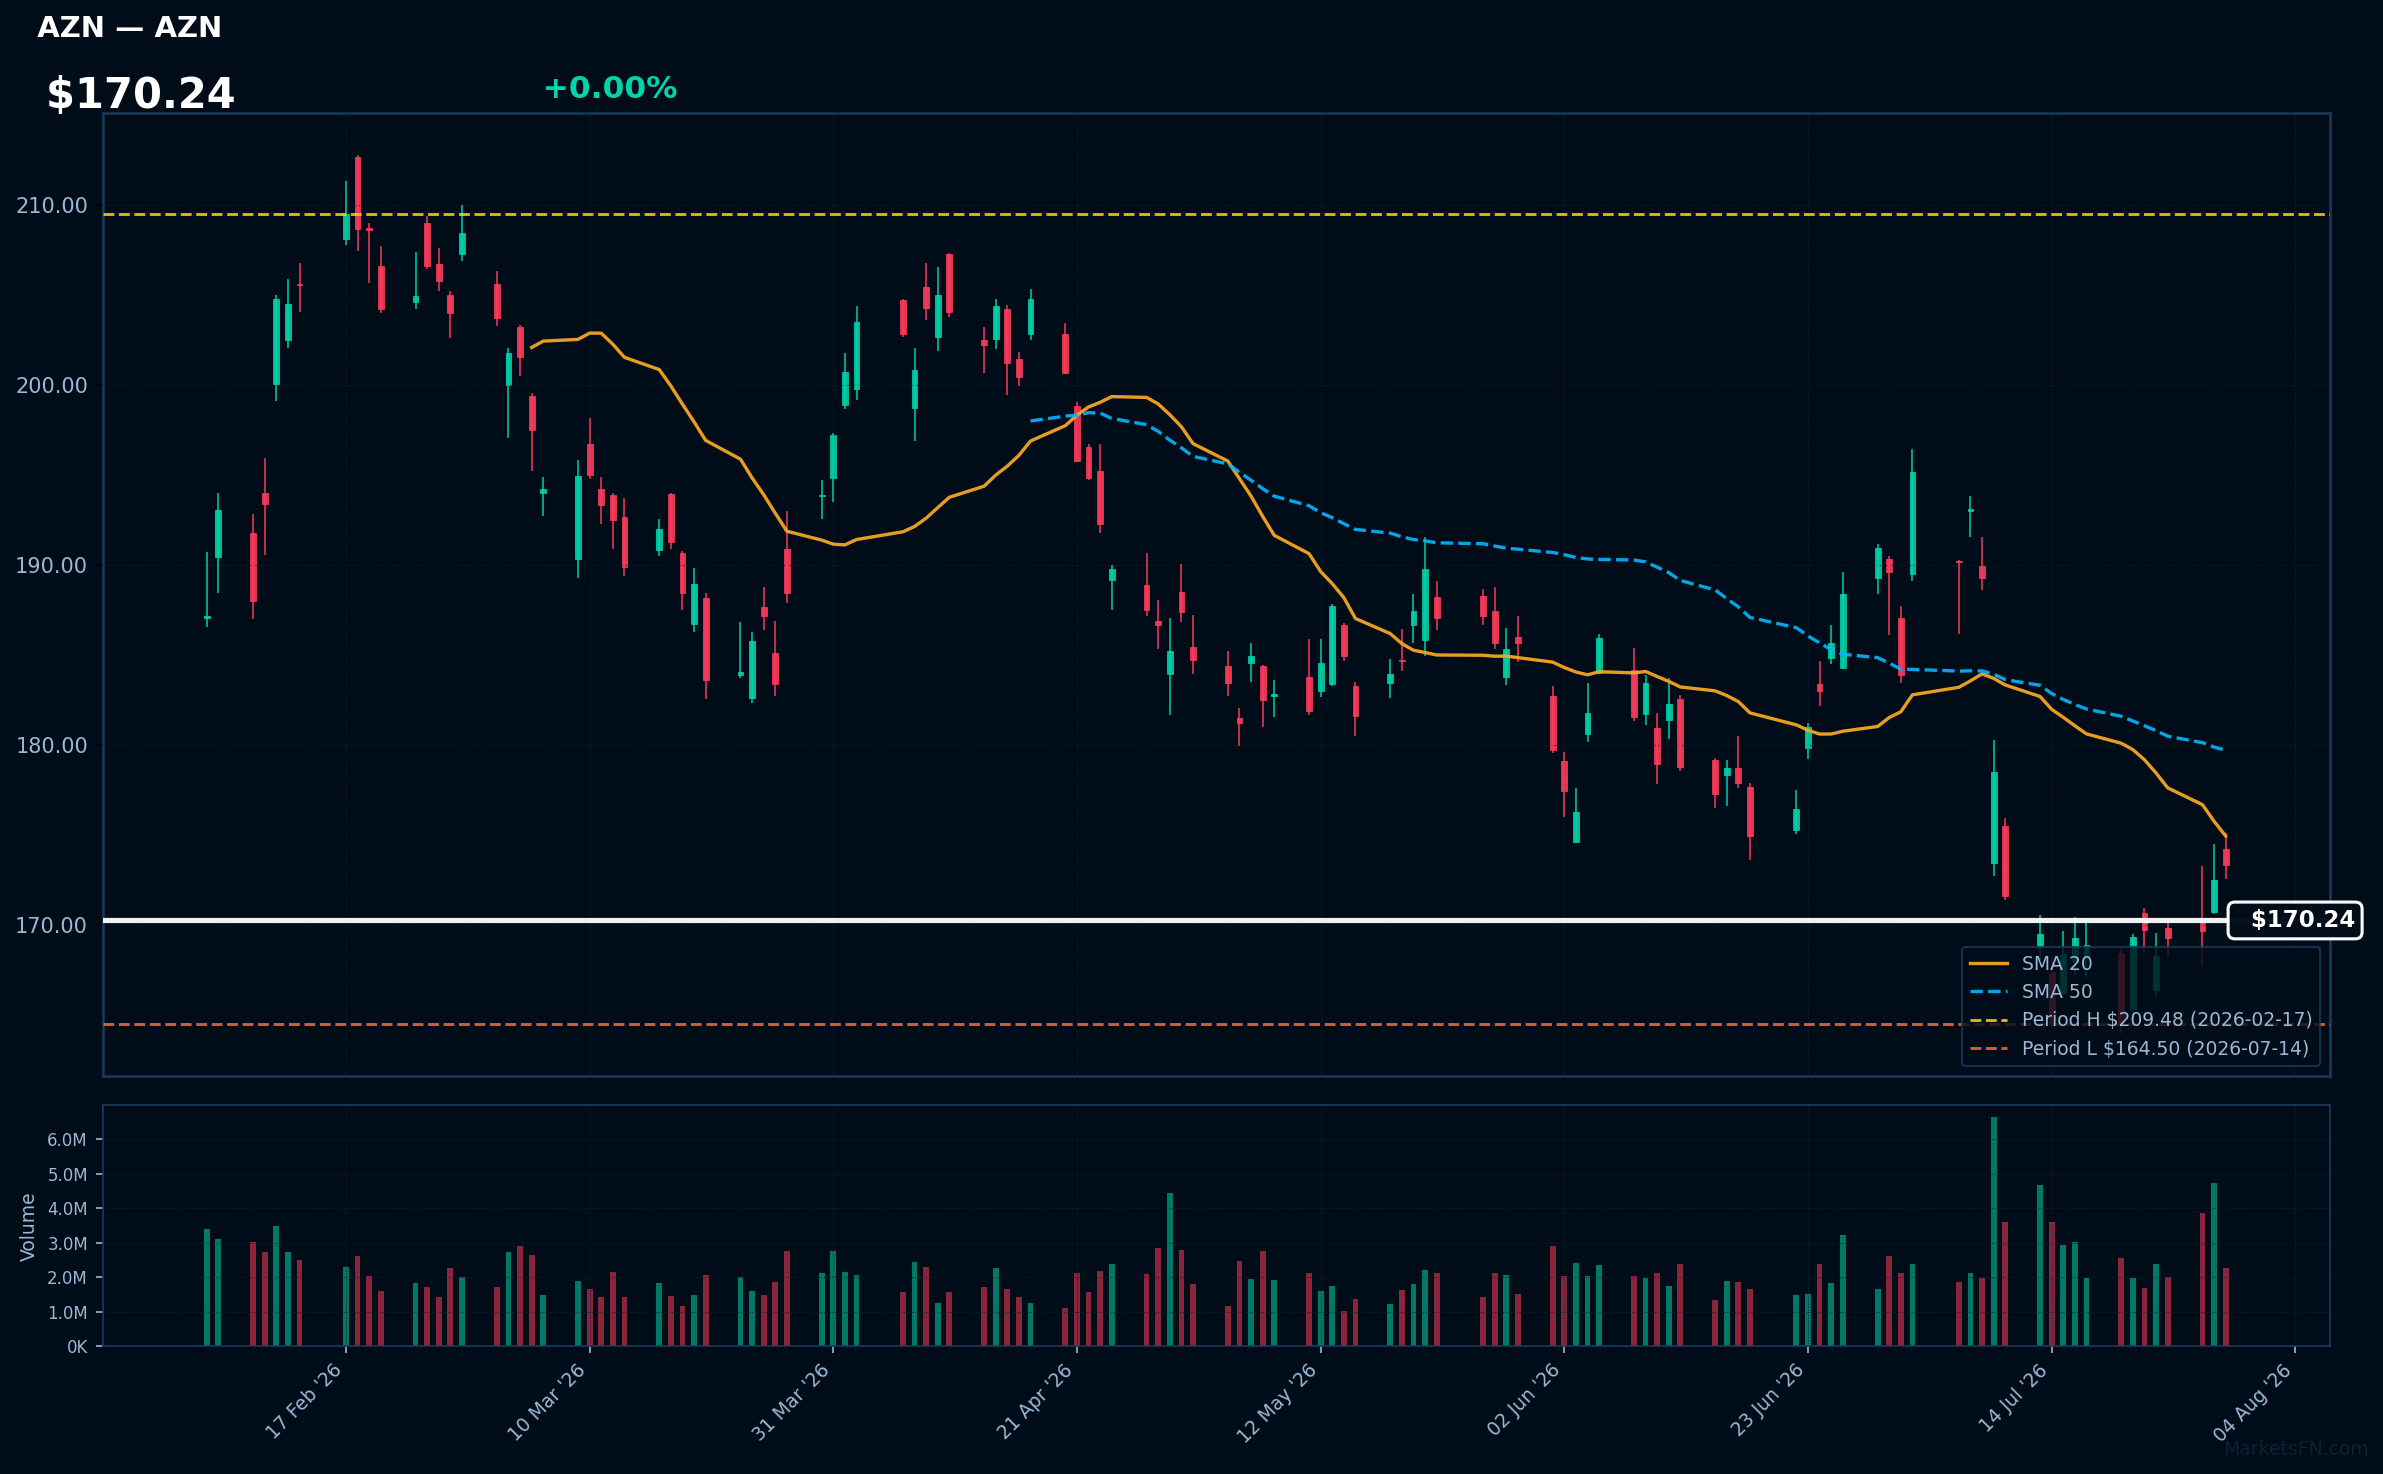
AZN | Astrazeneca plc ADR | Healthcare | Price Last: $173.30 | % Realized: -5.37% | RSI: 43.9 | % above MA200: -6.2% | Trend: Below MA20, MA50, MA200
Astrazeneca plc ADR is a biopharmaceutical company that discovers, develops, and commercializes prescription medicines. Investors should care about its pipeline and product portfolio, particularly for treatments in oncology, cardiovascular, and respiratory diseases, which drive revenue growth.
Astrazeneca plc ADR's current technical situation is bearish, with an RSI(14) of 43.9 indicating neutral momentum, and a sustained downtrend as price ($170.24) remains below MA20, MA50, and MA200, with the stock 5.3% above its 2026 YTD low.
Related headlines
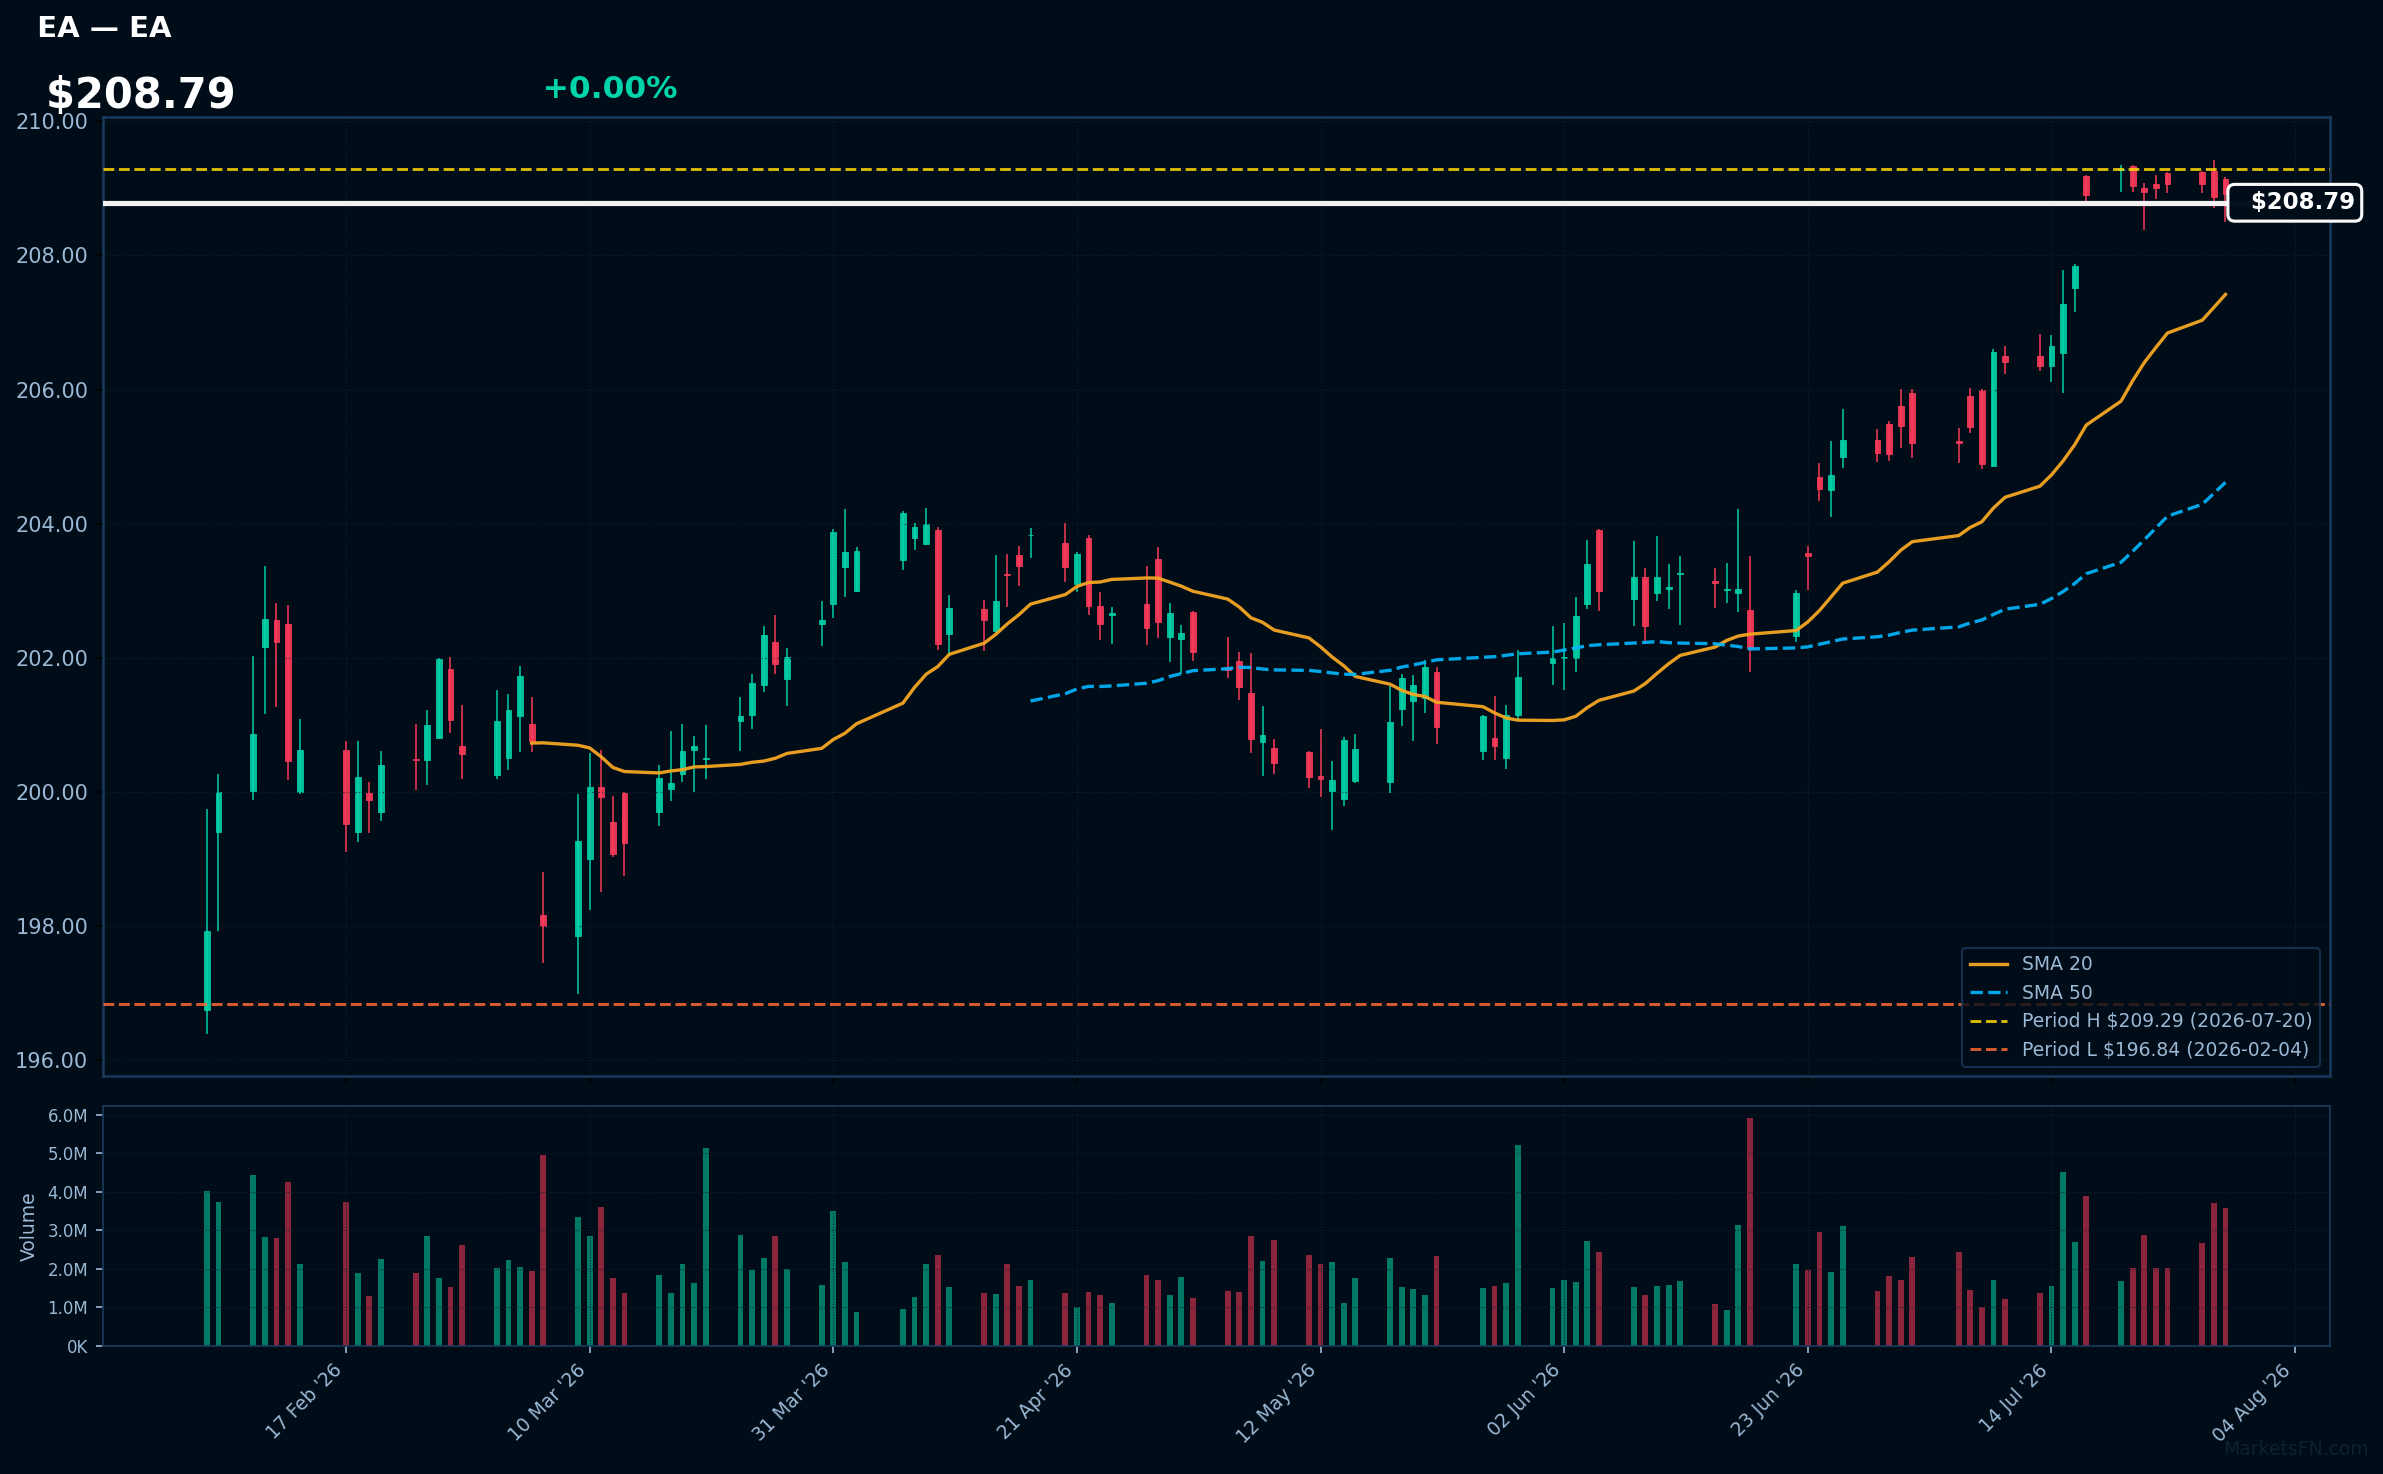
EA | Electronic Arts, Inc | Communication Services | Price Last: $208.91 | % Realized: +2.20% | RSI: 72.0 | % above MA200: +3.1% | Trend: Above MA20, MA50, MA200
Electronic Arts, Inc (EA) is a leading interactive entertainment software company that develops and publishes games such as FIFA, Madden NFL, and The Sims. Investors should care about its performance in the gaming market and its ability to innovate and release successful titles.
EA's current technical situation indicates strong momentum: RSI(14) is 72.0, and the stock is in a sustained uptrend with price > MA20 > MA50 > MA200. It's 0.2% below its 2026 YTD high, near a potential breakout level.
Related headlines
- EU clears PIF acquisition of sole control of EA in $55bn deal
- Kylian Mbappe and Jude Bellingham Welcome You to EA SPORTS FC 27, Launching Worldwide on September 25
- Kylian Mbapp and Jude Bellingham Welcome You to EA SPORTS FC 27, Launching Worldwide on September 25
- Saudi PIF's $55 billion EA deal approved under EU merger rules
Market Commentary
The provided data indicates that certain Nasdaq 100 stocks are near their 2026 year-to-date (YTD) extremes. Stocks like ADP, CTAS, MDLZ, ROST, and PAYX are at their 2026 YTD highs, while TSLA is at its 2026 YTD low. This suggests that these stocks have either reached new highs or lows so far this year.
The technology sector themes and macro conditions driving these moves are not explicitly stated, but the data implies that certain stocks are being driven to extremes. Stocks like TSLA, SNPS, and EA, which are near their 2026 YTD lows, may be influenced by sector-specific or macroeconomic factors. The proximity of certain stocks to their YTD extremes may be related to earnings reports, industry trends, or broader market conditions.
Investors and traders should watch the performance of these stocks relative to their YTD extremes, as well as any changes in their proximity to these levels. Monitoring the percentage changes above their YTD lows, such as TSLA's +0.0% and EA's +6.1%, may provide insight into potential future movements. Additionally, tracking the overall Nasdaq 100 index and its constituent stocks may help identify emerging trends and patterns.
Methodology: All 101 Nasdaq 100 constituents screened. Close prices downloaded from 2026-01-01. Period high = highest close since Jan 1 2026; period low = lowest close since Jan 1 2026. Distance = (current price / period extreme − 1) × 100. Technical indicators computed on up to 1 year of daily OHLCV data.
Disclaimer: For informational purposes only. Not investment advice. Past performance is not indicative of future results.

