Nasdaq 100 2026 YTD Highs & Lows Radar: Electronic Arts, (EA), PepsiCo (PEP) and more
MarketsFN Team

Nasdaq 100 2026 YTD Highs & Lows Radar: Electronic Arts, (EA), PepsiCo (PEP) and more
Screening all 101 Nasdaq 100 constituents for stocks nearest to their 2026 year-to-date high and their 2026 YTD low. Data as of July 22, 2026. % Realized = total return since Jan 1 2026.
Legend: RSI > 70 = overbought · RSI < 30 = oversold · Green % Realized = positive YTD return · Red = negative.
📈 Nearest to 2026 High
Sectors represented: Communication Services (1), Consumer Defensive (1), Technology (1), Consumer Cyclical (1), Industrials (1)
| Ticker | Company | Sector | Price Last | % Realized | 2026 YTD High Date | RSI | % above MA200 | Trend |
|---|---|---|---|---|---|---|---|---|
| EA | Electronic Arts, Inc | Communication Services | $209.04 | +2.27% | 2026-07-20 | 77.5 | +3.3% | Above MA20, MA50, MA200 |
| KHC | Kraft Heinz Co | Consumer Defensive | $25.79 | +5.74% | 2026-07-16 | 63.2 | +7.8% | Above MA20, MA50, MA200 |
| AAPL | Apple Inc | Technology | $327.74 | +20.93% | 2026-07-17 | 63.1 | +19.1% | Above MA20, MA50, MA200 |
| ROST | Ross Stores, Inc | Consumer Cyclical | $235.81 | +29.04% | 2026-06-12 | 64.3 | +18.4% | Above MA20, MA50, MA200 |
| CSX | CSX Corp | Industrials | $49.89 | +37.55% | 2026-07-16 | 62.0 | +22.4% | Above MA20, MA50, MA200 |
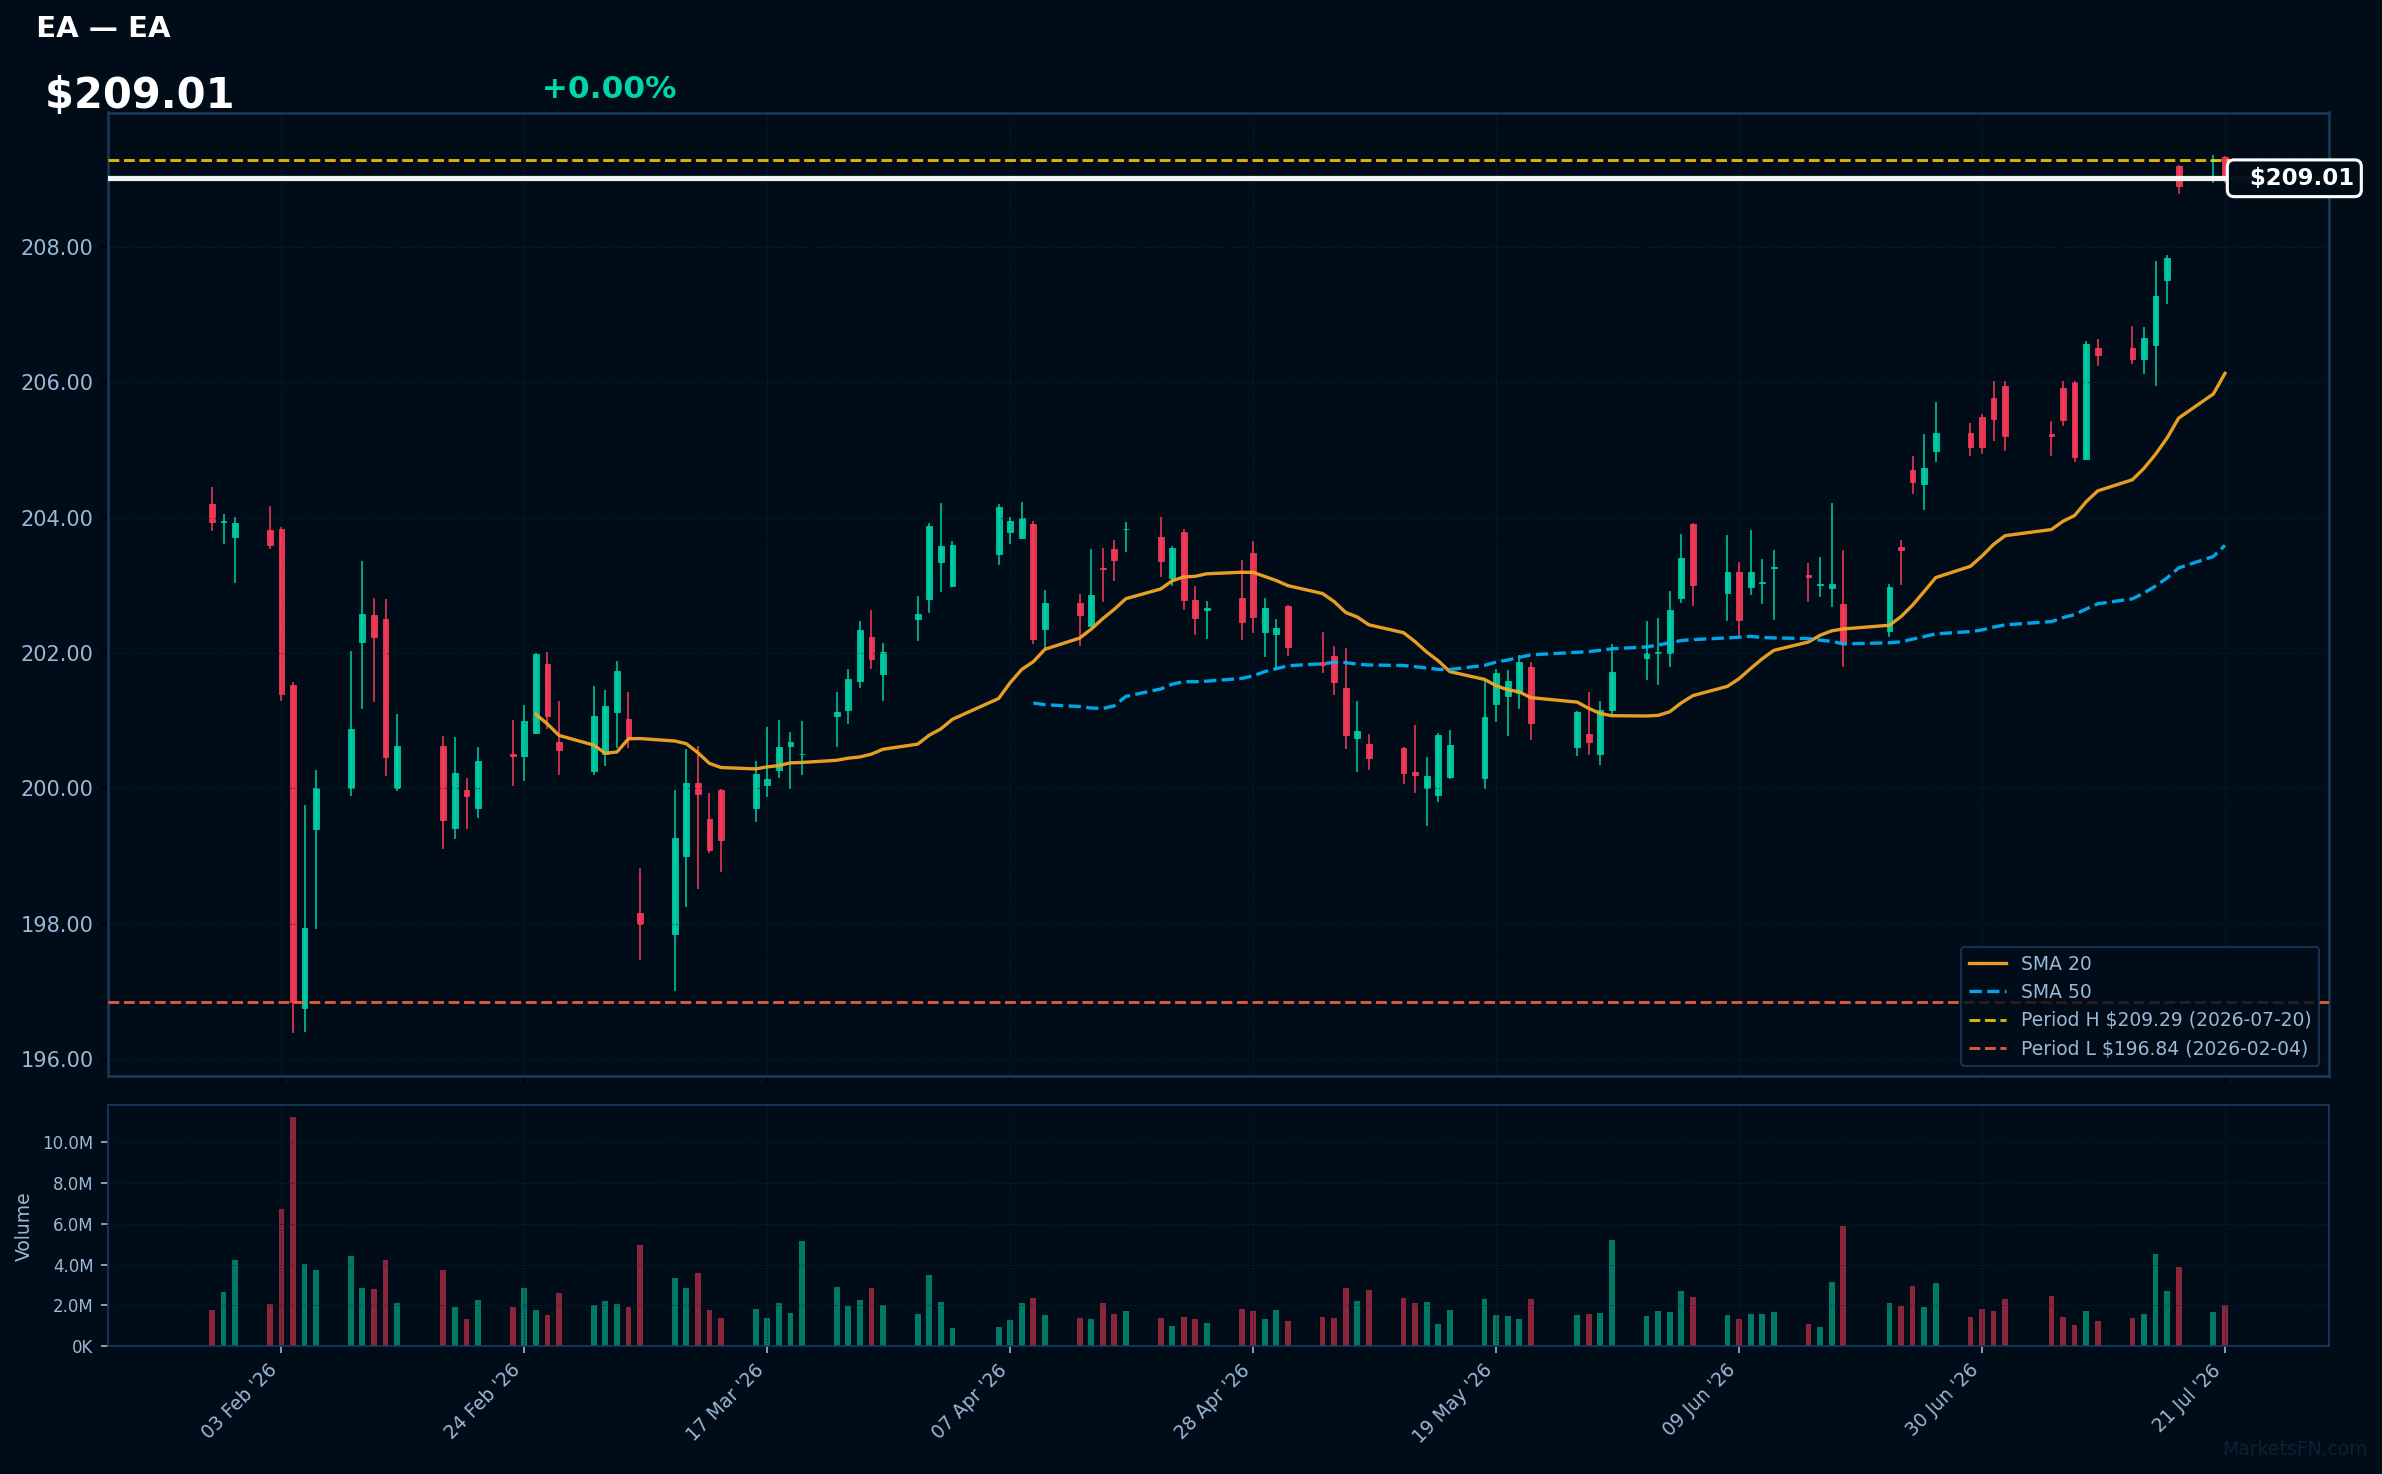
EA | Electronic Arts, Inc | Communication Services | Price Last: $209.04 | % Realized: +2.27% | RSI: 77.5 | % above MA200: +3.3% | Trend: Above MA20, MA50, MA200
Electronic Arts, Inc (EA) is a leading interactive entertainment software company that develops and publishes games such as Madden NFL, FIFA, and The Sims. Investors should care because EA's franchises have a strong track record and potential for continued growth.
EA's current technical situation indicates strong momentum: RSI(14) is 77.5, and the stock is in a sustained uptrend with price > MA20 > MA50 > MA200. It's 0.1% below its 2026 YTD high, suggesting a potential breakout.
Related headlines
- Battlefield 6 and Top Gun Join Forces for Biggest Blockbuster Season Yet
- Exclusive-Saudi PIF set to win EU nod for Electronic Arts deal under subsidy rules, sources say
- Every Team Has an Edge: EA SPORTS NHL 27 Overhauls All 32 Arena Atmospheres and Presentation for Total Immersion
- Oak-Eagle AcquireCo, Inc. Announces Extension of the Expiration Time and Settlement Date for the Previously Announced Tender Offers and Consent Solicitations for Any and All of Electronic Arts Inc.'s 1.850% Senior Notes Due 2031 and 2.950% Senior Notes Due 2051
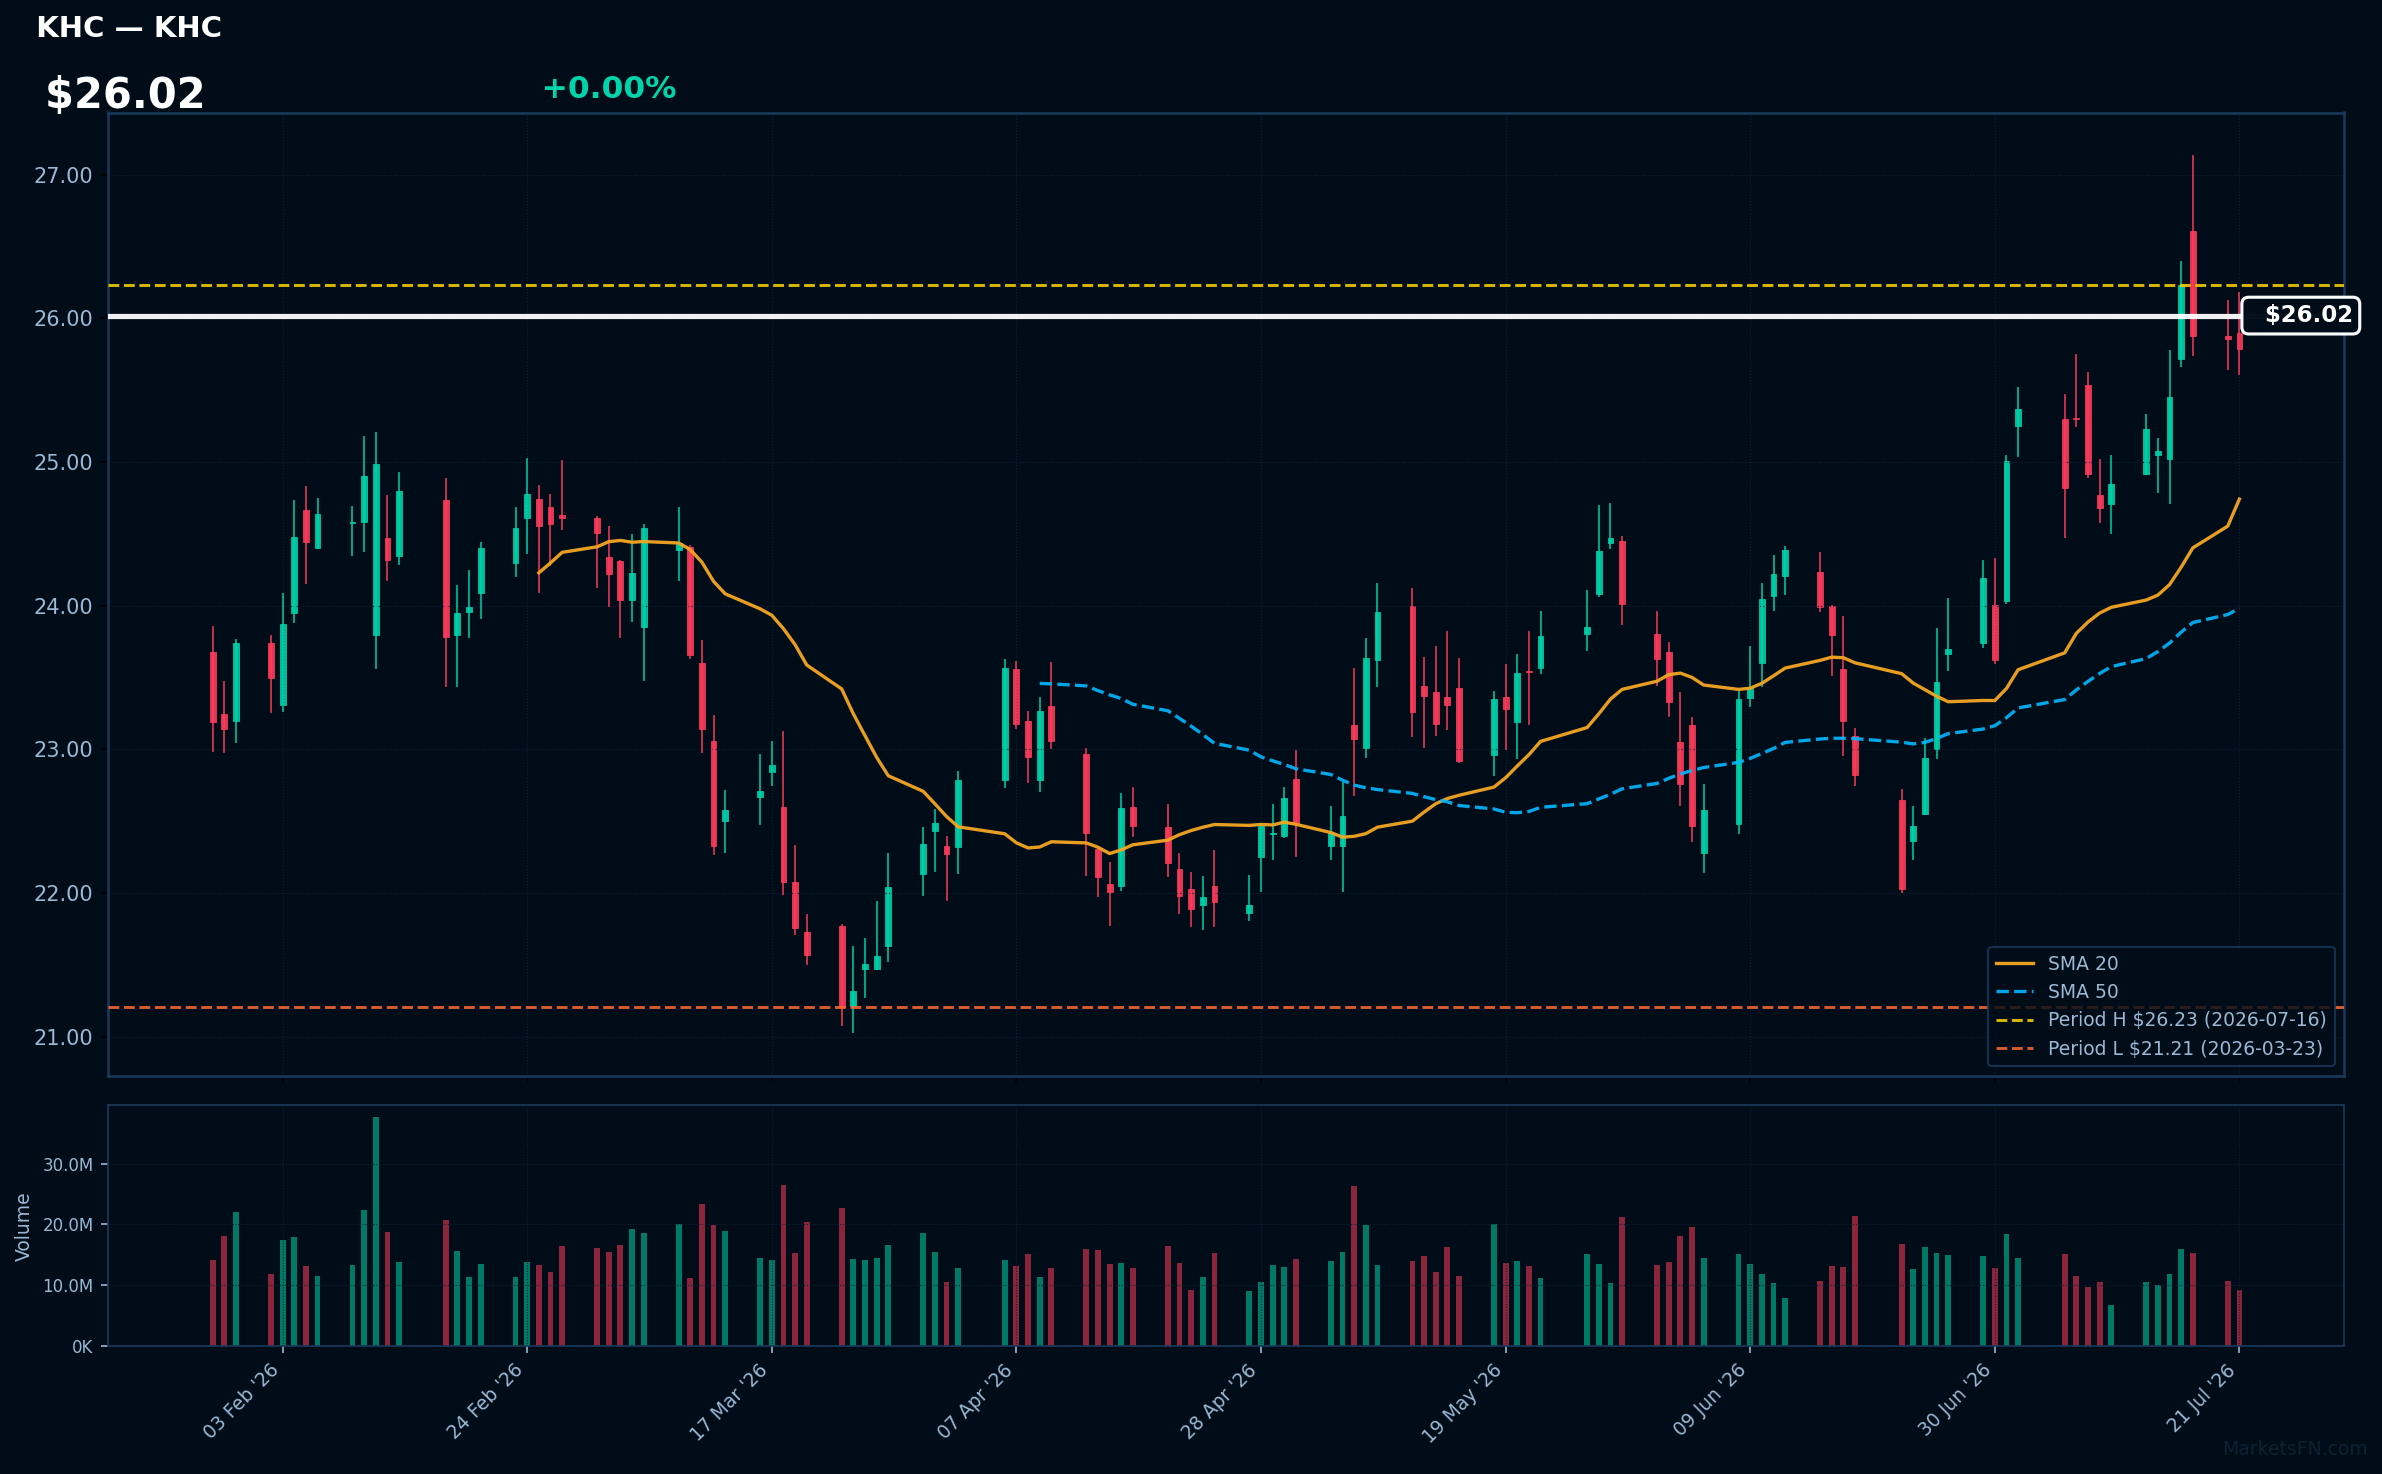
KHC | Kraft Heinz Co | Consumer Defensive | Price Last: $25.79 | % Realized: +5.74% | RSI: 63.2 | % above MA200: +7.8% | Trend: Above MA20, MA50, MA200
Kraft Heinz Co is a packaged food company with well-known brands. Investors should care about its stable cash flows and dividend yield, although specifics aren't provided here. Its performance is relevant to understanding consumer staples sector trends.
Kraft Heinz Co's RSI(14) is 63.2, indicating rising momentum. The MA alignment (price > MA20 > MA50 > MA200) suggests a sustained uptrend. With the stock 1.7% below its 2026 YTD high, it may be nearing a breakout.
Related headlines
- Disney partners with Kraft Heinz for theme parks, cruises, and media
- Kraft Heinz Bets on Disney to Revive Its Brands
- Disney, Kraft Heinz Stocks Slip After Companies Announce Multi-Year Strategic Alliance
- Kraft Heinz and The Walt Disney Company Announce Landmark Alliance, Uniting the Iconic Companies Across Food, Media and Experiences
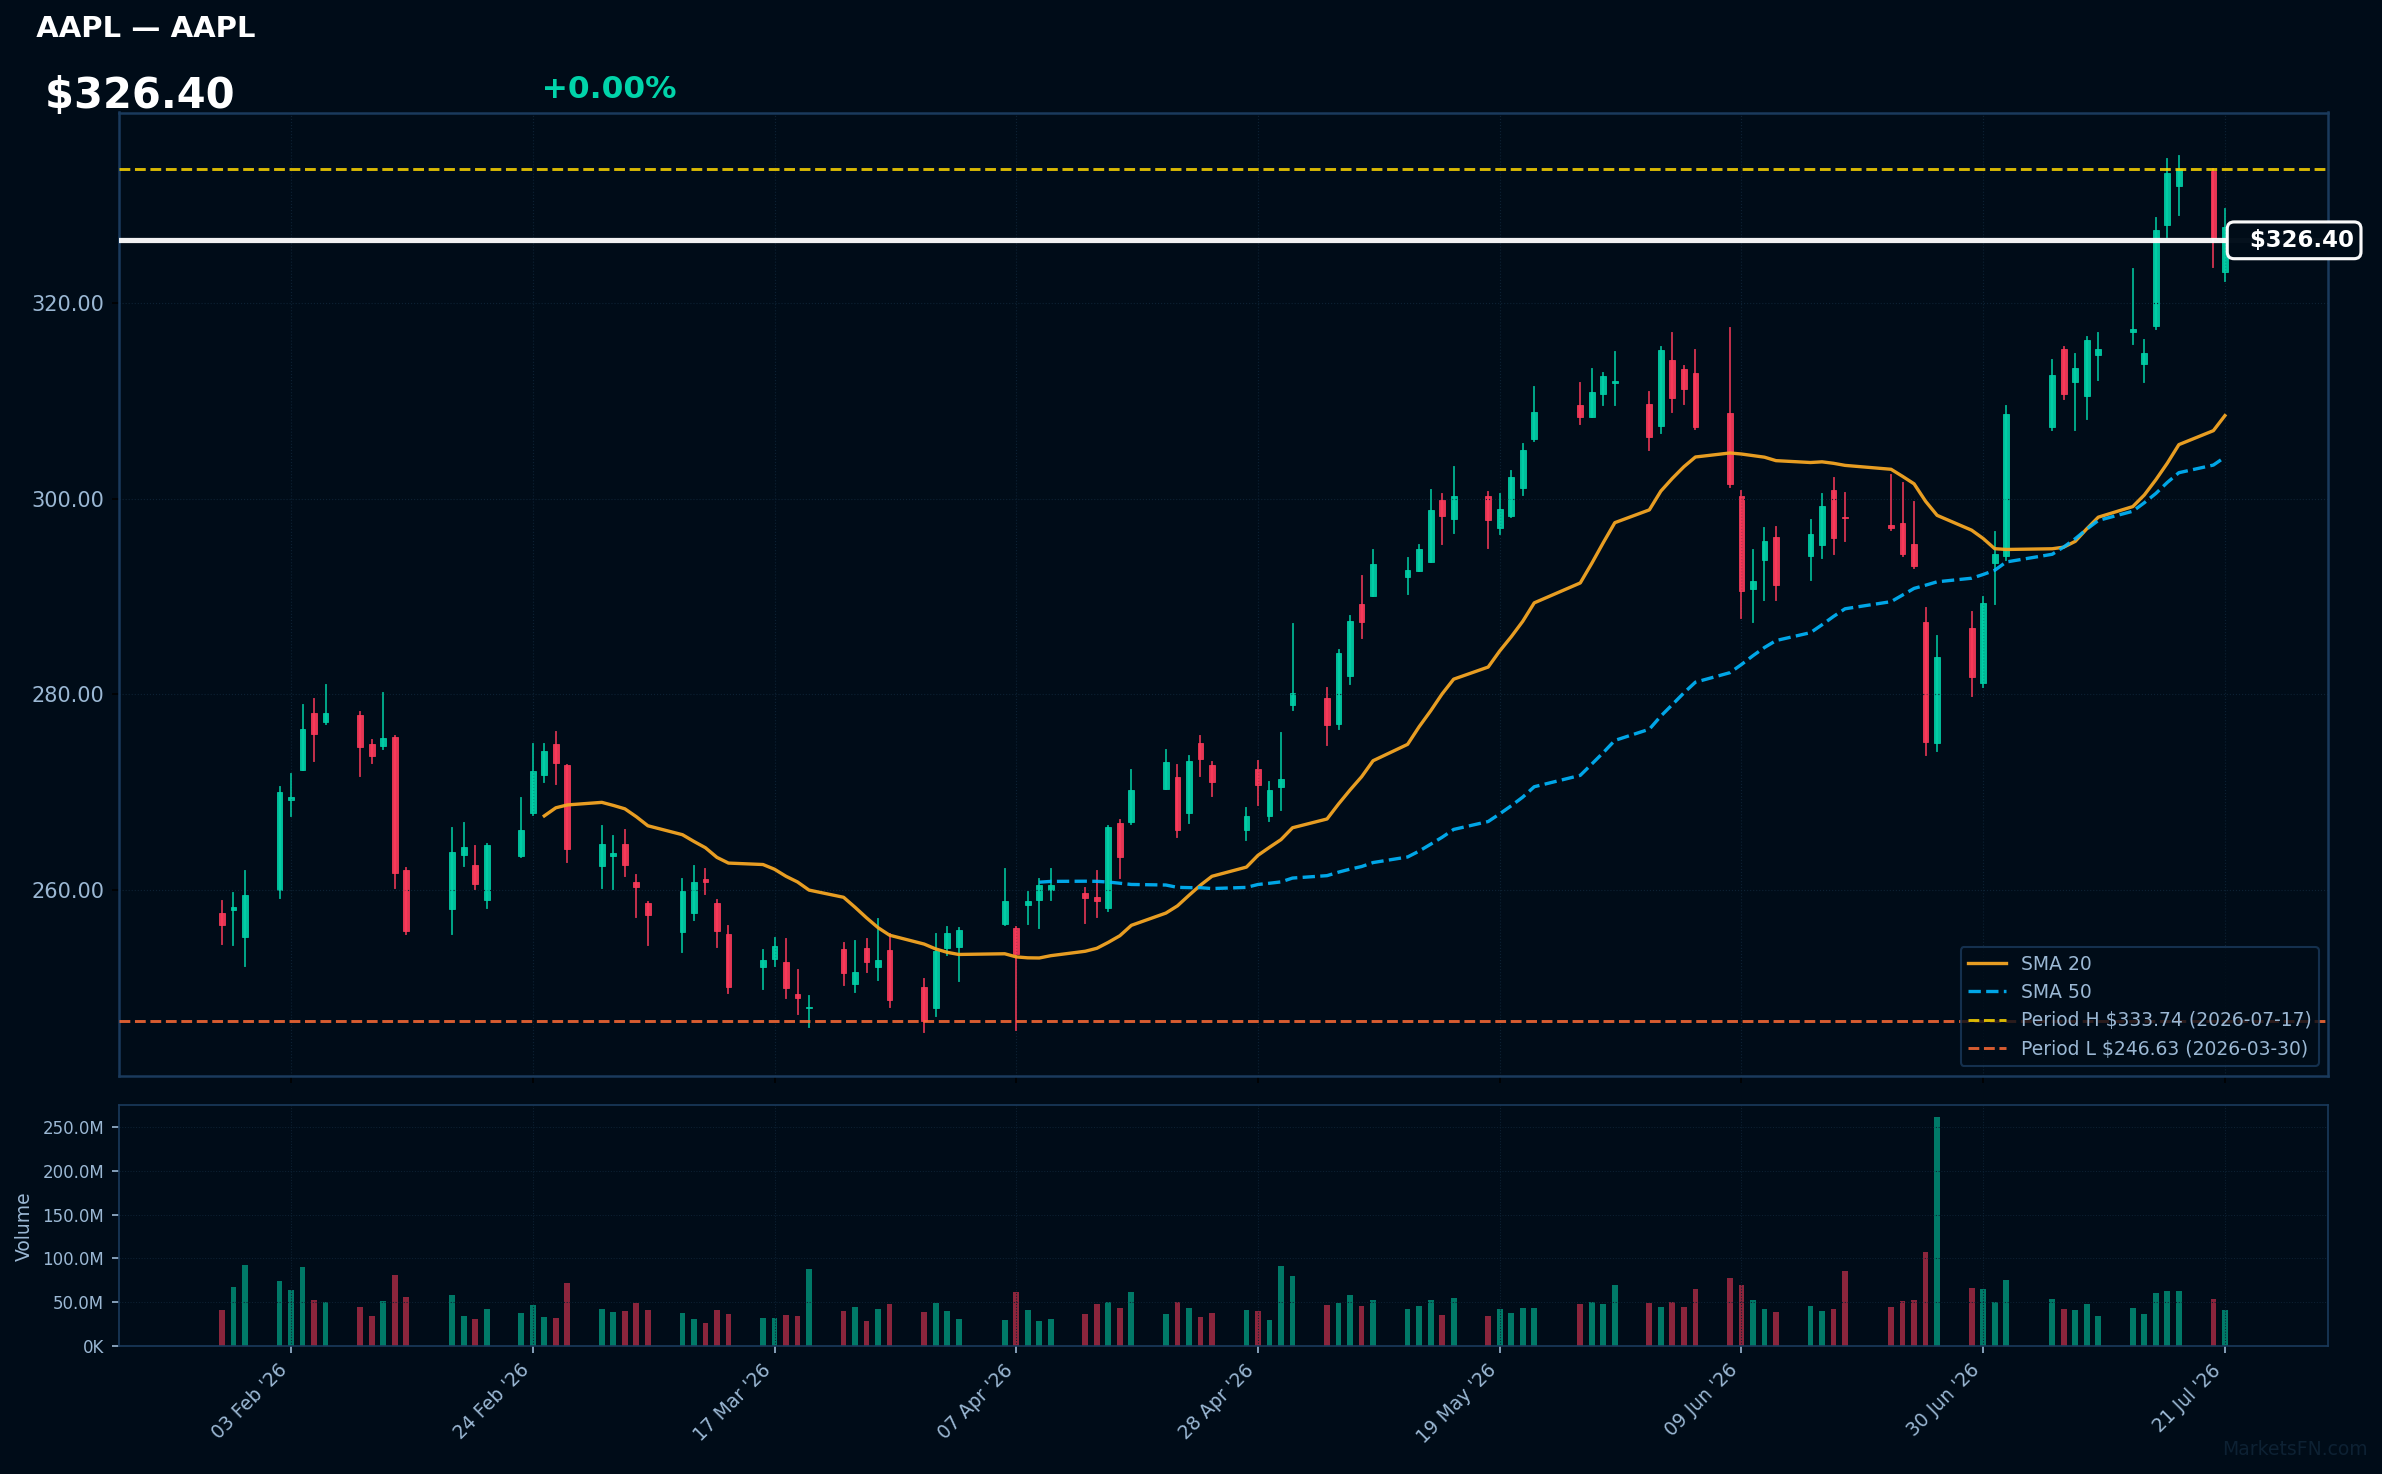
AAPL | Apple Inc | Technology | Price Last: $327.74 | % Realized: +20.93% | RSI: 63.1 | % above MA200: +19.1% | Trend: Above MA20, MA50, MA200
Apple Inc designs, manufactures, and markets consumer electronics, software, and services. Investors should care about its innovative product ecosystem, services growth, and profitability. Its ability to maintain premium pricing and expand into new markets like wearables and services is key.
AAPL is in a sustained uptrend with price > MA20 > MA50 > MA200. The RSI(14) is 63.1, indicating building momentum. It's 1.8% below its 2026 YTD high, suggesting a potential breakout. The 20.9% 2026 YTD return reinforces the bullish technical picture.
Related headlines
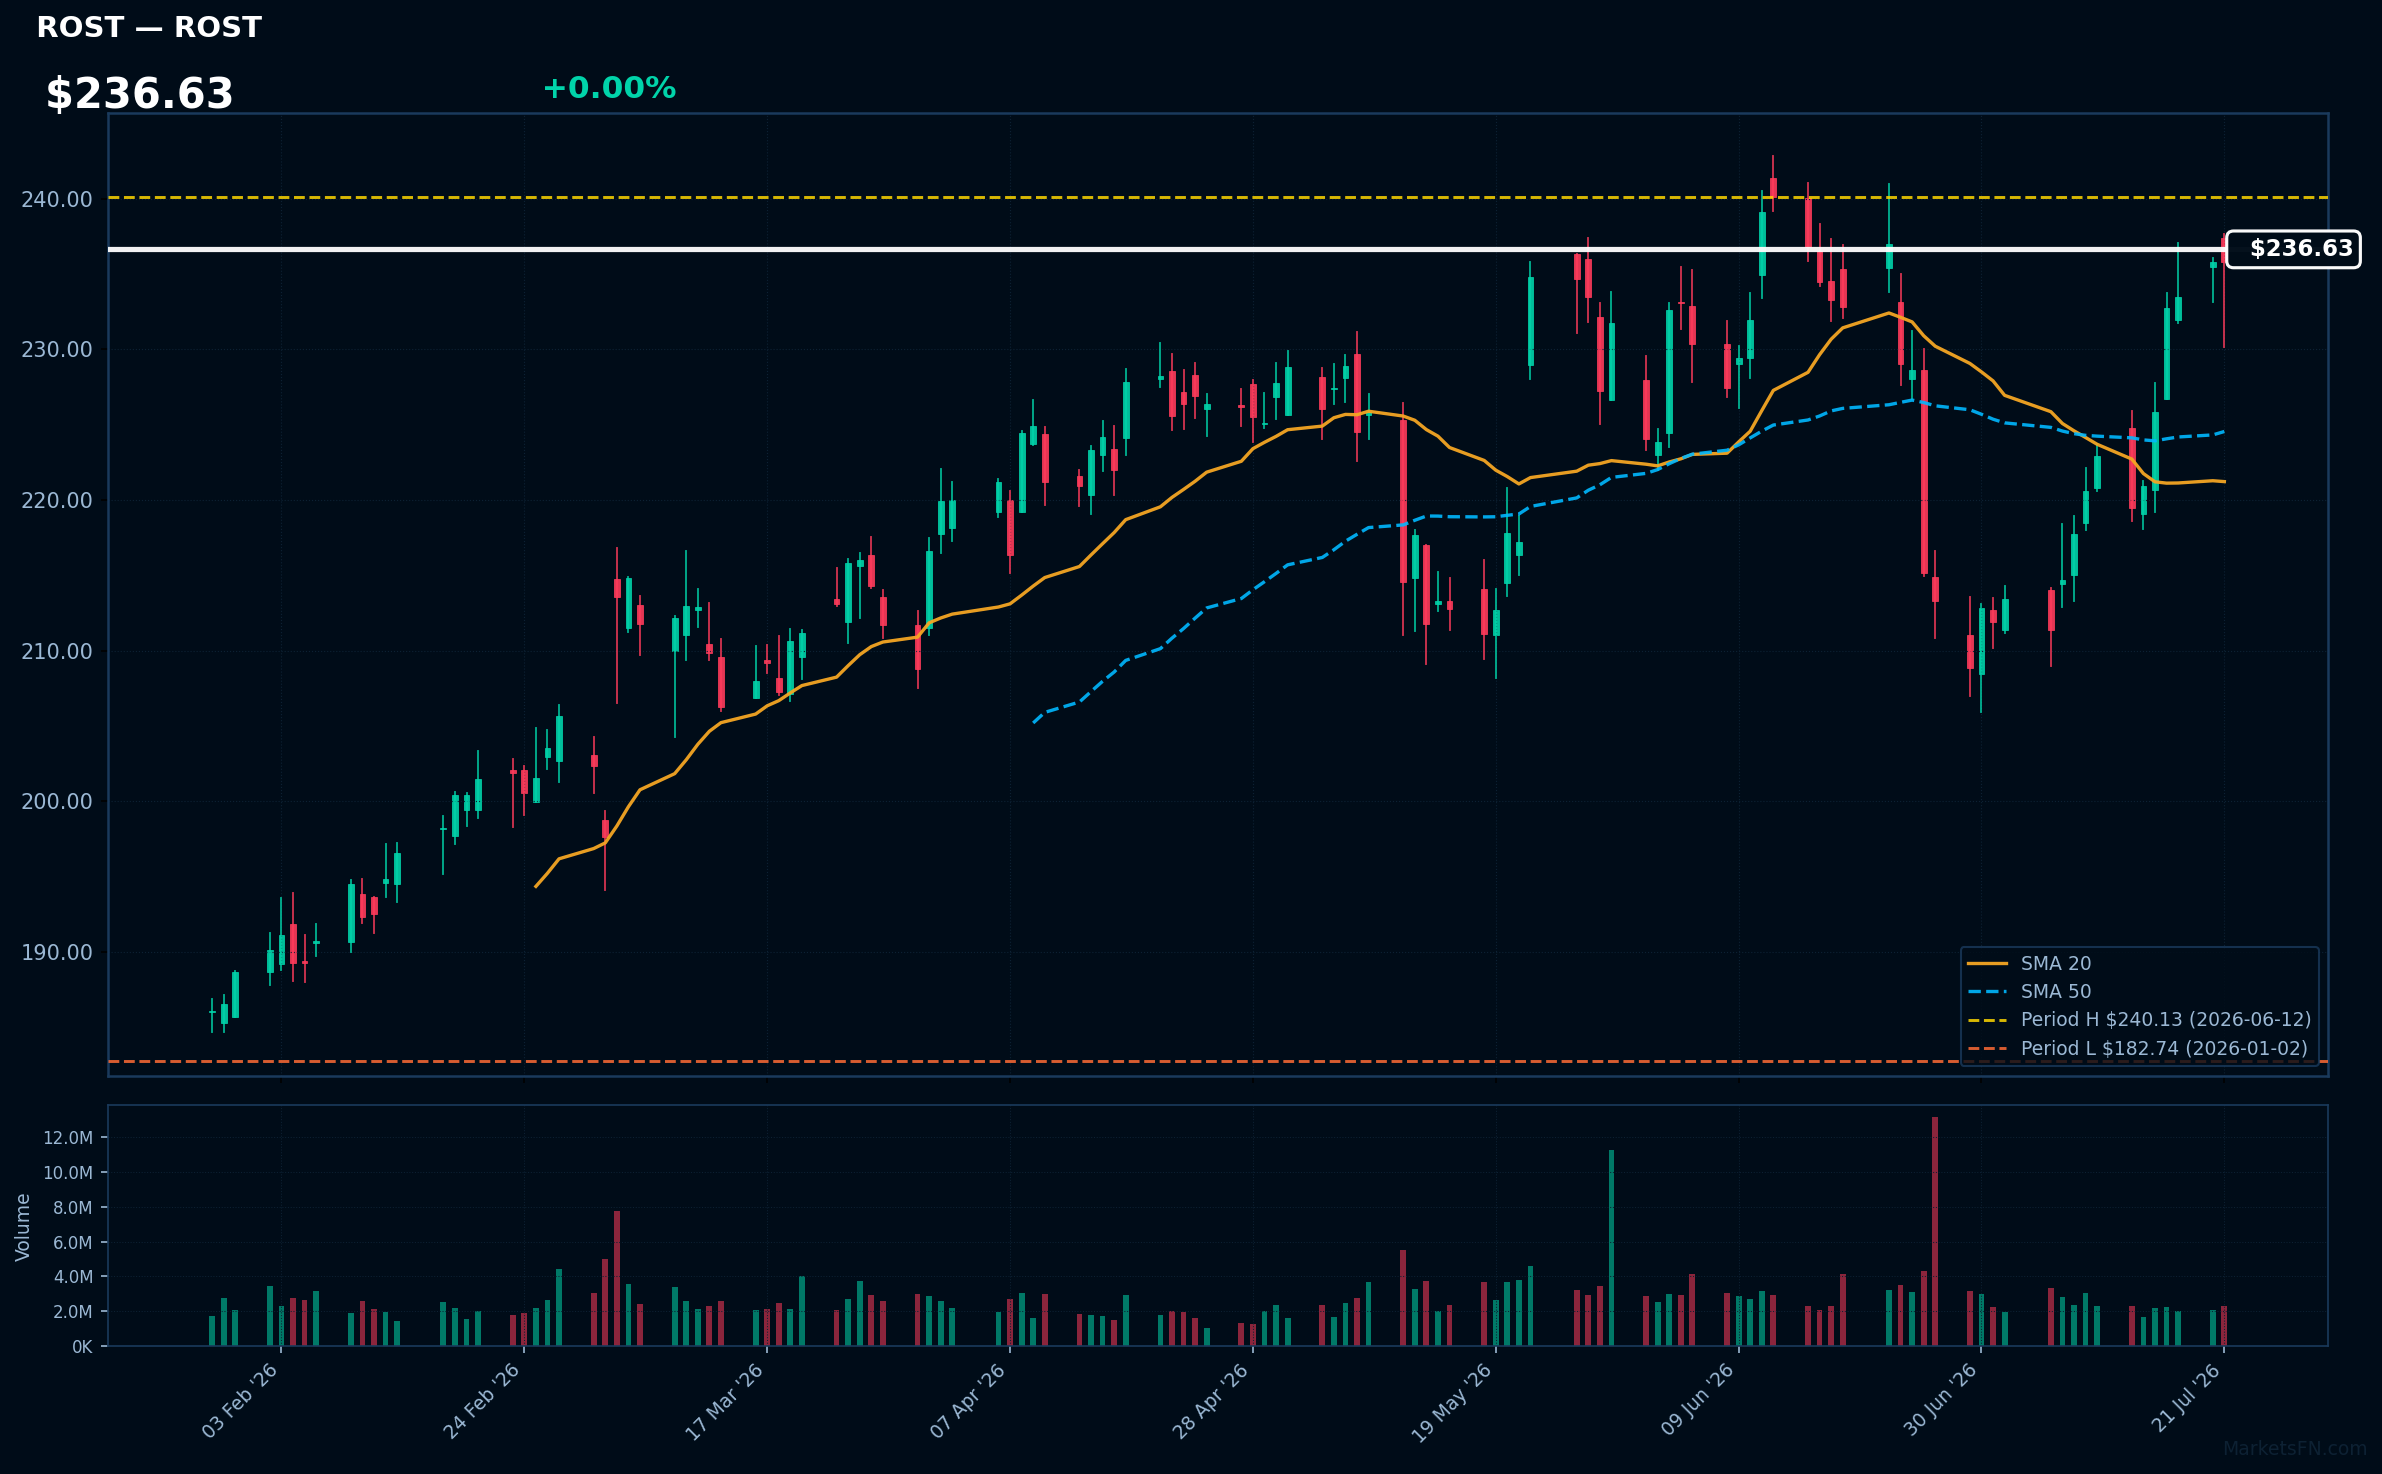
ROST | Ross Stores, Inc | Consumer Cyclical | Price Last: $235.81 | % Realized: +29.04% | RSI: 64.3 | % above MA200: +18.4% | Trend: Above MA20, MA50, MA200
Ross Stores, Inc operates as an off-price retailer, offering discounted branded apparel and home goods. Investors should care about its ability to maintain margins and sales growth amidst competitive retail landscape.
Ross Stores, Inc is near a potential breakout, with RSI(14) at 64.3 and price above MA20/MA50/MA200, indicating momentum; it's 1.8% below its 2026 YTD high, having returned 29.0% YTD.
Related headlines
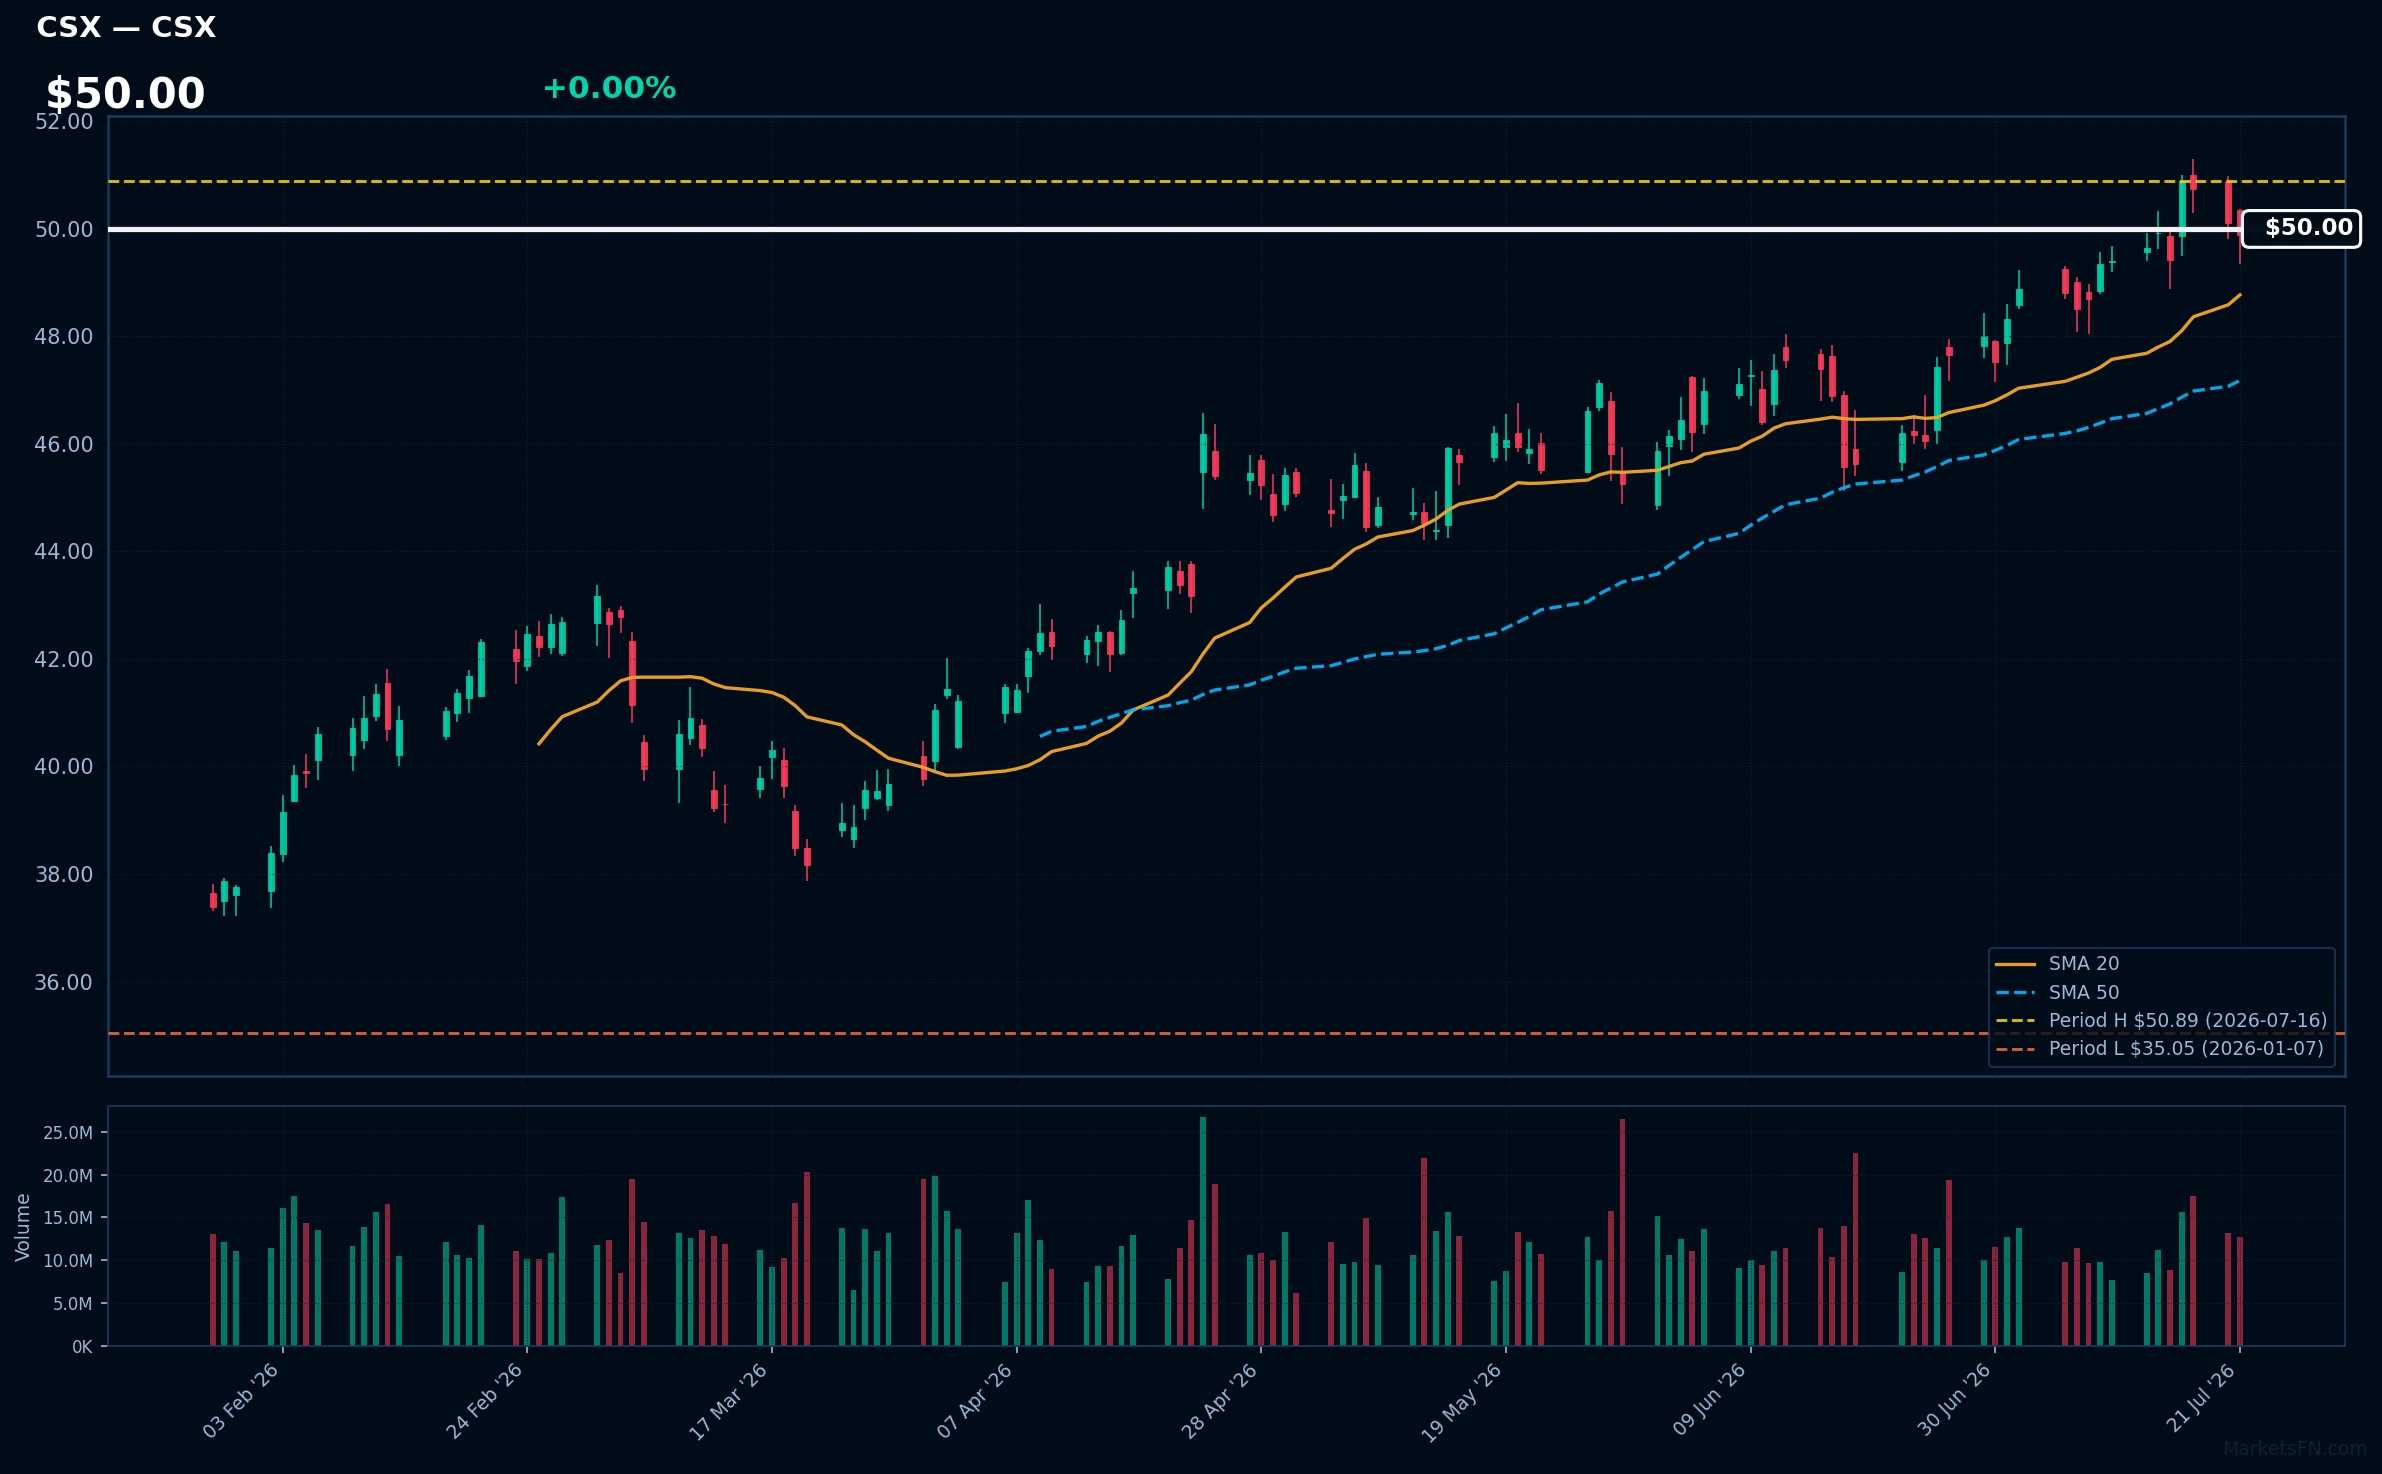
CSX | CSX Corp | Industrials | Price Last: $49.89 | % Realized: +37.55% | RSI: 62.0 | % above MA200: +22.4% | Trend: Above MA20, MA50, MA200
CSX Corp operates a rail network transporting coal, intermodal containers, and automotive goods, making it a key player in North American freight infrastructure; investors should care due to its critical role in the supply chain and potential for steady cash flows.
CSX is in a sustained uptrend with price > MA20 > MA50 > MA200, RSI(14) at 62.0, and is 2.0% below its 2026 YTD high, indicating strong momentum with no clear warning signs; the stock has returned 37.6% YTD in 2026.
Related headlines
📉 Nearest to 2026 Low
Sectors represented: Communication Services (2), Consumer Defensive (1), Industrials (1), Healthcare (1)
| Ticker | Company | Sector | Price Last | % Realized | 2026 YTD Low Date | RSI | % above MA200 | Trend |
|---|---|---|---|---|---|---|---|---|
| PEP | PepsiCo Inc | Consumer Defensive | $135.00 | -5.08% | 2026-07-21 | 39.7 | -9.9% | Below MA20, MA50, MA200 |
| CPRT | Copart, Inc | Industrials | $27.17 | -28.06% | 2026-07-21 | 37.8 | -25.4% | Below MA20, MA50, MA200 |
| WBD | Warner Bros. Discovery Inc | Communication Services | $25.83 | -9.40% | 2026-07-21 | 37.8 | -1.4% | Below MA20, MA50, MA200 |
| ISRG | Intuitive Surgical Inc | Healthcare | $350.06 | -37.71% | 2026-07-17 | 32.4 | -27.8% | Below MA20, MA50, MA200 |
| NFLX | Netflix Inc | Communication Services | $68.67 | -24.53% | 2026-07-20 | 37.1 | -26.2% | Below MA20, MA50, MA200 |
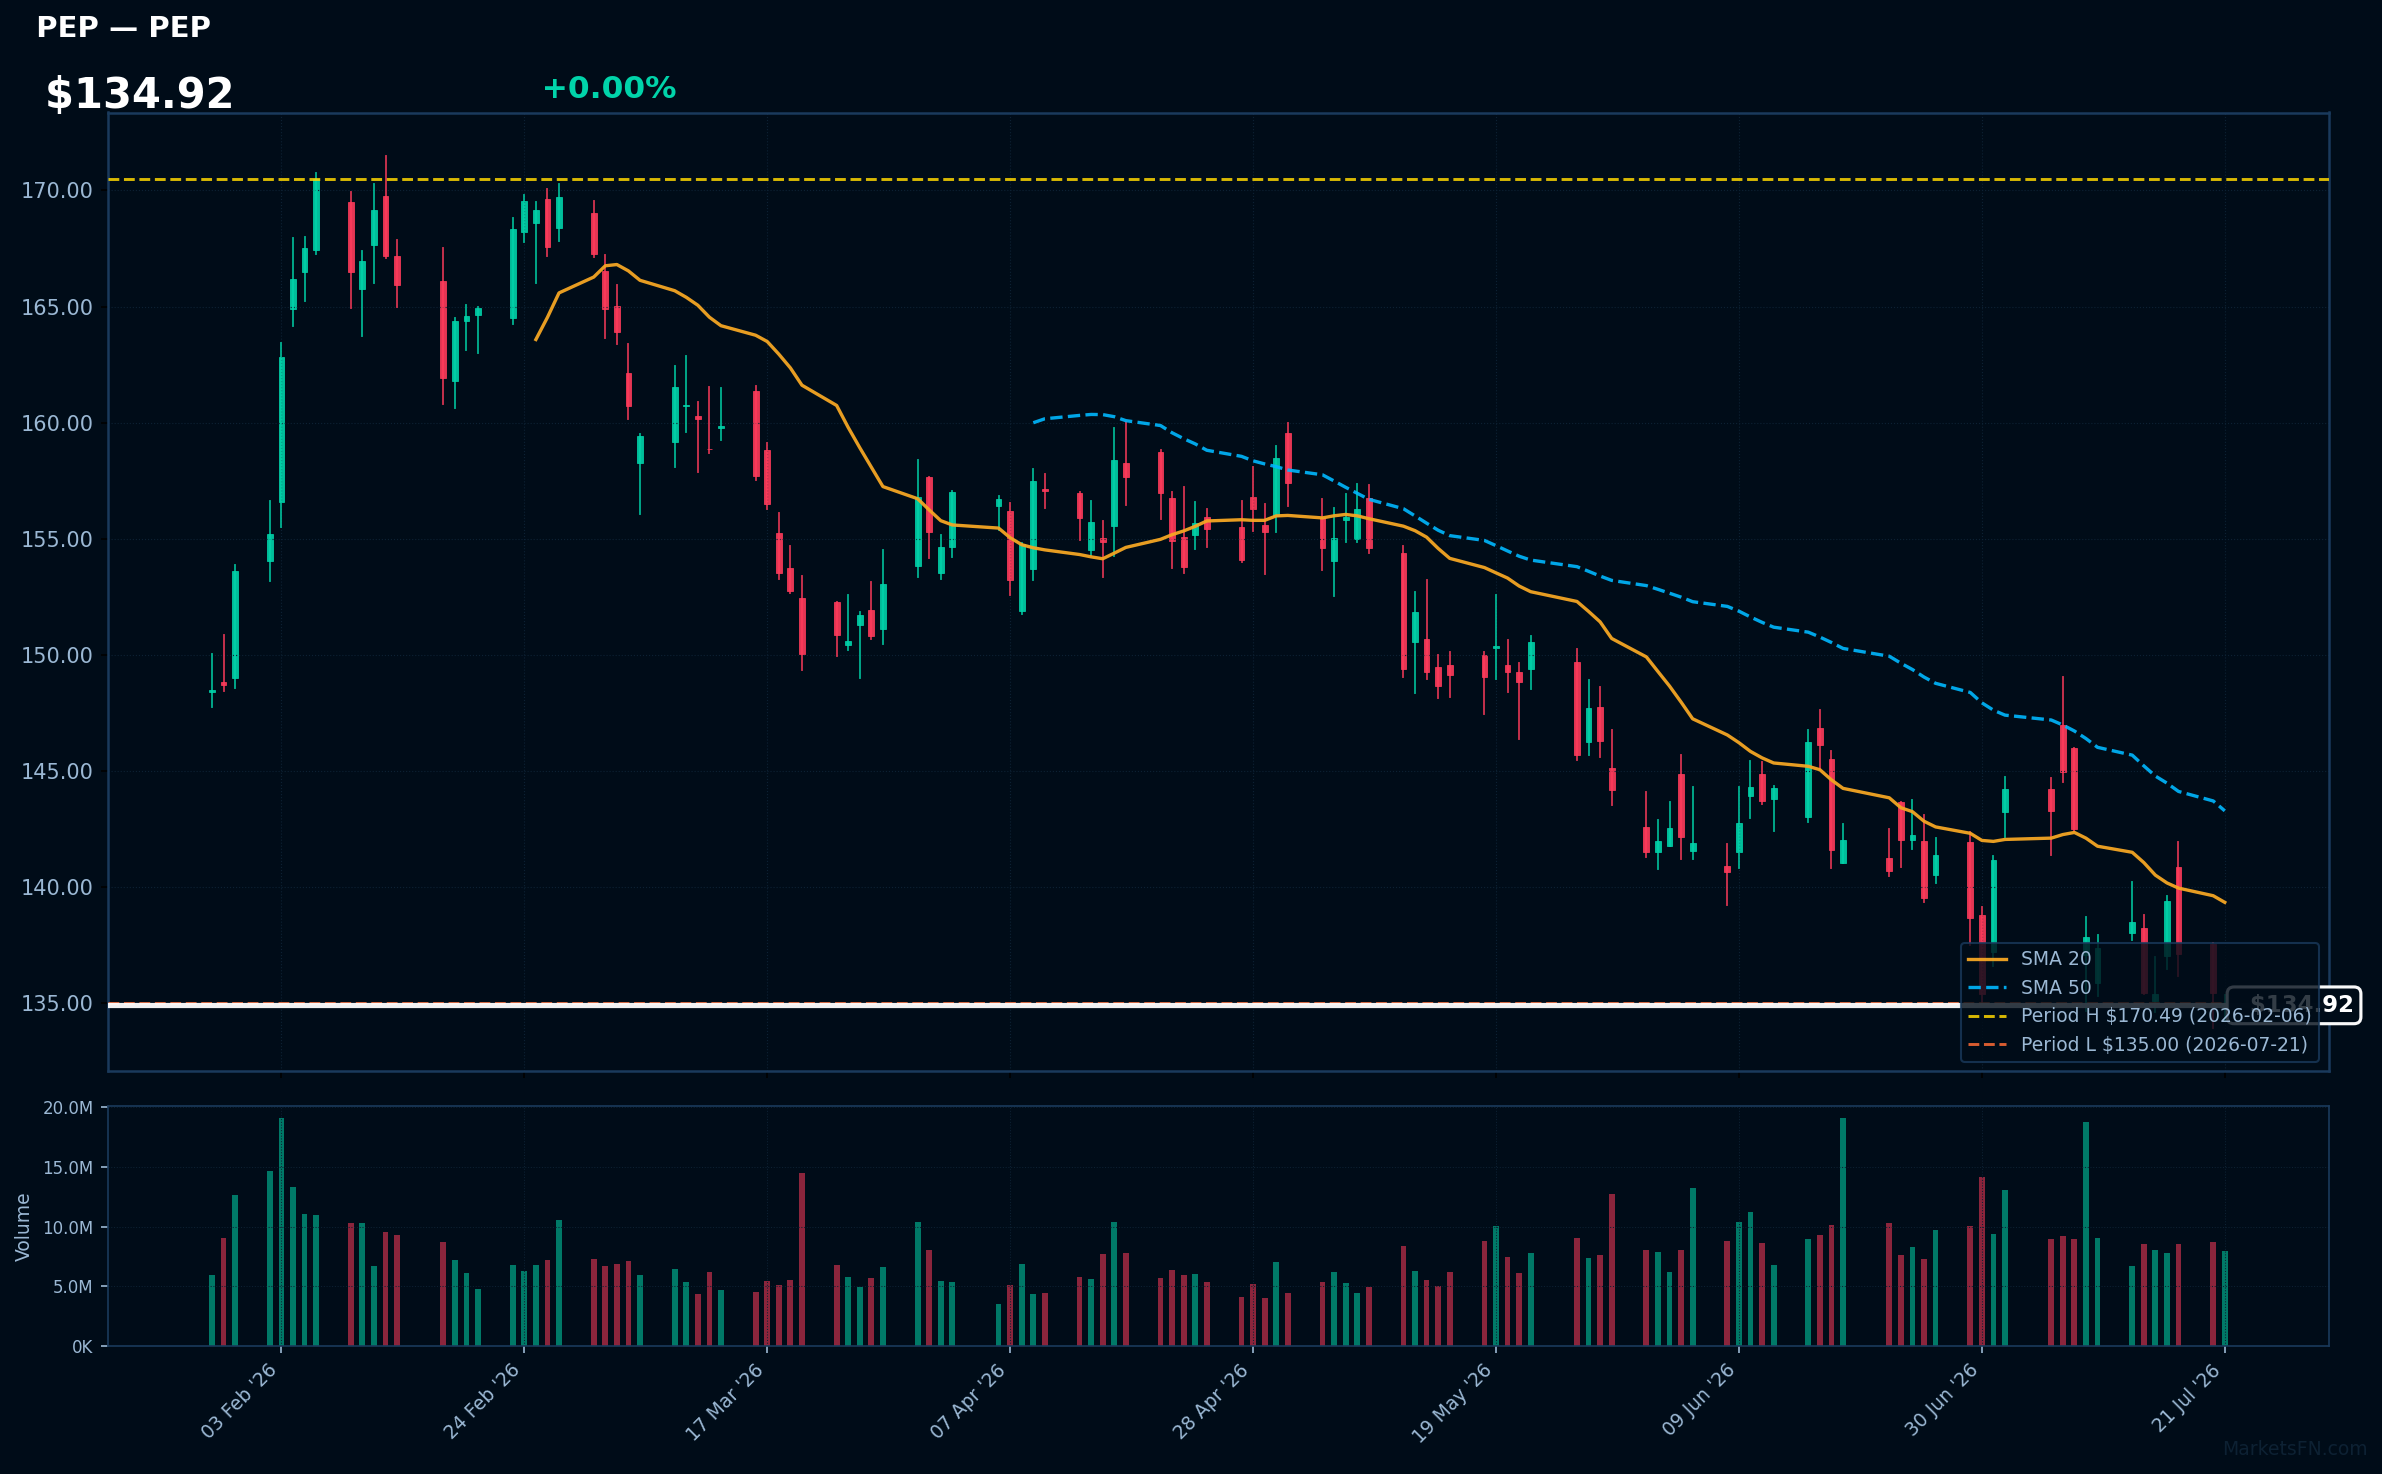
PEP | PepsiCo Inc | Consumer Defensive | Price Last: $135.00 | % Realized: -5.08% | RSI: 39.7 | % above MA200: -9.9% | Trend: Below MA20, MA50, MA200
PepsiCo Inc is a global food and beverage leader with brands like Pepsi, Lay's, and Gatorade, generating revenue through beverage sales, snack foods, and other categories. Investors care about its diversified portfolio and market share in the consumer staples sector.
PepsiCo's technical situation is bearish, with an RSI(14) of 39.7 indicating oversold conditions and a sustained downtrend as price ($134.92) remains below MA20, MA50, and MA200. The stock is testing major support at its 2026 YTD low.
Related headlines
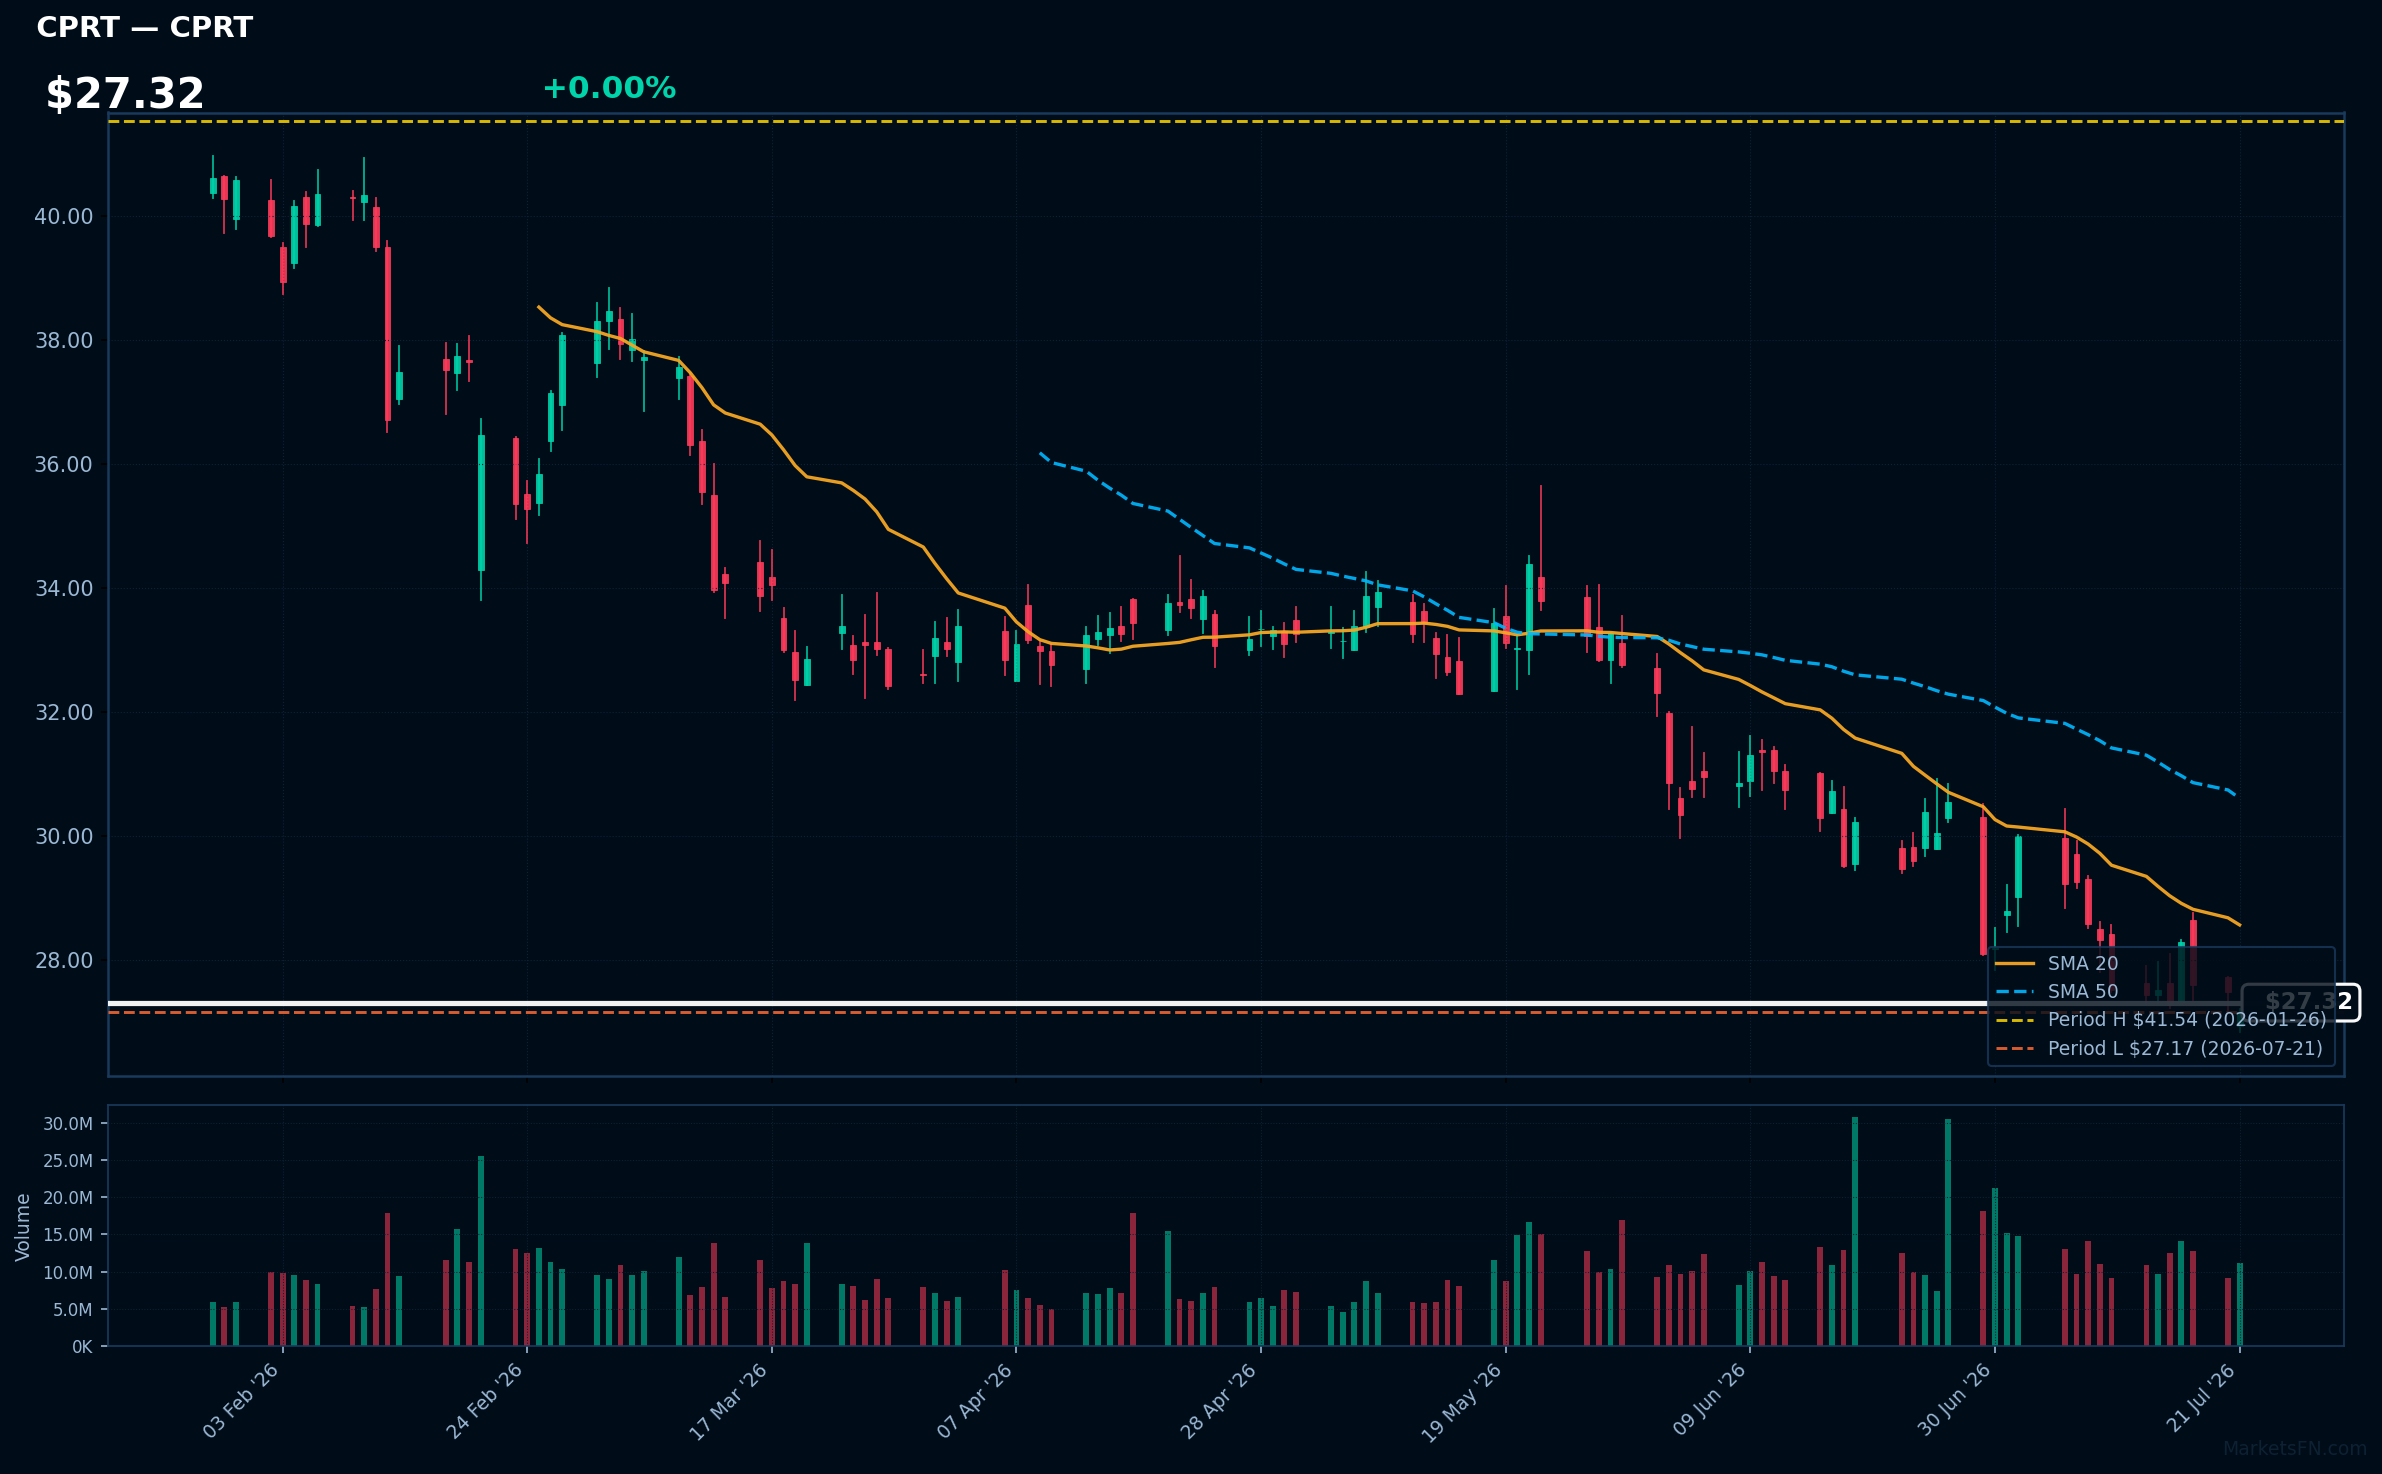
CPRT | Copart, Inc | Industrials | Price Last: $27.17 | % Realized: -28.06% | RSI: 37.8 | % above MA200: -25.4% | Trend: Below MA20, MA50, MA200
Copart, Inc (CPRT) operates an online vehicle auction platform and provides related services, allowing insurance companies and other sellers to sell damaged or used vehicles to buyers worldwide. Investors care due to its market dominance and growth potential.
Copart's technical situation is bearish, with an RSI(14) of 37.8 indicating weakening momentum. The sustained downtrend is evident as price ($27.32) < MA20 < MA50 < MA200, and it's testing major support at its 2026 YTD low.
Related headlines
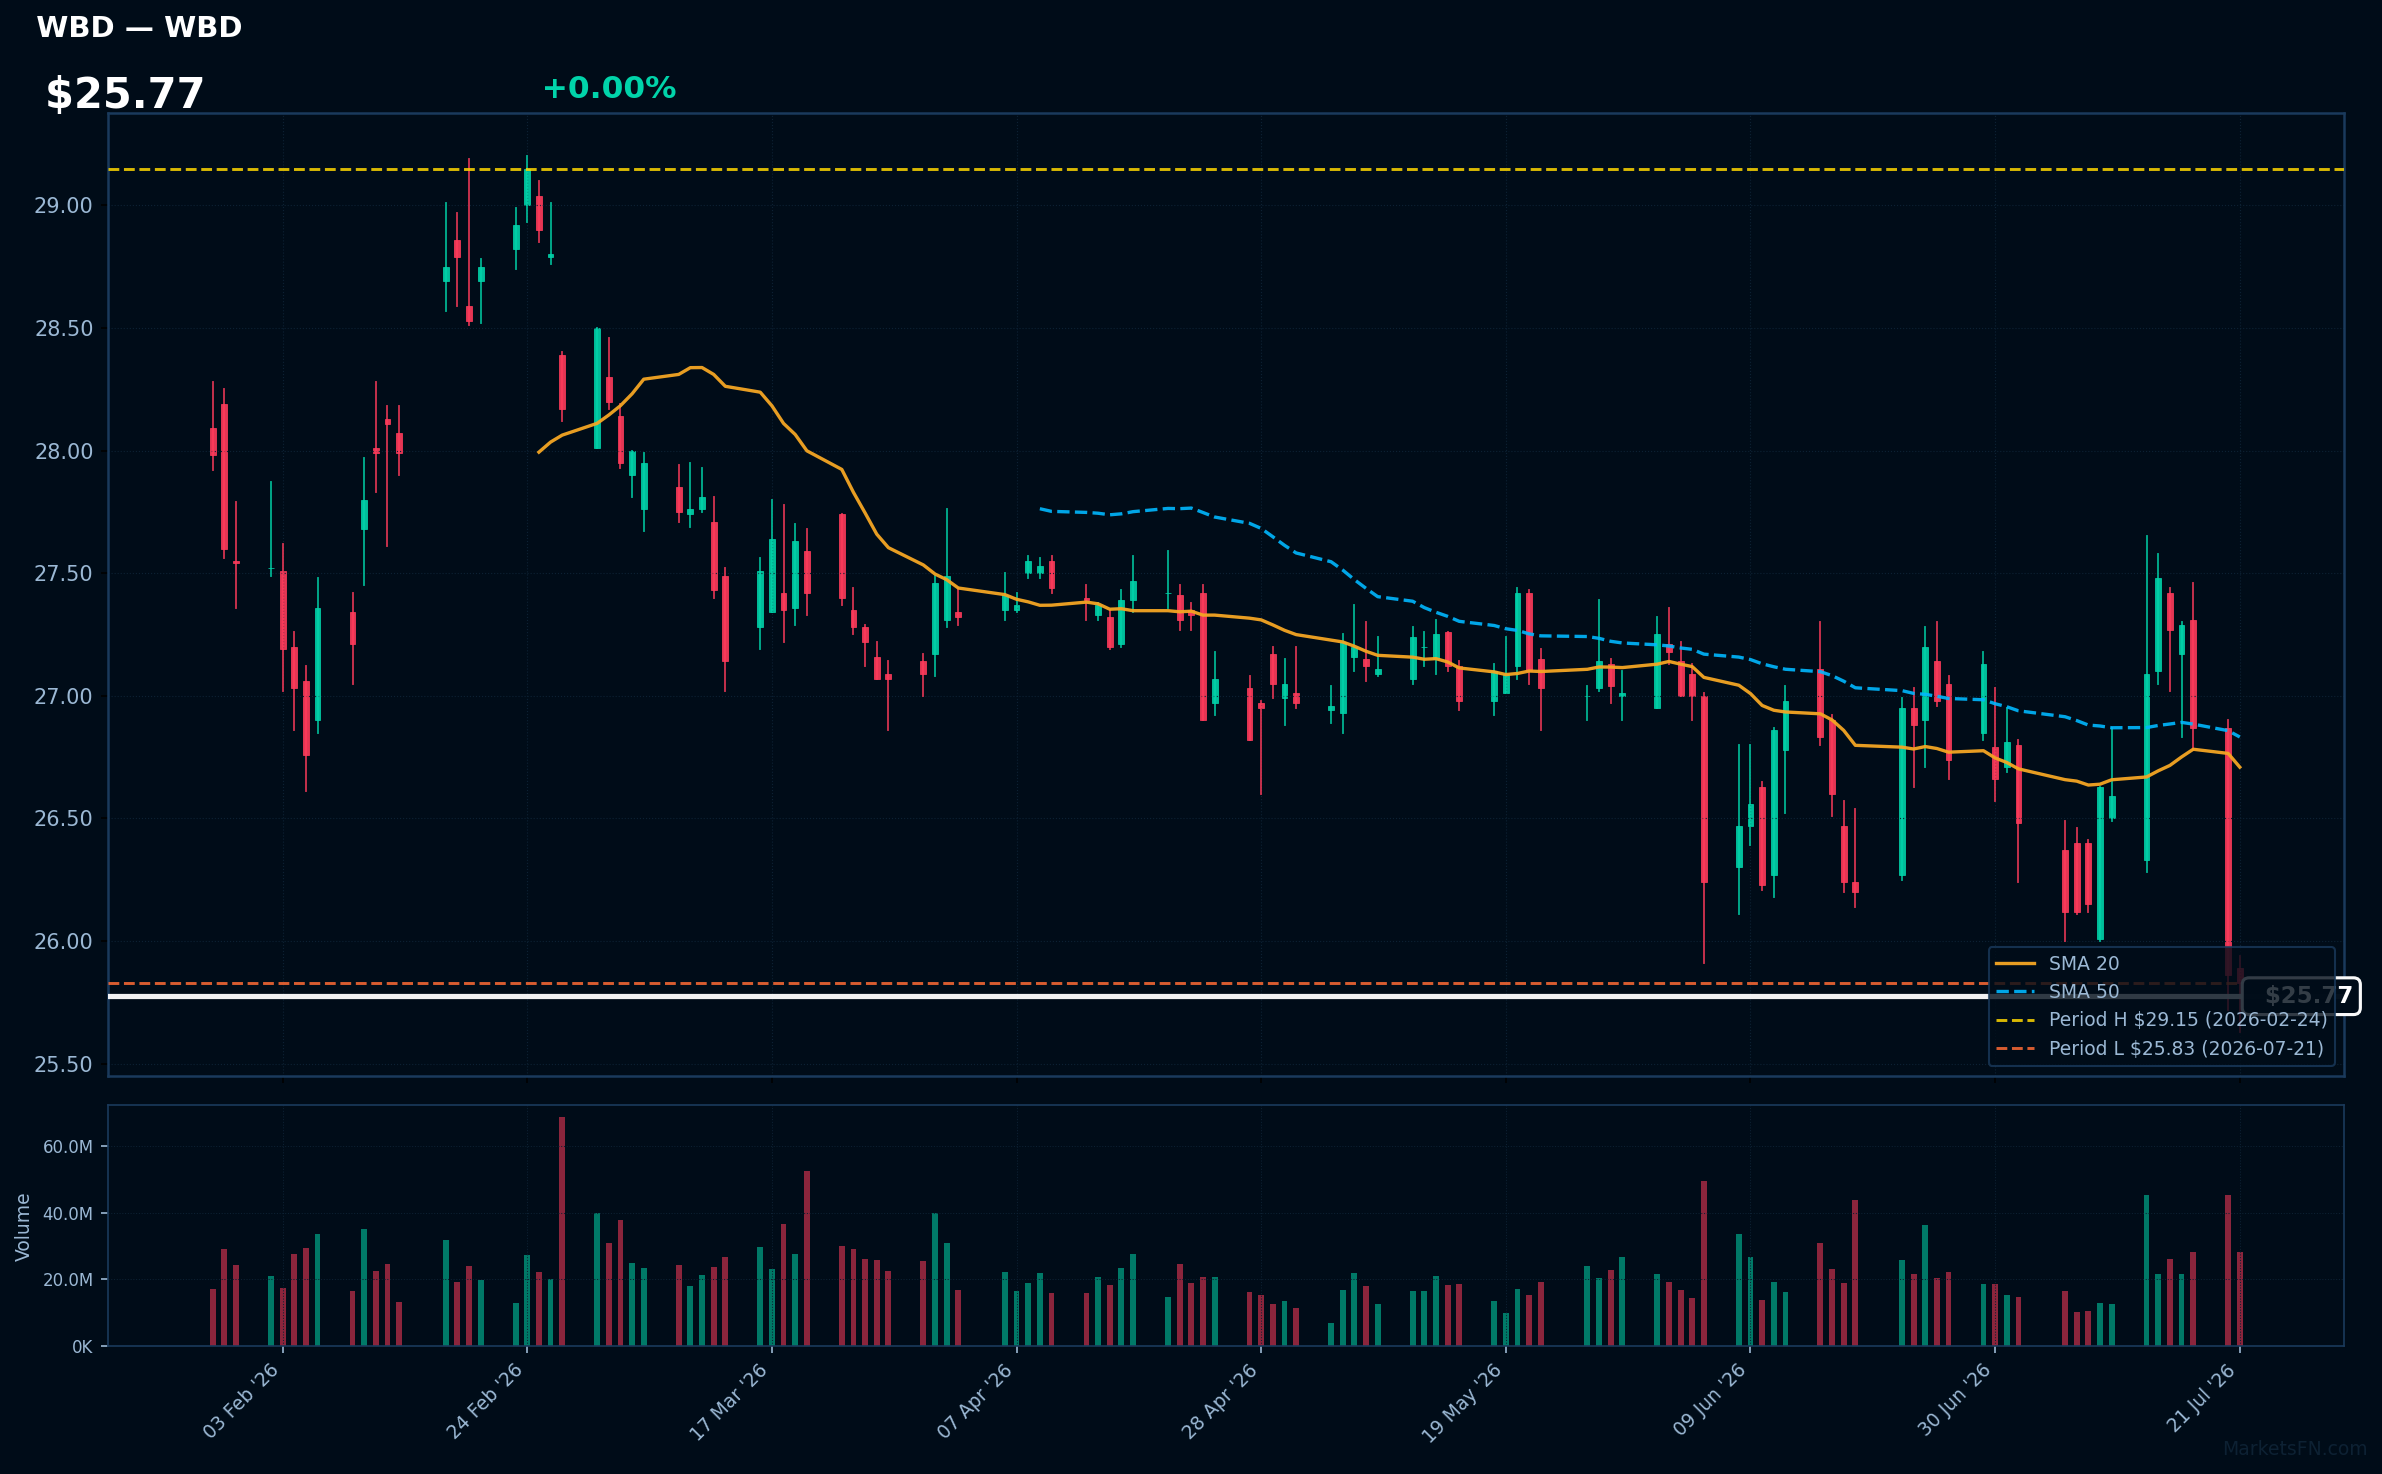
WBD | Warner Bros. Discovery Inc | Communication Services | Price Last: $25.83 | % Realized: -9.40% | RSI: 37.8 | % above MA200: -1.4% | Trend: Below MA20, MA50, MA200
Warner Bros. Discovery Inc is a media conglomerate with significant holdings in film, television, and streaming through brands like HBO, Warner Bros., and Discovery. Investors should care due to its influence on global entertainment content and potential for growth in streaming.
The stock is testing major support at its 2026 YTD low with an RSI(14) of 37.8, indicating oversold conditions, and is below MA20, MA50, and MA200, showing mixed signals; the 2026 YTD return is -9.4%.
Related headlines
- Paramount's $110 Billion Warner Deal Faces Delay That Could Cost Billions
- Why Paramount could win if it loses the Warner Bros. Discovery deal
- What to know about the landmark Warner Bros. Discovery sale
- Paramount-Warner merger faces legal setback as antitrust challenge threatens $100 billion deal (PSKY) (WBD)
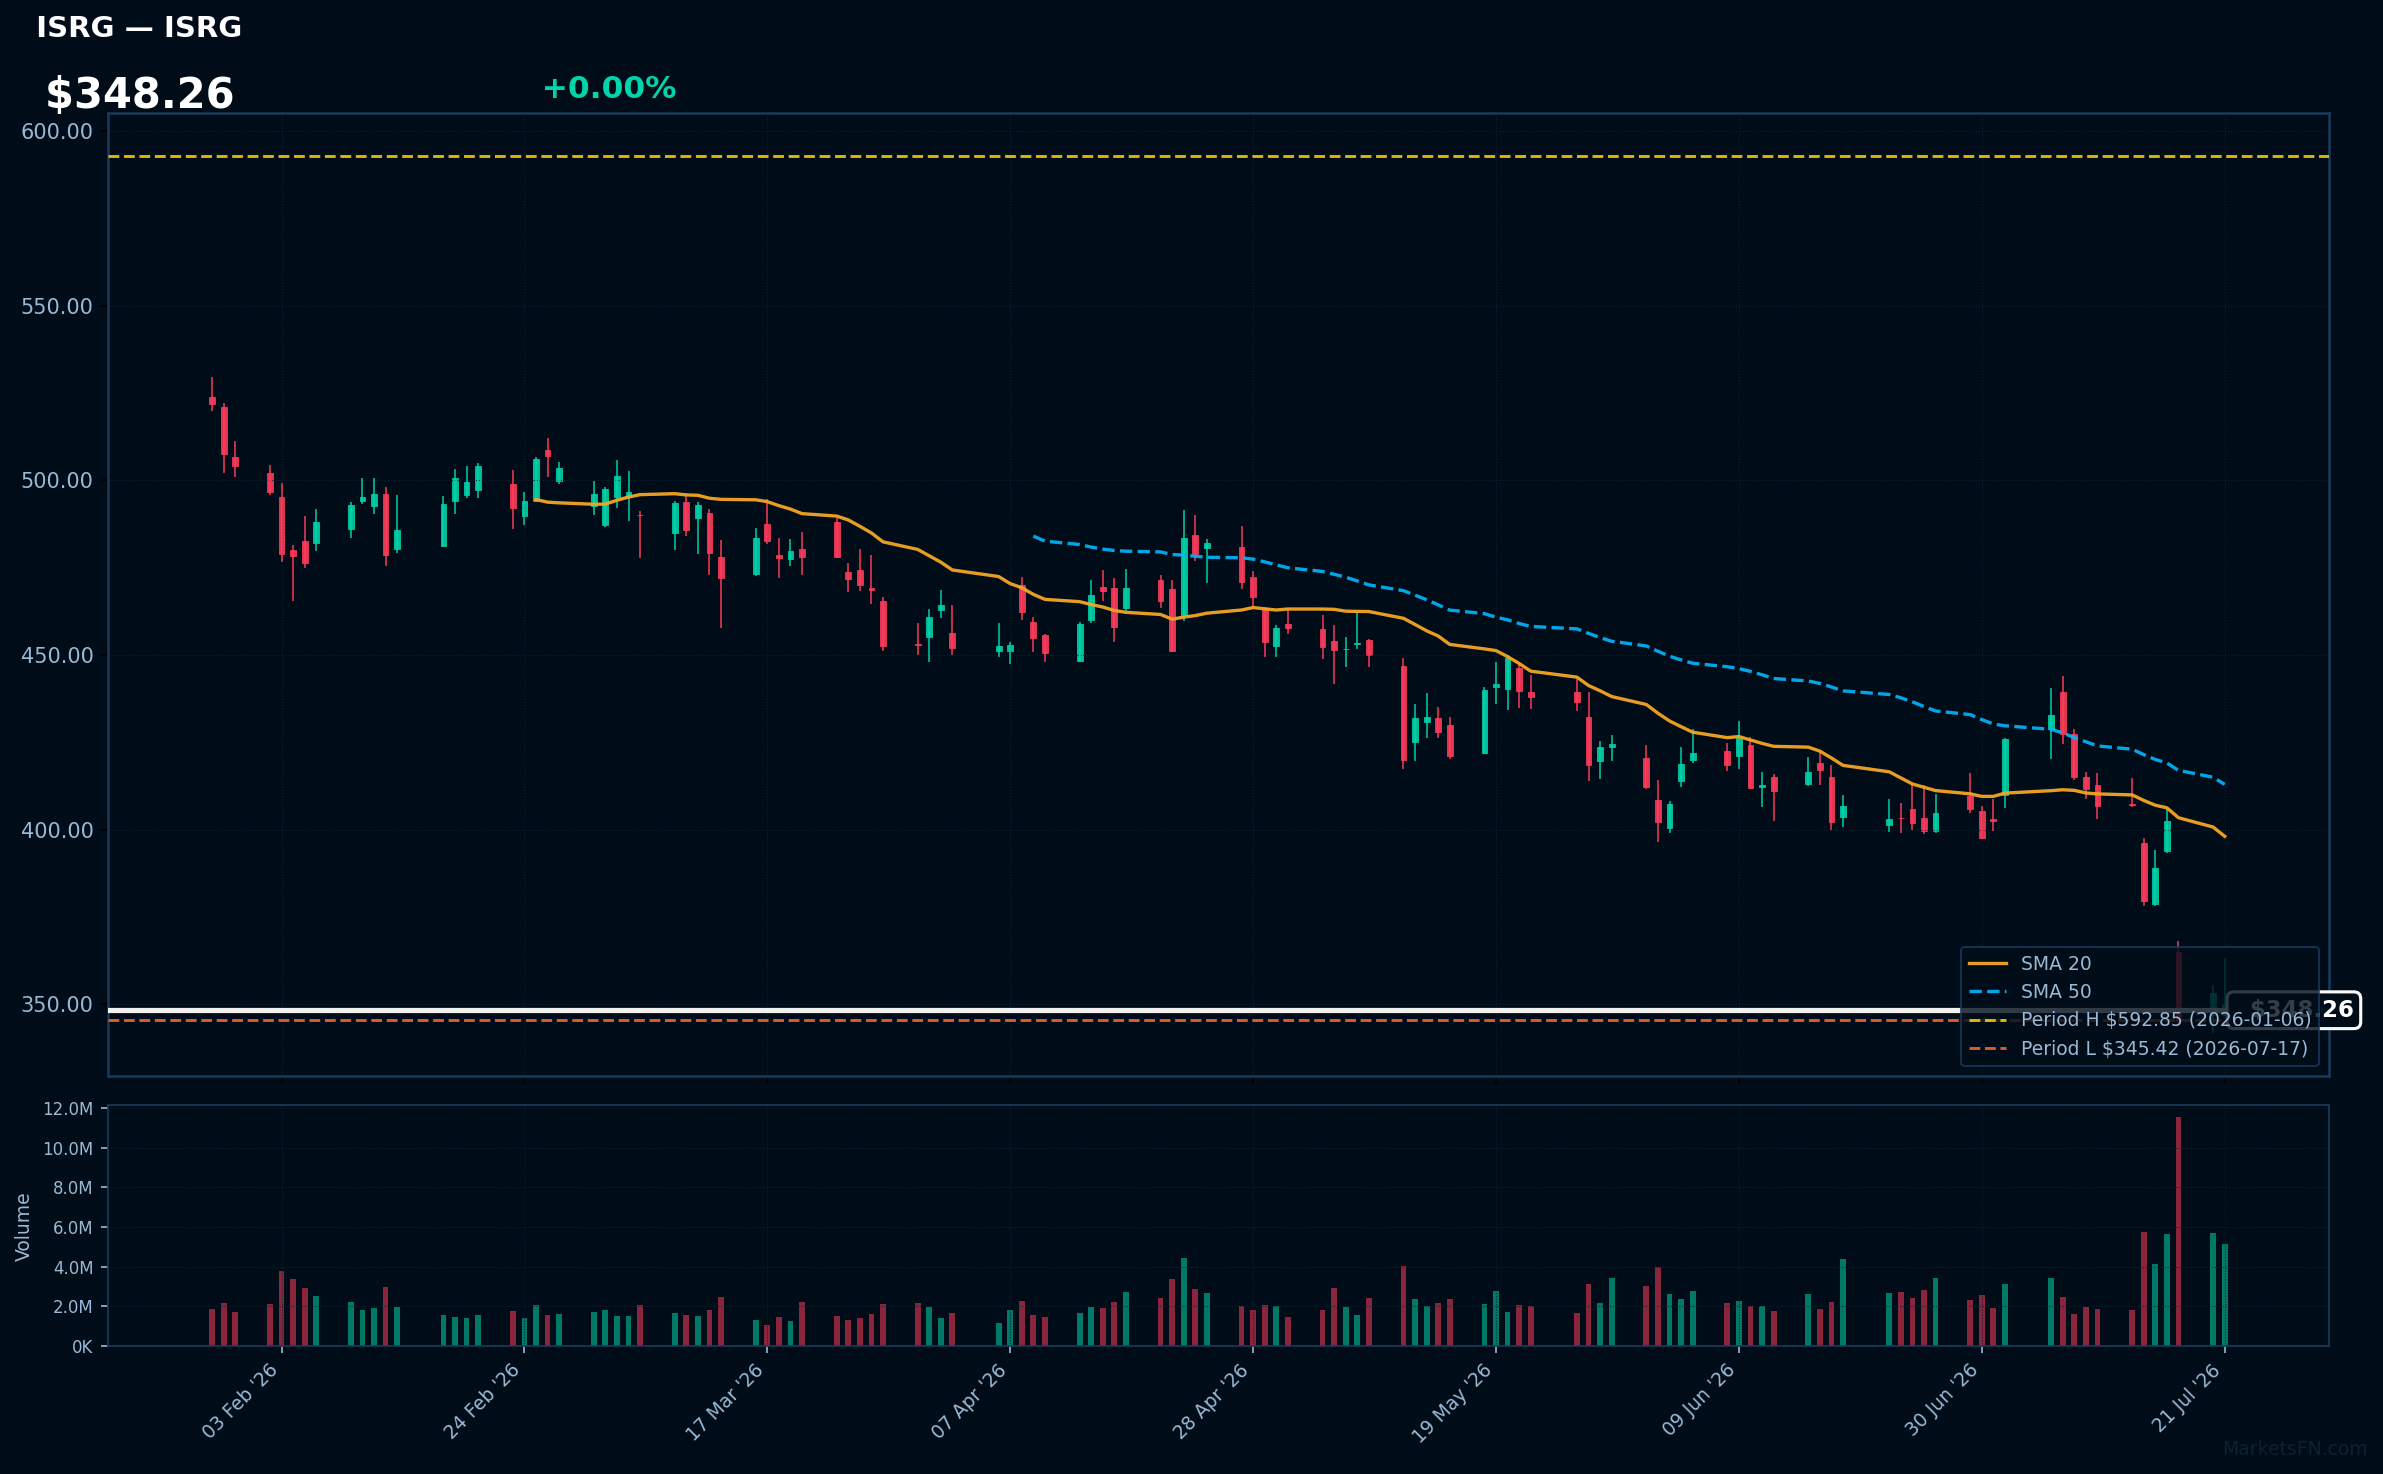
ISRG | Intuitive Surgical Inc | Healthcare | Price Last: $350.06 | % Realized: -37.71% | RSI: 32.4 | % above MA200: -27.8% | Trend: Below MA20, MA50, MA200
Intuitive Surgical Inc develops and markets robotic-assisted surgical systems, primarily the da Vinci Surgical System, enhancing precision and minimally invasive procedures. Investors should care as its technology adoption impacts surgical practices and healthcare outcomes.
ISRG's technical situation indicates a sustained downtrend with price ($348.26) below MA20, MA50, and MA200. RSI(14) at 32.4 suggests oversold conditions, and being 1.3% above its 2026 YTD low tests major support, potentially a warning sign.
Related headlines
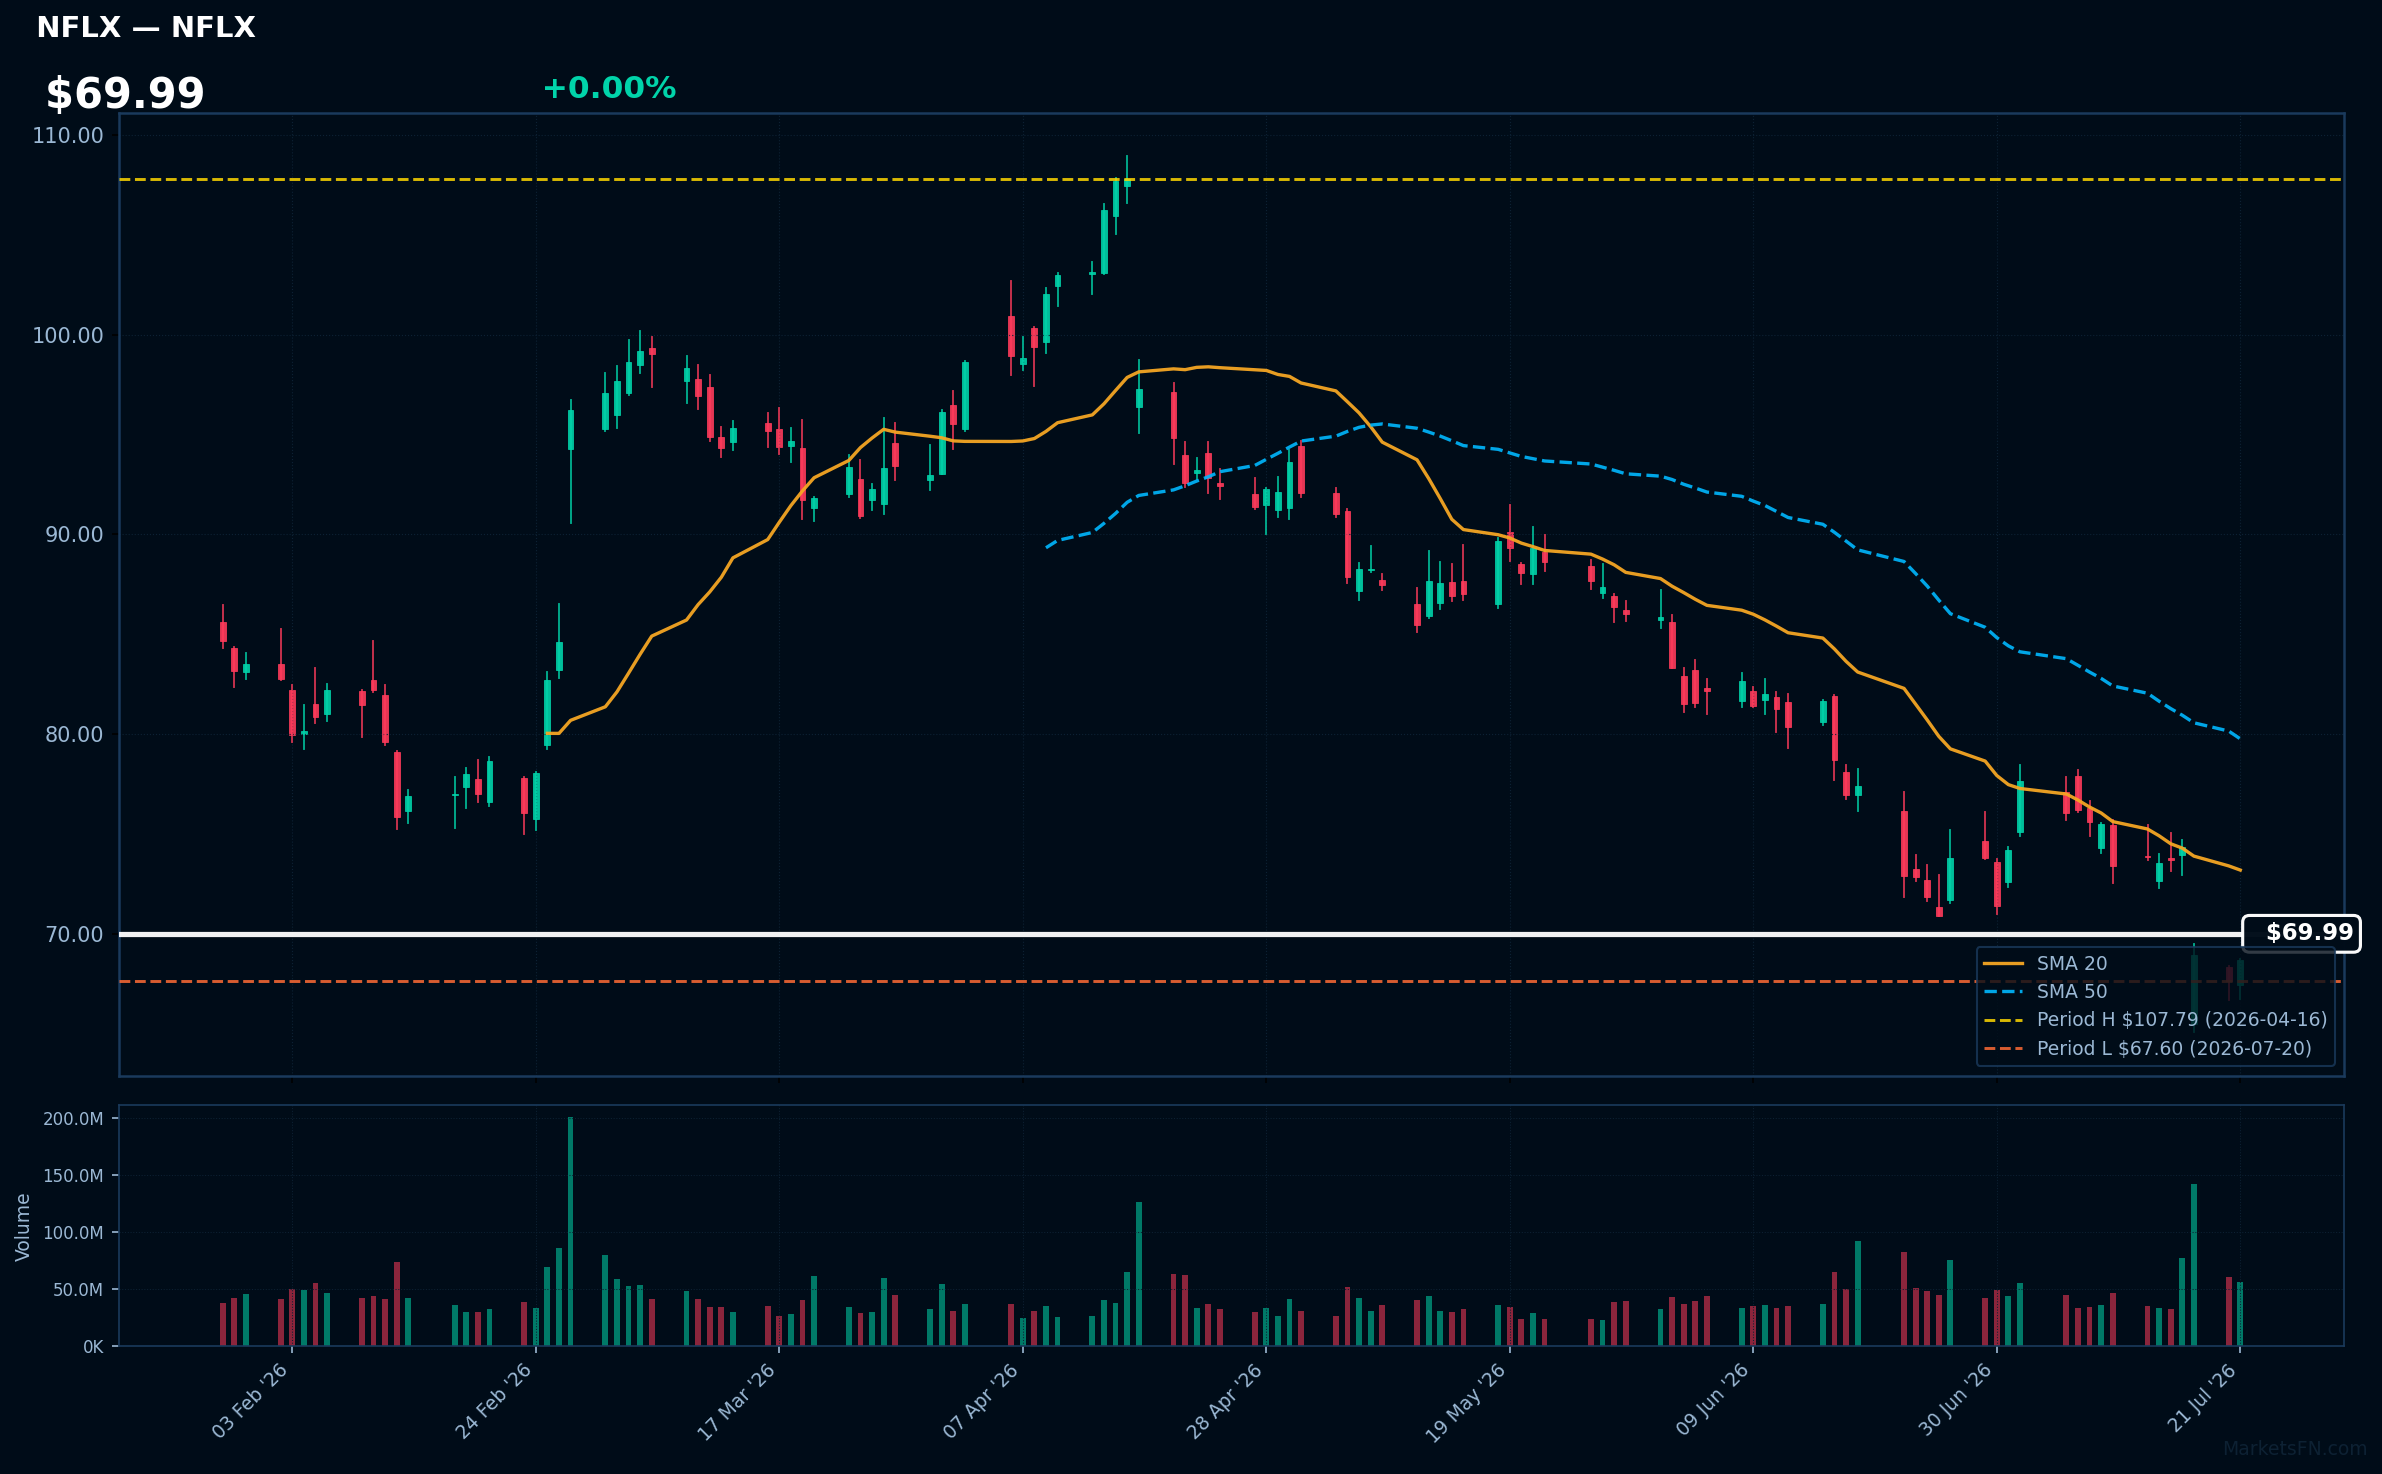
NFLX | Netflix Inc | Communication Services | Price Last: $68.67 | % Realized: -24.53% | RSI: 37.1 | % above MA200: -26.2% | Trend: Below MA20, MA50, MA200
Netflix Inc is a streaming giant providing entertainment content. Investors care about its subscriber growth, content pipeline, and pricing power, which drive revenue and profitability.
NFLX is in a sustained downtrend with price ($69.99) below MA20, MA50, and MA200. RSI(14) is 37.1, nearing oversold territory. The stock is 1.6% above its 2026 YTD low, testing major support, indicating a potential warning sign.
Related headlines
Market Commentary
The Nasdaq 100 stocks listed are near their 2026 year-to-date (YTD) extremes, with some close to their highs and others near their lows. Stocks like EA, KHC, AAPL, ROST, and CSX are within 2% of their 2026 YTD highs, while PEP, CPRT, and WBD are at their 2026 YTD lows.
The technology sector and related stocks are influenced by various macro conditions and themes. The performance of these Nasdaq 100 stocks near their 2026 extremes may be driven by factors such as earnings reports, industry trends, and overall market sentiment. For instance, AAPL and NFLX, being major tech players, are likely influenced by the broader technology sector's performance and consumer demand.
Investors and traders should monitor upcoming earnings reports, industry developments, and macroeconomic indicators to gauge the future direction of these stocks. Specifically, watching how ISRG and NFLX, which are slightly above their 2026 YTD lows, respond to market conditions could provide insights into the technology sector's trajectory. The proximity of these stocks to their YTD extremes suggests a period of consolidation or potential breakout, warranting close observation.
Methodology: All 101 Nasdaq 100 constituents screened. Close prices downloaded from 2026-01-01. Period high = highest close since Jan 1 2026; period low = lowest close since Jan 1 2026. Distance = (current price / period extreme − 1) × 100. Technical indicators computed on up to 1 year of daily OHLCV data.
Disclaimer: For informational purposes only. Not investment advice. Past performance is not indicative of future results.

