Nasdaq 100 2026 YTD Highs & Lows Radar: Microsoftoration (MSFT), Applovin (APP) and more
MarketsFN Team

Nasdaq 100 2026 YTD Highs & Lows Radar: Microsoftoration (MSFT), Applovin (APP) and more
Screening all 101 Nasdaq 100 constituents for stocks nearest to their 2026 year-to-date high and their 2026 YTD low. Data as of August 07, 2026. % Realized = total return since Jan 1 2026.
Legend: RSI > 70 = overbought · RSI < 30 = oversold · Green % Realized = positive YTD return · Red = negative.
📈 Nearest to 2026 High
Sectors represented: Technology (2), Industrials (1), Consumer Cyclical (1), Communication Services (1)
| Ticker | Company | Sector | Price Last | % Realized | 2026 YTD High Date | RSI | % above MA200 | Trend |
|---|---|---|---|---|---|---|---|---|
| MSFT | Microsoft Corporation | Technology | $499.86 | +5.69% | 2026-08-06 | 78.8 | +15.4% | Above MA20, MA50, MA200 |
| ADP | Automatic Data Processing Inc | Technology | $273.51 | +8.16% | 2026-08-06 | 65.6 | +16.1% | Above MA20, MA50, MA200 |
| FAST | Fastenal Co | Industrials | $50.80 | +25.62% | 2026-08-06 | 70.4 | +14.3% | Above MA20, MA50, MA200 |
| ROST | Ross Stores, Inc | Consumer Cyclical | $254.31 | +39.16% | 2026-08-06 | 67.2 | +24.1% | Above MA20, MA50, MA200 |
| EA | Electronic Arts, Inc | Communication Services | $209.70 | +2.59% | 2026-08-04 | 82.2 | +3.6% | Above MA20, MA50, MA200 |
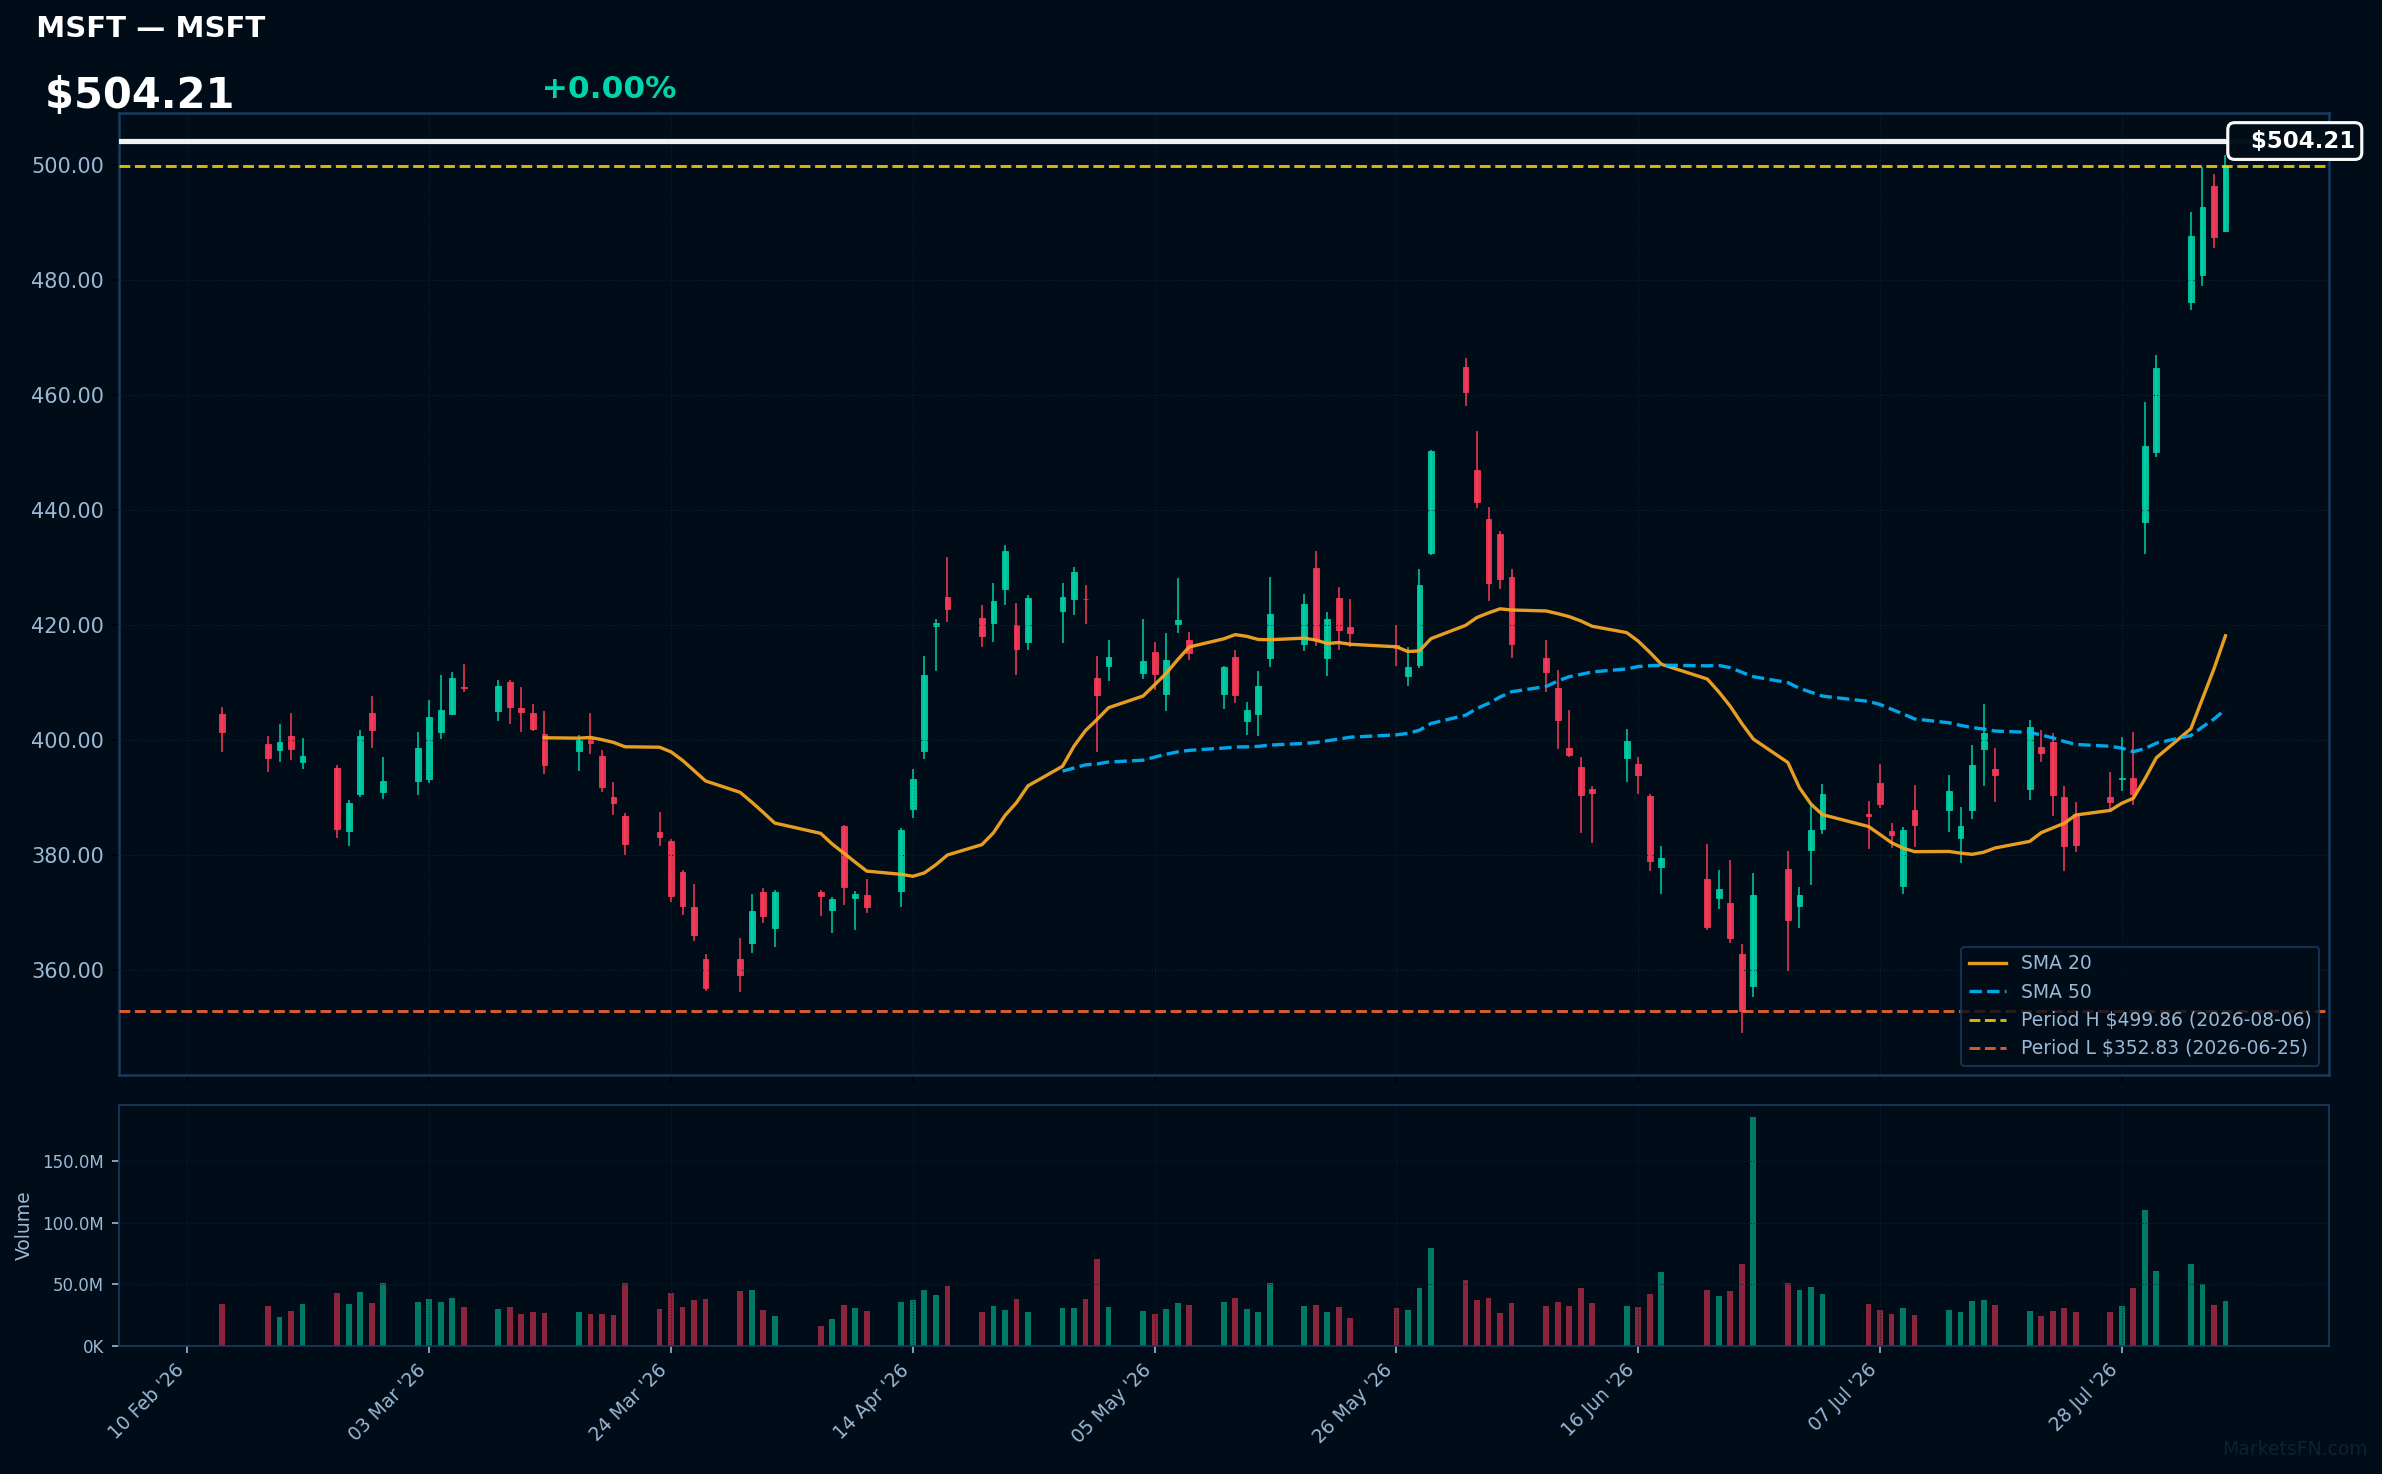
MSFT | Microsoft Corporation | Technology | Price Last: $499.86 | % Realized: +5.69% | RSI: 78.8 | % above MA200: +15.4% | Trend: Above MA20, MA50, MA200
Microsoft Corporation (MSFT) develops software, services, devices, and solutions, including its Azure cloud platform, Office productivity suite, and Windows operating system, making it a key player in digital transformation and enterprise solutions, which are critical for businesses adapting to technological advancements.
Currently, MSFT shows mixed signals with an RSI(14) of 78.8, indicating overbought conditions, while the price is above MA20/MA50/MA200. It is 0.0% below its 2026 YTD high, suggesting potential momentum.
Related headlines
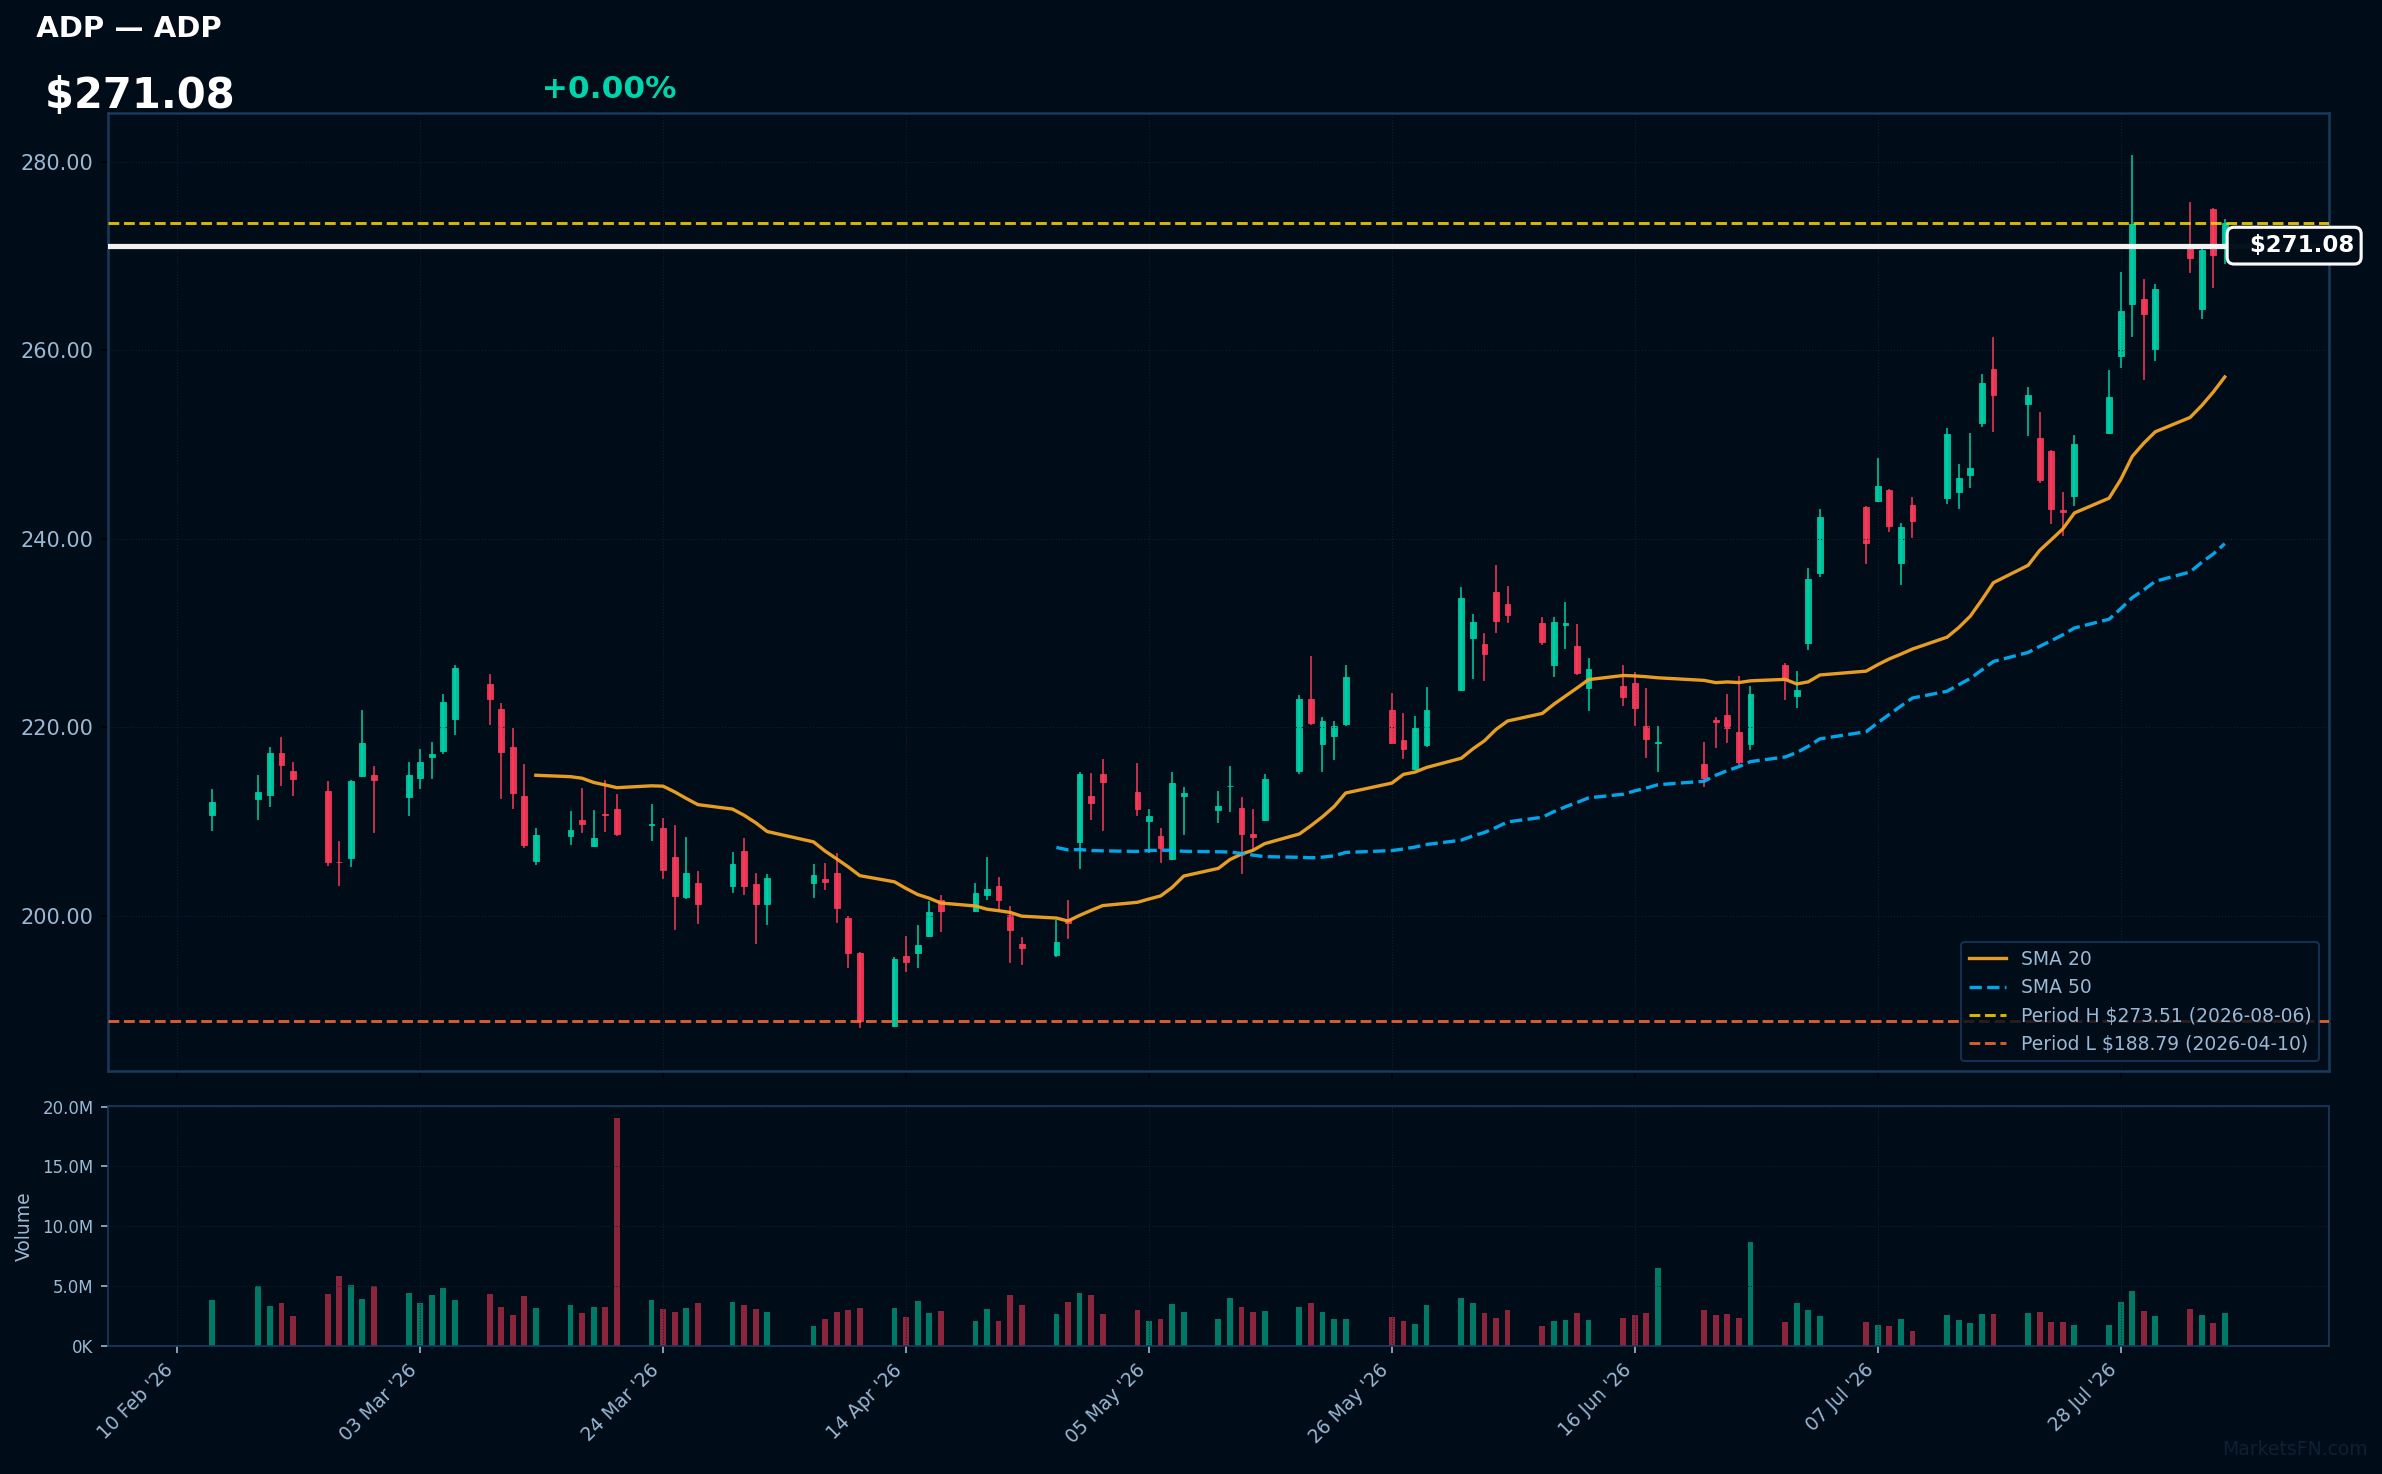
ADP | Automatic Data Processing Inc | Technology | Price Last: $273.51 | % Realized: +8.16% | RSI: 65.6 | % above MA200: +16.1% | Trend: Above MA20, MA50, MA200
Automatic Data Processing Inc (ADP) provides payroll and human capital management solutions, helping businesses streamline workforce management. Investors should care due to its strong market position and consistent demand for its services, which can drive revenue growth and stability.
The current technical situation shows bullish momentum with an RSI(14) of 65.6 and a bullish MA alignment: price > MA20 > MA50 > MA200. The stock is also 0.0% below its 2026 YTD high, indicating a potential breakout level.
Related headlines
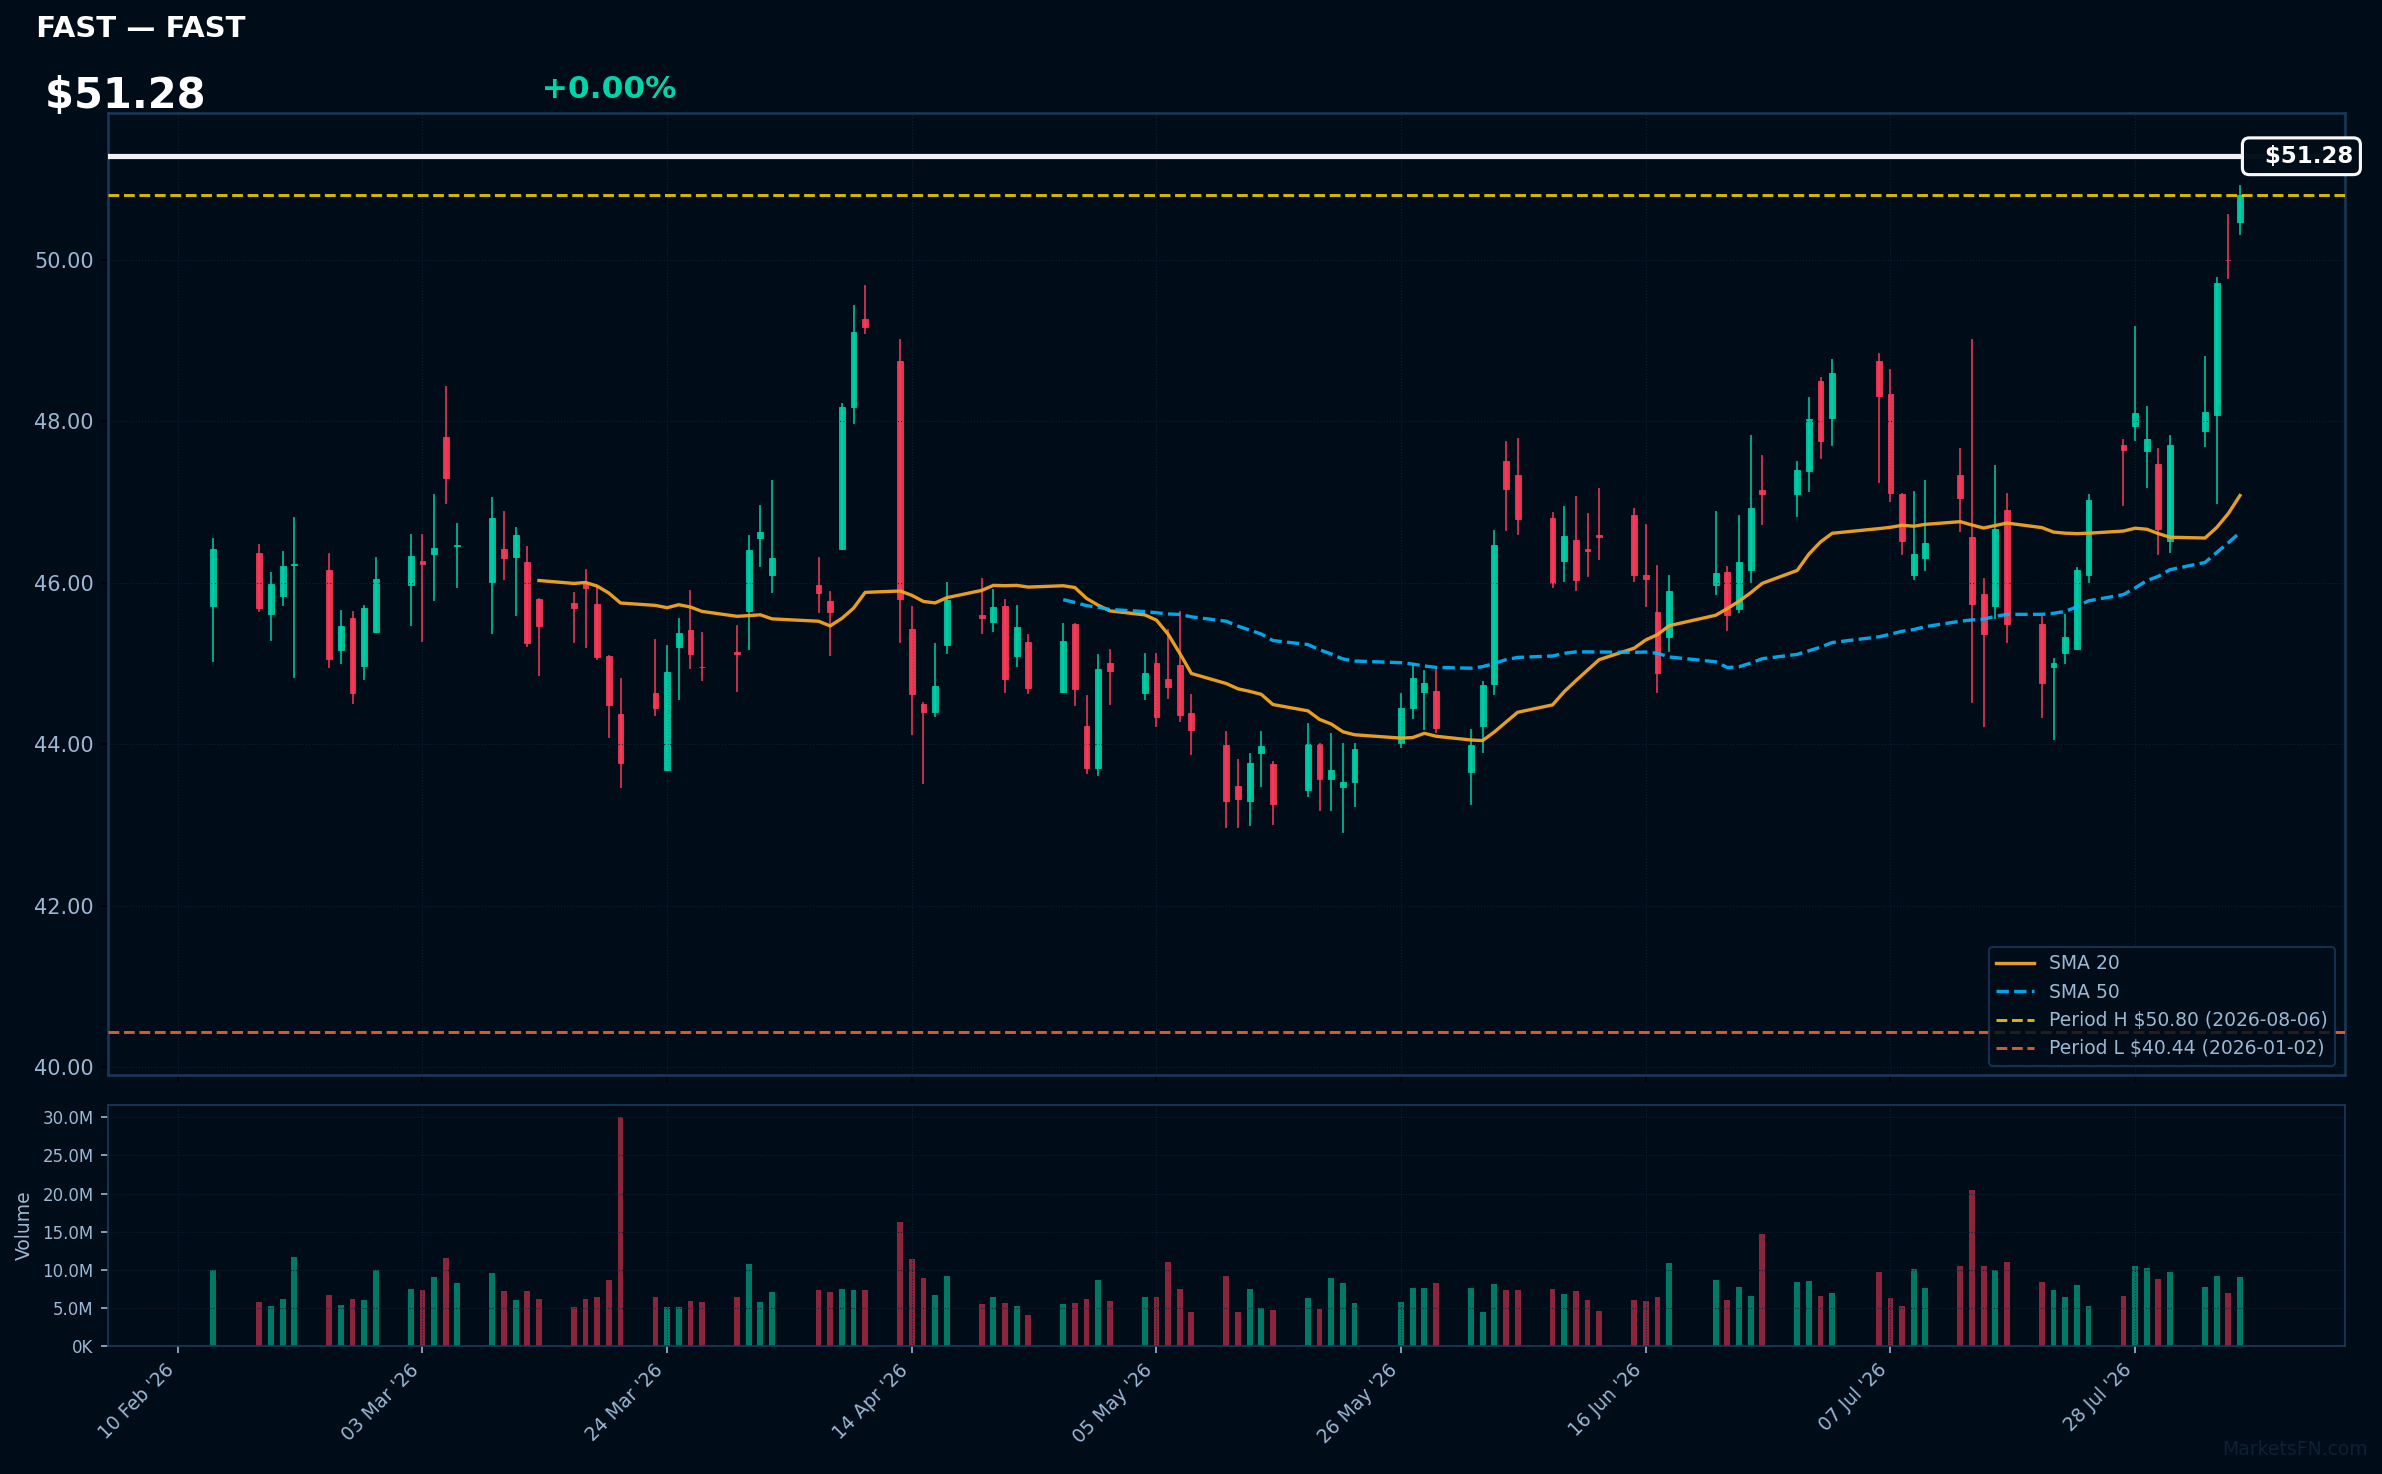
FAST | Fastenal Co | Industrials | Price Last: $50.80 | % Realized: +25.62% | RSI: 70.4 | % above MA200: +14.3% | Trend: Above MA20, MA50, MA200
Fastenal Co is a leading distributor of industrial and construction supplies, specializing in fasteners, tools, and safety products. Investors should care due to its strong market position and consistent demand in the manufacturing and construction sectors, which drive revenue growth.
The current technical situation shows bullish momentum with an RSI(14) of 70.4 and a bullish MA alignment: price > MA20 > MA50 > MA200. The stock is 0.0% below its 2026 YTD high, indicating potential for a breakout.
Related headlines
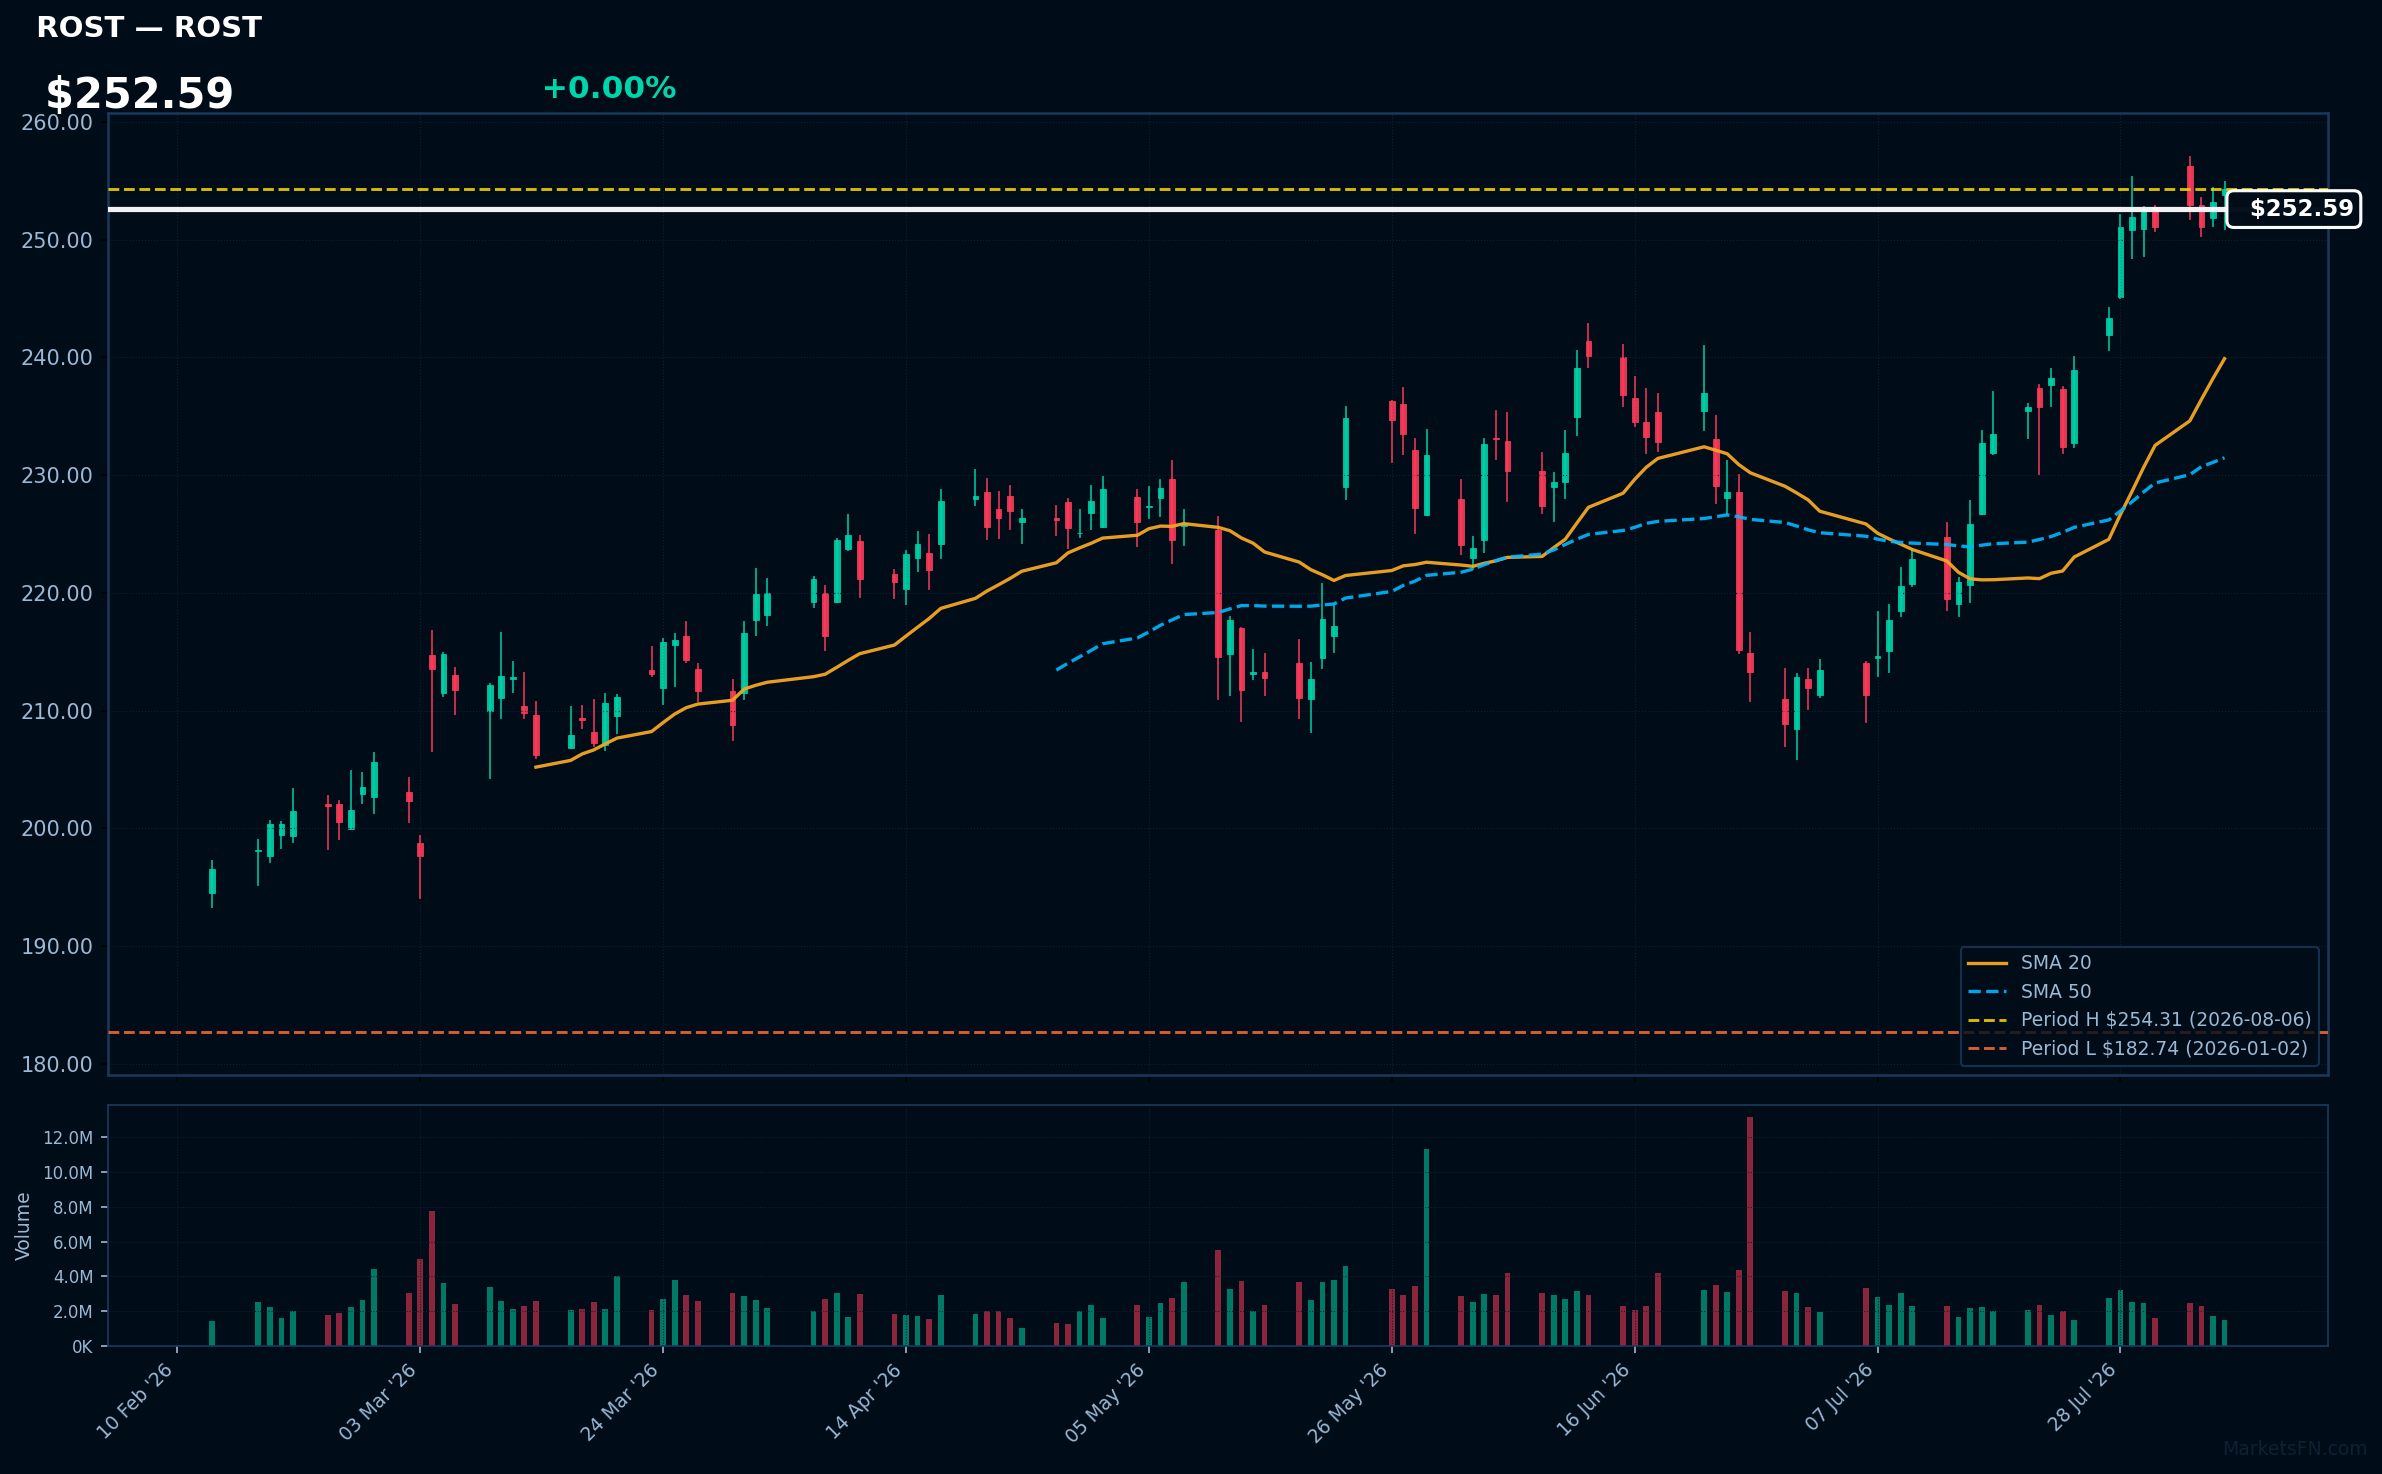
ROST | Ross Stores, Inc | Consumer Cyclical | Price Last: $254.31 | % Realized: +39.16% | RSI: 67.2 | % above MA200: +24.1% | Trend: Above MA20, MA50, MA200
Ross Stores, Inc operates off-price retail chains, offering discounted apparel and home goods. Investors should care due to its strong market position and ability to attract cost-conscious consumers, especially in economic downturns, enhancing its resilience and growth potential.
The current technical situation shows bullish momentum with an RSI(14) of 67.2 and a bullish MA alignment: price > MA20 > MA50 > MA200. The stock is 0.0% below its 2026 YTD high, indicating a potential breakout.
Related headlines
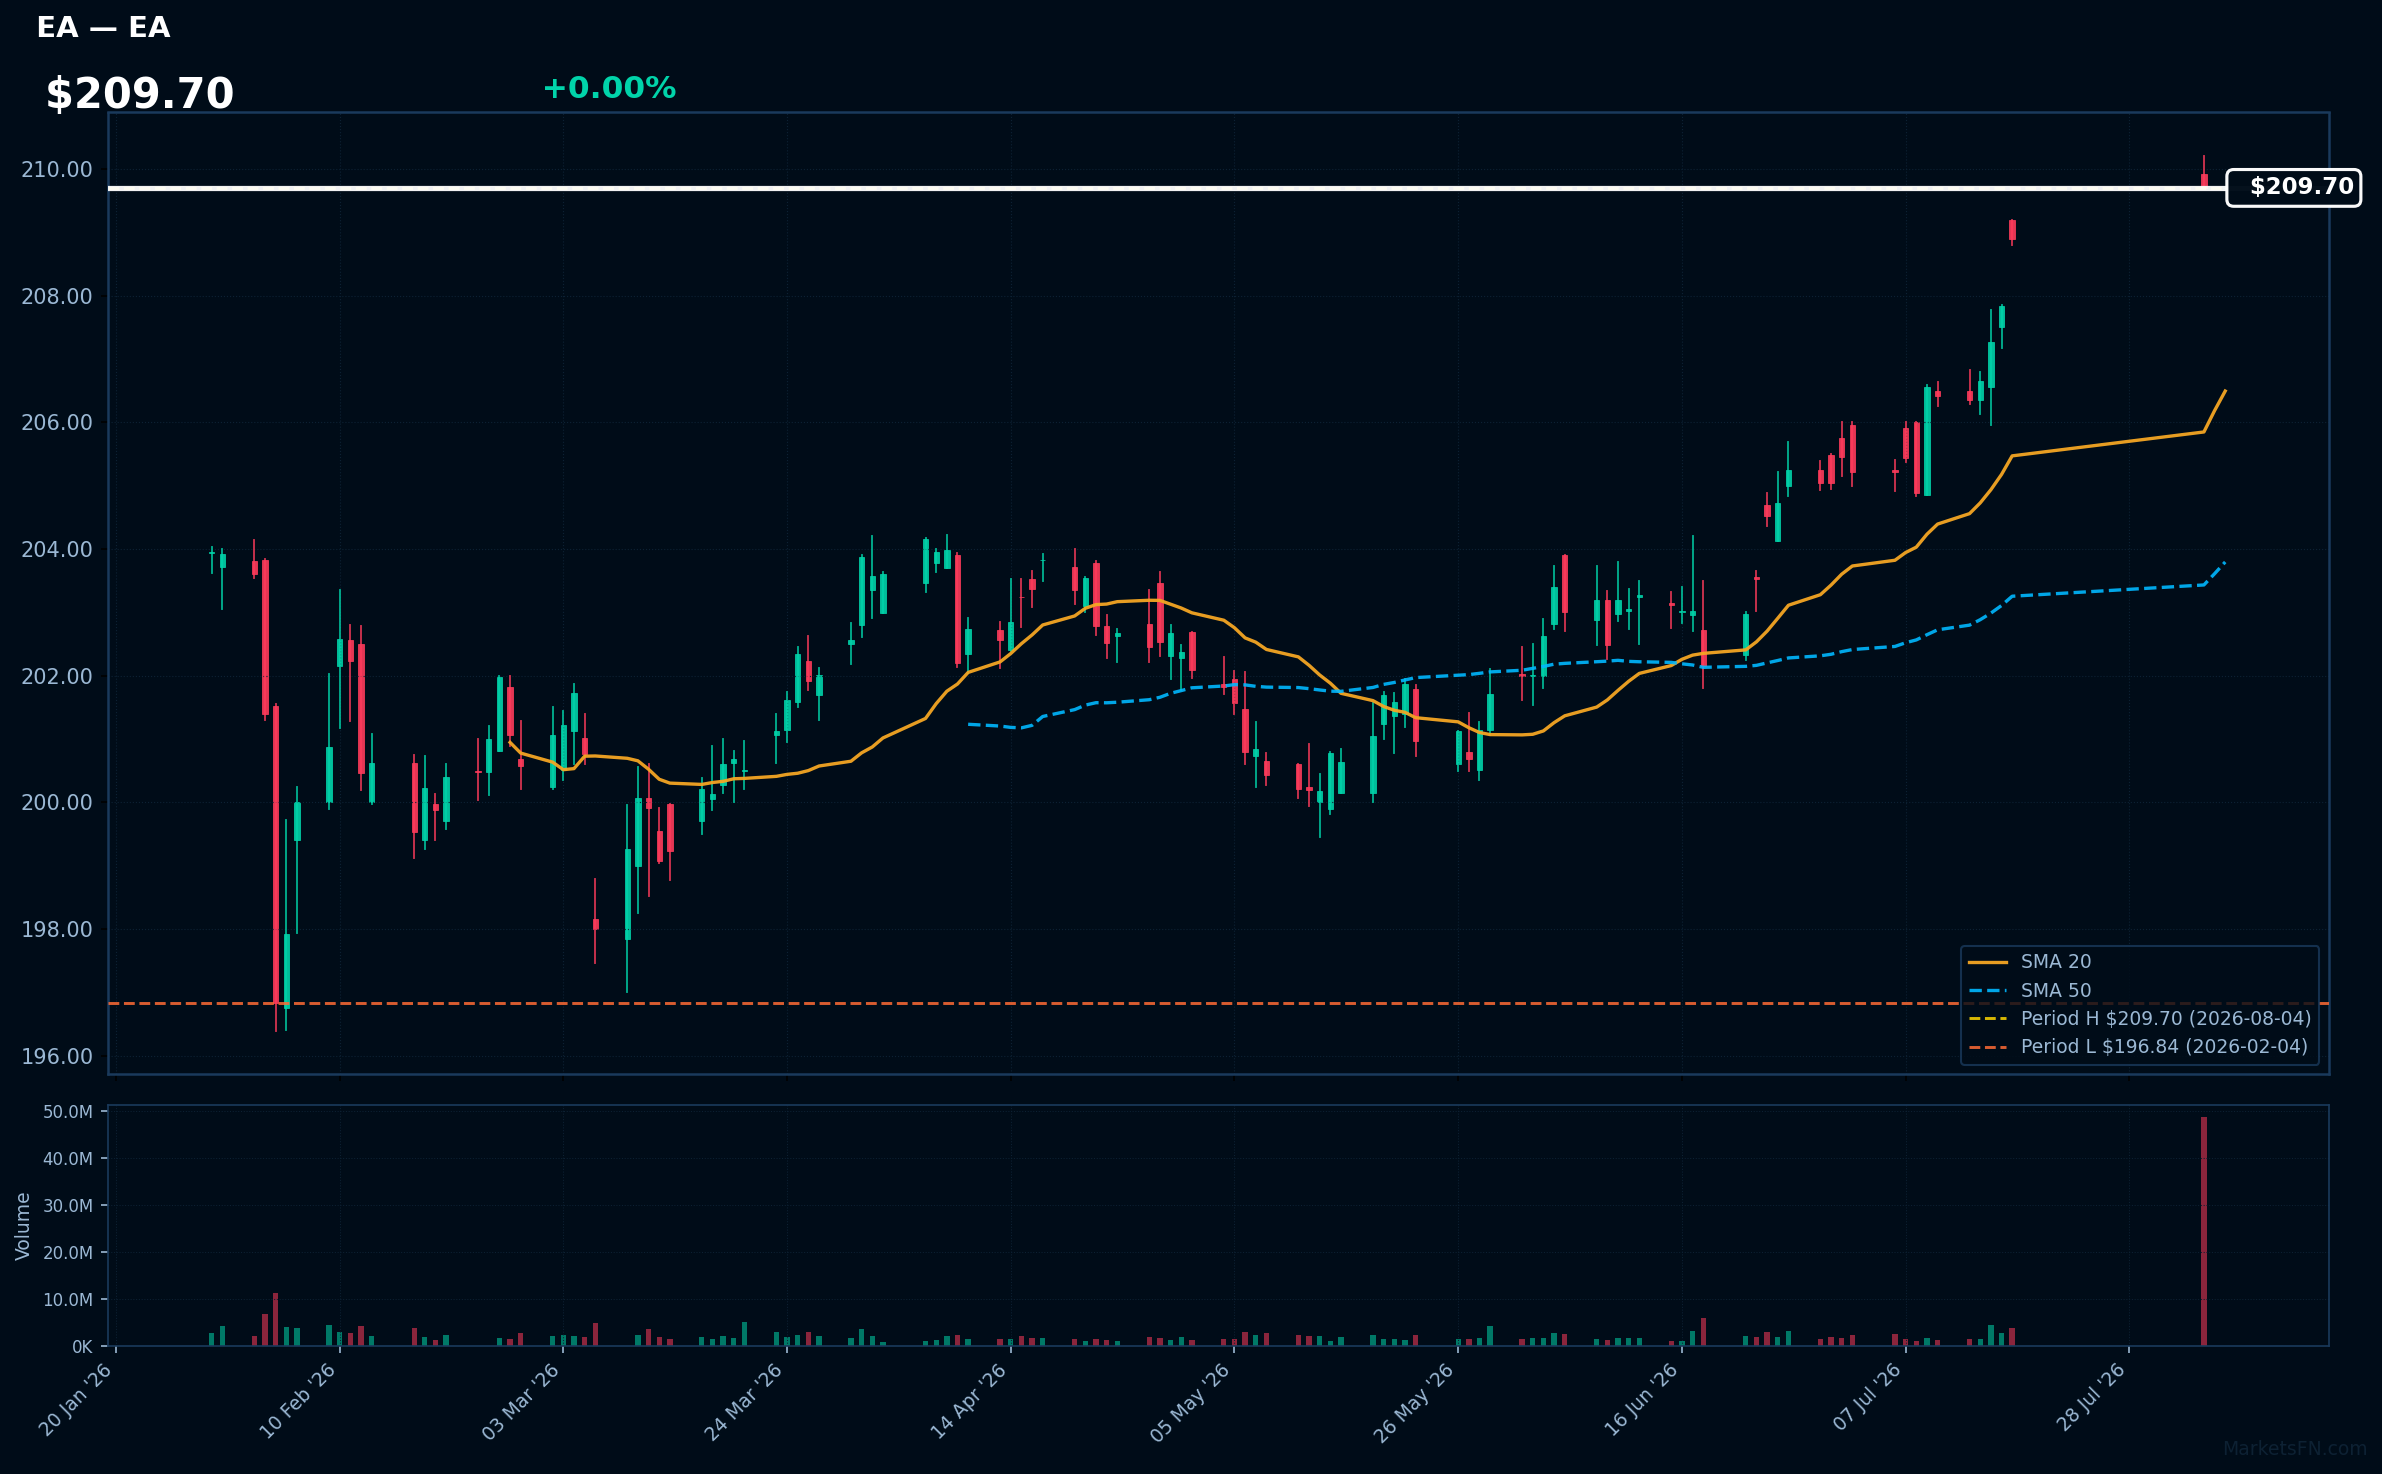
EA | Electronic Arts, Inc | Communication Services | Price Last: $209.70 | % Realized: +2.59% | RSI: 82.2 | % above MA200: +3.6% | Trend: Above MA20, MA50, MA200
Electronic Arts, Inc. develops and publishes interactive software and video games, including popular franchises like FIFA and Madden NFL. Investors should care due to its strong market position and consistent revenue generation in the growing gaming industry.
The current technical situation indicates strong momentum with an RSI(14) of 82.2 and a bullish MA alignment: price > MA20 > MA50 > MA200, suggesting a sustained uptrend.
Related headlines
📉 Nearest to 2026 Low
Sectors represented: Communication Services (2), Consumer Defensive (1), Healthcare (1), Utilities (1)
| Ticker | Company | Sector | Price Last | % Realized | 2026 YTD Low Date | RSI | % above MA200 | Trend |
|---|---|---|---|---|---|---|---|---|
| APP | Applovin Corp | Communication Services | $335.67 | -45.71% | 2026-08-06 | 31.0 | -34.8% | Below MA20, MA50, MA200 |
| PEP | PepsiCo Inc | Consumer Defensive | $138.44 | -2.66% | 2026-07-23 | 44.8 | -7.3% | Above MA20 · Below MA50, MA200 |
| AZN | Astrazeneca plc ADR | Healthcare | $161.07 | -12.05% | 2026-08-04 | 39.6 | -12.7% | Below MA20, MA50, MA200 |
| WBD | Warner Bros. Discovery Inc | Communication Services | $26.40 | -7.40% | 2026-07-27 | 53.9 | -1.0% | Above MA20 · Below MA50, MA200 |
| XEL | Xcel Energy, Inc | Utilities | $76.97 | +3.07% | 2026-01-07 | 35.6 | -2.5% | Below MA20, MA50, MA200 |
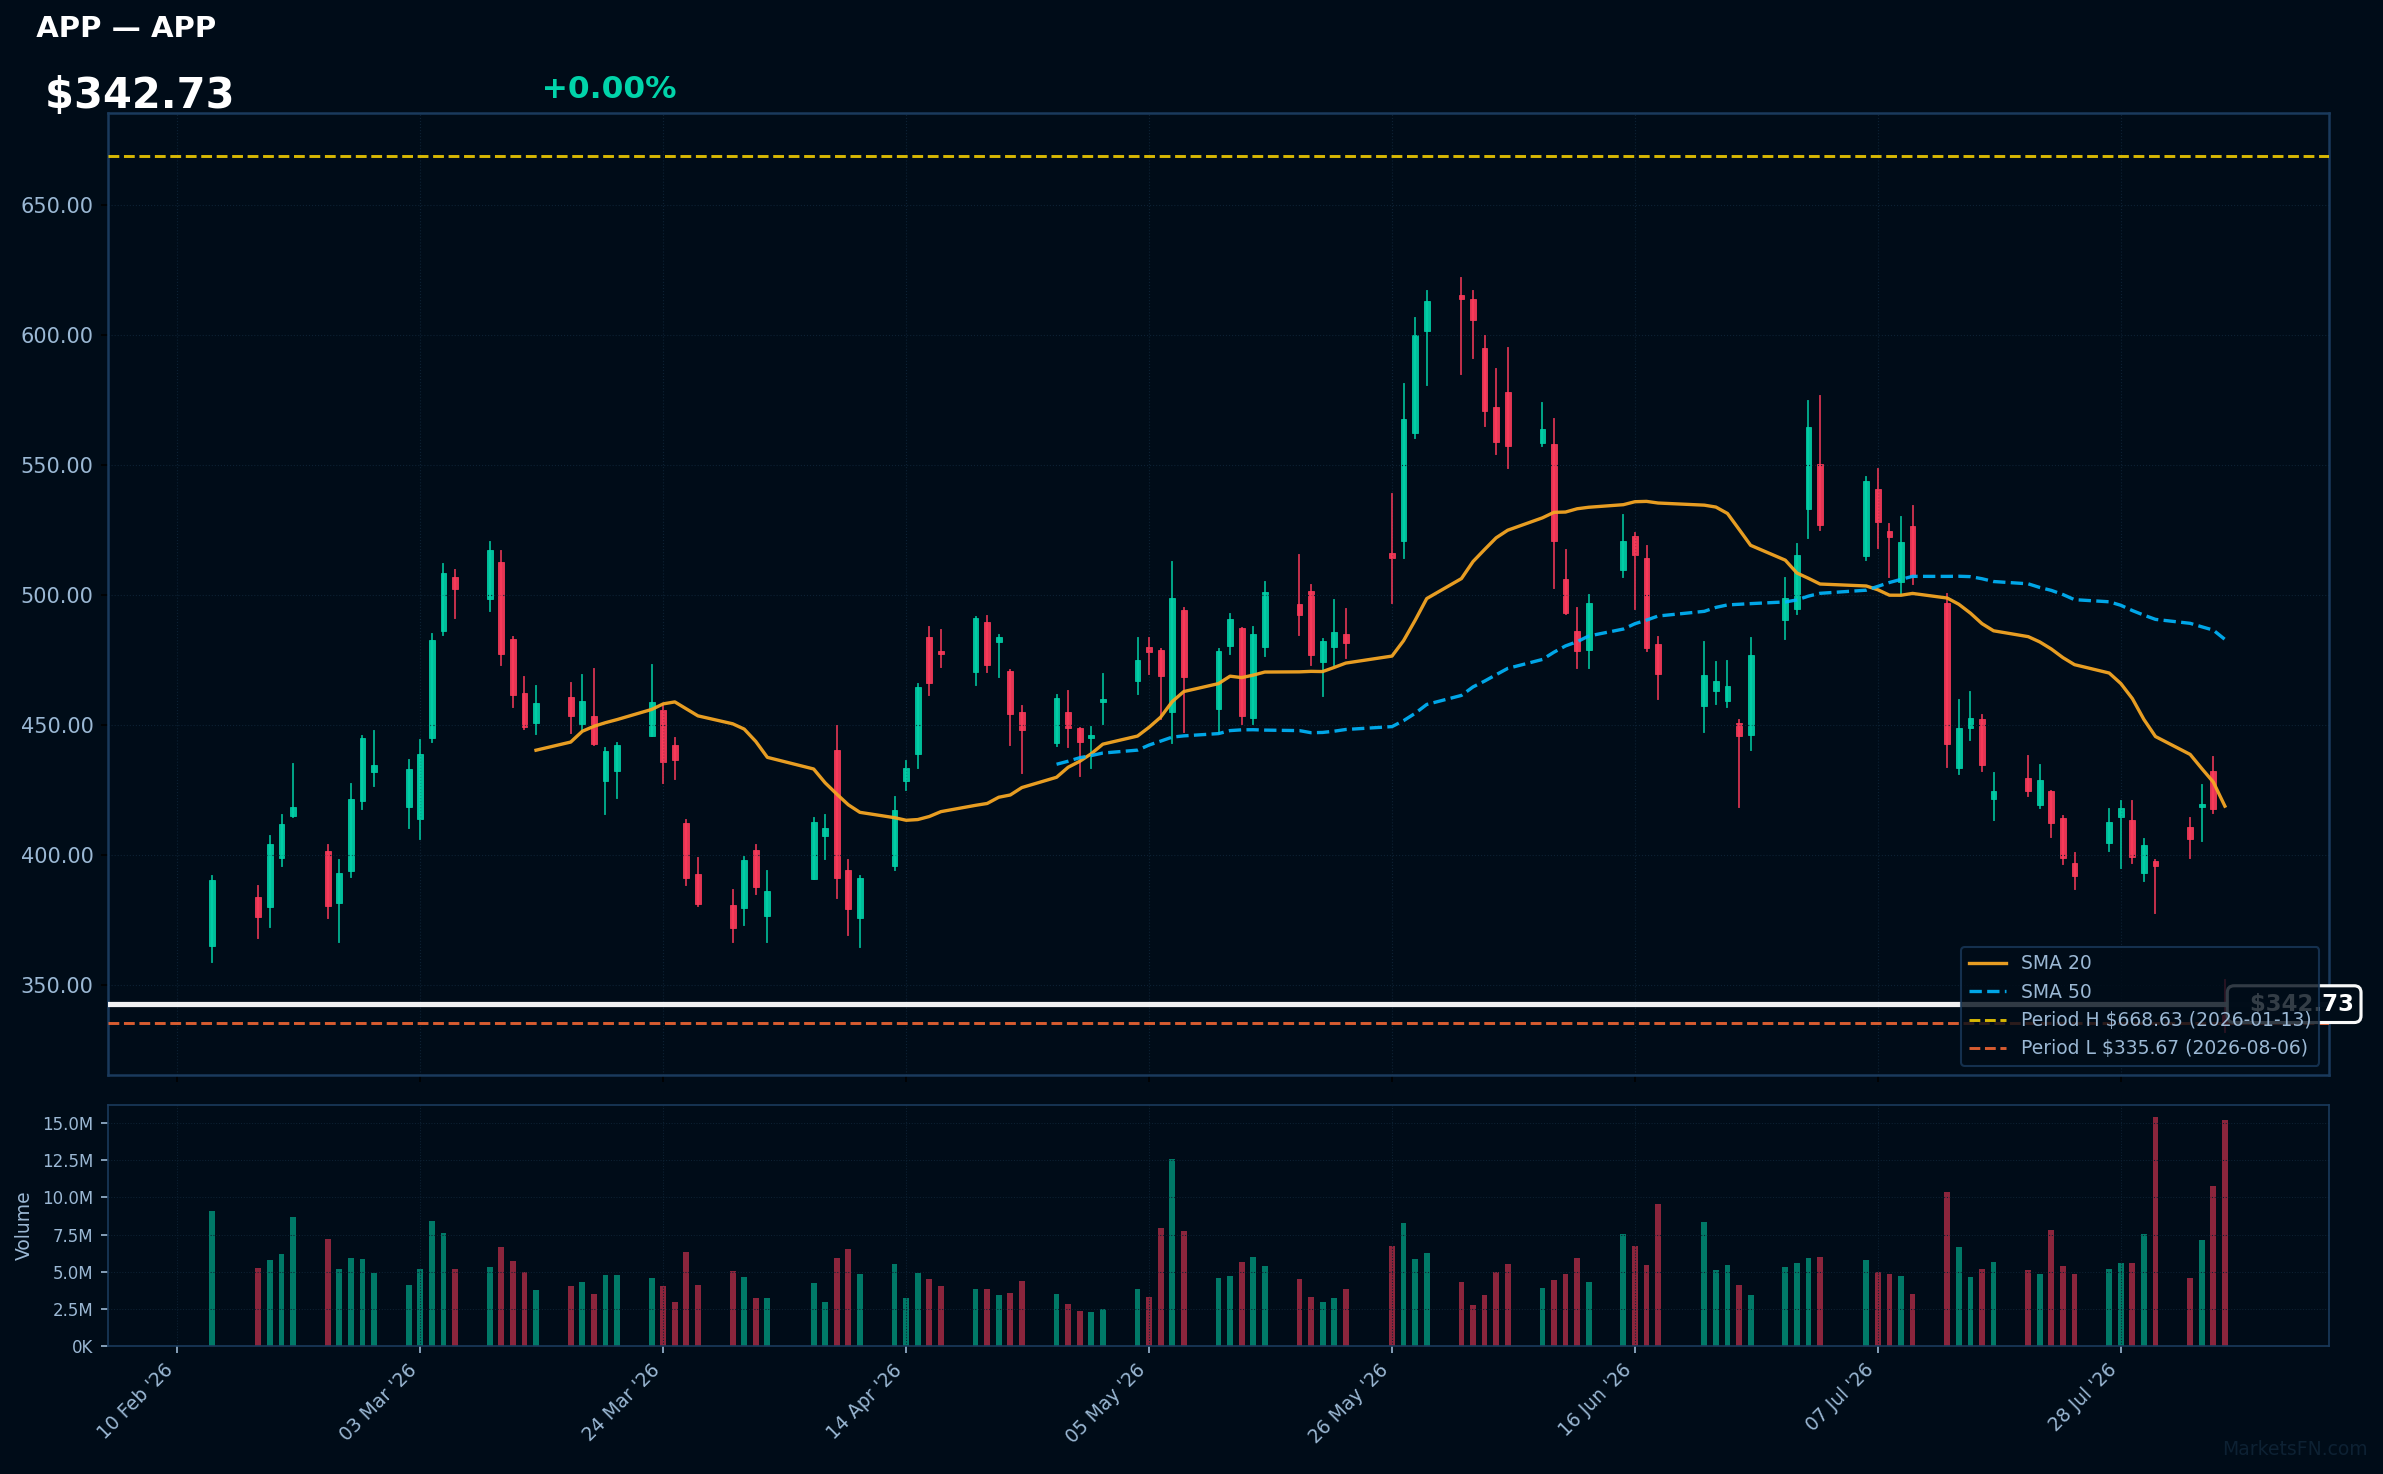
APP | Applovin Corp | Communication Services | Price Last: $335.67 | % Realized: -45.71% | RSI: 31.0 | % above MA200: -34.8% | Trend: Below MA20, MA50, MA200
Applovin Corp (APP) specializes in mobile app development and advertising technology, enabling developers to monetize their apps effectively. Investors should care due to its significant market position and potential for growth in the expanding mobile ecosystem.
The current technical situation indicates a bearish trend, with an RSI(14) of 31.0 and a MA alignment of price < MA20 < MA50 < MA200, suggesting sustained downtrend and testing major support.
Related headlines
- APP Vs CELH Vs BROS Vs AXON: Retail Traders Are Most Interested In Buying Post-Earnings Dips Of These 2 Stocks
- AppLovin Corp (APP) (Q2 2026) Earnings Call Highlights: Record Revenue and Strategic Expansion ...
- AppLovin's AI stumbles send the stock sliding toward its worst day in over a year
- AppLovin Stock Plummets to Lowest Level in Over a Year on Weaker-Than-Expected Revenue, Outlook
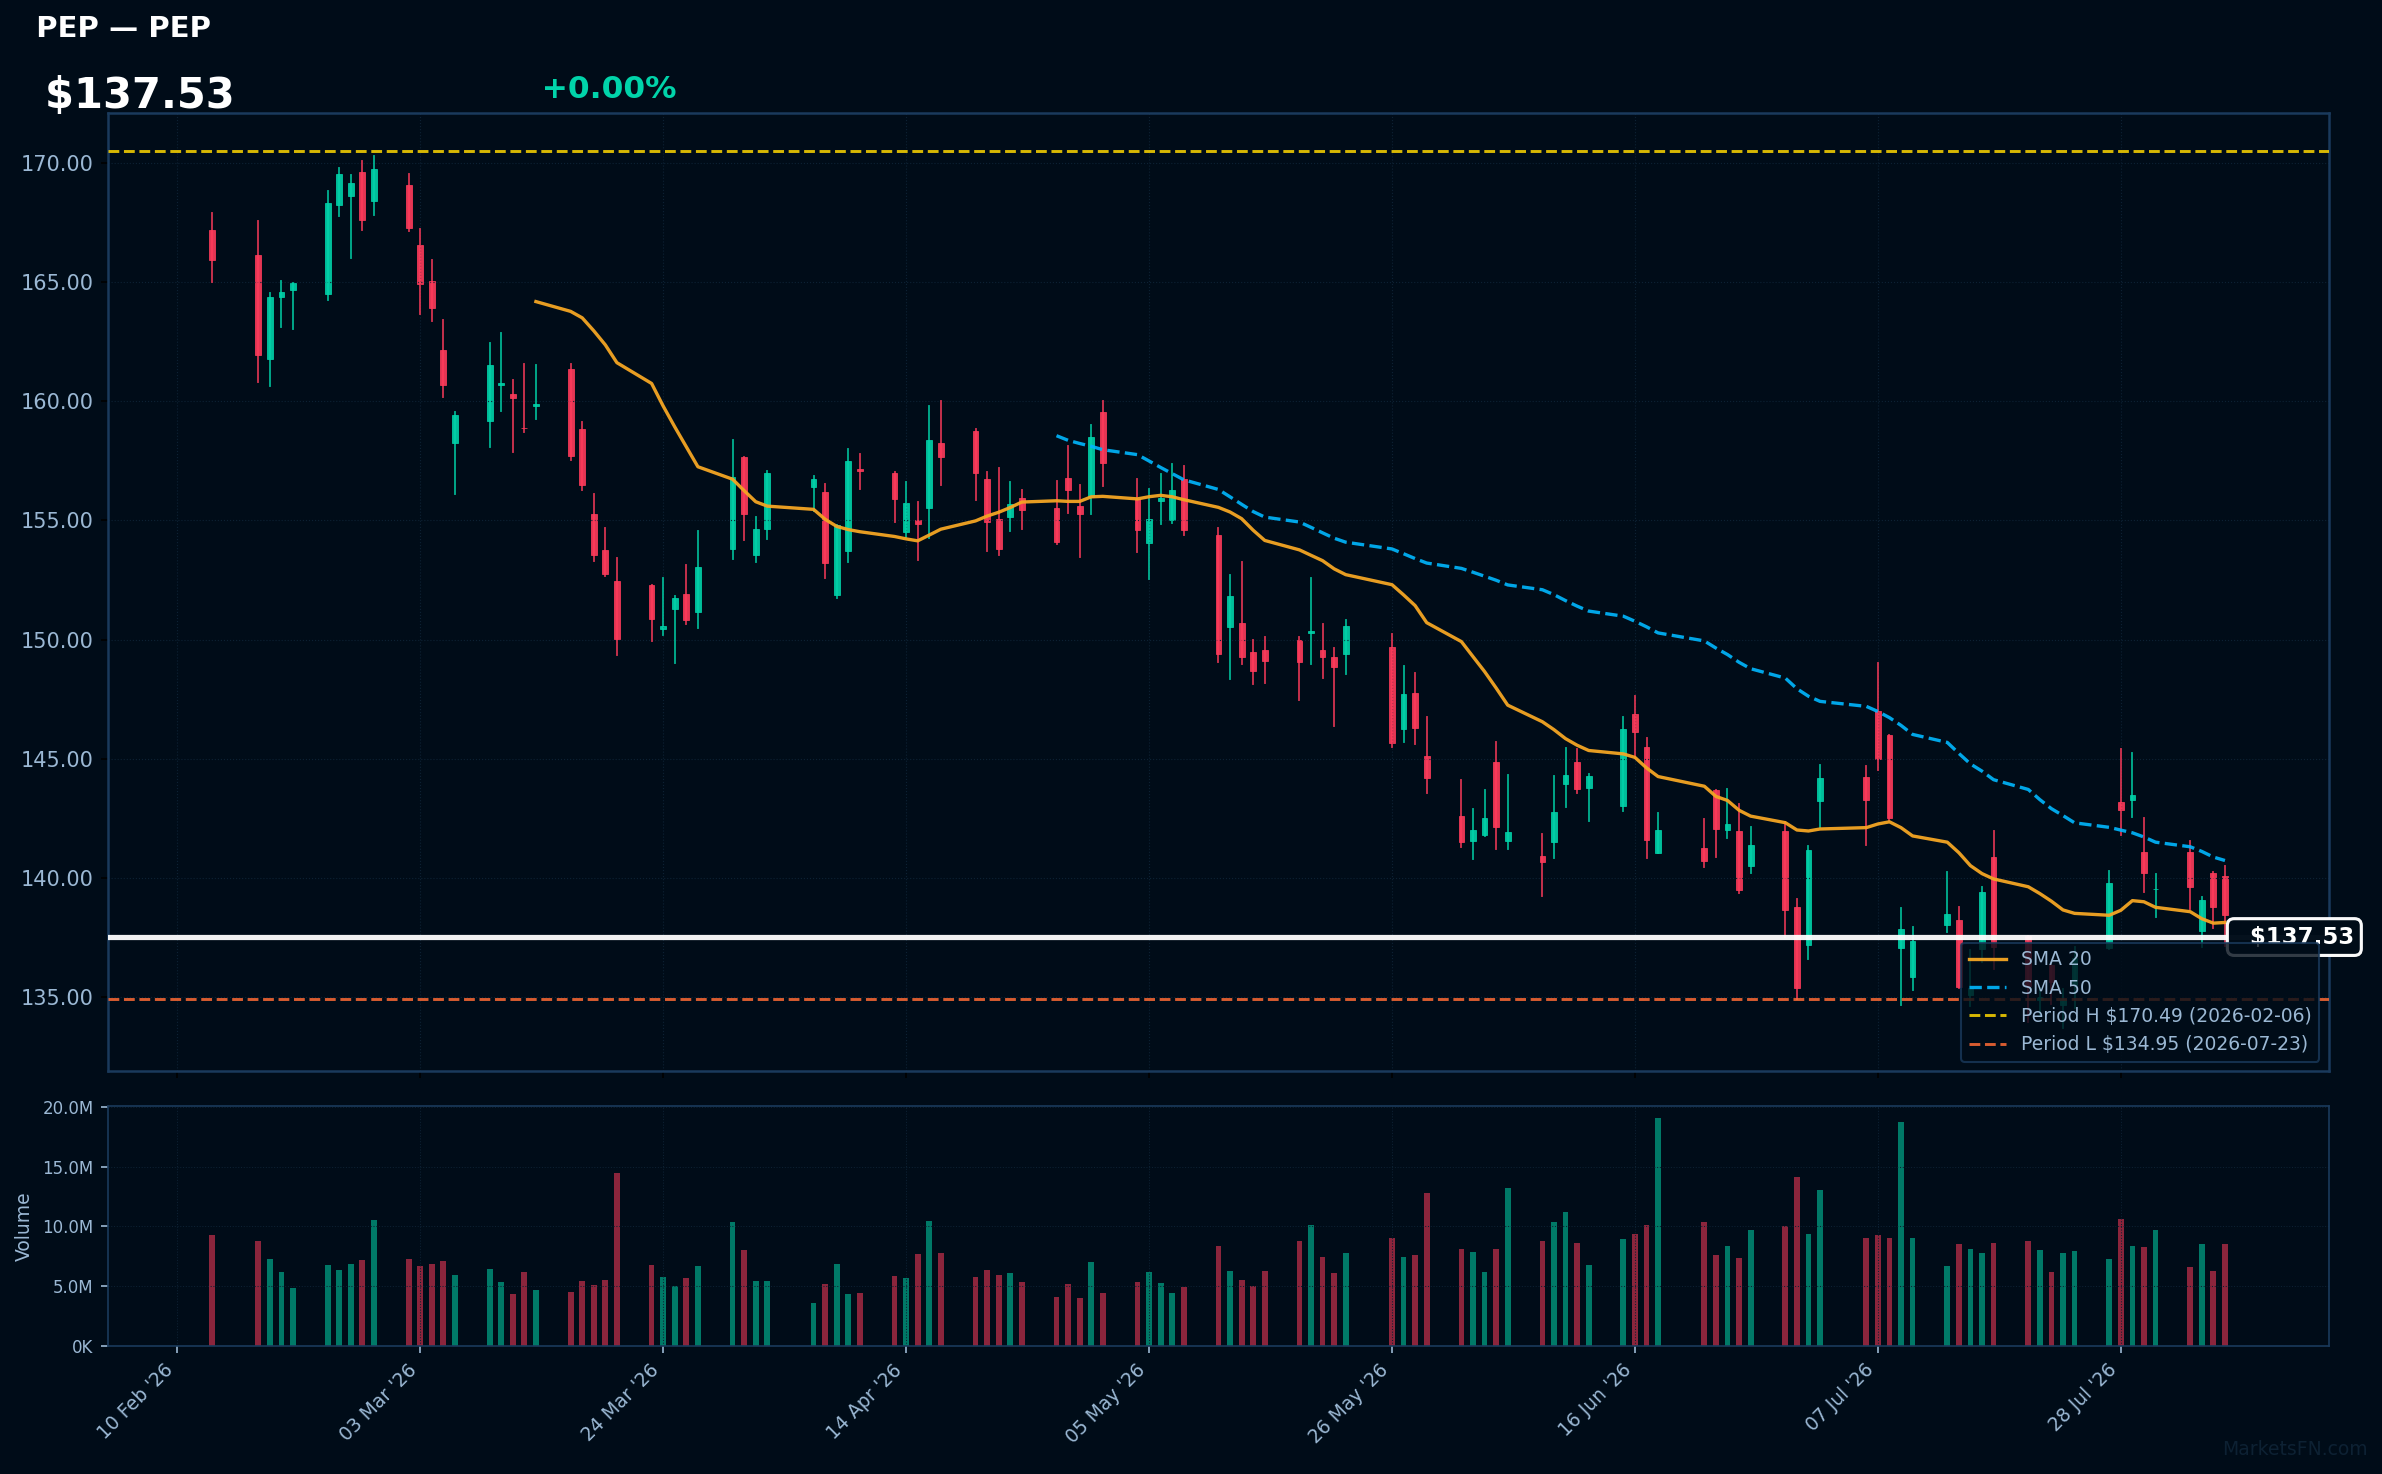
PEP | PepsiCo Inc | Consumer Defensive | Price Last: $138.44 | % Realized: -2.66% | RSI: 44.8 | % above MA200: -7.3% | Trend: Above MA20 · Below MA50, MA200
PepsiCo Inc (PEP) is a global leader in the food and beverage industry, known for its diverse portfolio including snacks, soft drinks, and health-focused products. Investors should care due to its strong market presence and potential for growth in emerging health trends.
The current technical situation indicates a bearish trend with an RSI(14) of 44.8 and a MA alignment of price < MA20 < MA50 < MA200, suggesting sustained downtrend and testing major support, being only 2.6% above its 2026 YTD low.
Related headlines
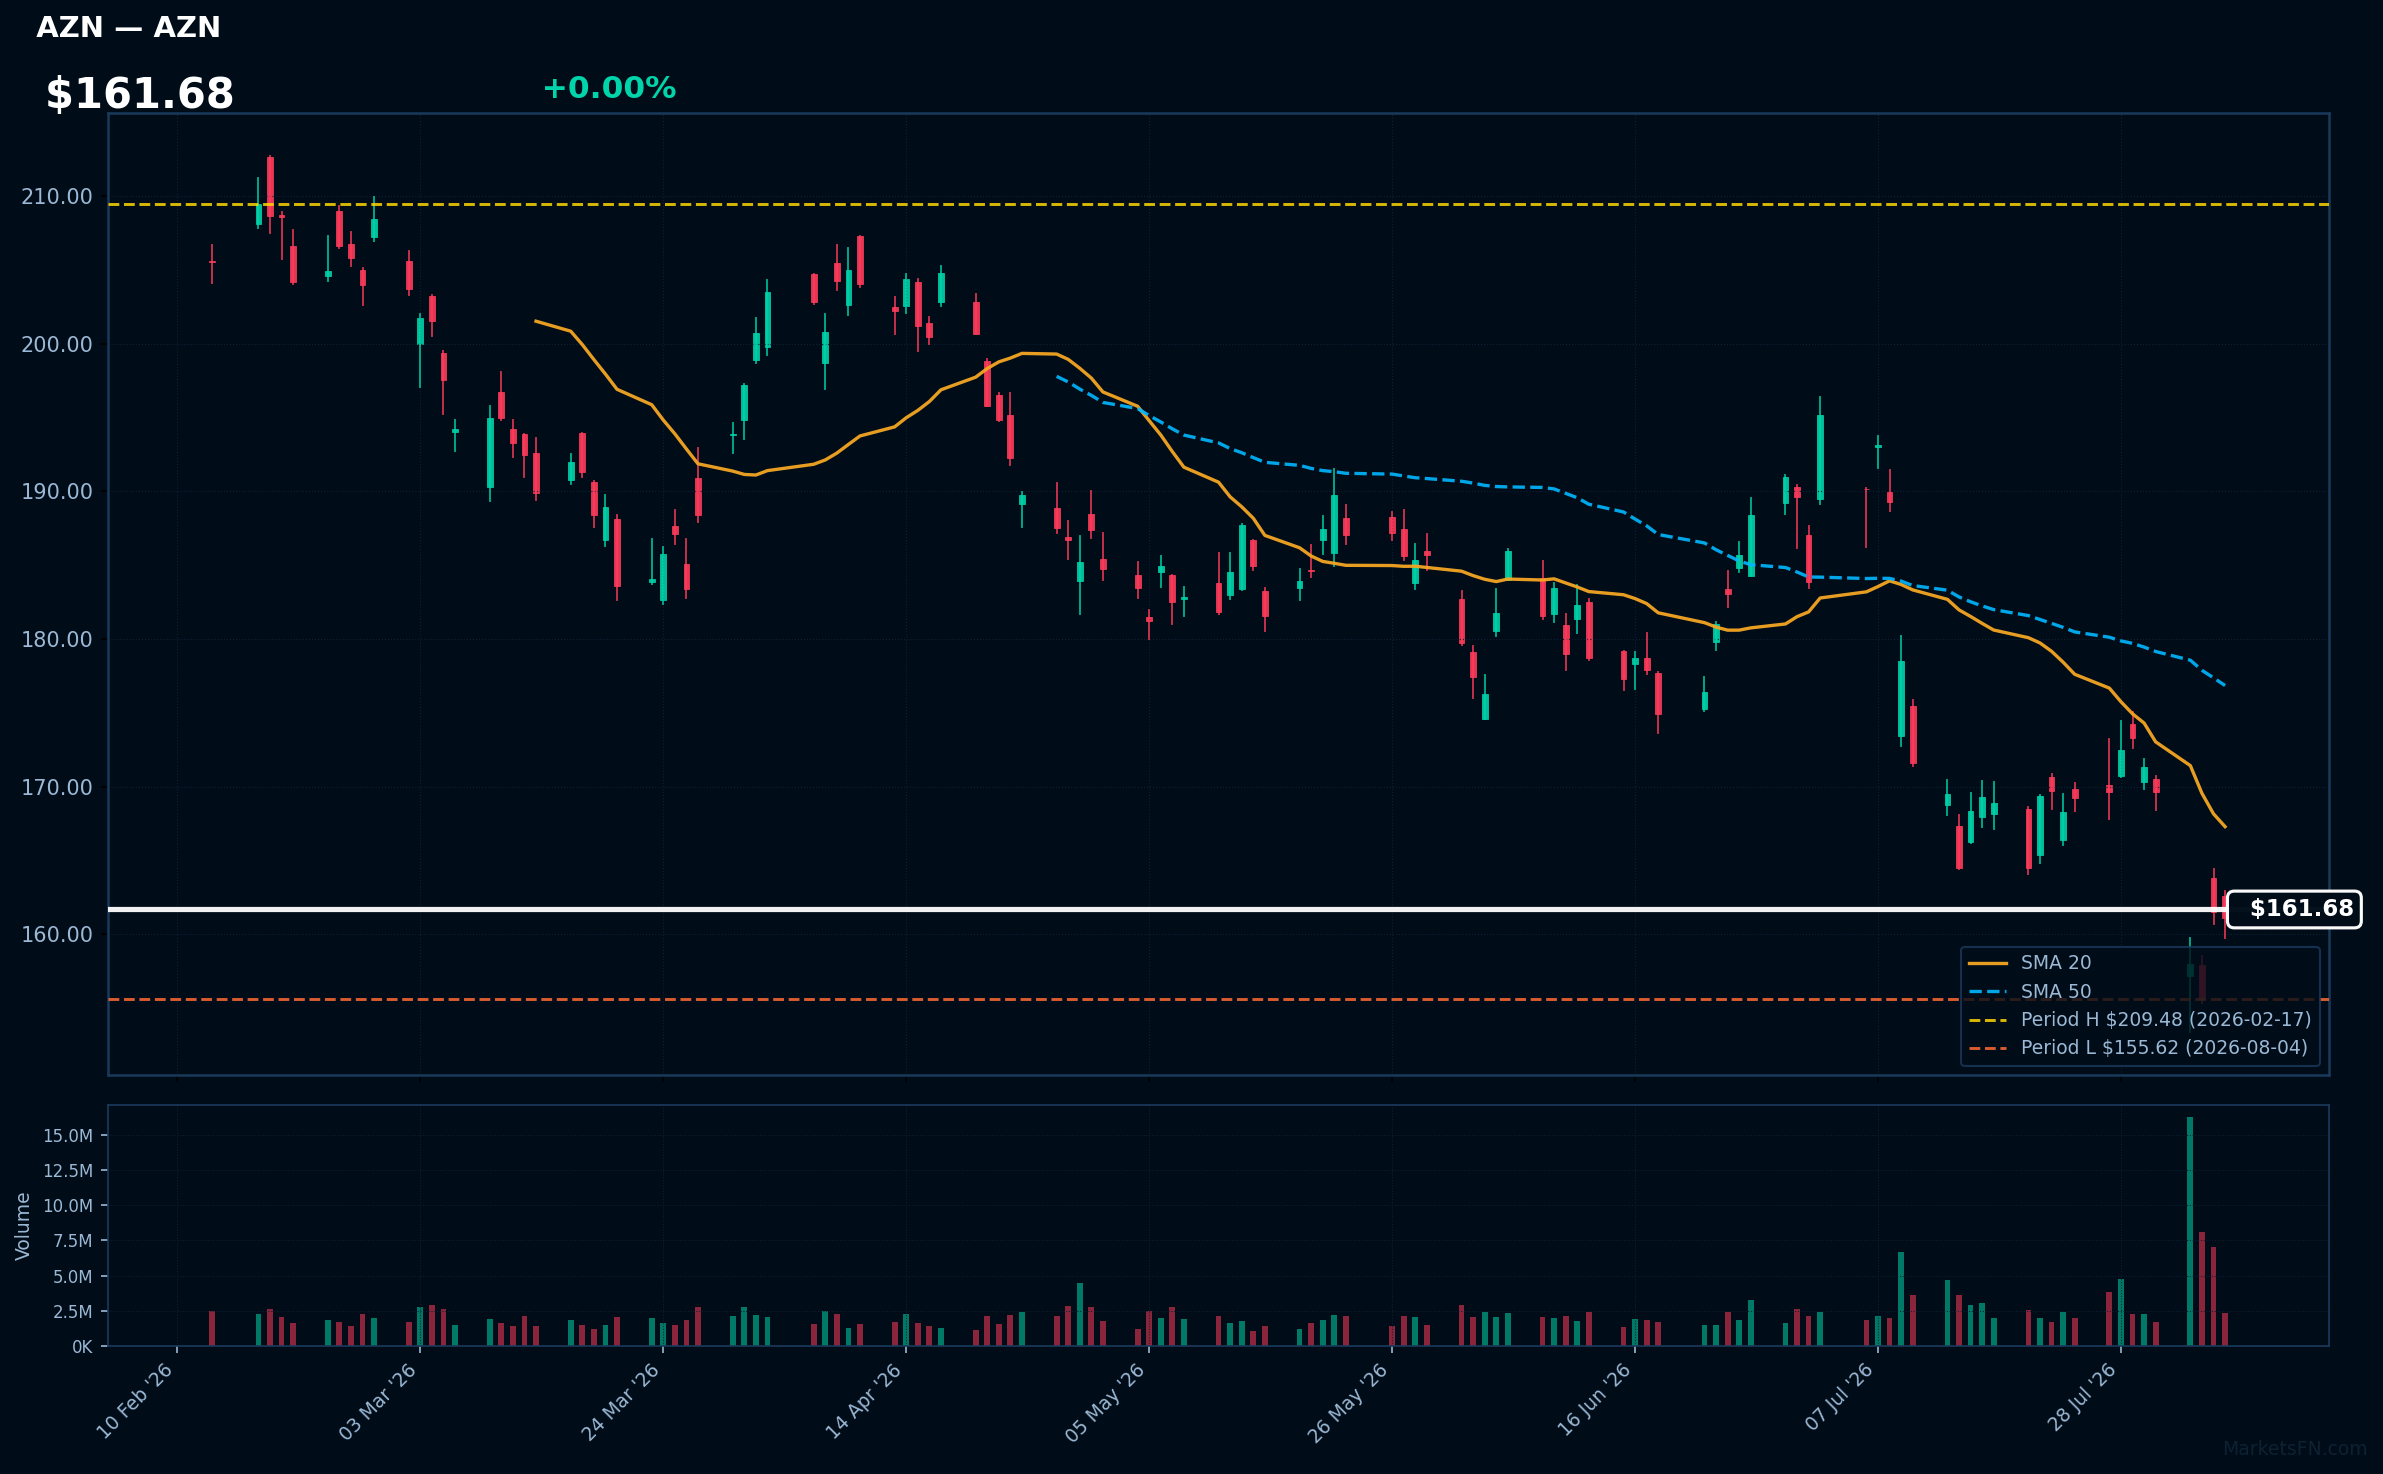
AZN | Astrazeneca plc ADR | Healthcare | Price Last: $161.07 | % Realized: -12.05% | RSI: 39.6 | % above MA200: -12.7% | Trend: Below MA20, MA50, MA200
Astrazeneca plc ADR (AZN) is a global biopharmaceutical company focused on the discovery, development, and commercialization of prescription medicines, particularly in oncology, cardiovascular, and respiratory diseases. Investors should care due to its significant role in innovative therapies and potential market impact.
The current technical situation indicates a bearish trend, with an RSI(14) of 39.6 and a MA alignment of price < MA20 < MA50 < MA200, suggesting a sustained downtrend and testing major support just 3.5% above its 2026 YTD low.
Related headlines
- What the AstraZeneca-BMS rumors reveal about pharma megamergers
- AstraZeneca-Bristol Myers $400B Merger Buzz Cools After Report Denies Talks There Never Was A Deal To Be Done
- AZN rebounds after report dismisses AstraZeneca-Bristol Myers merger speculation
- AstraZeneca and Bristol Myers Squibb merger talks denied
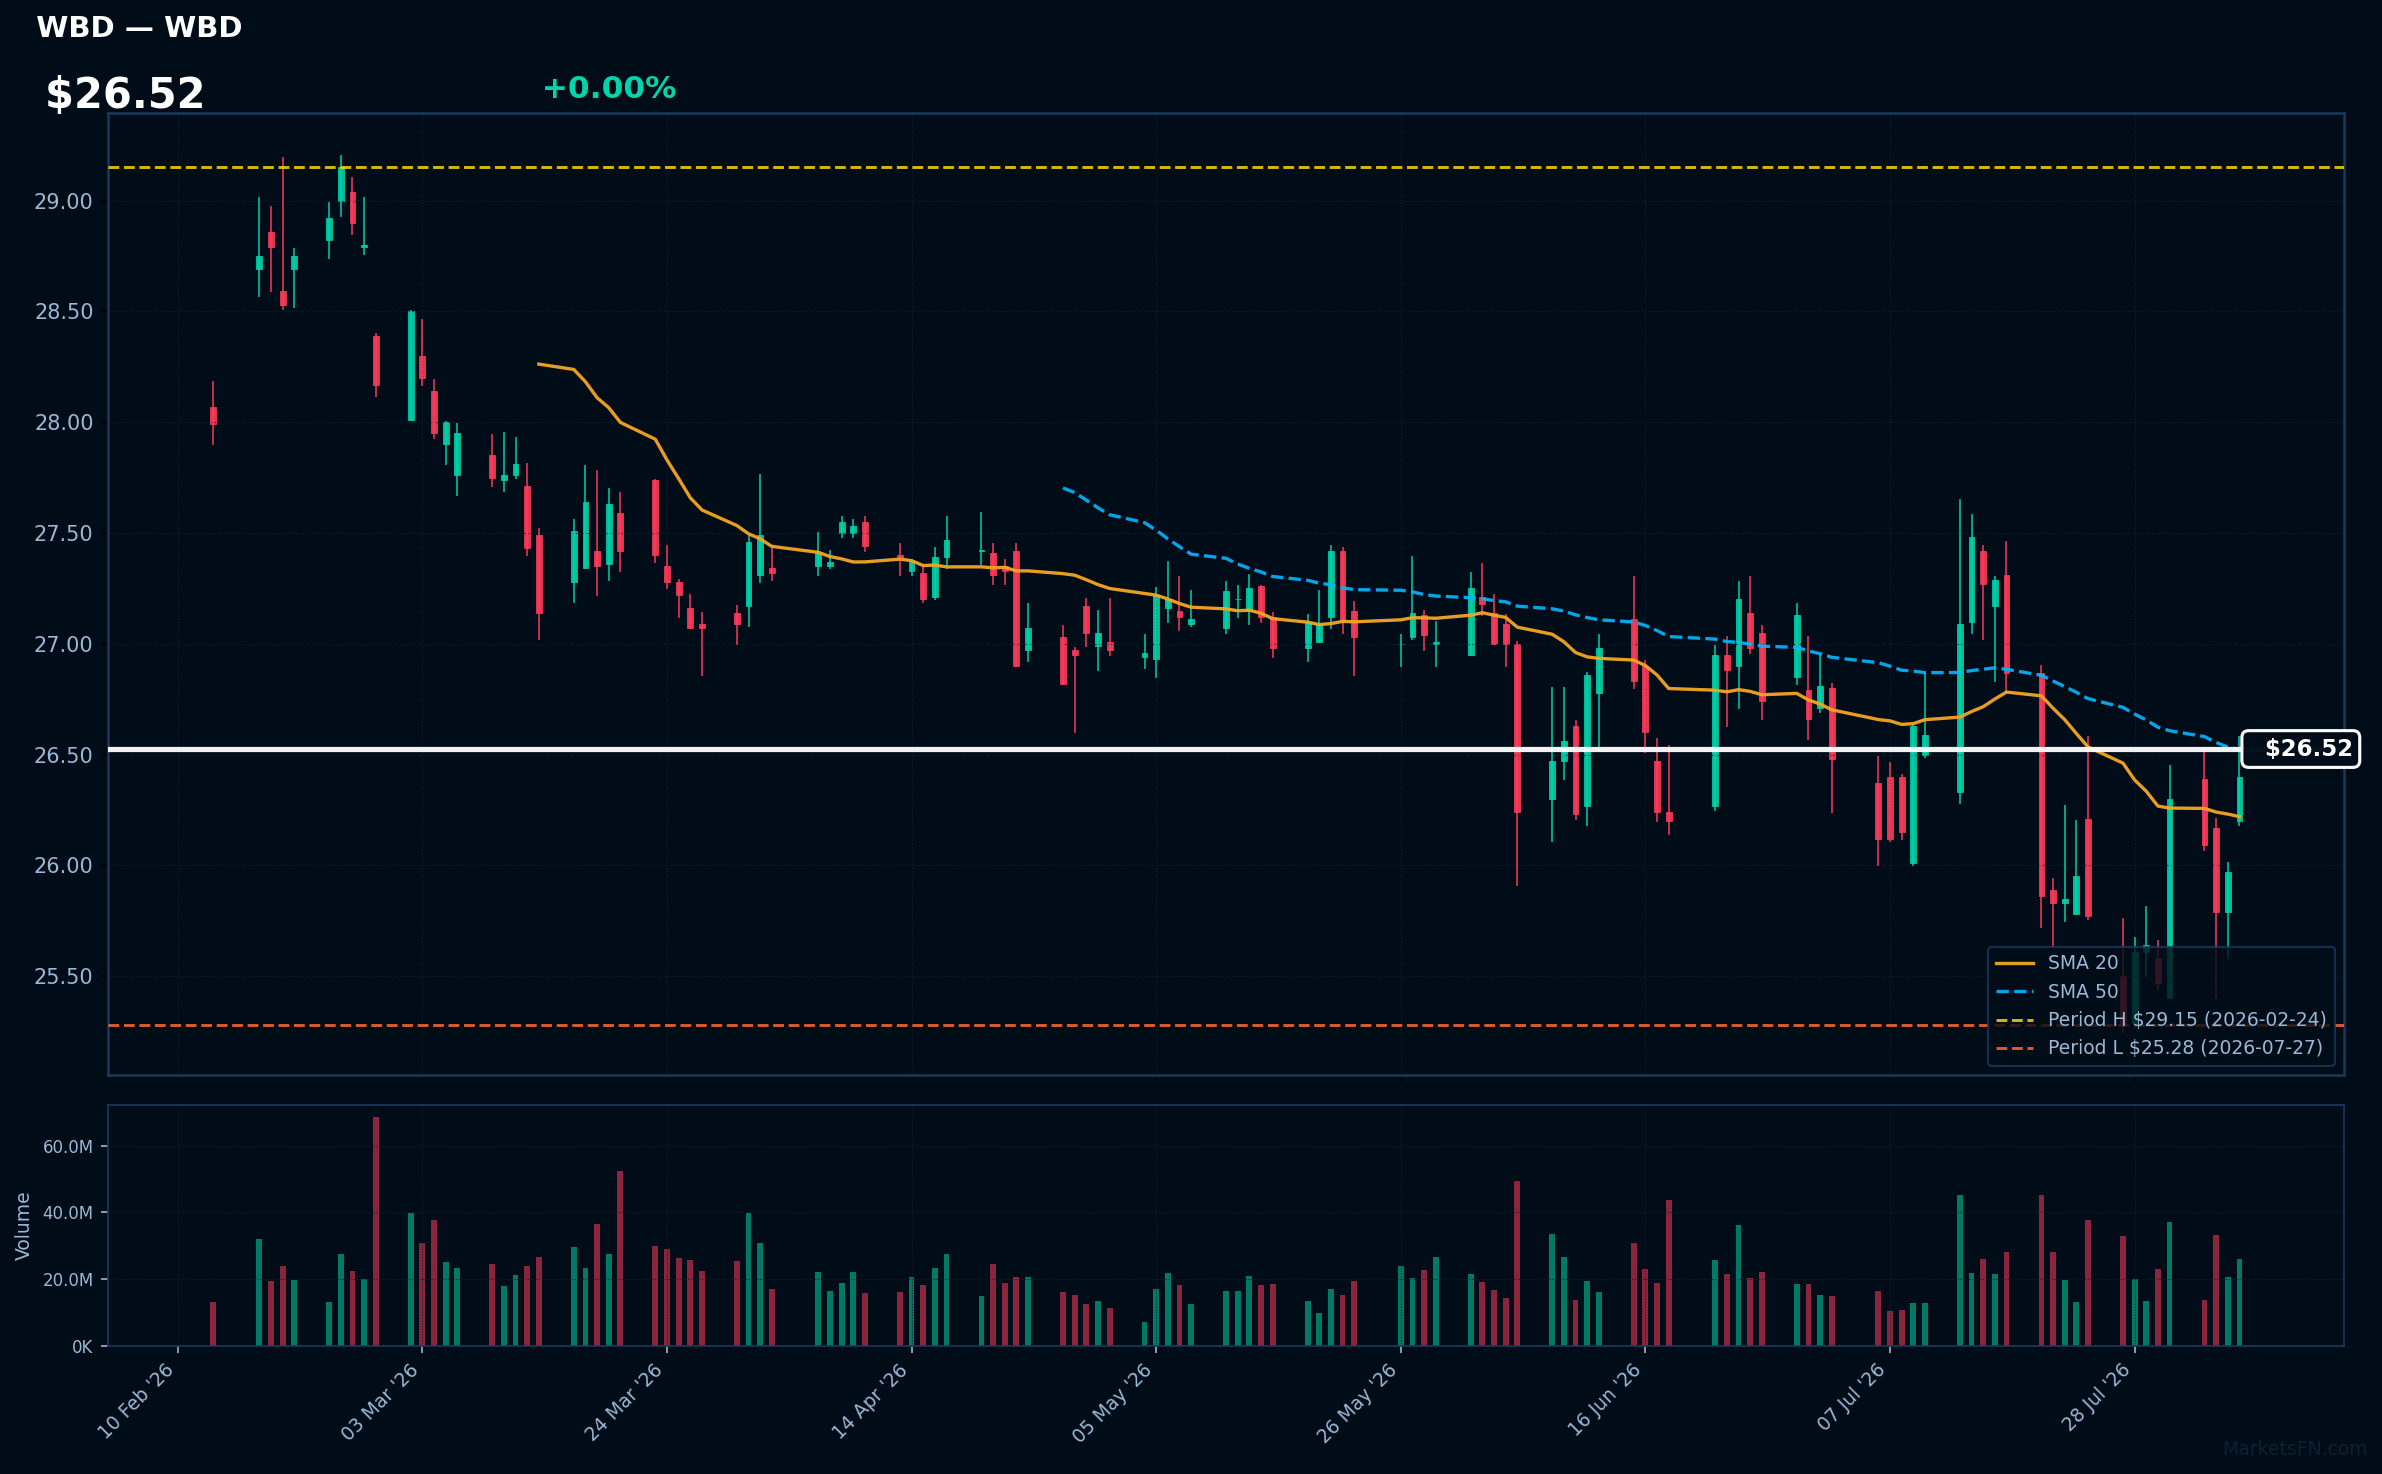
WBD | Warner Bros. Discovery Inc | Communication Services | Price Last: $26.40 | % Realized: -7.40% | RSI: 53.9 | % above MA200: -1.0% | Trend: Above MA20 · Below MA50, MA200
Warner Bros. Discovery Inc operates in the media and entertainment sector, producing and distributing films, television shows, and streaming content. Investors should care due to its diverse content portfolio and potential for growth in the streaming market, which is crucial for future revenue generation.
The current technical situation shows mixed signals: the RSI(14) is at 53.9, indicating neutral momentum, while the price is above MA20 and MA50 but below MA200, suggesting caution as the stock tests major support, being only 4.4% above its 2026 YTD low.
Related headlines
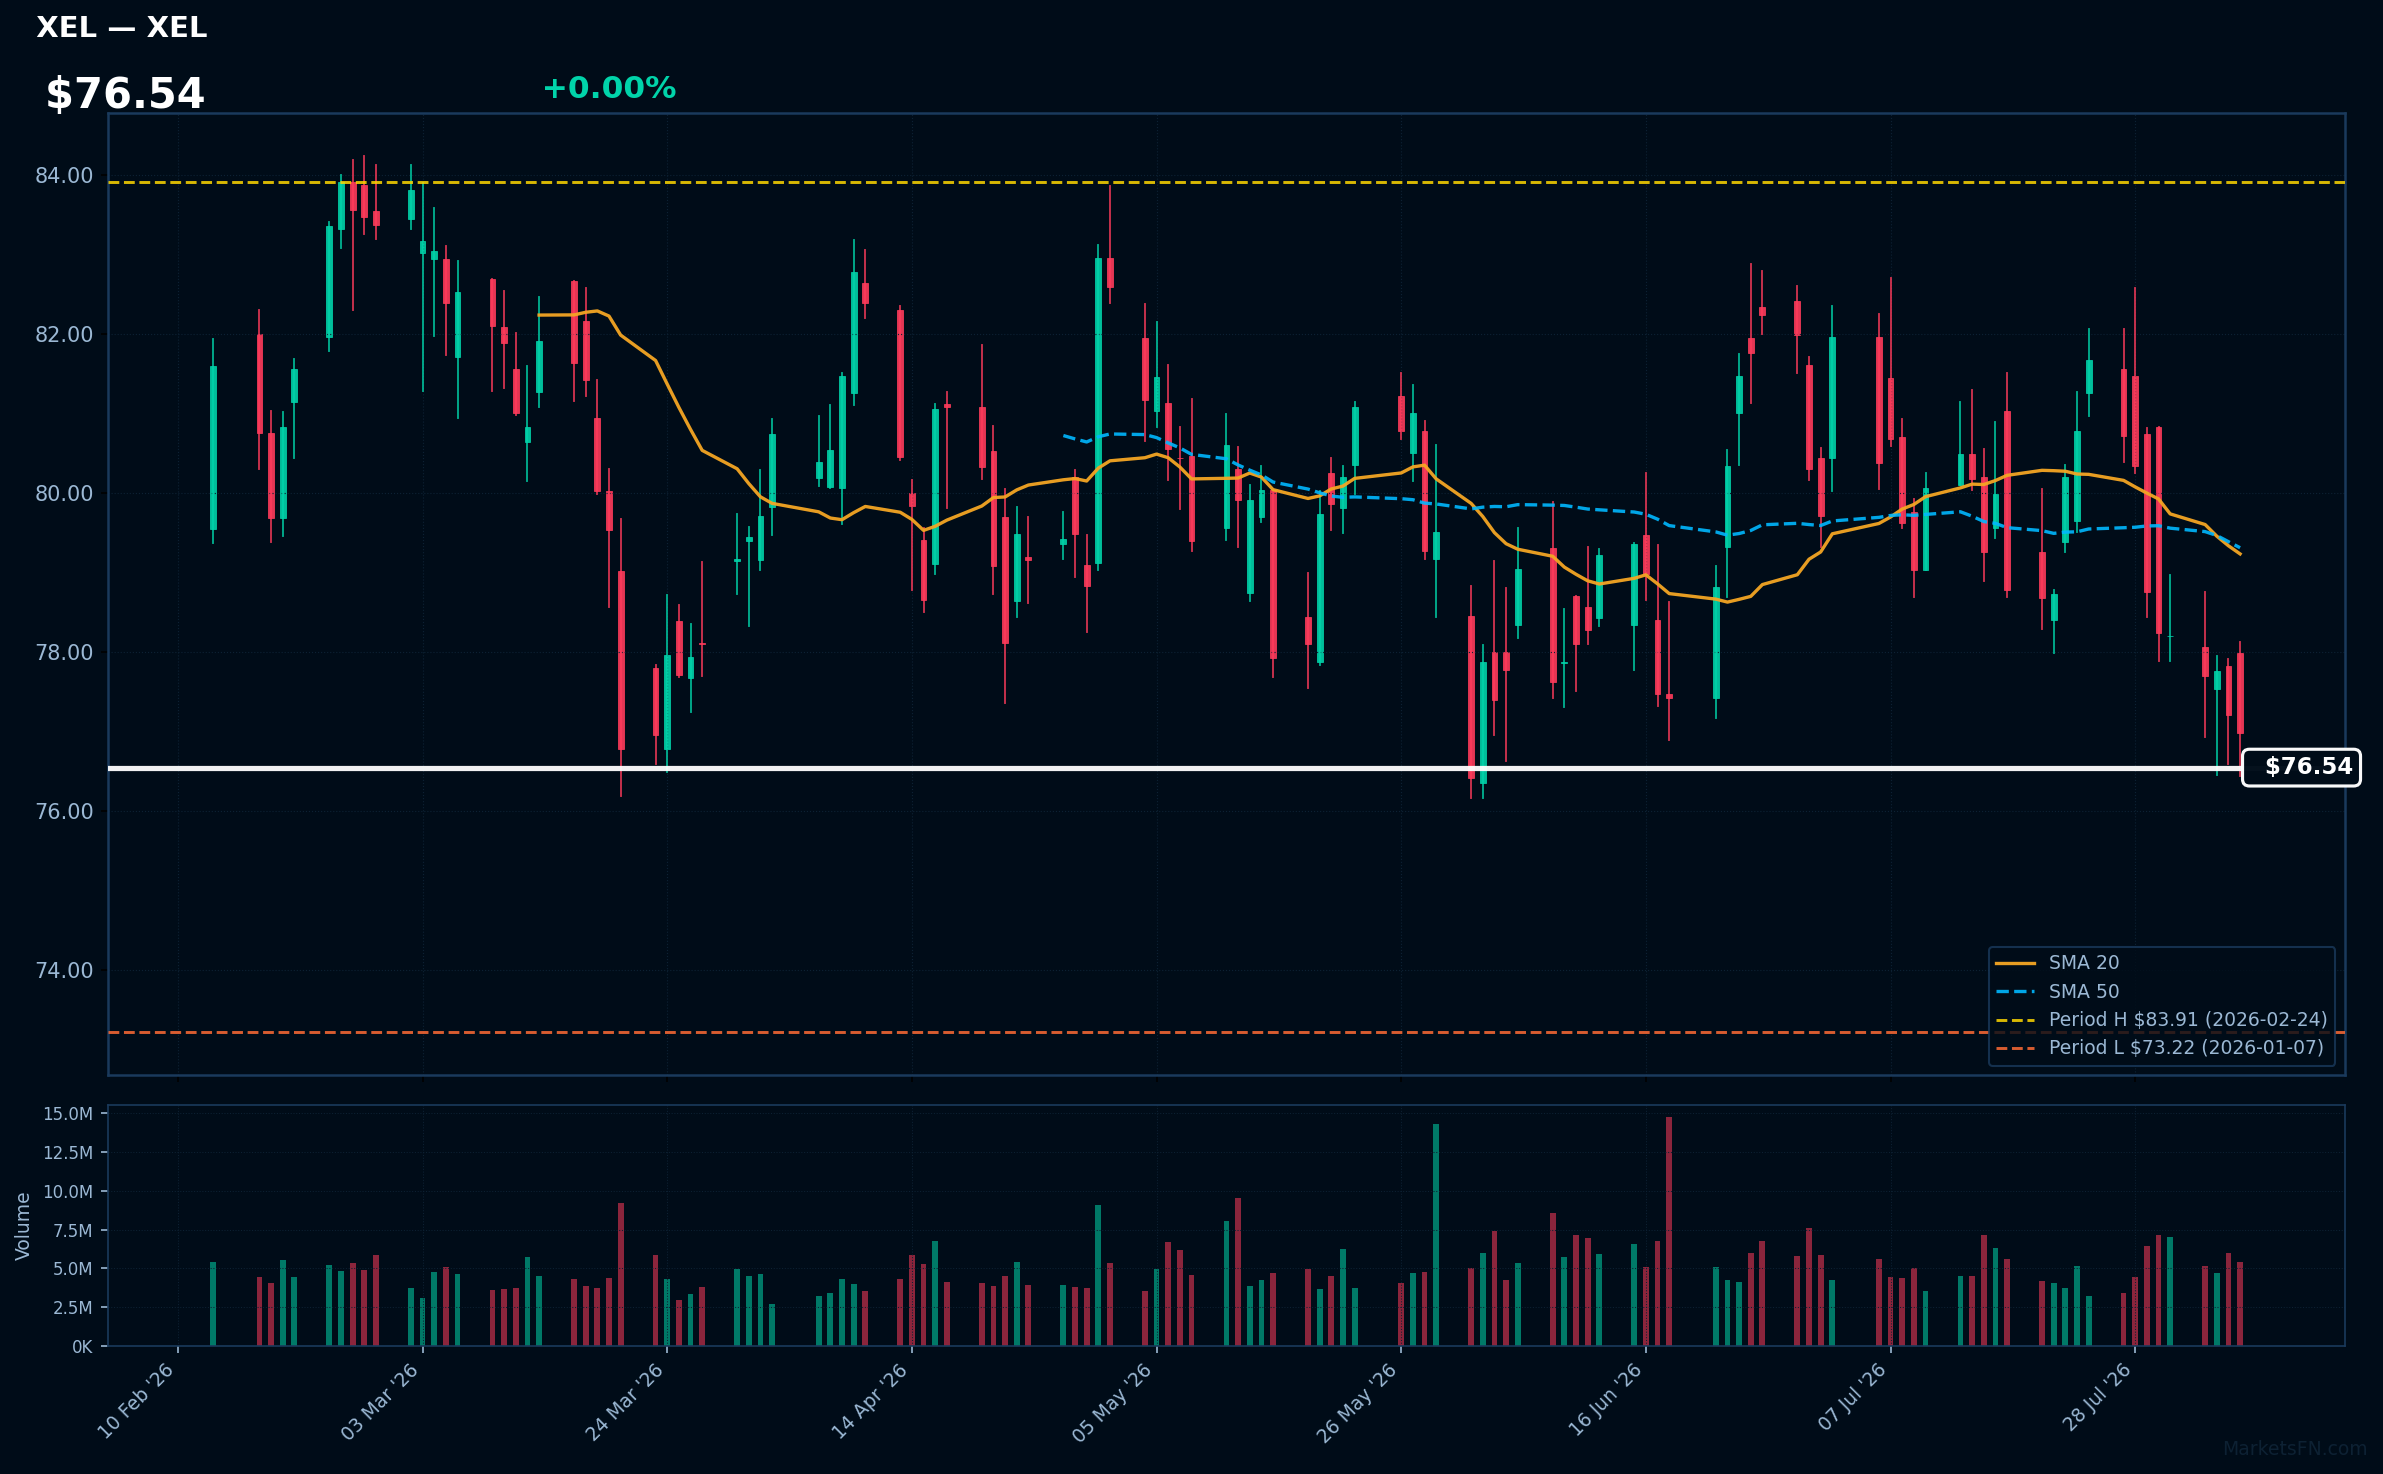
XEL | Xcel Energy, Inc | Utilities | Price Last: $76.97 | % Realized: +3.07% | RSI: 35.6 | % above MA200: -2.5% | Trend: Below MA20, MA50, MA200
Xcel Energy, Inc (XEL) is a utility company providing electricity and natural gas services across eight states. Investors should care due to its focus on renewable energy and commitment to reducing carbon emissions, positioning it well for future regulatory and market shifts.
The current technical situation shows mixed signals with an RSI(14) of 35.6, indicating potential oversold conditions. The stock is below MA20/MA50/MA200, suggesting a warning sign as it tests major support, being only 5.1% above its 2026 YTD low.
Related headlines
Market Commentary
The fact that stocks like Microsoft Corporation, Automatic Data Processing Inc, Fastenal Co, Ross Stores, and Electronic Arts, are all at 0.0% from their 2026 highs indicates a strong bullish sentiment in the Nasdaq 100. These companies are demonstrating resilience and investor confidence, suggesting that they are well-positioned to capitalize on current market conditions. Their proximity to highs may also reflect broader trends in technology adoption and consumer demand.
Several themes are driving these movements in the technology sector, including advancements in artificial intelligence, cloud computing, and digital transformation. Additionally, macroeconomic conditions such as low interest rates and a recovering economy have provided a favorable backdrop for tech stocks. The ongoing shift towards remote work and e-commerce continues to bolster the performance of these companies, reinforcing their market positions.
Investors and traders should closely monitor upcoming earnings reports and economic indicators that could impact market sentiment. Key metrics such as inflation rates, employment data, and consumer spending will be critical in assessing the sustainability of these highs. Furthermore, any shifts in regulatory policies or geopolitical tensions could also influence stock performance in the tech sector moving forward.
Methodology: All 101 Nasdaq 100 constituents screened. Close prices downloaded from 2026-01-01. Period high = highest close since Jan 1 2026; period low = lowest close since Jan 1 2026. Distance = (current price / period extreme − 1) × 100. Technical indicators computed on up to 1 year of daily OHLCV data.
Disclaimer: For informational purposes only. Not investment advice. Past performance is not indicative of future results.

