Nasdaq 100 2026 YTD Highs & Lows Radar: Microsoftoration (MSFT), Netflix (NFLX) and more
MarketsFN Team

Nasdaq 100 2026 YTD Highs & Lows Radar: Microsoftoration (MSFT), Netflix (NFLX) and more
Screening all 101 Nasdaq 100 constituents for stocks nearest to their 2026 year-to-date high and their 2026 YTD low. Data as of October 05, 2026. % Realized = total return since Jan 1 2026.
Legend: RSI > 70 = overbought · RSI < 30 = oversold · Green % Realized = positive YTD return · Red = negative.
📈 Nearest to 2026 High
Sectors represented: Technology (5)
| Ticker | Company | Sector | Price Last | % Realized | 2026 YTD High Date | RSI | % above MA200 | Trend |
|---|---|---|---|---|---|---|---|---|
| MSFT | Microsoft Corporation | Technology | $517.53 | +9.43% | 2026-10-02 | 68.8 | +19.5% | Above MA20, MA50, MA200 |
| AMD | Advanced Micro Devices Inc | Technology | $633.91 | +183.67% | 2026-10-02 | 69.7 | +68.2% | Above MA20, MA50, MA200 |
| PANW | Palo Alto Networks Inc | Technology | $403.24 | +124.81% | 2026-10-02 | 63.3 | +60.4% | Above MA20, MA50, MA200 |
| CRWD | Crowdstrike Holdings Inc | Technology | $270.04 | +138.14% | 2026-10-02 | 69.5 | +75.0% | Above MA20, MA50, MA200 |
| FTNT | Fortinet Inc | Technology | $180.95 | +132.34% | 2026-10-02 | 65.5 | +52.0% | Above MA20, MA50, MA200 |
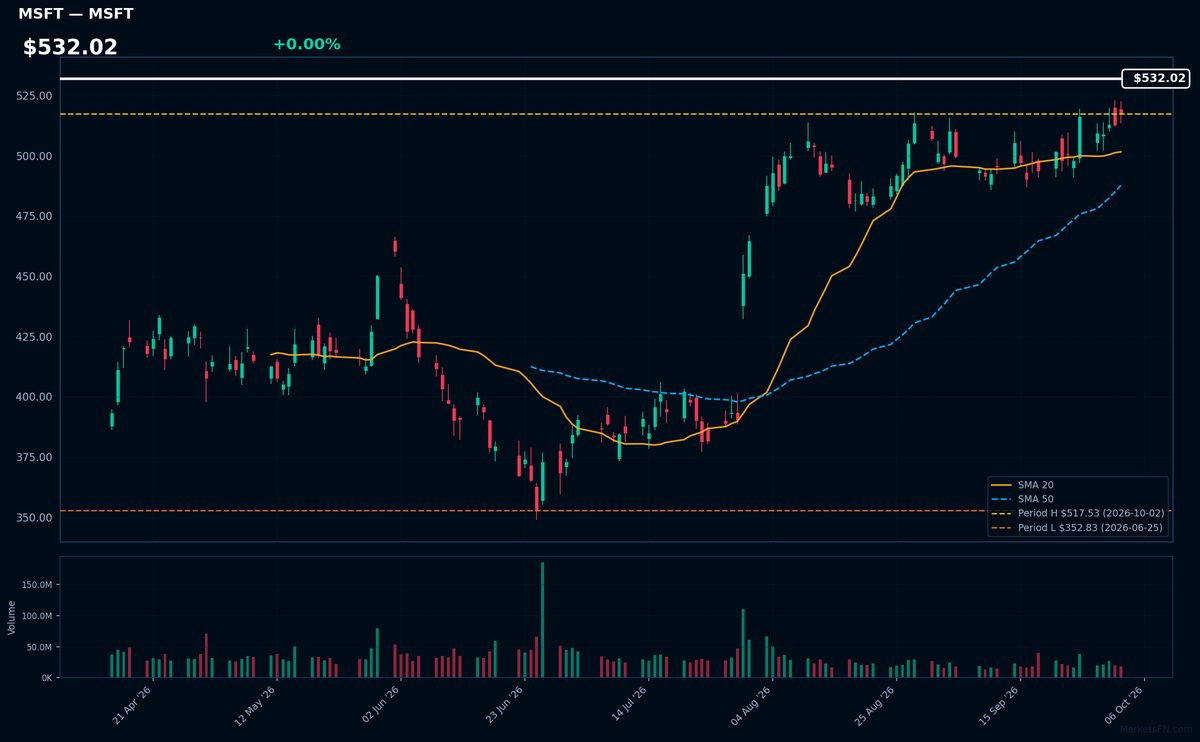
MSFT | Microsoft Corporation | Technology | Price Last: $517.53 | % Realized: +9.43% | RSI: 68.8 | % above MA200: +19.5% | Trend: Above MA20, MA50, MA200
Microsoft Corporation is a technology company that develops, licenses, and supports software, hardware, and services, including Windows, Office, Azure, and Xbox. Investors care about its dominance in productivity software and cloud computing, driving growth and profitability.
Microsoft's current technical situation indicates sustained uptrend with bullish MA alignment (price > MA20 > MA50 > MA200) and RSI(14) at 68.8, near a potential breakout level as it's 0.0% below its 2026 YTD high, suggesting momentum.
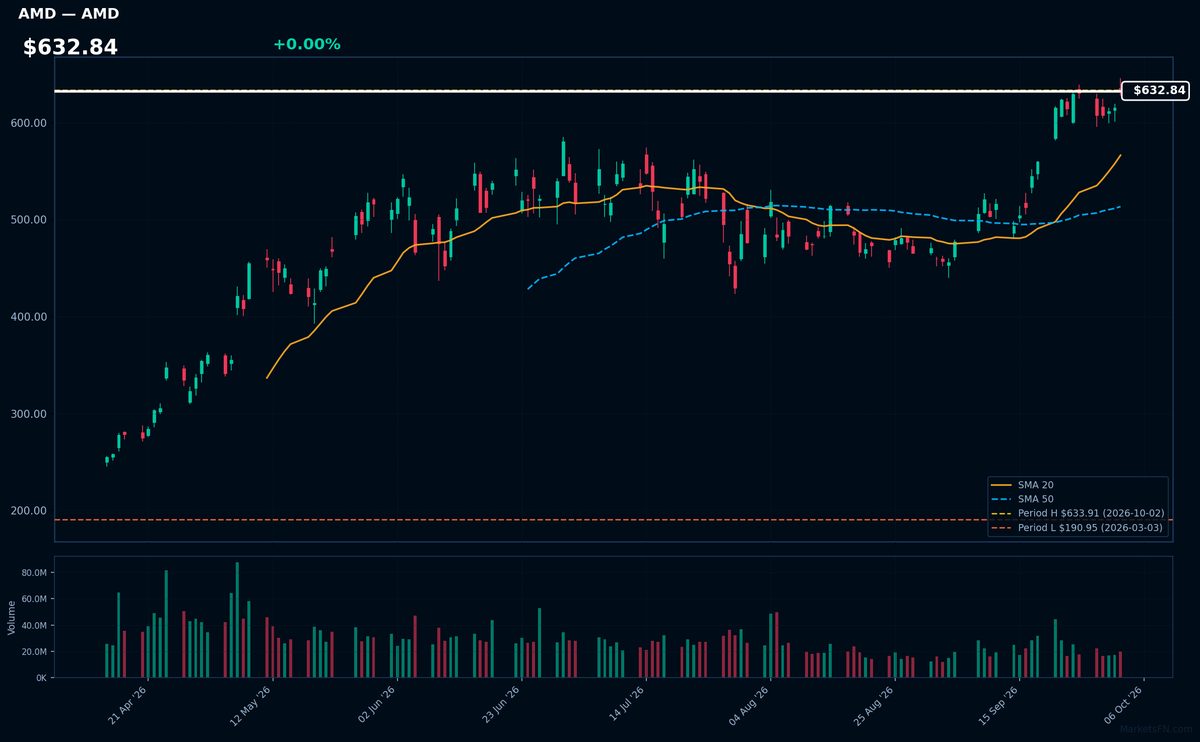
AMD | Advanced Micro Devices Inc | Technology | Price Last: $633.91 | % Realized: +183.67% | RSI: 69.7 | % above MA200: +68.2% | Trend: Above MA20, MA50, MA200
Advanced Micro Devices Inc (AMD) is a semiconductor company designing and manufacturing high-performance CPUs, GPUs, and other processing units for gaming PCs, data centers, and AI applications, making it a key player in the rapidly growing tech industry.
AMD's current technical situation indicates strong momentum: RSI(14) is 69.7, nearing overbought territory, with a bullish MA alignment (price > MA20 > MA50 > MA200) and 0.0% below its 2026 YTD high, suggesting a potential breakout.
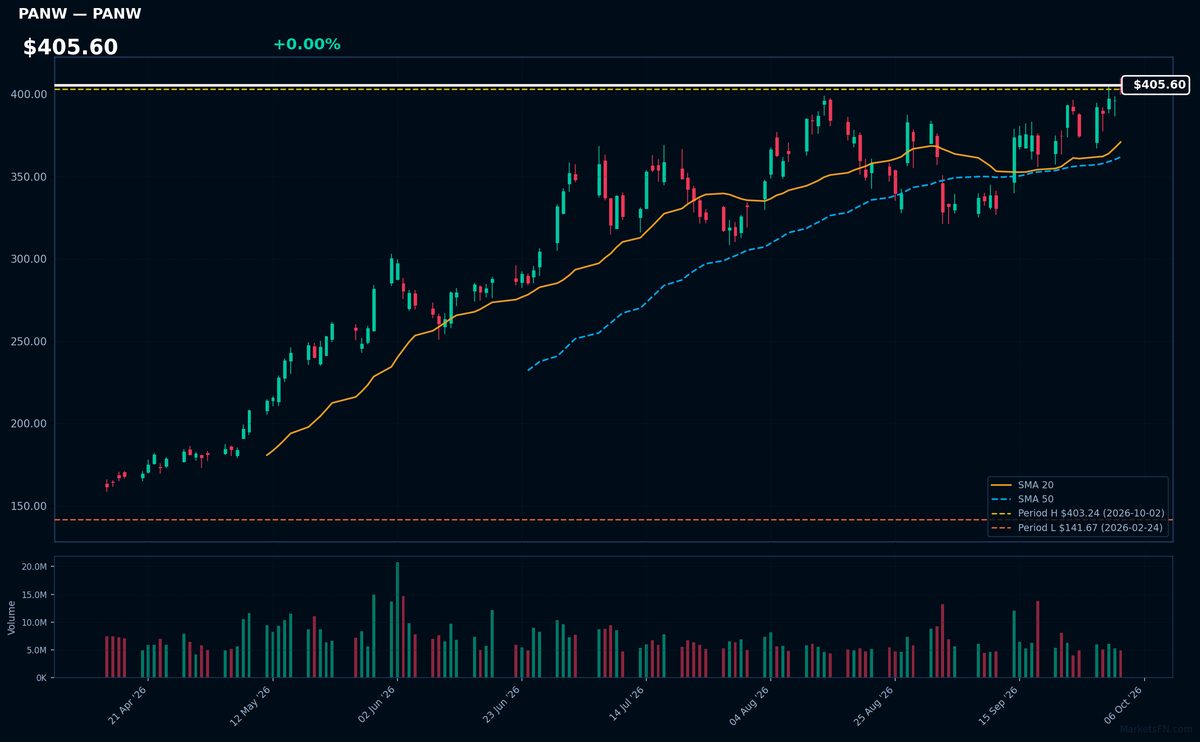
PANW | Palo Alto Networks Inc | Technology | Price Last: $403.24 | % Realized: +124.81% | RSI: 63.3 | % above MA200: +60.4% | Trend: Above MA20, MA50, MA200
Palo Alto Networks Inc is a cybersecurity company providing advanced threat prevention and security solutions. Investors should care because its innovative products and strong market position drive growth, making it a significant player in the rapidly expanding cybersecurity market.
Palo Alto Networks Inc shows bullish technicals with RSI(14) at 63.3, indicating rising momentum. The MA alignment is bullish as price ($405.60) > MA20 > MA50 > MA200, confirming a sustained uptrend. The stock is 0.0% below its 2026 YTD high, nearing a potential breakout.
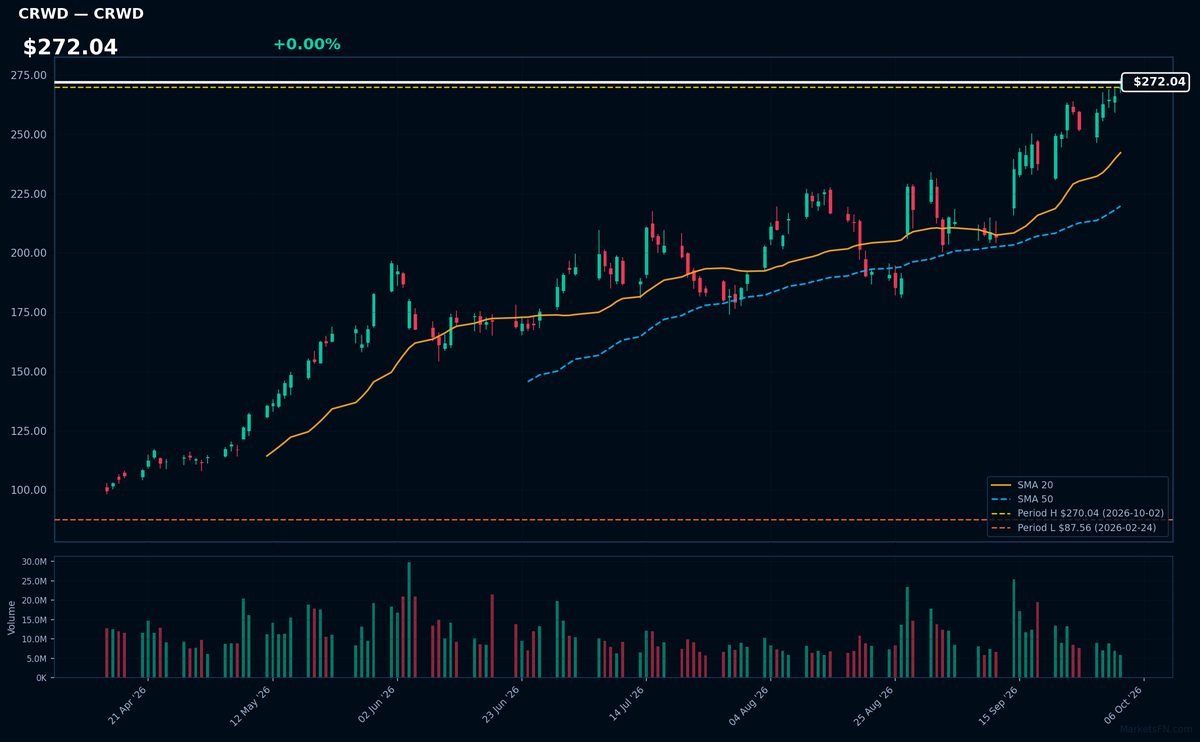
CRWD | Crowdstrike Holdings Inc | Technology | Price Last: $270.04 | % Realized: +138.14% | RSI: 69.5 | % above MA200: +75.0% | Trend: Above MA20, MA50, MA200
Crowdstrike Holdings Inc is a cybersecurity company providing cloud-delivered endpoint and cloud workload protection. Investors should care because its innovative solutions are in high demand, driving growth. Specific details about its products and services are not provided in the data.
Crowdstrike's technical situation indicates strong momentum: RSI(14) is 69.5, nearing overbought territory. The MA alignment is bullish with price > MA20 > MA50 > MA200, and it's 0.0% below its 2026 YTD high, suggesting a potential breakout.
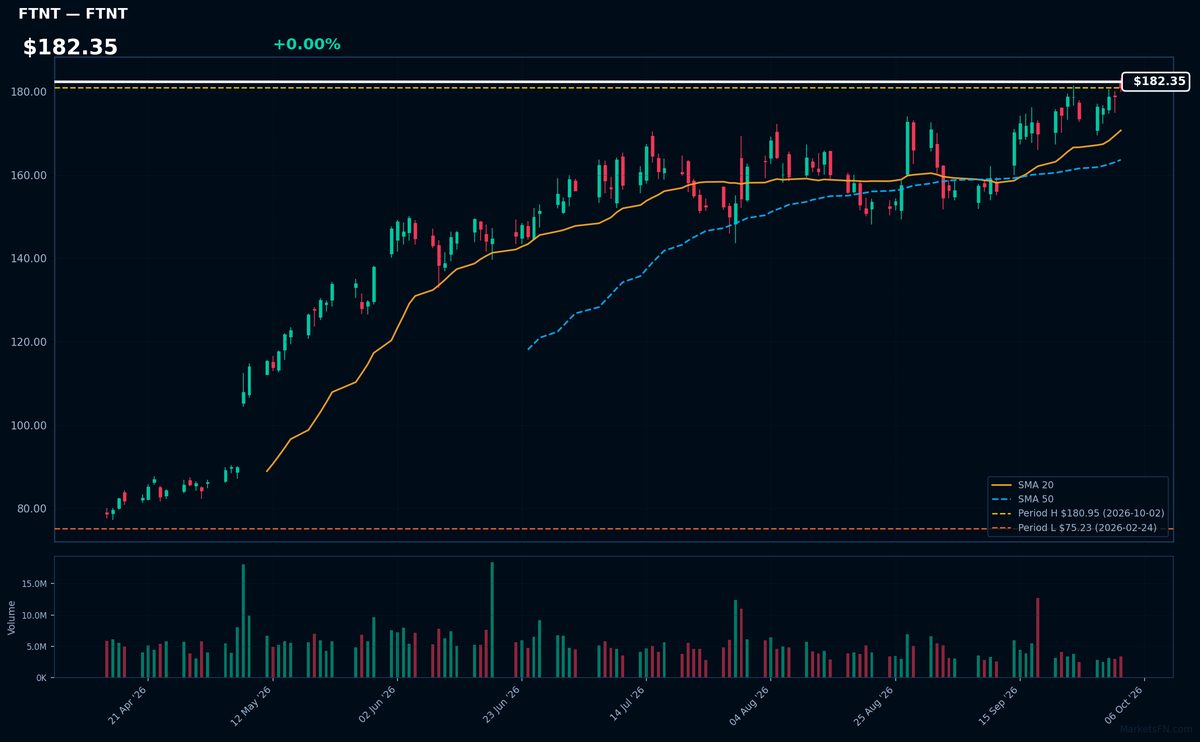
FTNT | Fortinet Inc | Technology | Price Last: $180.95 | % Realized: +132.34% | RSI: 65.5 | % above MA200: +52.0% | Trend: Above MA20, MA50, MA200
Fortinet Inc is a cybersecurity company providing network security solutions, including firewalls and threat intelligence. Investors should care because its products protect against evolving cyber threats, making its growth tied to the expanding cybersecurity market.
Fortinet Inc shows bullish technicals with RSI(14) at 65.5, indicating rising momentum. The MA alignment (price > MA20 > MA50 > MA200) confirms a sustained uptrend. The stock is 0.0% below its 2026 YTD high, nearing a potential breakout.
📉 Nearest to 2026 Low
Sectors represented: Communication Services (5)
| Ticker | Company | Sector | Price Last | % Realized | 2026 YTD Low Date | RSI | % above MA200 | Trend |
|---|---|---|---|---|---|---|---|---|
| NFLX | Netflix Inc | Communication Services | $67.06 | -26.30% | 2026-10-02 | 31.3 | -20.1% | Below MA20, MA50, MA200 |
| APP | Applovin Corp | Communication Services | $268.22 | -56.62% | 2026-10-02 | 35.6 | -41.0% | Below MA20, MA50, MA200 |
| CMCSA | Comcast Corp | Communication Services | $21.57 | -22.09% | 2026-10-02 | 26.4 | -19.1% | Below MA20, MA50, MA200 |
| CHTR | Charter Communications Inc | Communication Services | $109.29 | -47.78% | 2026-10-02 | 27.0 | -37.3% | Below MA20, MA50, MA200 |
| TTD | Trade Desk Inc | Communication Services | $11.95 | -68.29% | 2026-10-02 | 30.3 | -46.8% | Below MA20, MA50, MA200 |
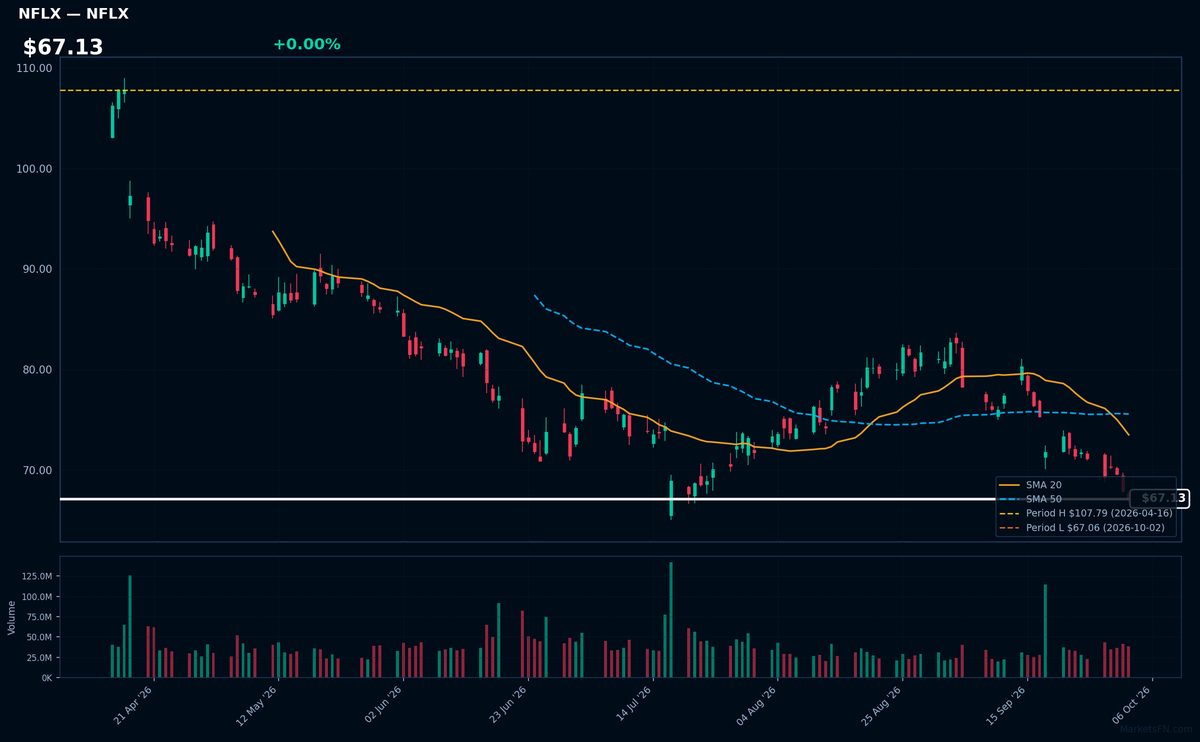
NFLX | Netflix Inc | Communication Services | Price Last: $67.06 | % Realized: -26.30% | RSI: 31.3 | % above MA200: -20.1% | Trend: Below MA20, MA50, MA200
Netflix Inc is a streaming giant providing entertainment content. Investors care about its ability to grow subscribers and revenue while navigating intense competition, as reflected in its stock performance.
NFLX is in a sustained downtrend with price < MA20 < MA50 < MA200, RSI(14) at 31.3, and is 0.0% above its 2026 YTD low, indicating a warning sign as it tests major support with a -26.3% 2026 YTD return.
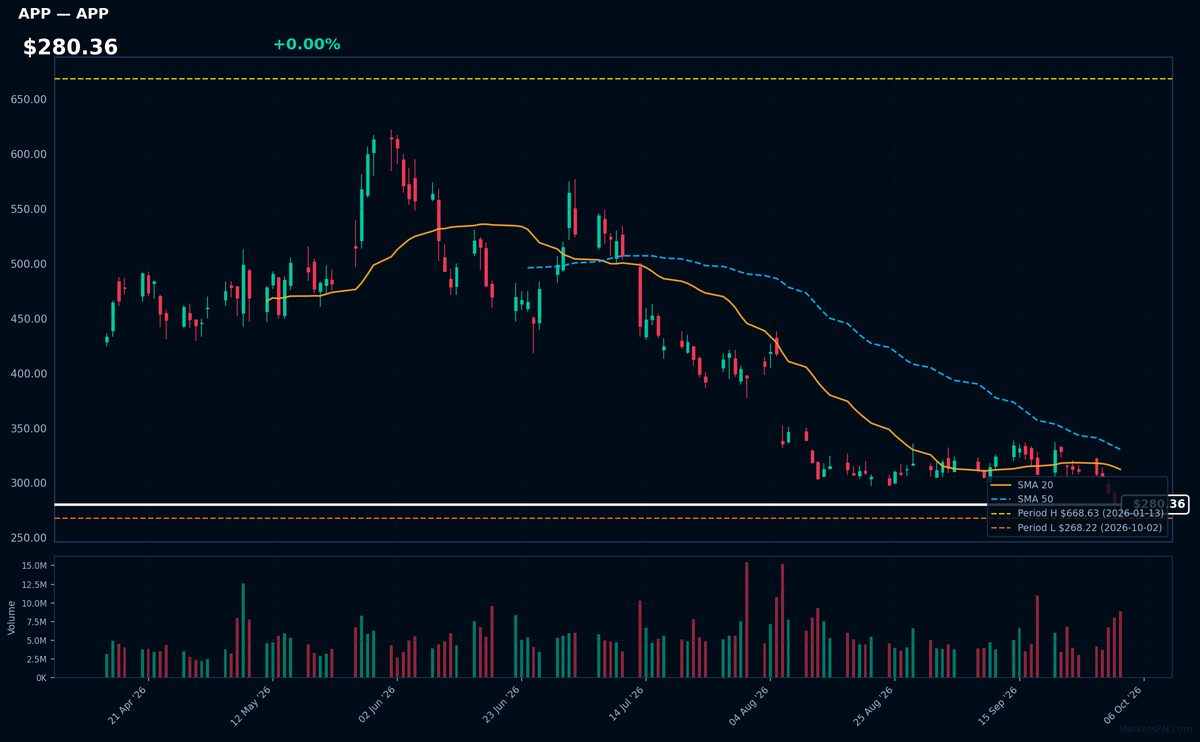
APP | Applovin Corp | Communication Services | Price Last: $268.22 | % Realized: -56.62% | RSI: 35.6 | % above MA200: -41.0% | Trend: Below MA20, MA50, MA200
Applovin Corp operates a mobile app development and marketing platform, enabling developers to grow their businesses through software solutions for app discovery, monetization, and user engagement, making its performance relevant to investors tracking the mobile tech sector.
Applovin Corp's technical situation indicates a sustained downtrend with price ($280.36) below MA20, MA50, and MA200, and an RSI(14) of 35.6, suggesting bearish momentum; the stock is testing major support at its 2026 YTD low, having fallen -56.6% YTD.
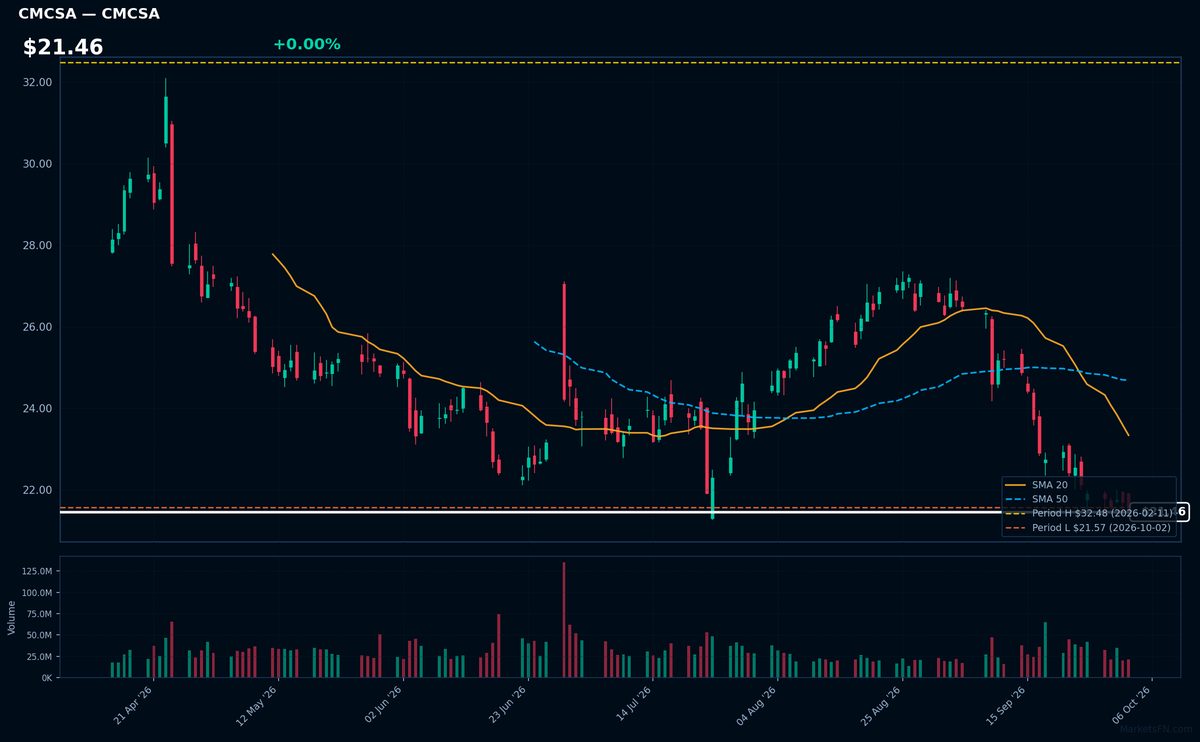
CMCSA | Comcast Corp | Communication Services | Price Last: $21.57 | % Realized: -22.09% | RSI: 26.4 | % above MA200: -19.1% | Trend: Below MA20, MA50, MA200
Comcast Corp is a media and telecommunications conglomerate providing cable television, internet, and phone services, as well as owning NBCUniversal, a major media company with film, television, and theme park assets, making it a significant player in both consumer connectivity and entertainment content.
Comcast Corp's current technical situation is bearish, with an RSI(14) of 26.4 indicating oversold conditions, and a sustained downtrend as price ($21.46) remains below MA20, MA50, and MA200, testing major support at its 2026 YTD low.
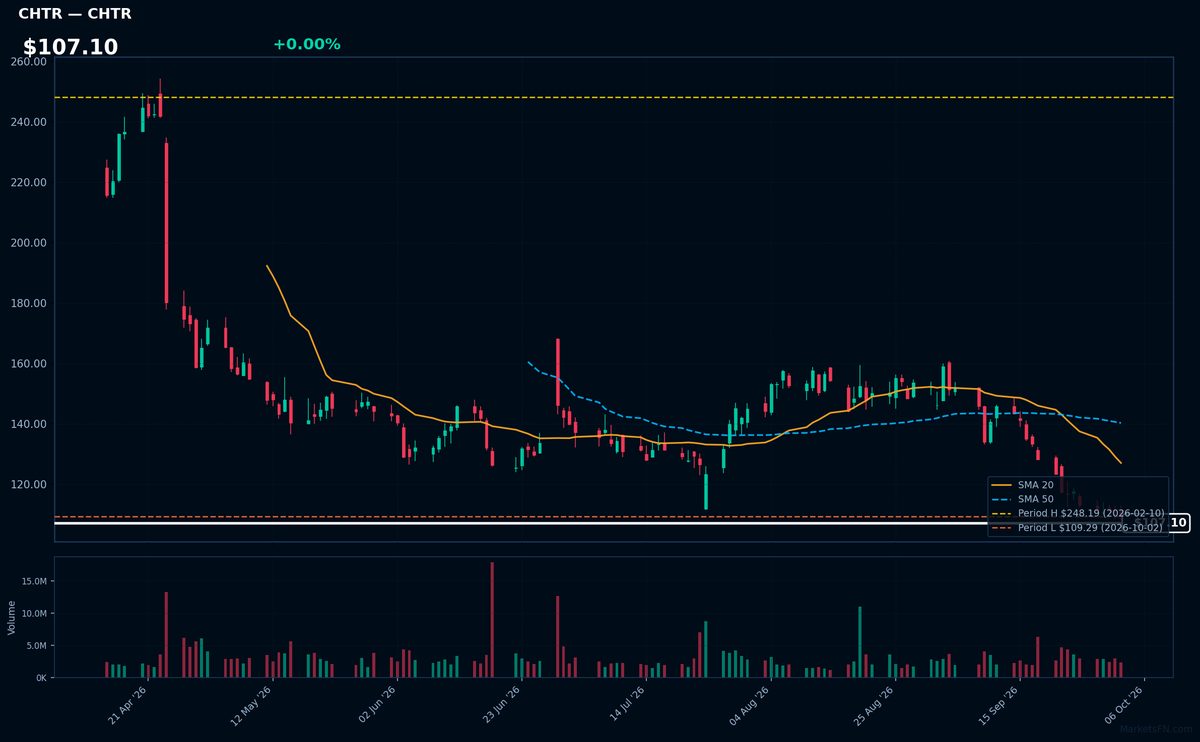
CHTR | Charter Communications Inc | Communication Services | Price Last: $109.29 | % Realized: -47.78% | RSI: 27.0 | % above MA200: -37.3% | Trend: Below MA20, MA50, MA200
Charter Communications Inc is a broadband connectivity company providing cable television, internet, and telephone services to residential and commercial customers, making it a key player in the telecommunications industry with significant exposure to consumer trends and technological advancements.
Charter Communications Inc is in a sustained downtrend with its price at $107.10 below all key moving averages (MA20, MA50, MA200) and an RSI(14) of 27.0, indicating oversold conditions and testing major support at its 2026 YTD low.
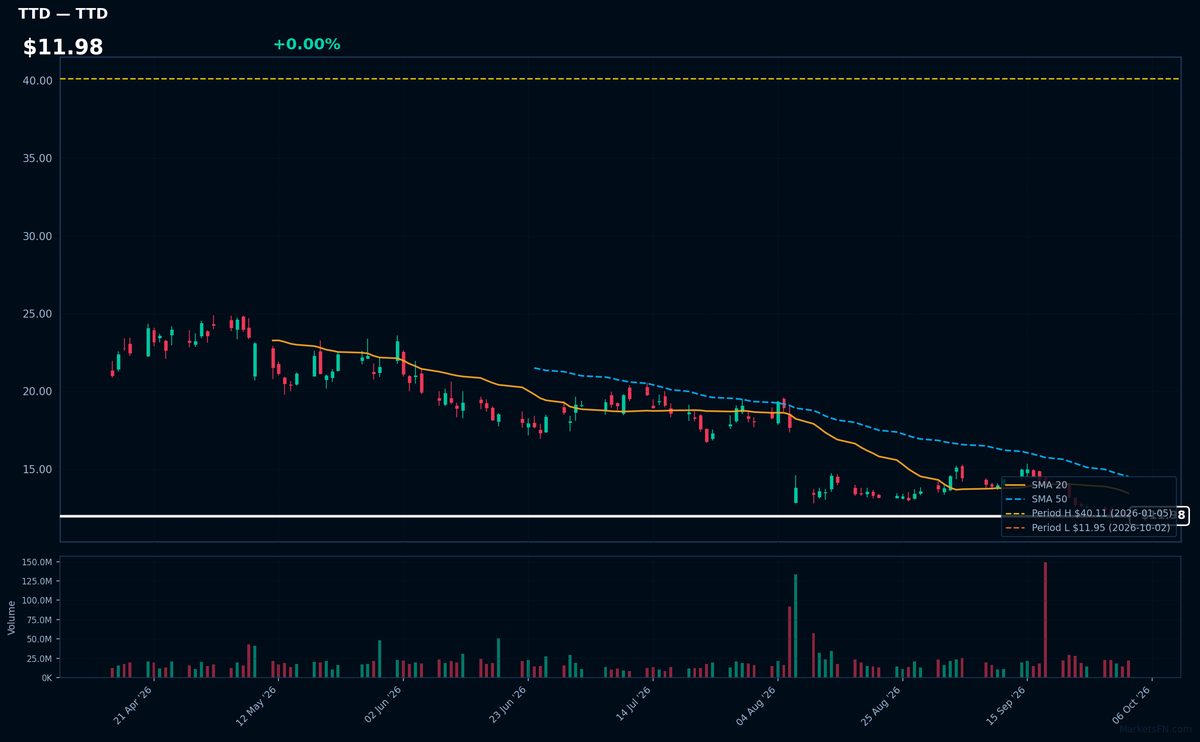
TTD | Trade Desk Inc | Communication Services | Price Last: $11.95 | % Realized: -68.29% | RSI: 30.3 | % above MA200: -46.8% | Trend: Below MA20, MA50, MA200
Trade Desk Inc operates a demand-side platform enabling advertisers to manage digital ad campaigns across various channels and formats. Investors should care as it reflects the growth of digital advertising and the company's competitive positioning within this expanding market.
The stock is in a sustained downtrend with price ($11.98) below all MAs (MA20 < MA50 < MA200), RSI(14) at 30.3, and is 0.0% above its 2026 YTD low, indicating a potential warning sign as it tests major support with a -68.3% 2026 YTD return.
Market Commentary
The Nasdaq 100 tech stocks listed are currently trading near their 2026 year-to-date (YTD) extremes, with some at their highs and others at their lows. Stocks like MSFT, AMD, PANW, CRWD, and FTNT are at their 2026 YTD highs, indicating strong performance, while NFLX, APP, CMCSA, CHTR, and TTD are at their 2026 YTD lows, suggesting weaker performance.
The technology sector is being driven by various themes and macro conditions. The strong performers are largely cybersecurity and semiconductor stocks, indicating a potential focus on security and infrastructure investments. Conversely, the weaker performers include media and entertainment stocks, potentially reflecting changing consumer behavior or competitive pressures.
Investors and traders should watch the factors driving these extremes, such as earnings reports, macroeconomic indicators, and sector-specific trends. Monitoring the performance of these stocks near their YTD extremes can provide insights into the overall health of the technology sector and potential future market directions.
Methodology: All 101 Nasdaq 100 constituents screened. Close prices downloaded from 2026-01-01. Period high = highest close since Jan 1 2026; period low = lowest close since Jan 1 2026. Distance = (current price / period extreme − 1) × 100. Technical indicators computed on up to 1 year of daily OHLCV data.
Disclaimer: For informational purposes only. Not investment advice. Past performance is not indicative of future results.

