Nasdaq 100 2026 YTD Highs & Lows Radar: Paccar (PCAR), Intuitive Surgical (ISRG) and more
MarketsFN Team

Nasdaq 100 2026 YTD Highs & Lows Radar: Paccar (PCAR), Intuitive Surgical (ISRG) and more
Screening all 101 Nasdaq 100 constituents for stocks nearest to their 2026 year-to-date high and their 2026 YTD low. Data as of July 23, 2026. % Realized = total return since Jan 1 2026.
Legend: RSI > 70 = overbought · RSI < 30 = oversold · Green % Realized = positive YTD return · Red = negative.
📈 Nearest to 2026 High
Sectors represented: Industrials (2), Communication Services (1), Consumer Cyclical (1), Consumer Defensive (1)
| Ticker | Company | Sector | Price Last | % Realized | 2026 YTD High Date | RSI | % above MA200 | Trend |
|---|---|---|---|---|---|---|---|---|
| PCAR | Paccar Inc | Industrials | $131.11 | +17.52% | 2026-07-22 | 69.2 | +14.2% | Above MA20, MA50, MA200 |
| EA | Electronic Arts, Inc | Communication Services | $208.95 | +2.22% | 2026-07-20 | 77.2 | +3.2% | Above MA20, MA50, MA200 |
| ROST | Ross Stores, Inc | Consumer Cyclical | $238.21 | +30.35% | 2026-06-12 | 62.2 | +19.4% | Above MA20, MA50, MA200 |
| KHC | Kraft Heinz Co | Consumer Defensive | $25.96 | +6.44% | 2026-07-16 | 60.5 | +8.5% | Above MA20, MA50, MA200 |
| CSX | CSX Corp | Industrials | $49.93 | +37.66% | 2026-07-16 | 75.1 | +22.2% | Above MA20, MA50, MA200 |
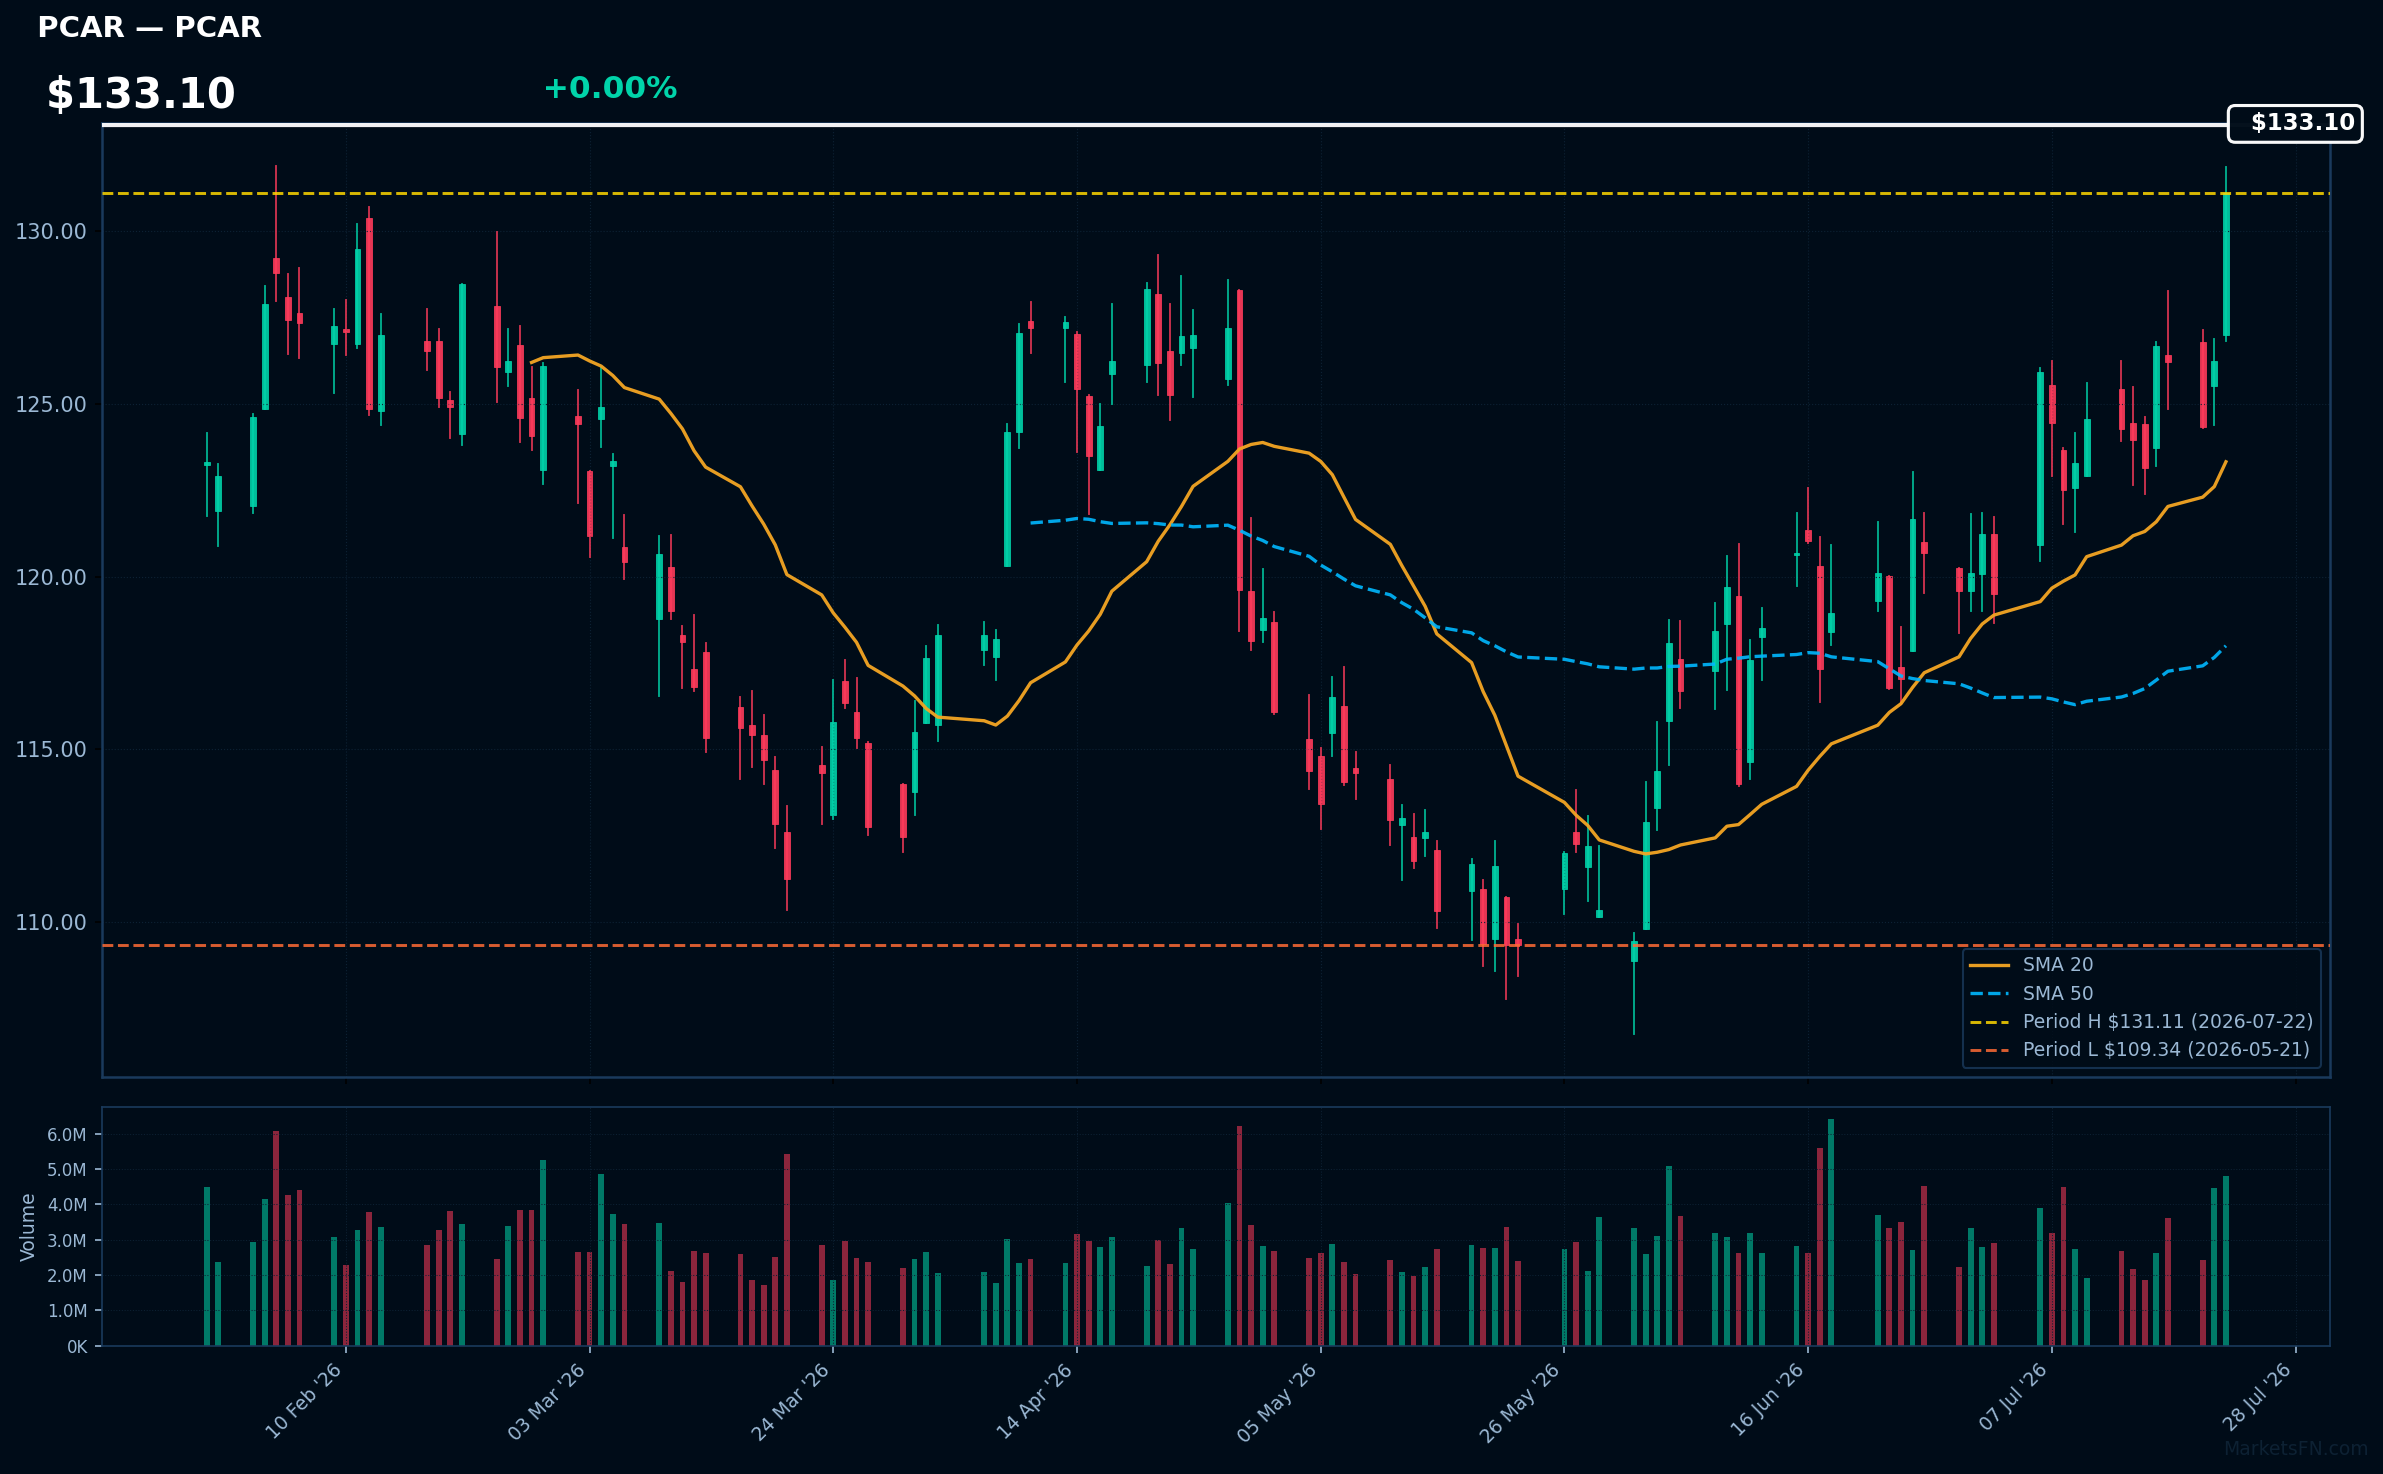
PCAR | Paccar Inc | Industrials | Price Last: $131.11 | % Realized: +17.52% | RSI: 69.2 | % above MA200: +14.2% | Trend: Above MA20, MA50, MA200
Paccar Inc designs and manufactures light-, medium-, and heavy-duty trucks under brands like Kenworth and Peterbilt. Investors should care because the company's truck sales are sensitive to economic cycles, making its performance a potential indicator of broader economic trends.
Paccar Inc's RSI(14) is 69.2, nearing overbought territory. The MA alignment is bullish with price > MA20 > MA50 > MA200, indicating a sustained uptrend. The stock is 0.0% below its 2026 YTD high, suggesting potential for a breakout.
Related headlines
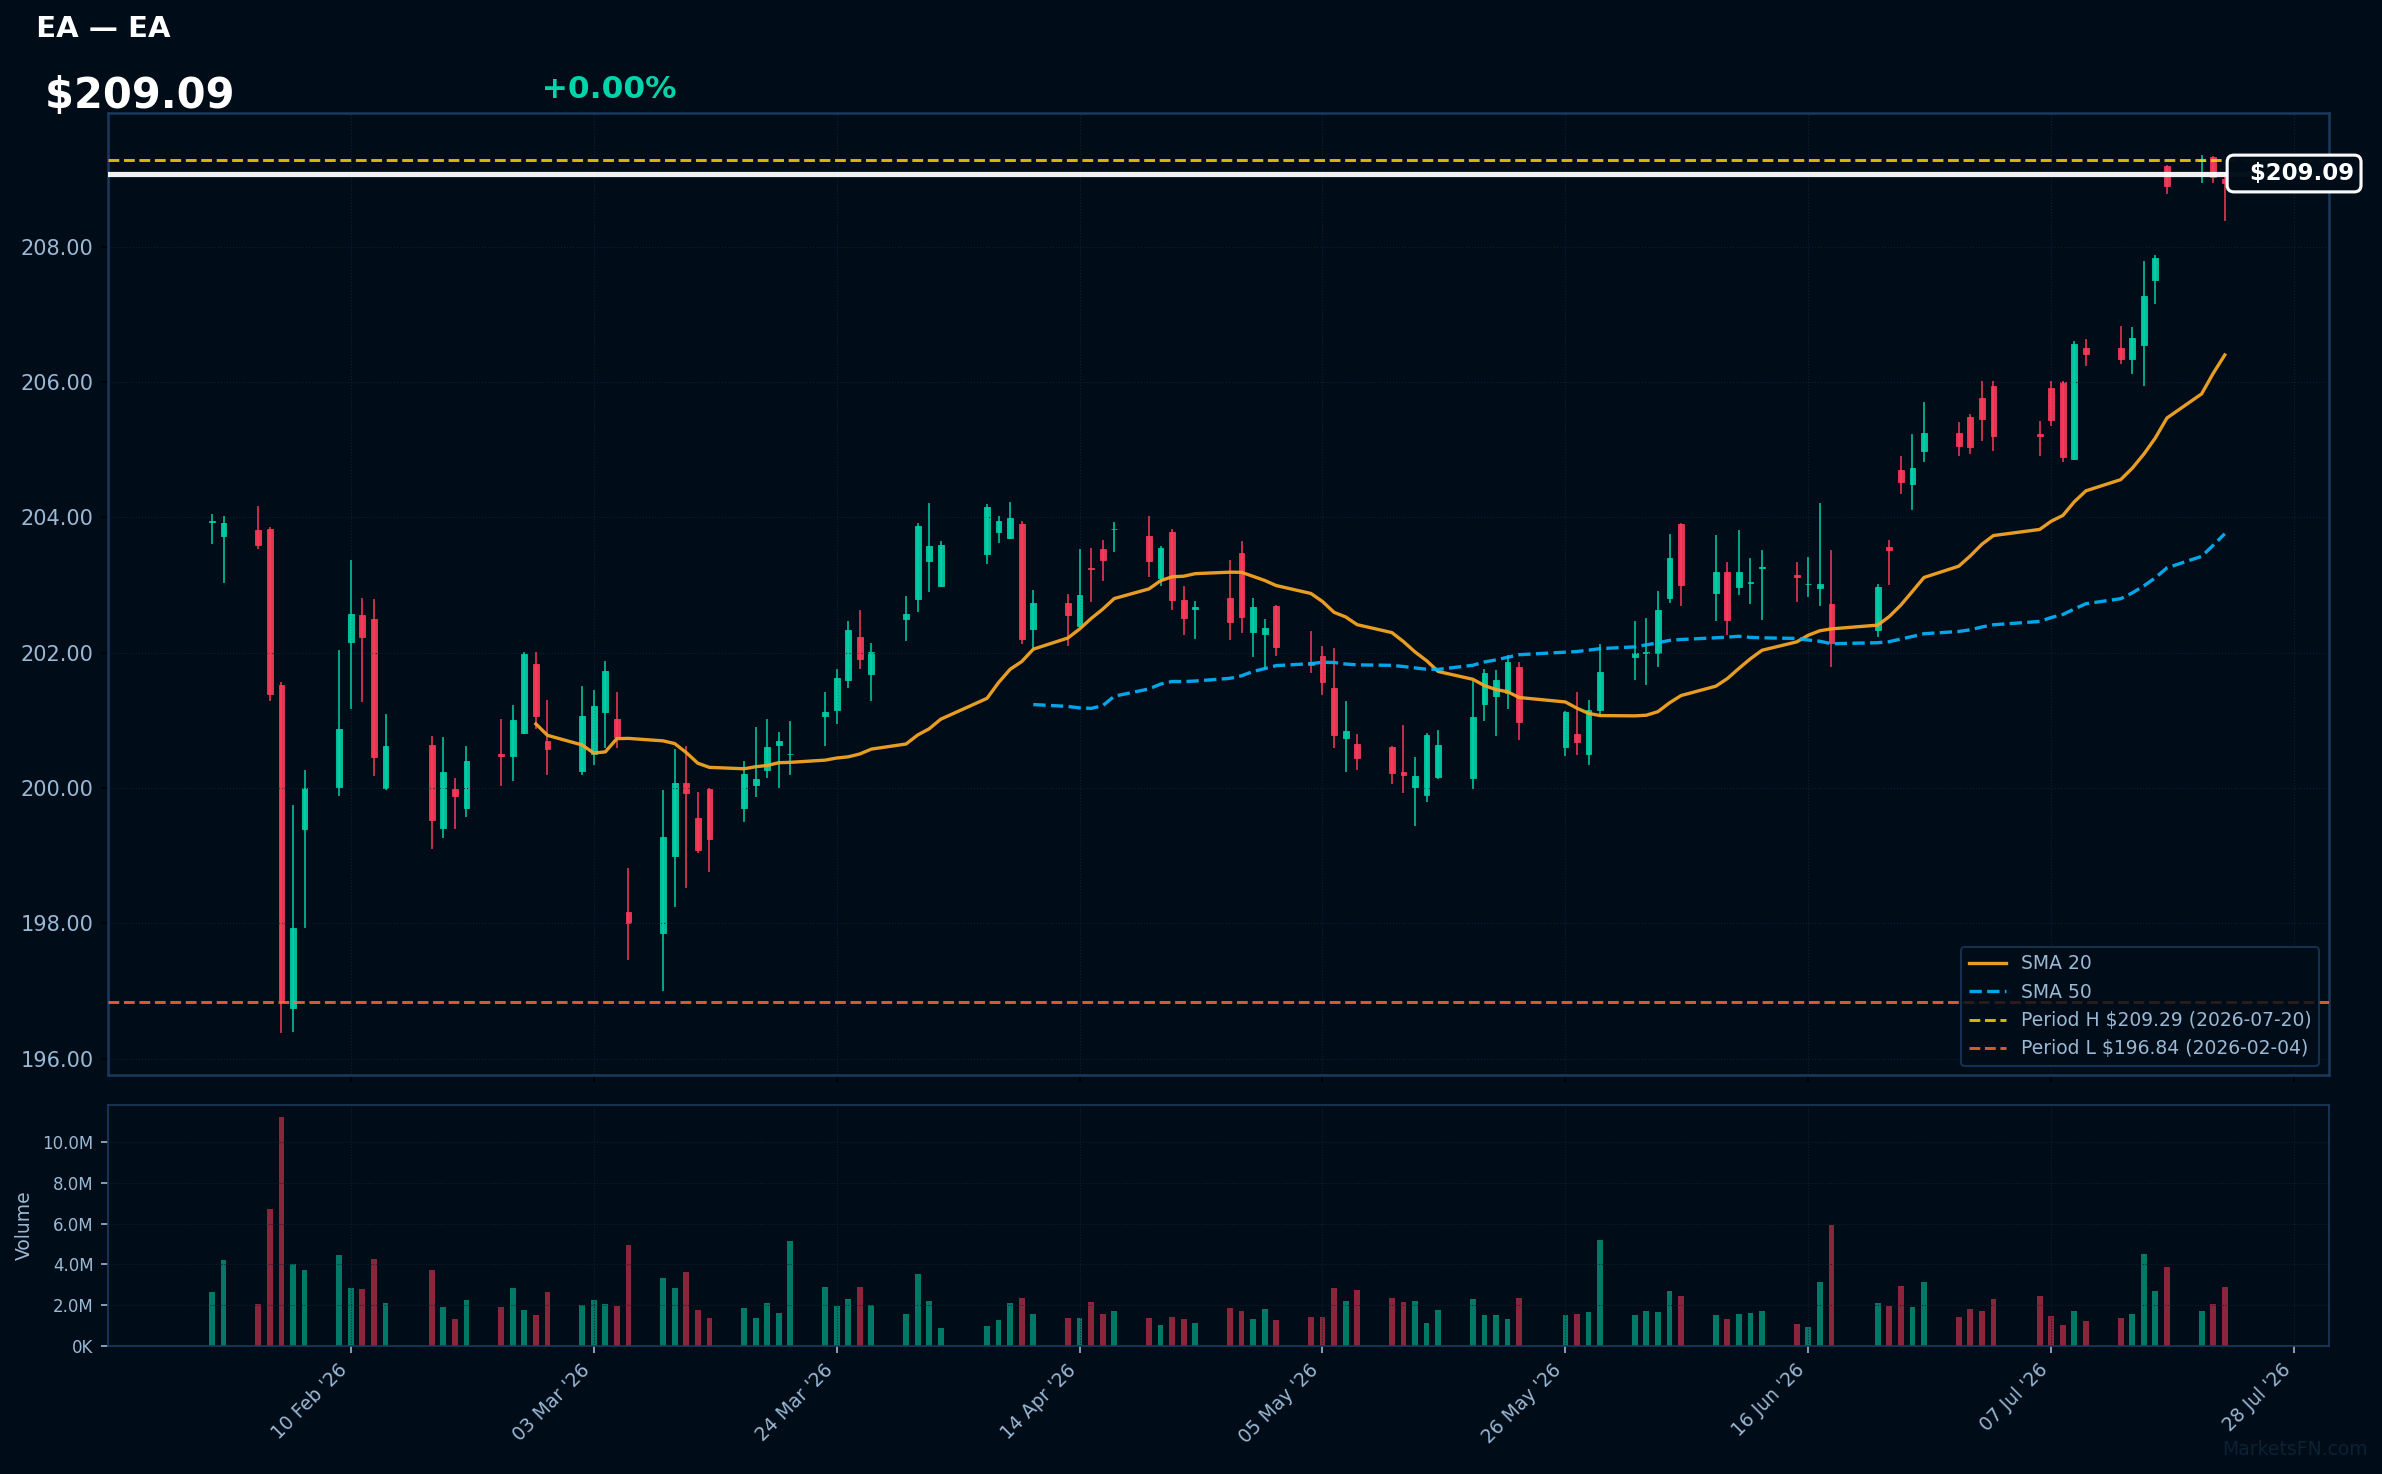
EA | Electronic Arts, Inc | Communication Services | Price Last: $208.95 | % Realized: +2.22% | RSI: 77.2 | % above MA200: +3.2% | Trend: Above MA20, MA50, MA200
Electronic Arts, Inc (EA) is a leading interactive entertainment software company that develops and publishes games such as FIFA, Madden NFL, and The Sims. Investors should care about its performance in the gaming market and its ability to innovate and release successful titles.
EA's current technical situation indicates strong momentum: RSI(14) is 77.2, and the stock is in a sustained uptrend with price > MA20 > MA50 > MA200. It's 0.2% below its 2026 YTD high, near a potential breakout level.
Related headlines
- Saudi PIF's $55 billion EA deal approved under EU merger rules
- Battlefield 6 and Top Gun Join Forces for Biggest Blockbuster Season Yet
- Exclusive-Saudi PIF set to win EU nod for Electronic Arts deal under subsidy rules, sources say
- Every Team Has an Edge: EA SPORTS NHL 27 Overhauls All 32 Arena Atmospheres and Presentation for Total Immersion
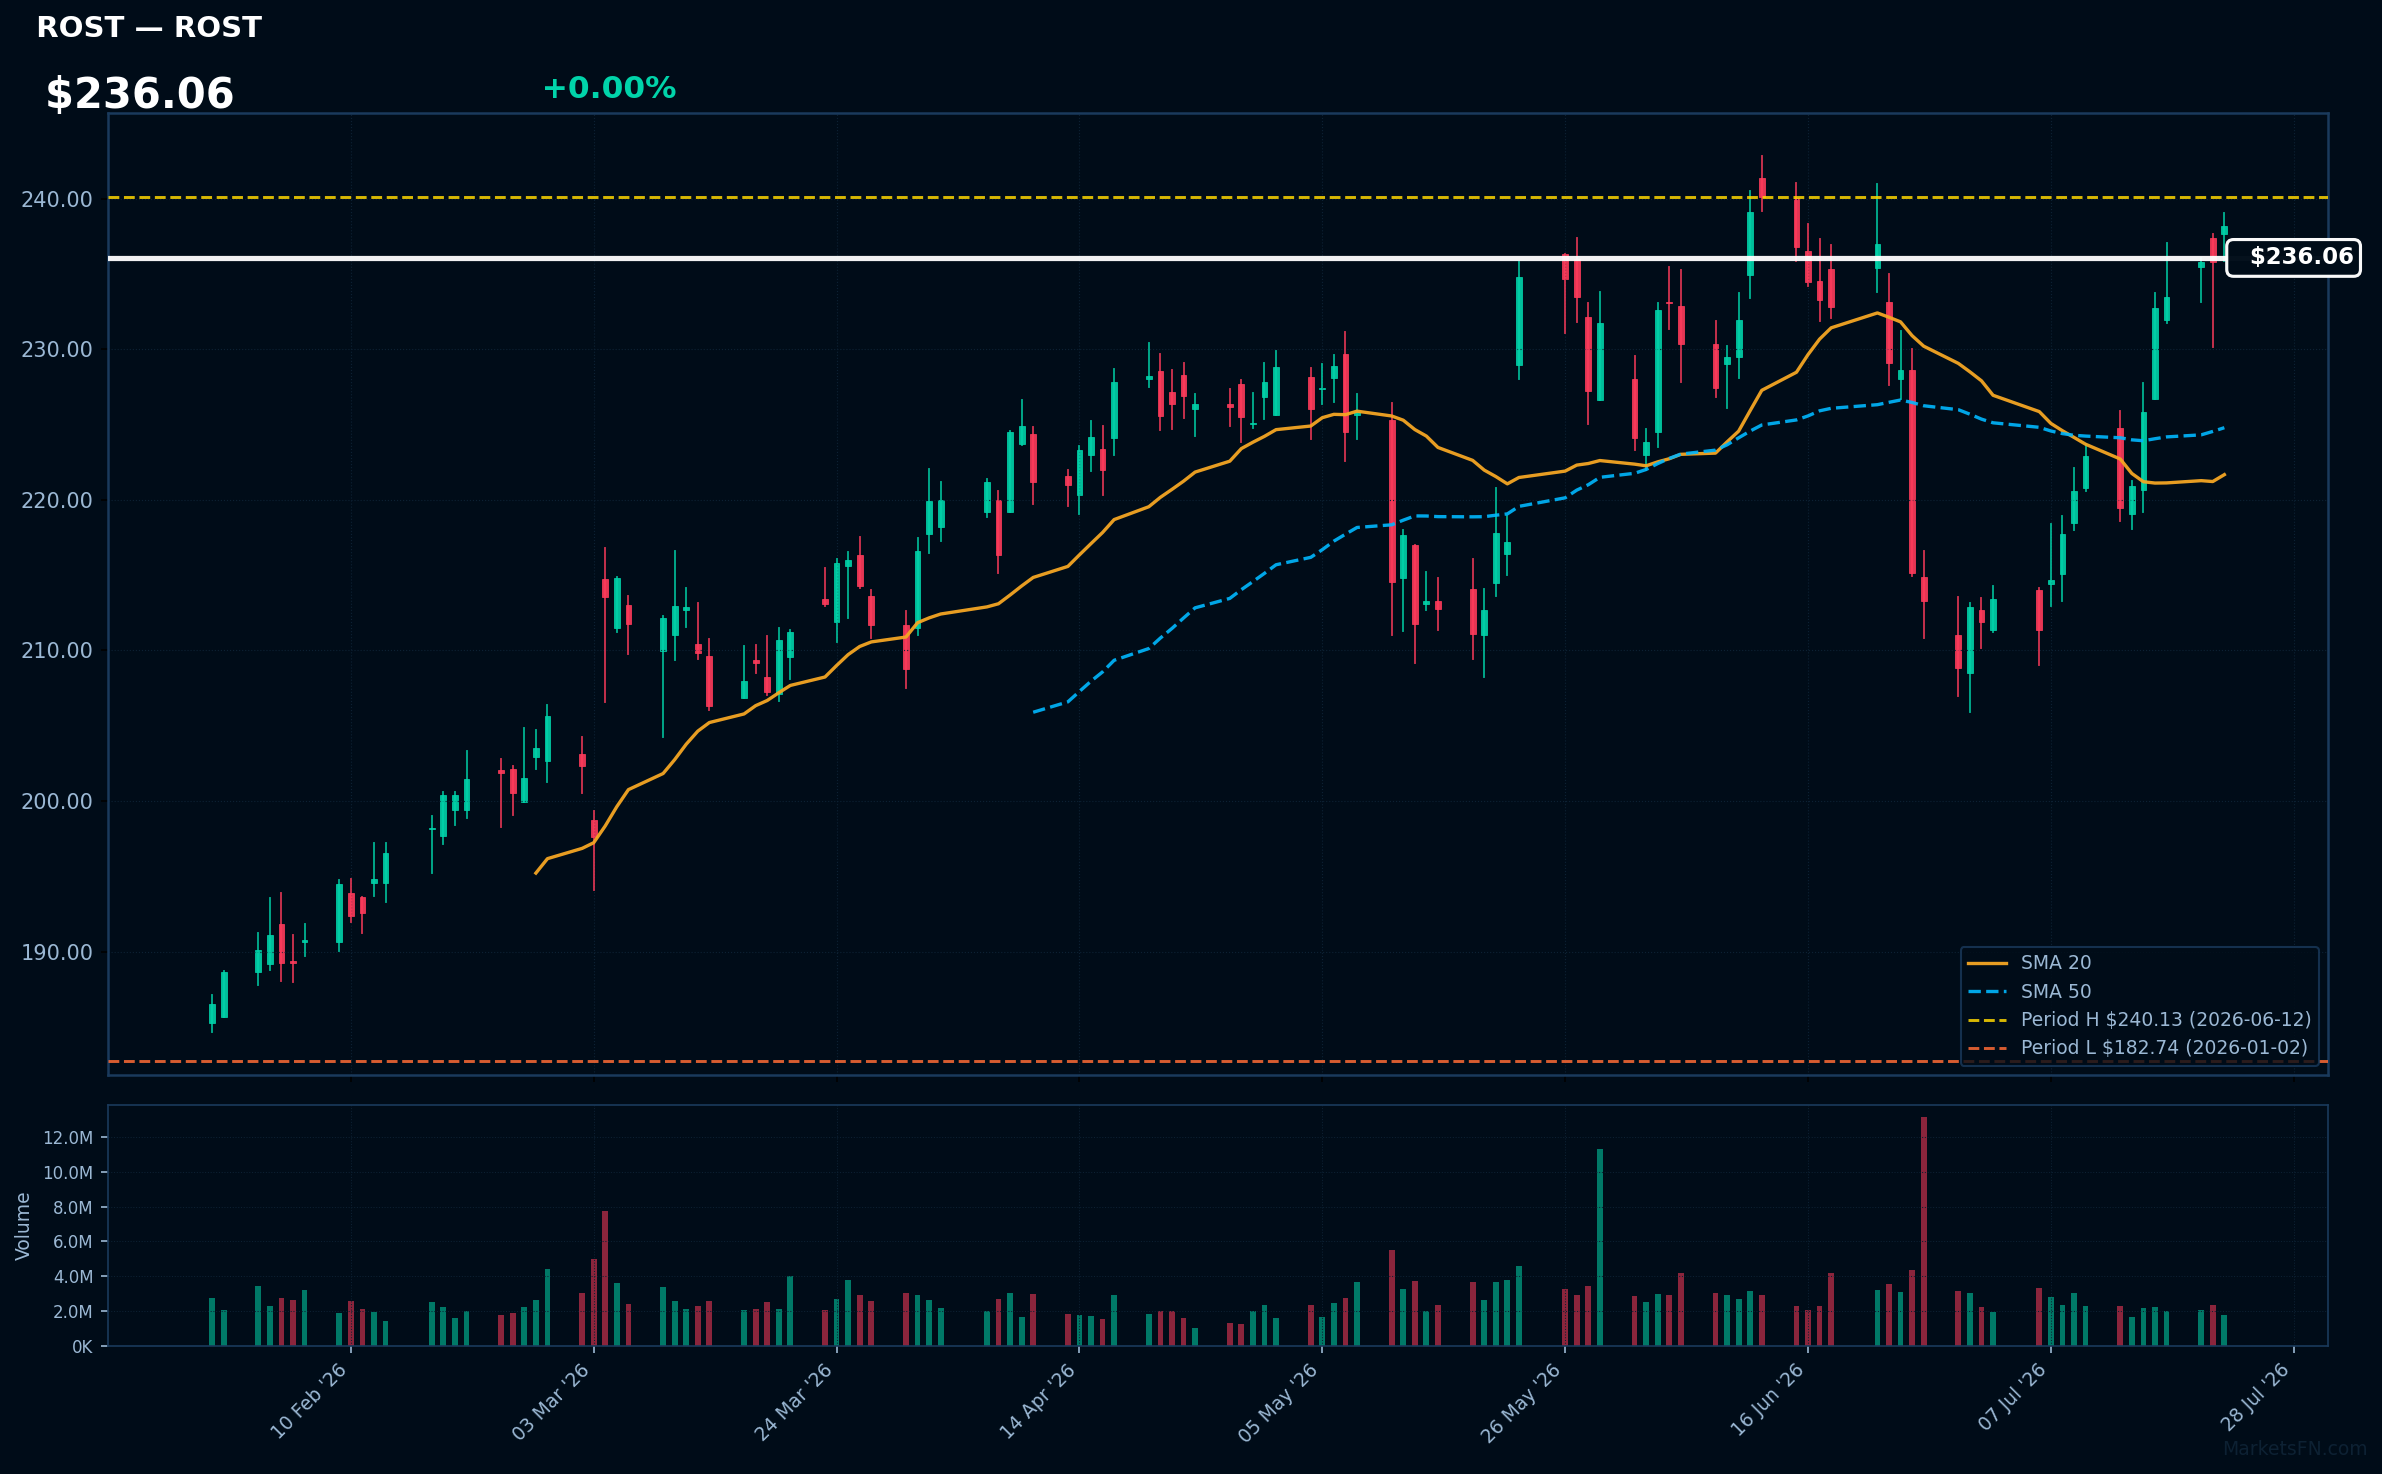
ROST | Ross Stores, Inc | Consumer Cyclical | Price Last: $238.21 | % Realized: +30.35% | RSI: 62.2 | % above MA200: +19.4% | Trend: Above MA20, MA50, MA200
Ross Stores, Inc operates as an off-price retailer offering discounted apparel, home furnishings, and accessories. Investors should care as the company's ability to maintain markdowns on brand-name merchandise drives sales growth and profitability.
Ross Stores, Inc is near a potential breakout, with its price 0.8% below the 2026 YTD high and RSI(14) at 62.2, indicating rising momentum. The stock is above MA20, MA50, and MA200, showing a bullish trend.
Related headlines
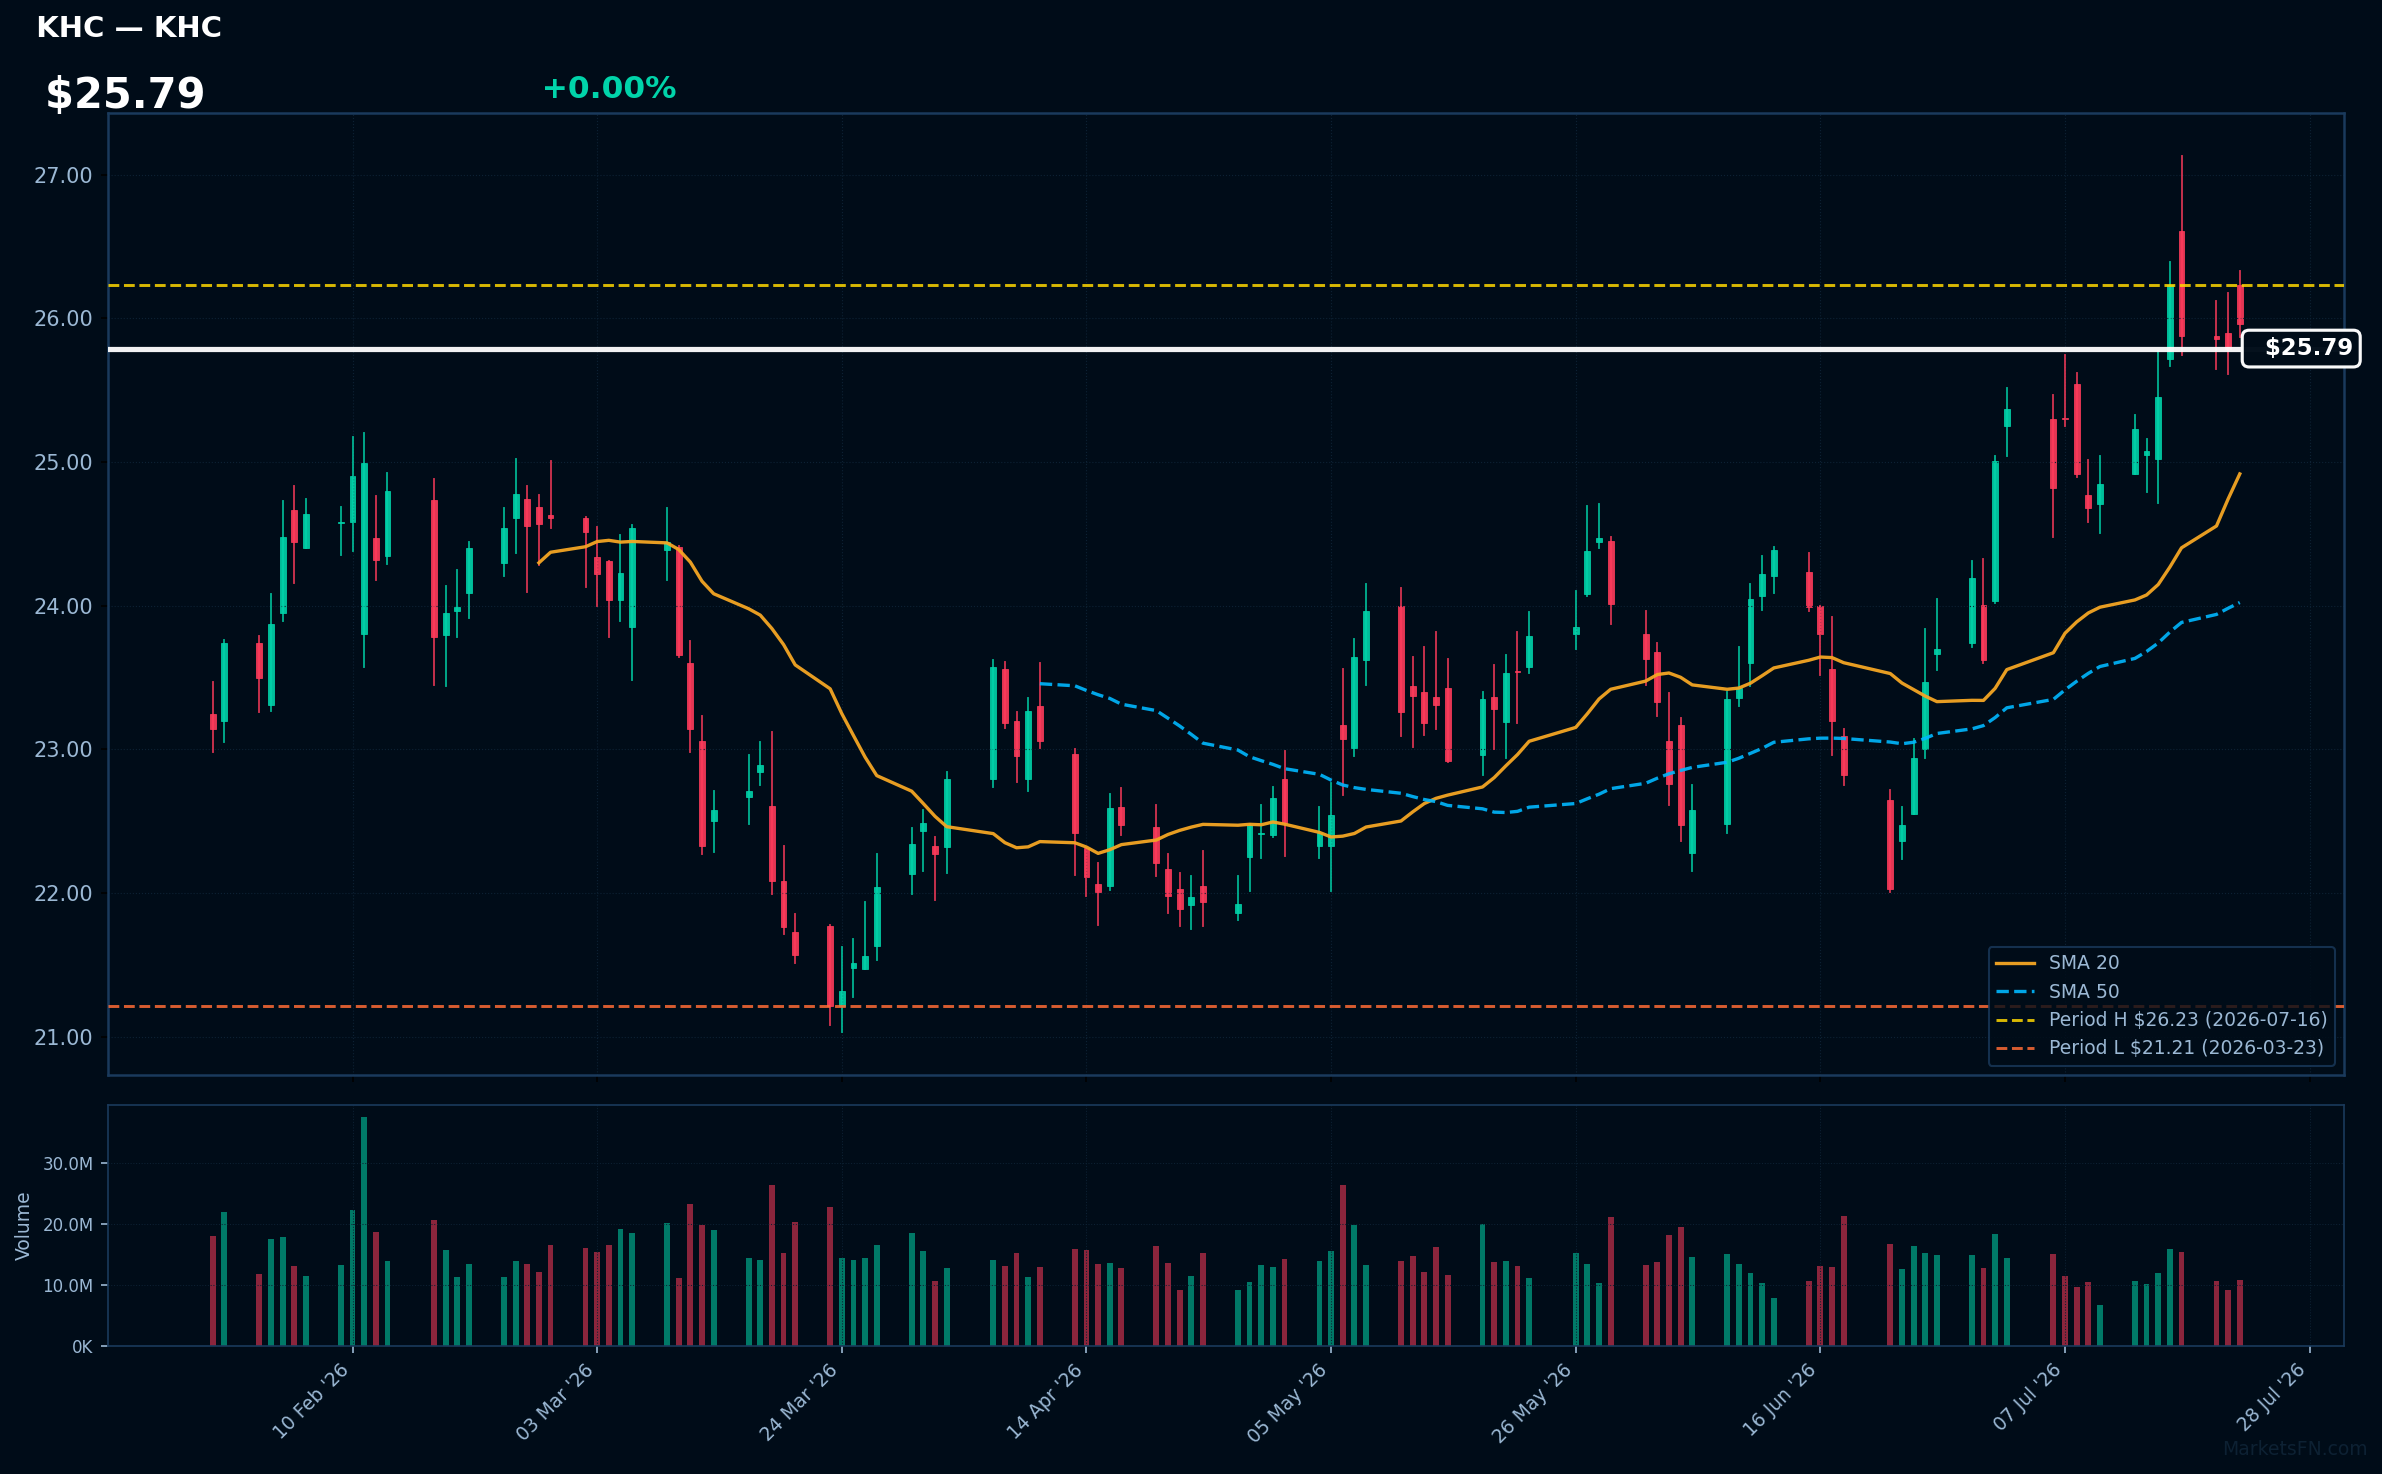
KHC | Kraft Heinz Co | Consumer Defensive | Price Last: $25.96 | % Realized: +6.44% | RSI: 60.5 | % above MA200: +8.5% | Trend: Above MA20, MA50, MA200
Kraft Heinz Co is a packaged food company with brands like Kraft and Heinz. Investors should care about its stable consumer staples business and potential for dividend income.
Kraft Heinz Co's RSI is 60.5, indicating moderate momentum. The MA alignment (price > MA20 > MA50 > MA200) suggests a sustained uptrend. The stock is 1.0% below its 2026 YTD high, nearing a potential breakout.
Related headlines
- Heres Why Big Food Companies, Like General Mills and Kraft Heinz, Are Losing Their Grip on Shoppers
- Disney partners with Kraft Heinz for theme parks, cruises, and media
- Kraft Heinz Bets on Disney to Revive Its Brands
- Disney, Kraft Heinz Stocks Slip After Companies Announce Multi-Year Strategic Alliance
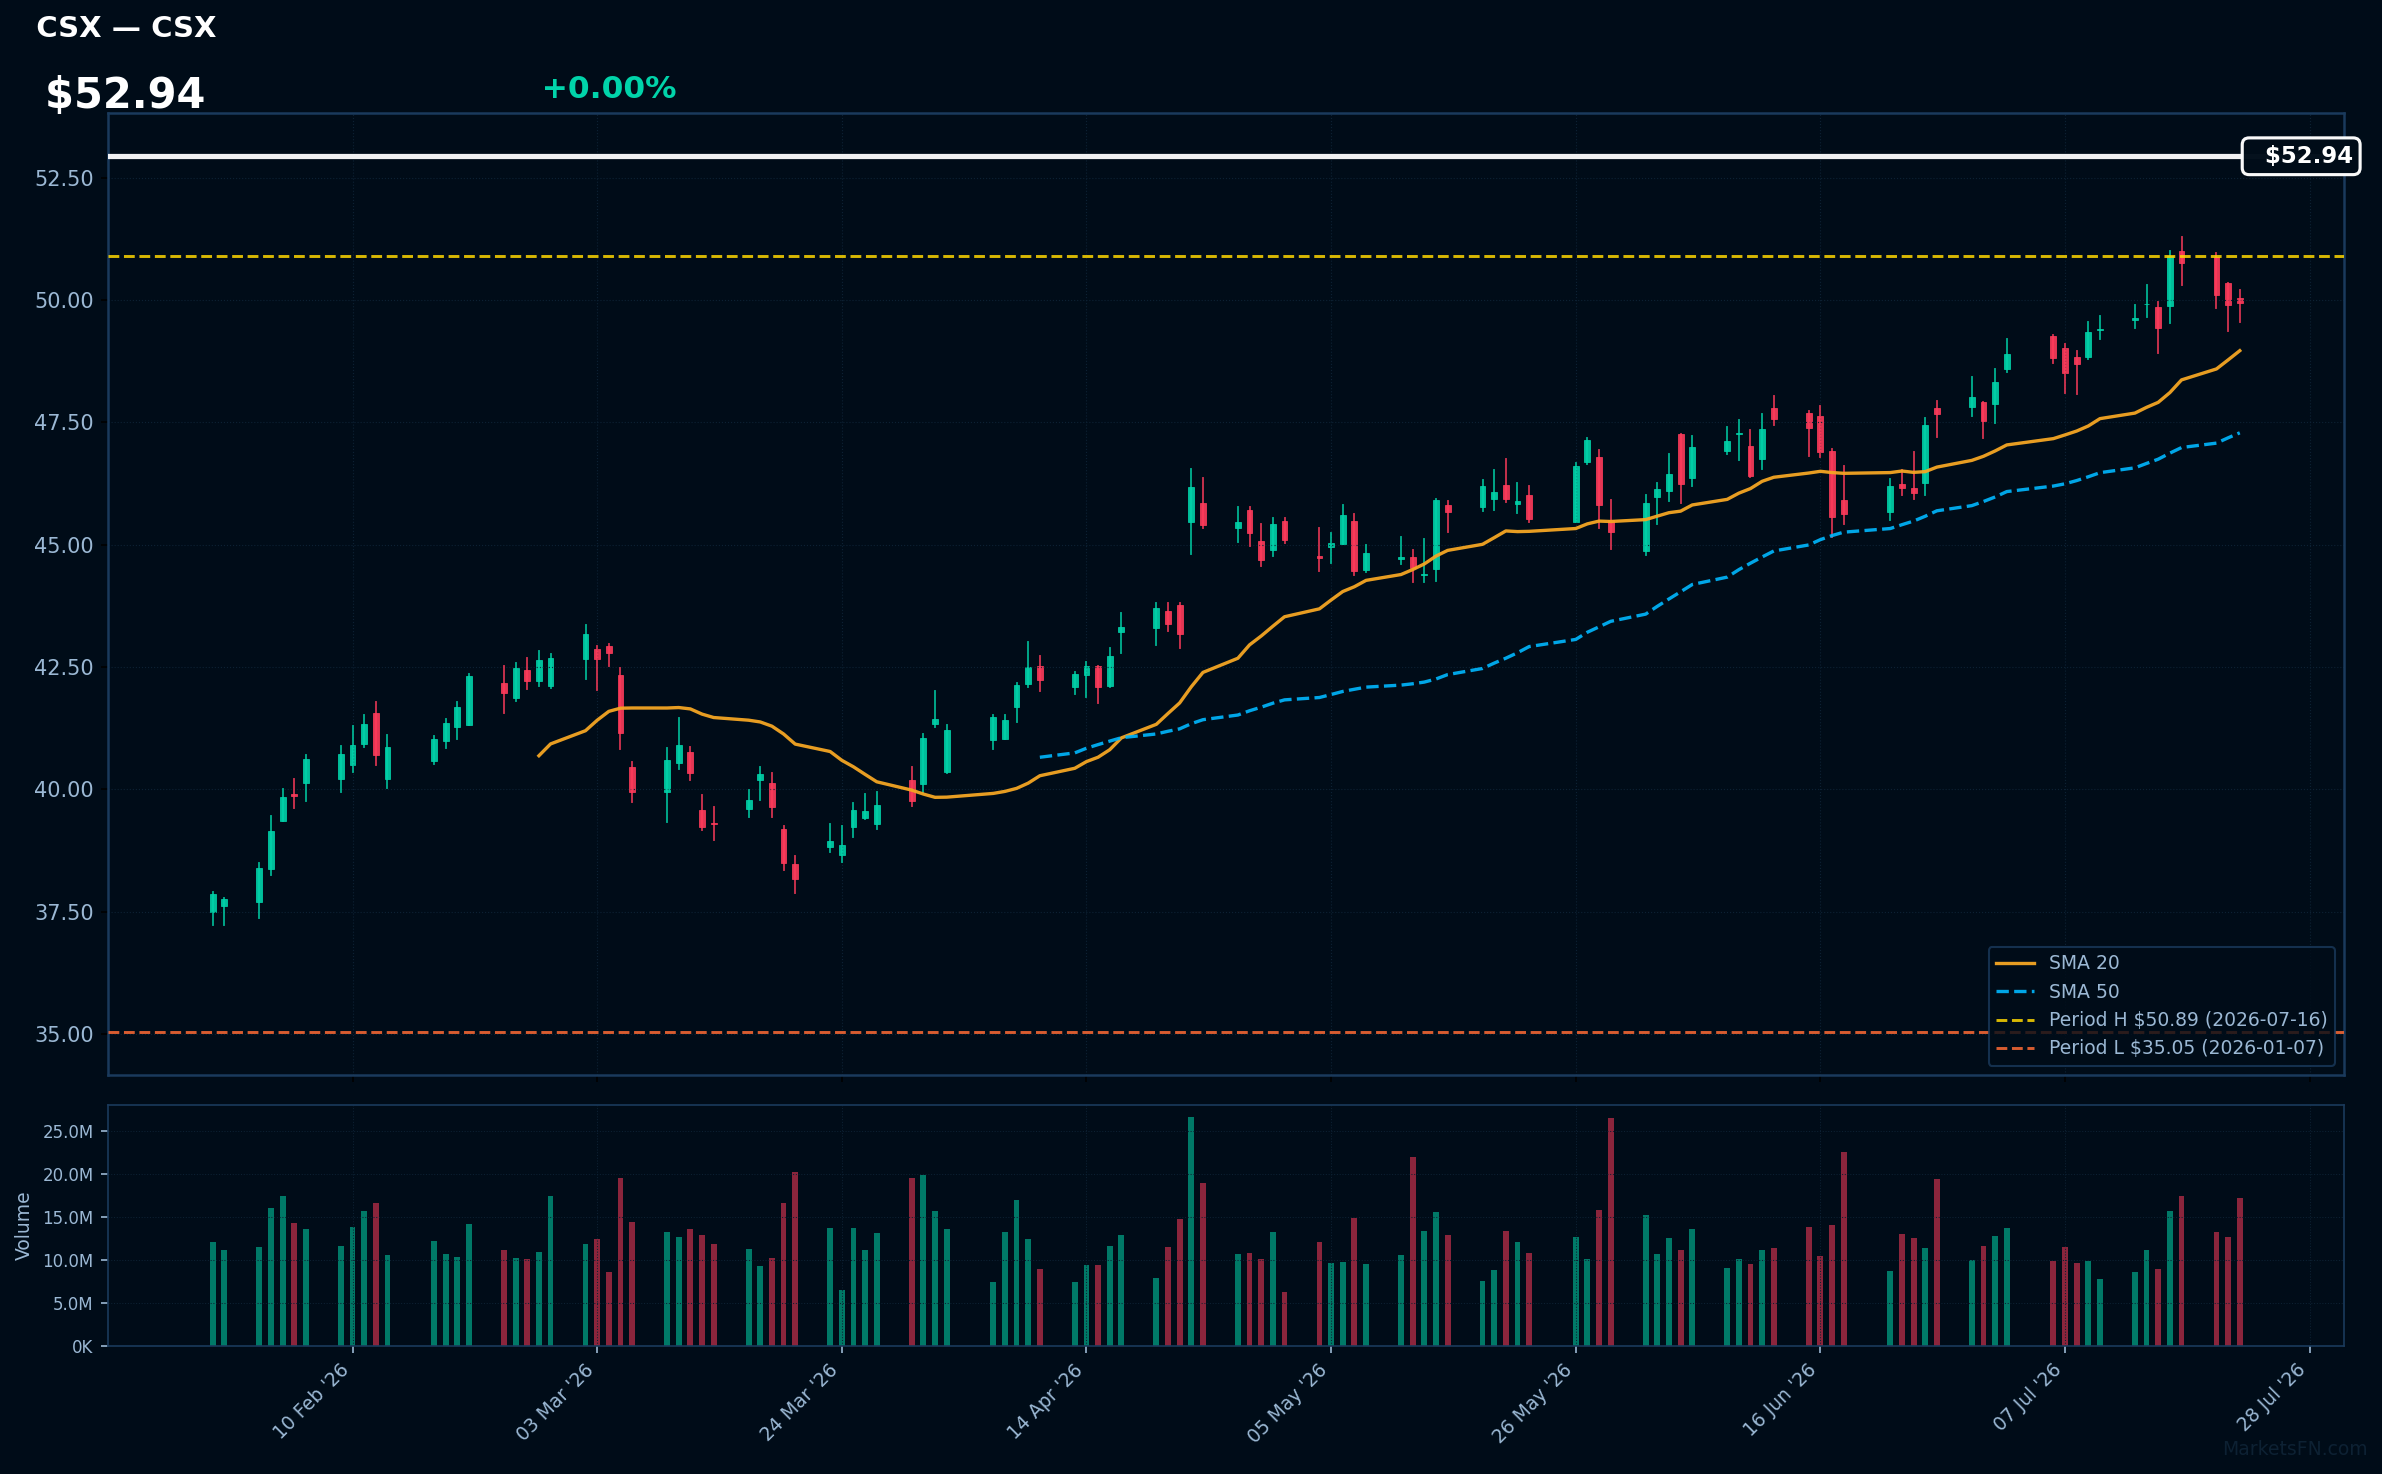
CSX | CSX Corp | Industrials | Price Last: $49.93 | % Realized: +37.66% | RSI: 75.1 | % above MA200: +22.2% | Trend: Above MA20, MA50, MA200
CSX Corp operates a rail network transporting coal, intermodal containers, and automotive goods, making it a key player in North American freight infrastructure; investors should care due to its critical role in the supply chain and potential for steady cash flows.
CSX Corp's technicals indicate strong momentum: RSI(14) is 75.1, and the stock is in a sustained uptrend with price > MA20 > MA50 > MA200; it's 1.9% below its 2026 YTD high, suggesting a potential breakout.
Related headlines
📉 Nearest to 2026 Low
Sectors represented: Healthcare (1), Technology (1), Industrials (1), Real Estate (1), Communication Services (1)
| Ticker | Company | Sector | Price Last | % Realized | 2026 YTD Low Date | RSI | % above MA200 | Trend |
|---|---|---|---|---|---|---|---|---|
| ISRG | Intuitive Surgical Inc | Healthcare | $340.69 | -39.38% | 2026-07-22 | 29.0 | -29.7% | Below MA20, MA50, MA200 |
| SNPS | Synopsys, Inc | Technology | $377.61 | -21.40% | 2026-07-22 | 26.4 | -16.5% | Below MA20, MA50, MA200 |
| CPRT | Copart, Inc | Industrials | $27.17 | -28.06% | 2026-07-21 | 34.9 | -25.2% | Below MA20, MA50, MA200 |
| CSGP | Costar Group, Inc | Real Estate | $27.69 | -57.85% | 2026-07-14 | 39.3 | -44.9% | Below MA20, MA50, MA200 |
| WBD | Warner Bros. Discovery Inc | Communication Services | $25.85 | -9.33% | 2026-07-21 | 38.8 | -1.5% | Below MA20, MA50, MA200 |
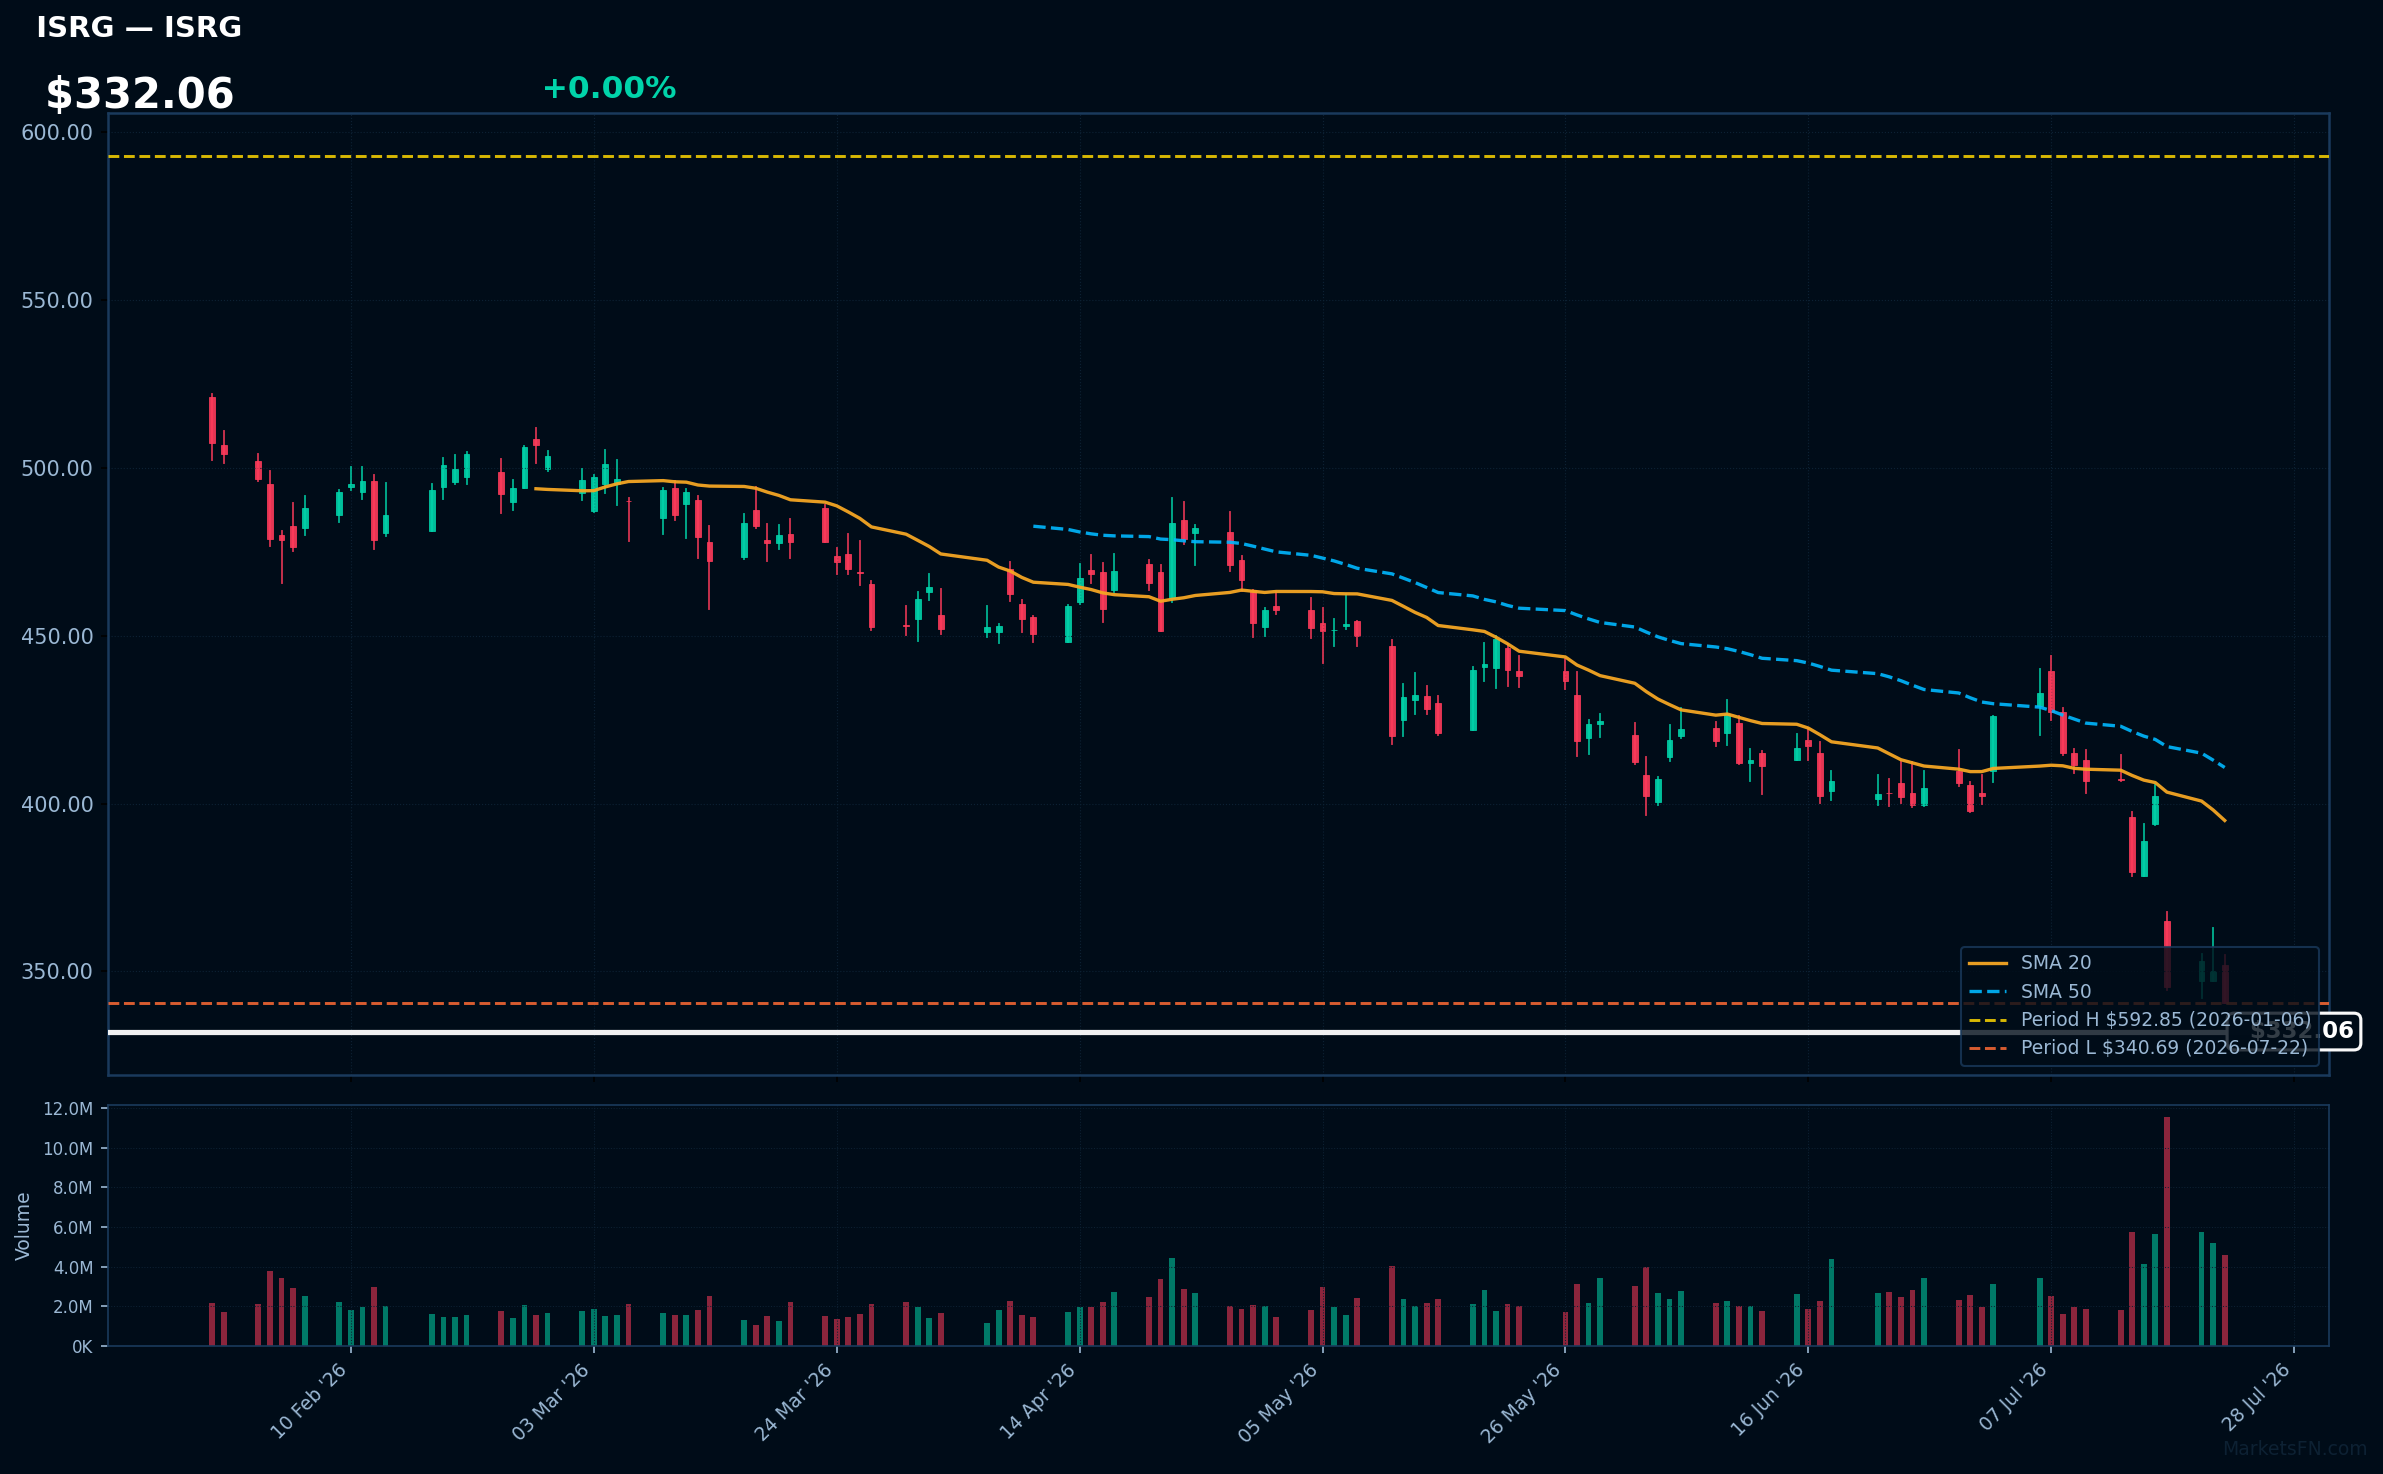
ISRG | Intuitive Surgical Inc | Healthcare | Price Last: $340.69 | % Realized: -39.38% | RSI: 29.0 | % above MA200: -29.7% | Trend: Below MA20, MA50, MA200
Intuitive Surgical Inc develops and markets robotic-assisted surgical systems, primarily the da Vinci Surgical System, enabling minimally invasive surgeries. Investors should care because its technology is revolutionizing surgical procedures, driving adoption and revenue growth in the healthcare sector.
ISRG's technical situation is bearish, with RSI(14) at 29.0 indicating oversold conditions, and a sustained downtrend as price ($332.06) remains below MA20, MA50, and MA200. The stock is testing major support at its 2026 YTD low, down 39.4% YTD.
Related headlines
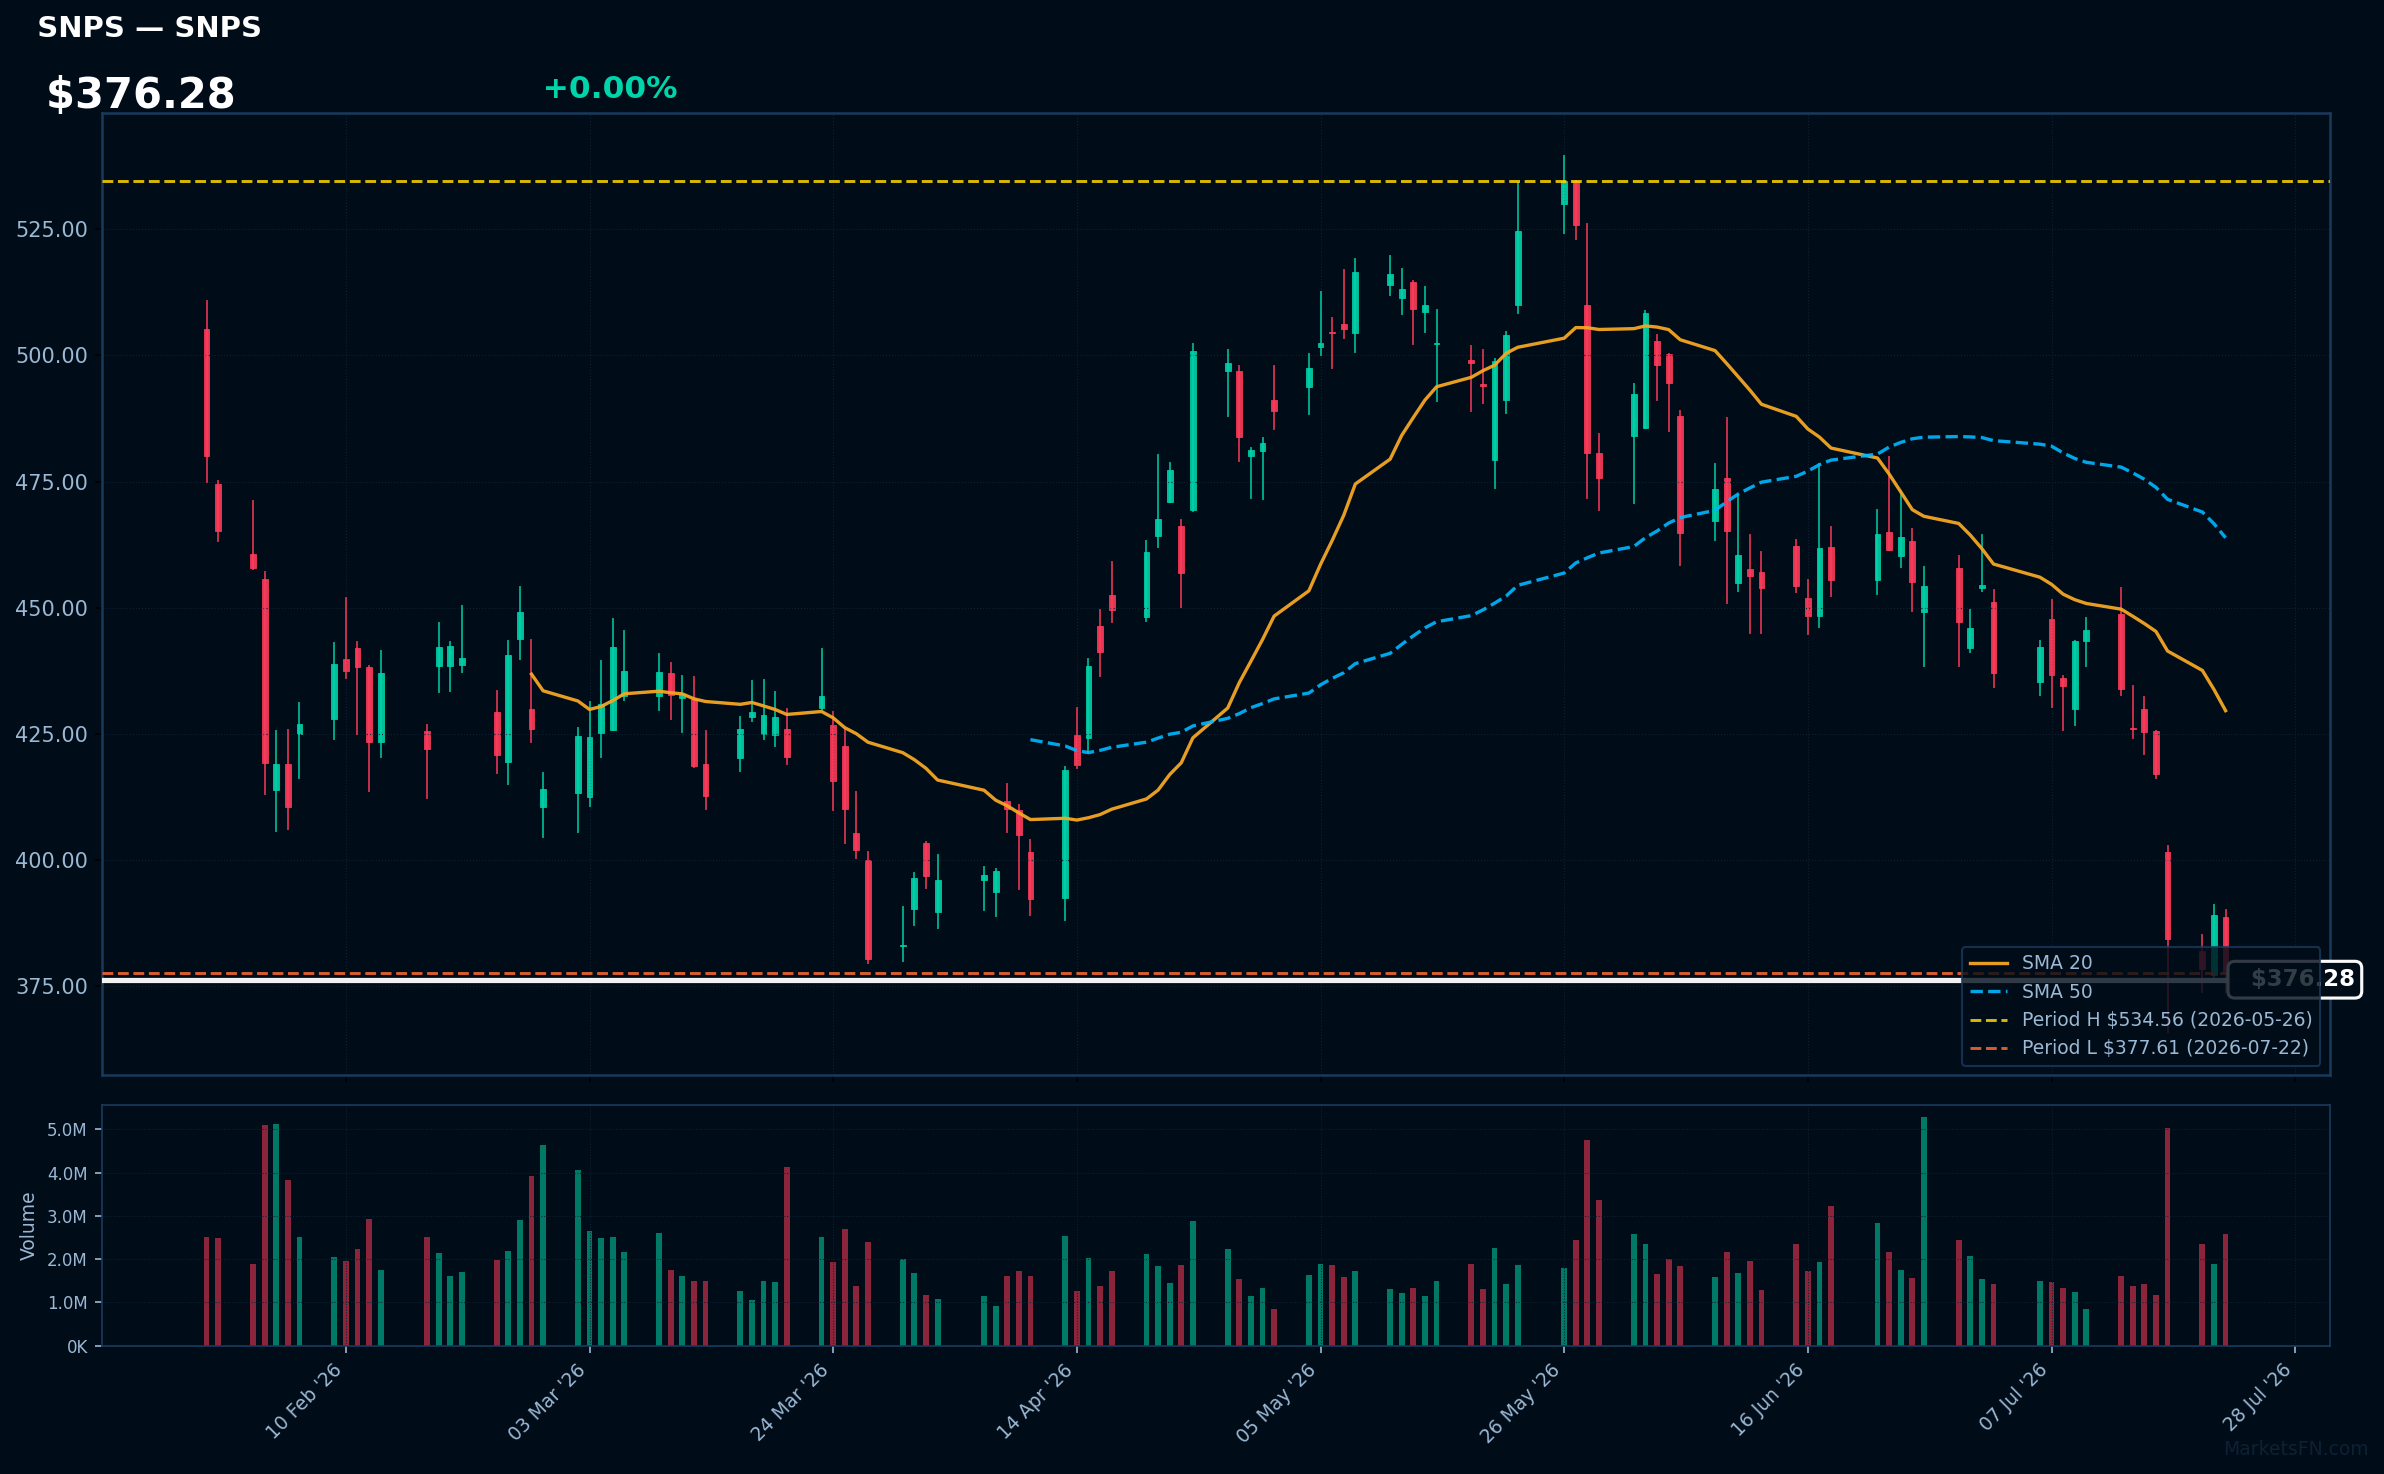
SNPS | Synopsys, Inc | Technology | Price Last: $377.61 | % Realized: -21.40% | RSI: 26.4 | % above MA200: -16.5% | Trend: Below MA20, MA50, MA200
Synopsys, Inc is a software company providing electronic design automation (EDA) tools and semiconductor IP, crucial for chip design and manufacturing. Investors care due to its dominant position in the growing semiconductor industry.
Synopsys is testing major support with its price 0.0% above 2026 YTD low. RSI(14) is 26.4, indicating oversold conditions. The stock is below MA20, MA50, and MA200, showing bearish trend alignment, potentially a warning sign.
Related headlines
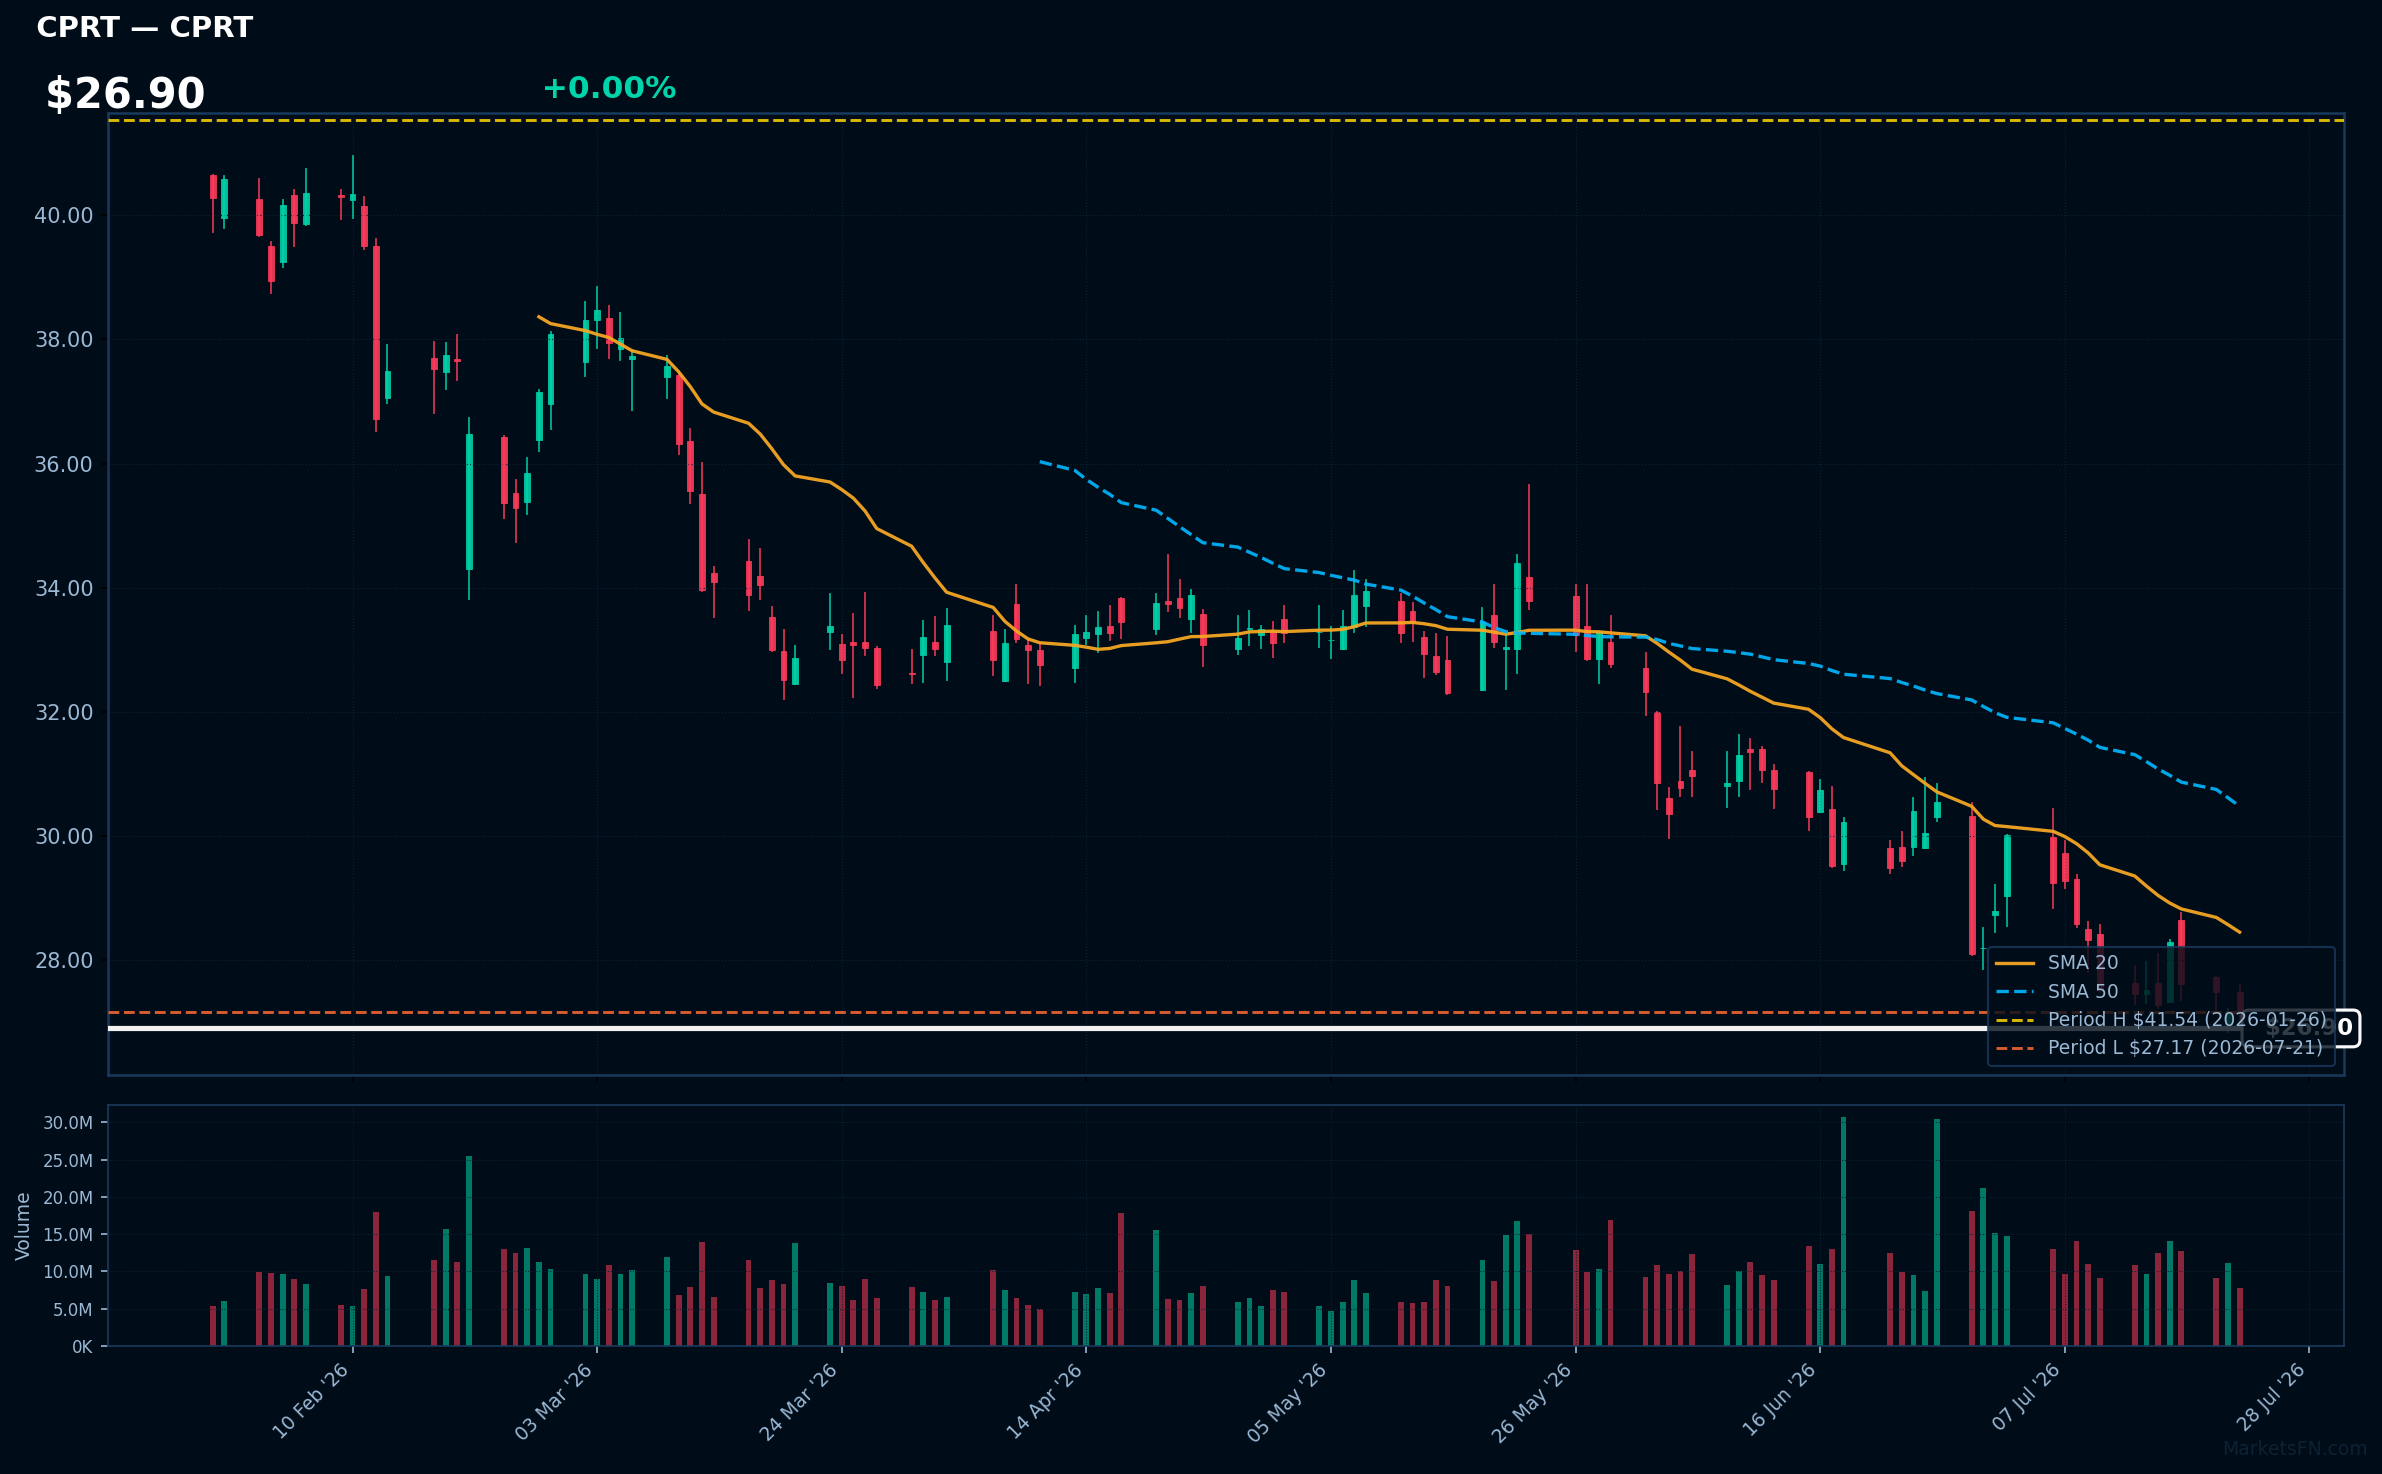
CPRT | Copart, Inc | Industrials | Price Last: $27.17 | % Realized: -28.06% | RSI: 34.9 | % above MA200: -25.2% | Trend: Below MA20, MA50, MA200
Copart, Inc operates an online vehicle auction and remarketing platform, connecting buyers and sellers of used vehicles. Investors should care because its market position and pricing power impact profitability.
Copart's technicals indicate a sustained downtrend with price at $26.90, below all MAs (MA20, MA50, MA200), and RSI(14) at 34.9, near oversold territory, testing major support at its 2026 YTD low.
Related headlines
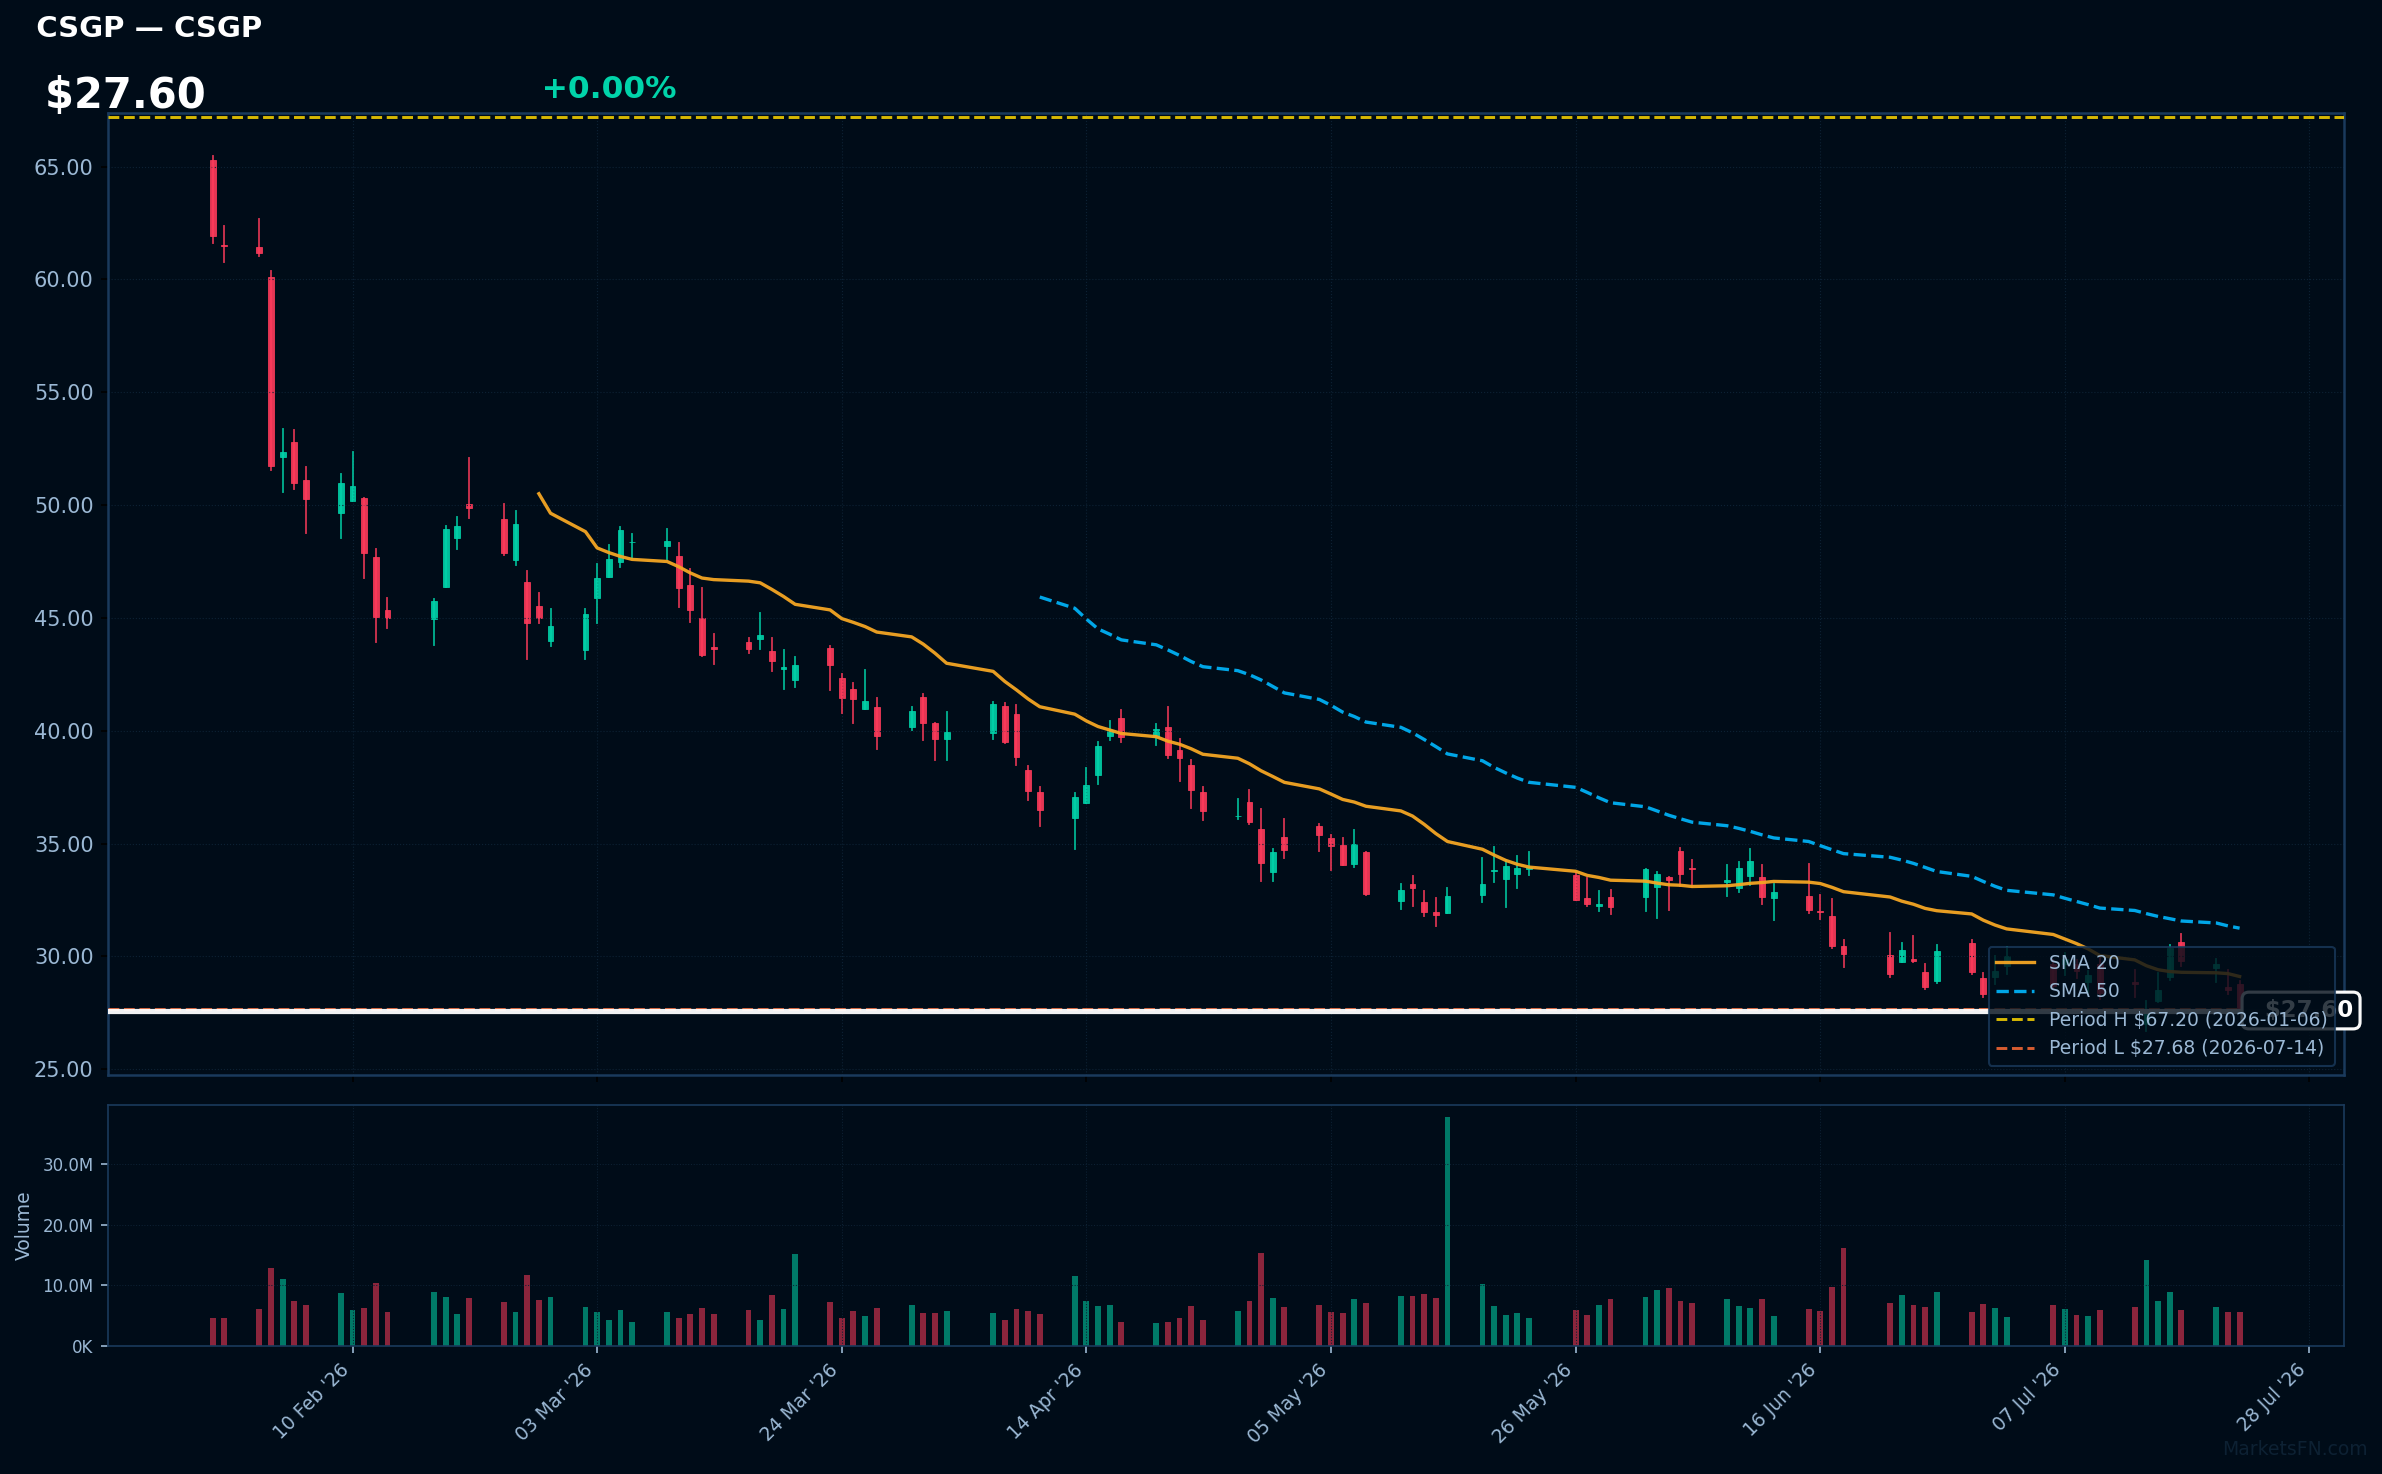
CSGP | Costar Group, Inc | Real Estate | Price Last: $27.69 | % Realized: -57.85% | RSI: 39.3 | % above MA200: -44.9% | Trend: Below MA20, MA50, MA200
Costar Group, Inc provides commercial real estate information, analytics, and marketplace services, enabling clients to make informed decisions; investors should care as it dominates the commercial real estate data space.
The stock's RSI(14) is 39.3, indicating bearish momentum, with a sustained downtrend as price ($27.60) remains below MA20, MA50, and MA200, and is 0.0% above its 2026 YTD low, testing major support.
Related headlines
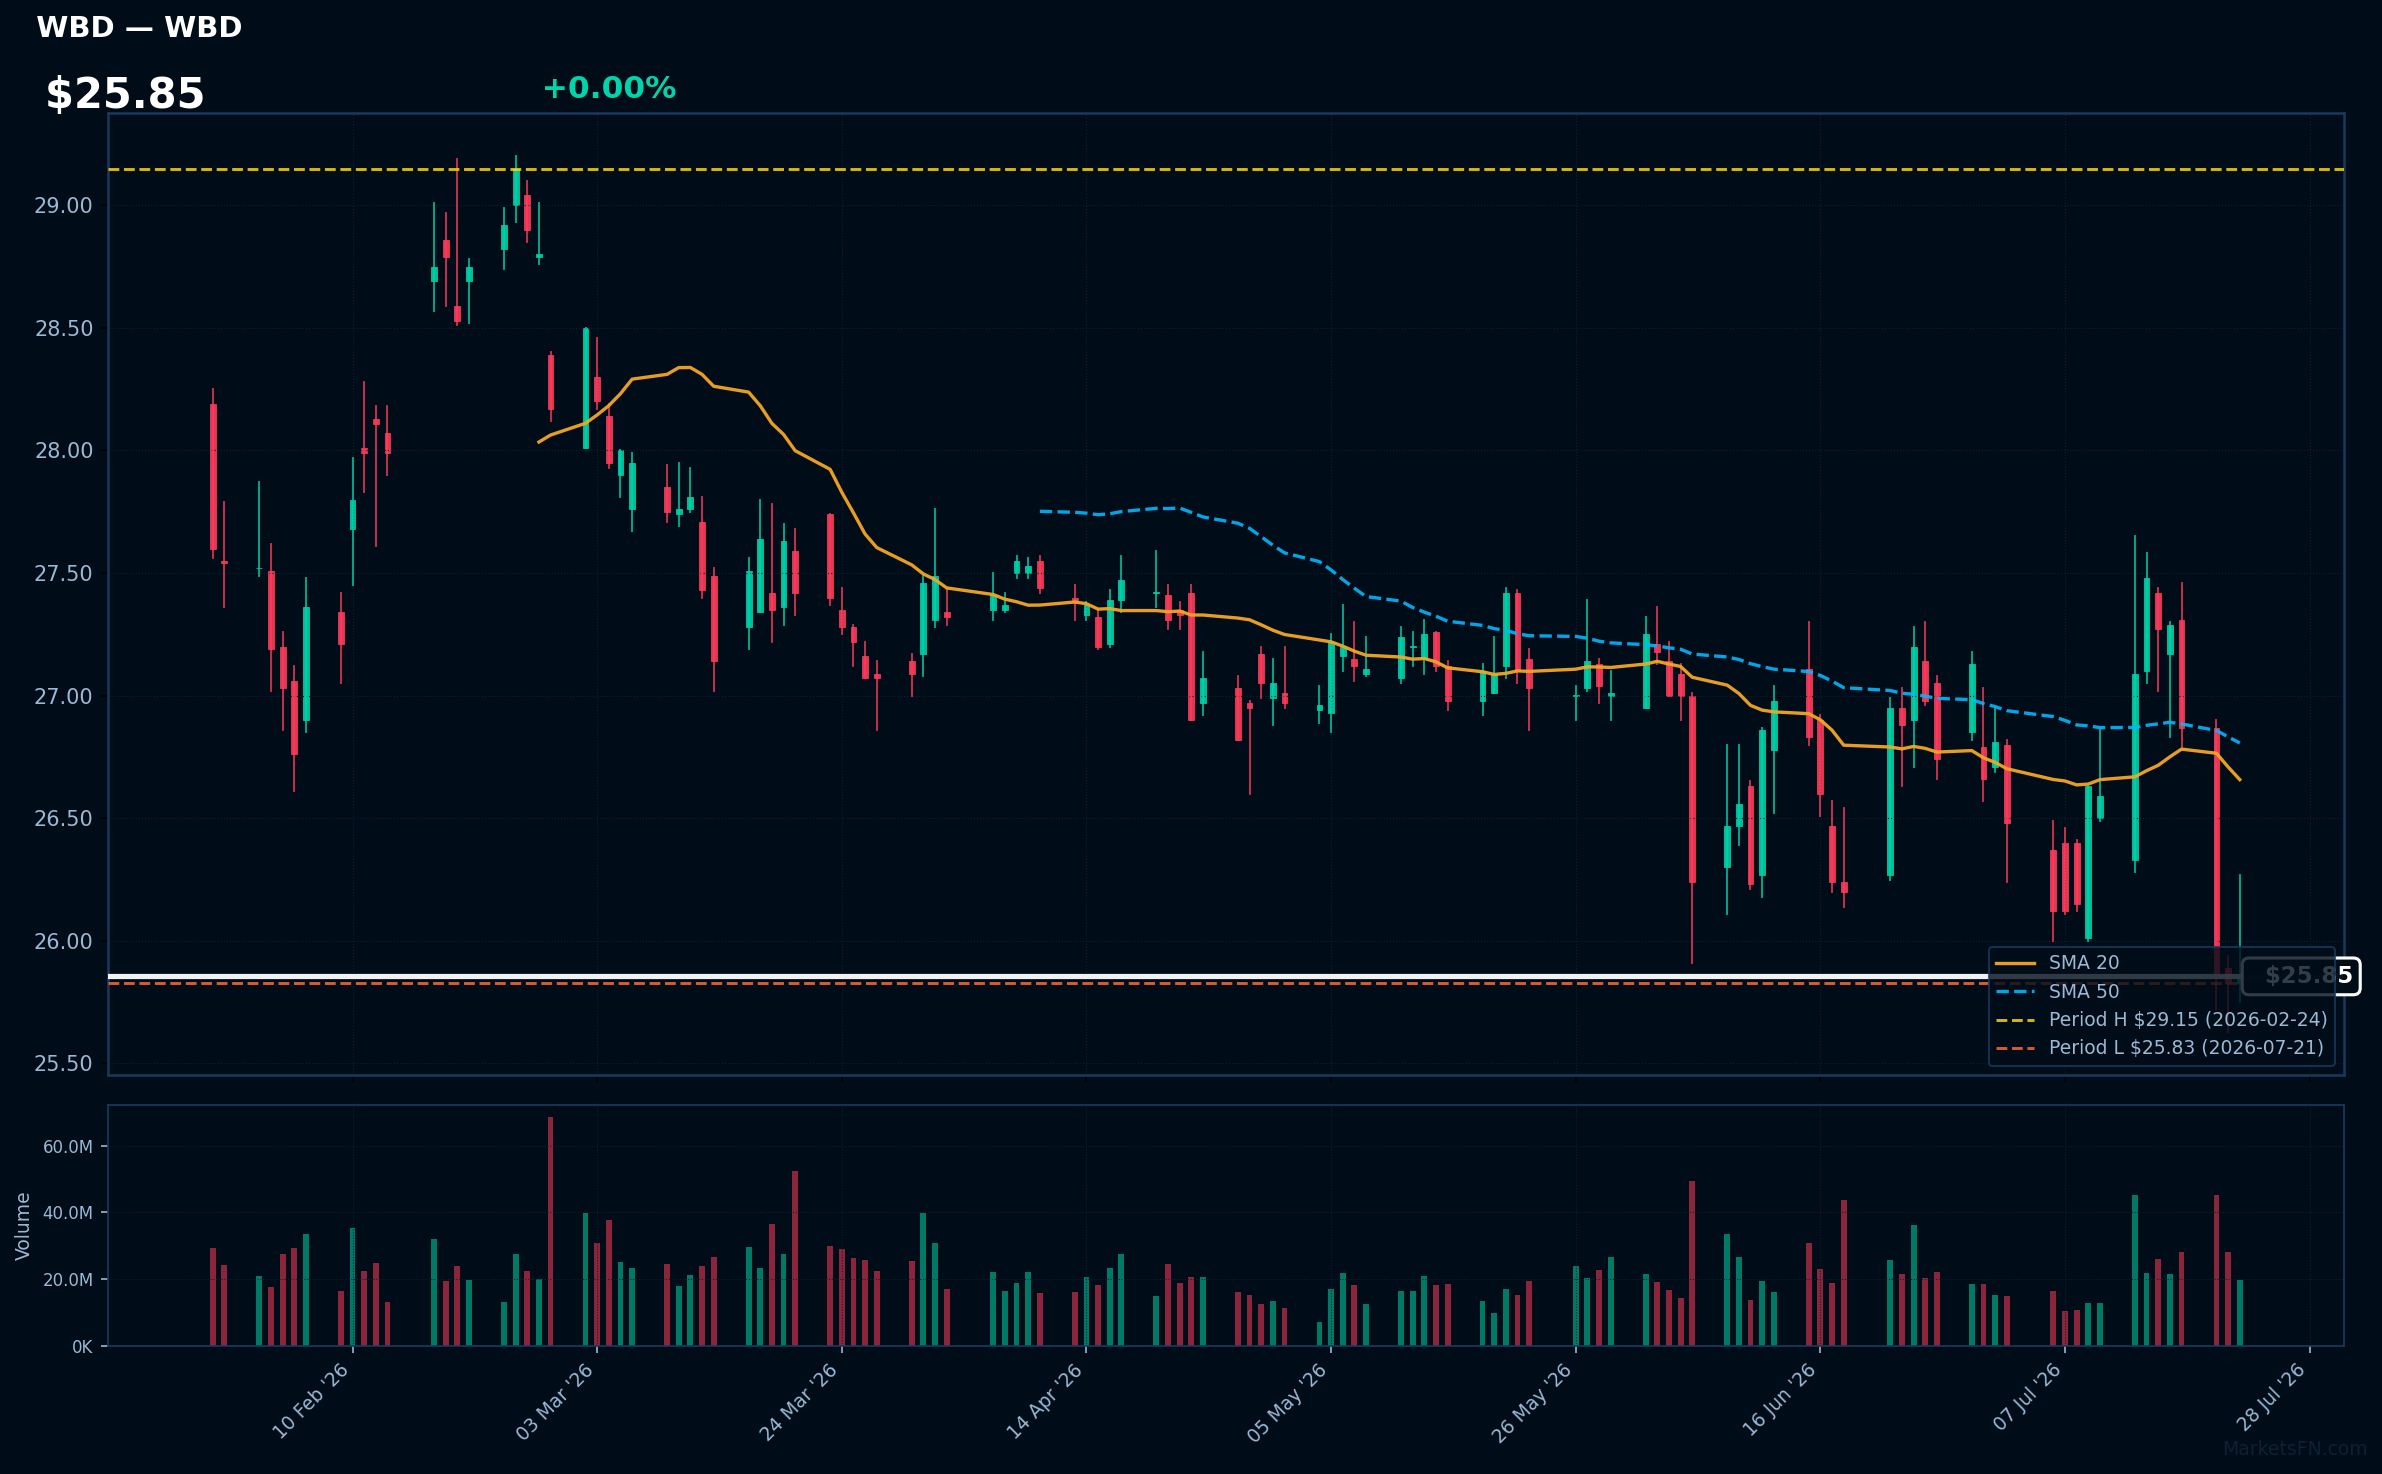
WBD | Warner Bros. Discovery Inc | Communication Services | Price Last: $25.85 | % Realized: -9.33% | RSI: 38.8 | % above MA200: -1.5% | Trend: Below MA20, MA50, MA200
Warner Bros. Discovery Inc is a media conglomerate with significant holdings in film, television, and streaming through brands like HBO, Warner Bros., and Discovery. Investors should care due to its influence on entertainment content and potential for streaming growth.
The stock is testing major support at its 2026 YTD low, with an RSI(14) of 38.8 indicating oversold conditions. It's below MA20, MA50, and MA200, showing mixed signals; the 2026 YTD return is -9.3%, currently priced at $25.85, just 0.1% above its YTD low.
Related headlines
- EUROPEAN COMMISSION APPROVES PARAMOUNT SKYDANCE CORPORATION ACQUISITION OF WARNER BROS. DISCOVERY MARKING MAJOR MILESTONE TOWARDS COMPLETION
- Paramount gets EU approval for Warner Bros takeover despite US suit
- EU OKs Paramount-Warner Bros. Deal With Concessions
- Paramount Wins EU Approval for $81 Billion Warner Bros. Deal
Market Commentary
The provided data indicates that certain Nasdaq 100 stocks are near their 2026 year-to-date (YTD) extremes. Stocks like PCAR and EA are close to their 2026 highs, while ISRG and SNPS are near their 2026 lows. This suggests that these stocks have either reached a peak or trough so far this year.
The technology sector themes and macro conditions driving these moves are not explicitly stated, but the data highlights the performance of specific stocks within the Nasdaq 100. Stocks such as ISRG, SNPS, and CPRT are at their 2026 lows, potentially indicating a challenging period for these companies or their respective sectors. Conversely, stocks like PCAR and EA are near their 2026 highs, suggesting positive performance.
Investors and traders should watch the performance of these stocks relative to their 2026 extremes, as a breakout or reversal could signal a change in market sentiment or sector trends. Monitoring the proximity of these stocks to their YTD highs and lows may provide insight into potential future movements and help inform investment decisions.
Methodology: All 101 Nasdaq 100 constituents screened. Close prices downloaded from 2026-01-01. Period high = highest close since Jan 1 2026; period low = lowest close since Jan 1 2026. Distance = (current price / period extreme − 1) × 100. Technical indicators computed on up to 1 year of daily OHLCV data.
Disclaimer: For informational purposes only. Not investment advice. Past performance is not indicative of future results.

