Nasdaq 100 2026 YTD Highs & Lows Radar: Palo Alto Networks (PANW), T-Mobile US (TMUS) and more
· Stocks · MarketsFN Team
Nasdaq 100 2026 YTD Highs & Lows Radar: Palo Alto Networks (PANW), T-Mobile US (TMUS) and more
Screening all 101 Nasdaq 100 constituents for stocks nearest to their 2026 year-to-date high and their 2026 YTD low. Data as of June 30, 2026. % Realized = total return since Jan 1 2026.
Legend: RSI > 70 = overbought · RSI < 30 = oversold · Green % Realized = positive YTD return · Red = negative.
📈 Nearest to 2026 High
Sectors represented: Technology (4), Healthcare (1)
| Ticker | Company | Sector | Price Last | % Realized | 2026 YTD High Date | RSI | % above MA200 | Trend |
|---|---|---|---|---|---|---|---|---|
| PANW | Palo Alto Networks Inc | Technology | $332.00 | +85.09% | 2026-06-29 | 79.1 | +66.0% | Above MA20, MA50, MA200 |
| AMAT | Applied Materials Inc | Technology | $694.64 | +158.36% | 2026-06-29 | 71.8 | +107.5% | Above MA20, MA50, MA200 |
| LRCX | Lam Research Corp | Technology | $410.91 | +122.04% | 2026-06-29 | 66.5 | +86.5% | Above MA20, MA50, MA200 |
| KLAC | KLA Corp | Technology | $278.39 | +118.44% | 2026-06-29 | 69.0 | +85.1% | Above MA20, MA50, MA200 |
| VRTX | Vertex Pharmaceuticals, Inc | Healthcare | $499.65 | +10.51% | 2026-06-29 | 74.3 | +12.9% | Above MA20, MA50, MA200 |
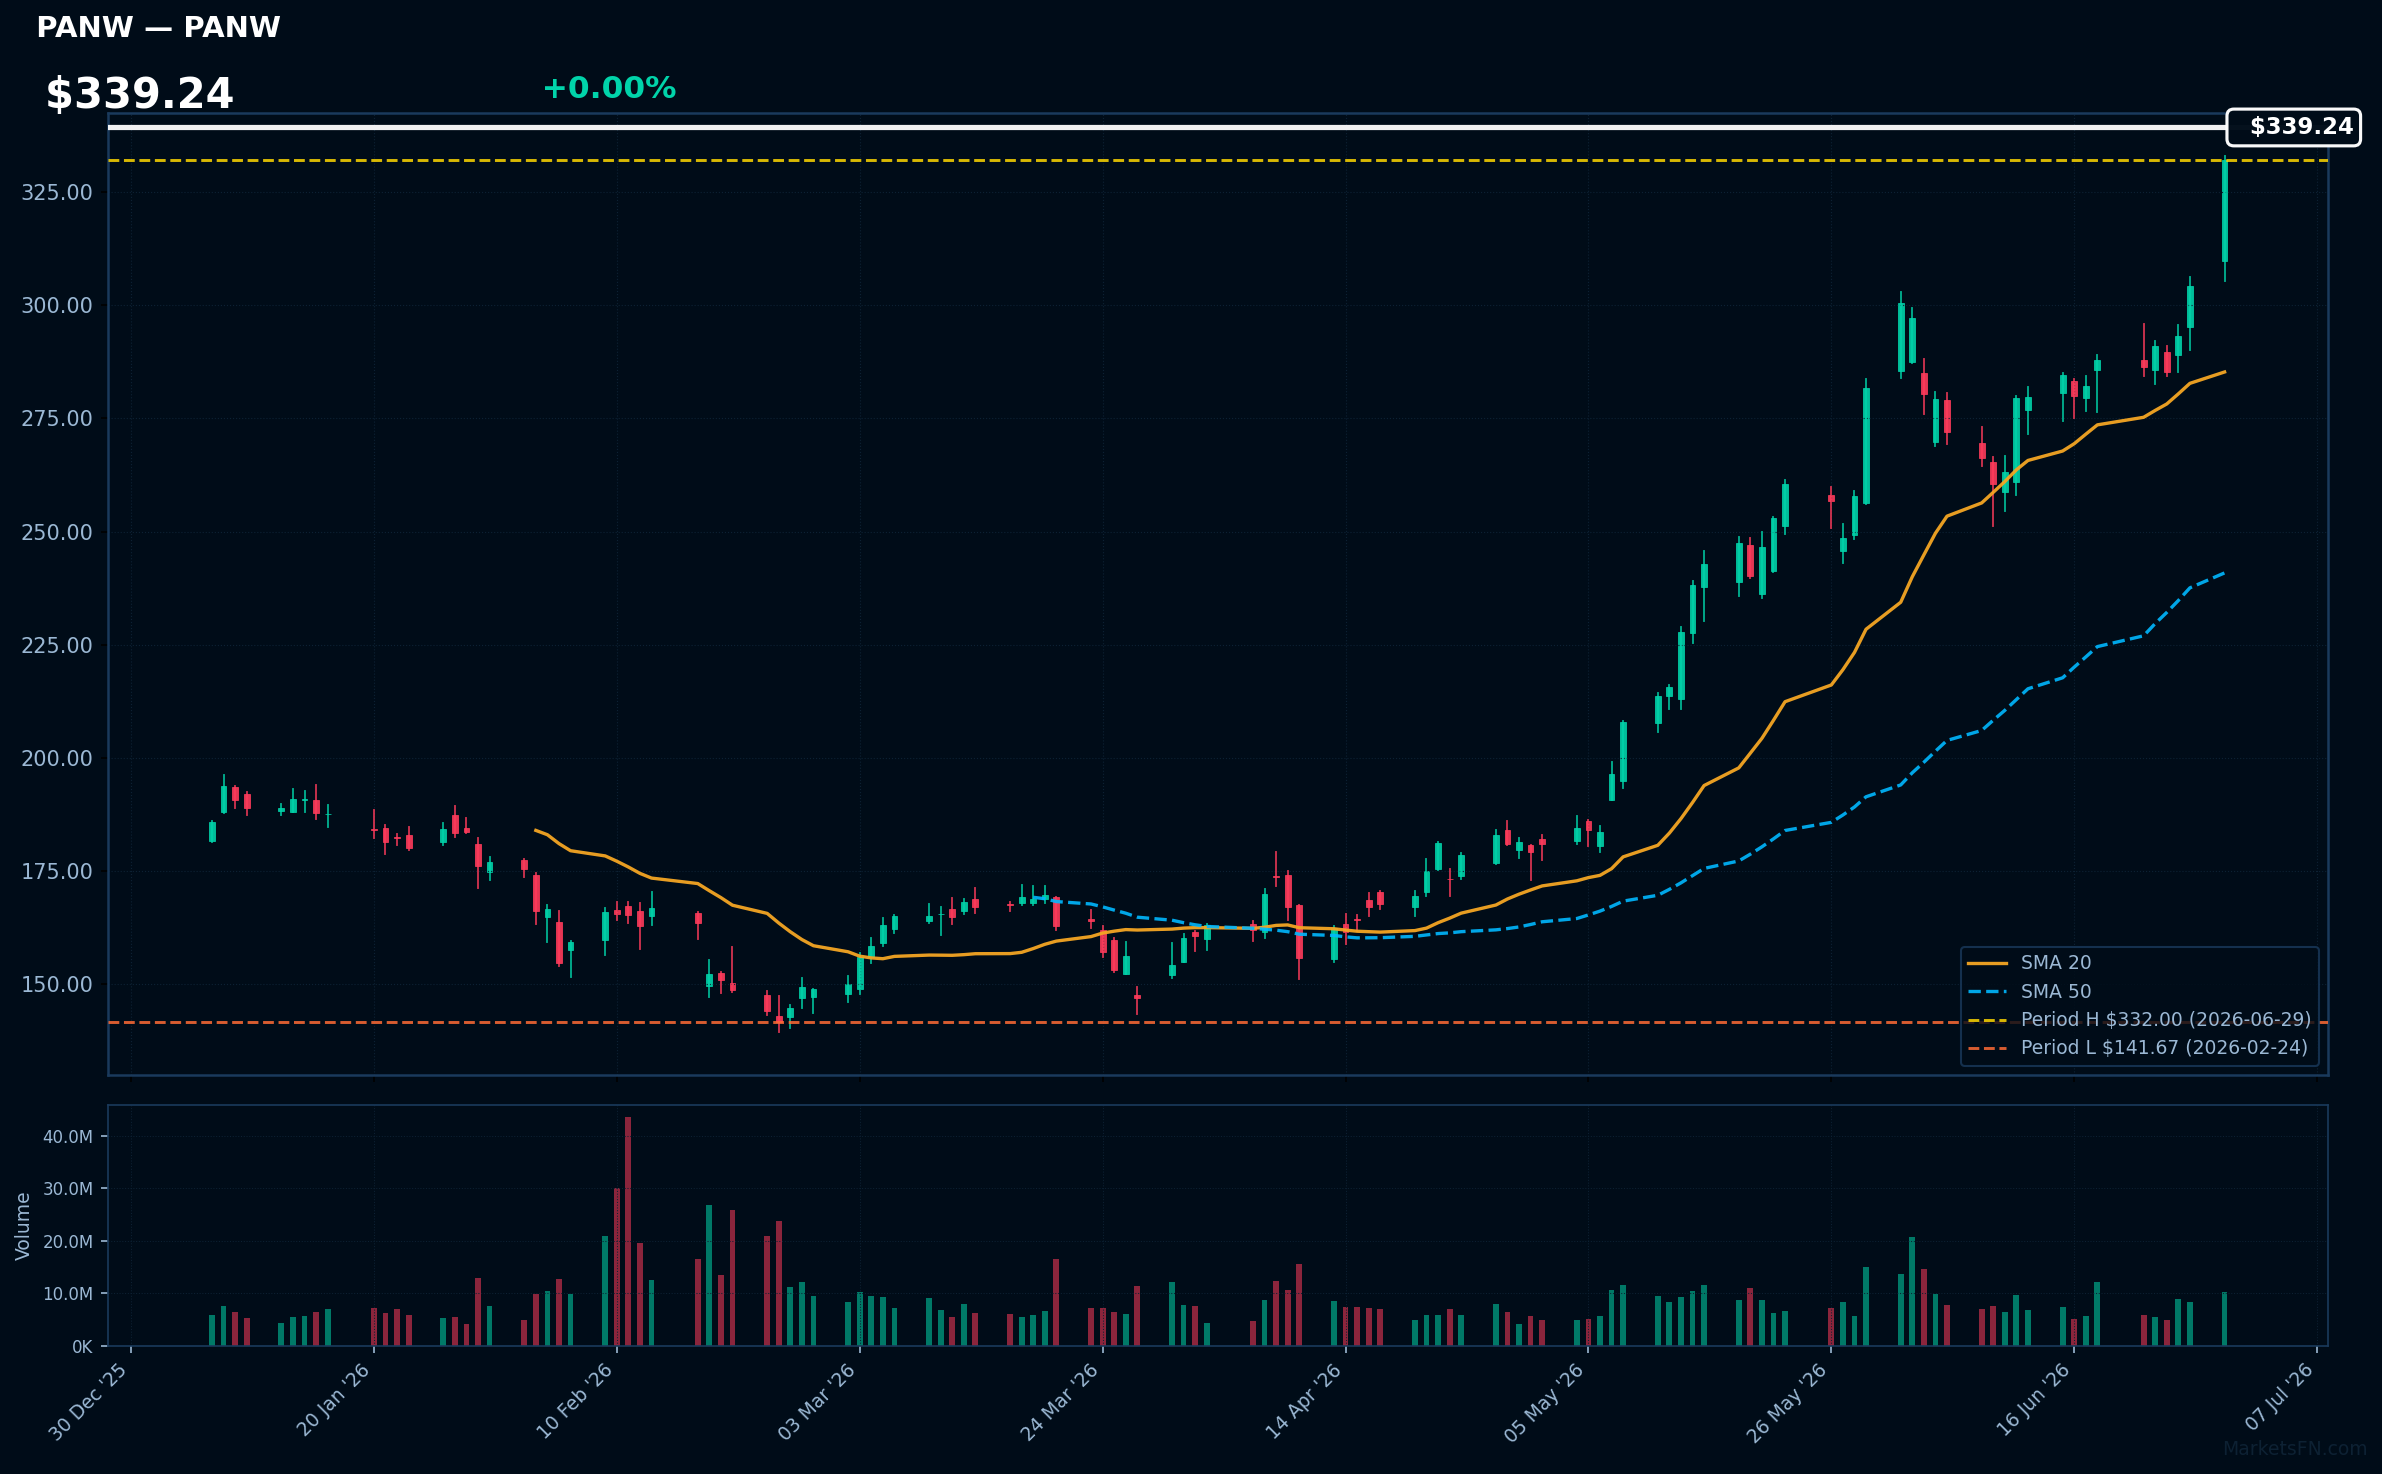
PANW | Palo Alto Networks Inc | Technology | Price Last: $332.00 | % Realized: +85.09% | RSI: 79.1 | % above MA200: +66.0% | Trend: Above MA20, MA50, MA200
Palo Alto Networks Inc is a cybersecurity company providing advanced threat prevention and security solutions. Investors should care because its innovative products and strong market position drive growth, making it a significant player in the rapidly expanding cybersecurity market.
Palo Alto Networks Inc is in a sustained uptrend with price ($339.24) above MA20 > MA50 > MA200. RSI(14) is 79.1, indicating potential overbought conditions. The stock is 0.0% below its 2026 YTD high, suggesting a potential breakout level, with 85.1% return over the 2026 YTD period.
Related headlines
- The Old-School Signal That Lit Up Palo Alto Networks Stock
- Is the Market Totally Wrong About PANW Stock?
- PANW vs CRWD vs AVGO: Morningstar Has A 'Top Pick' Trading At A 40% Discount After Earnings
- Palo Alto Networks and Deutsche Telekom Bring AI-Driven Security with Advanced Sovereignty Controls for European Regulated Industries
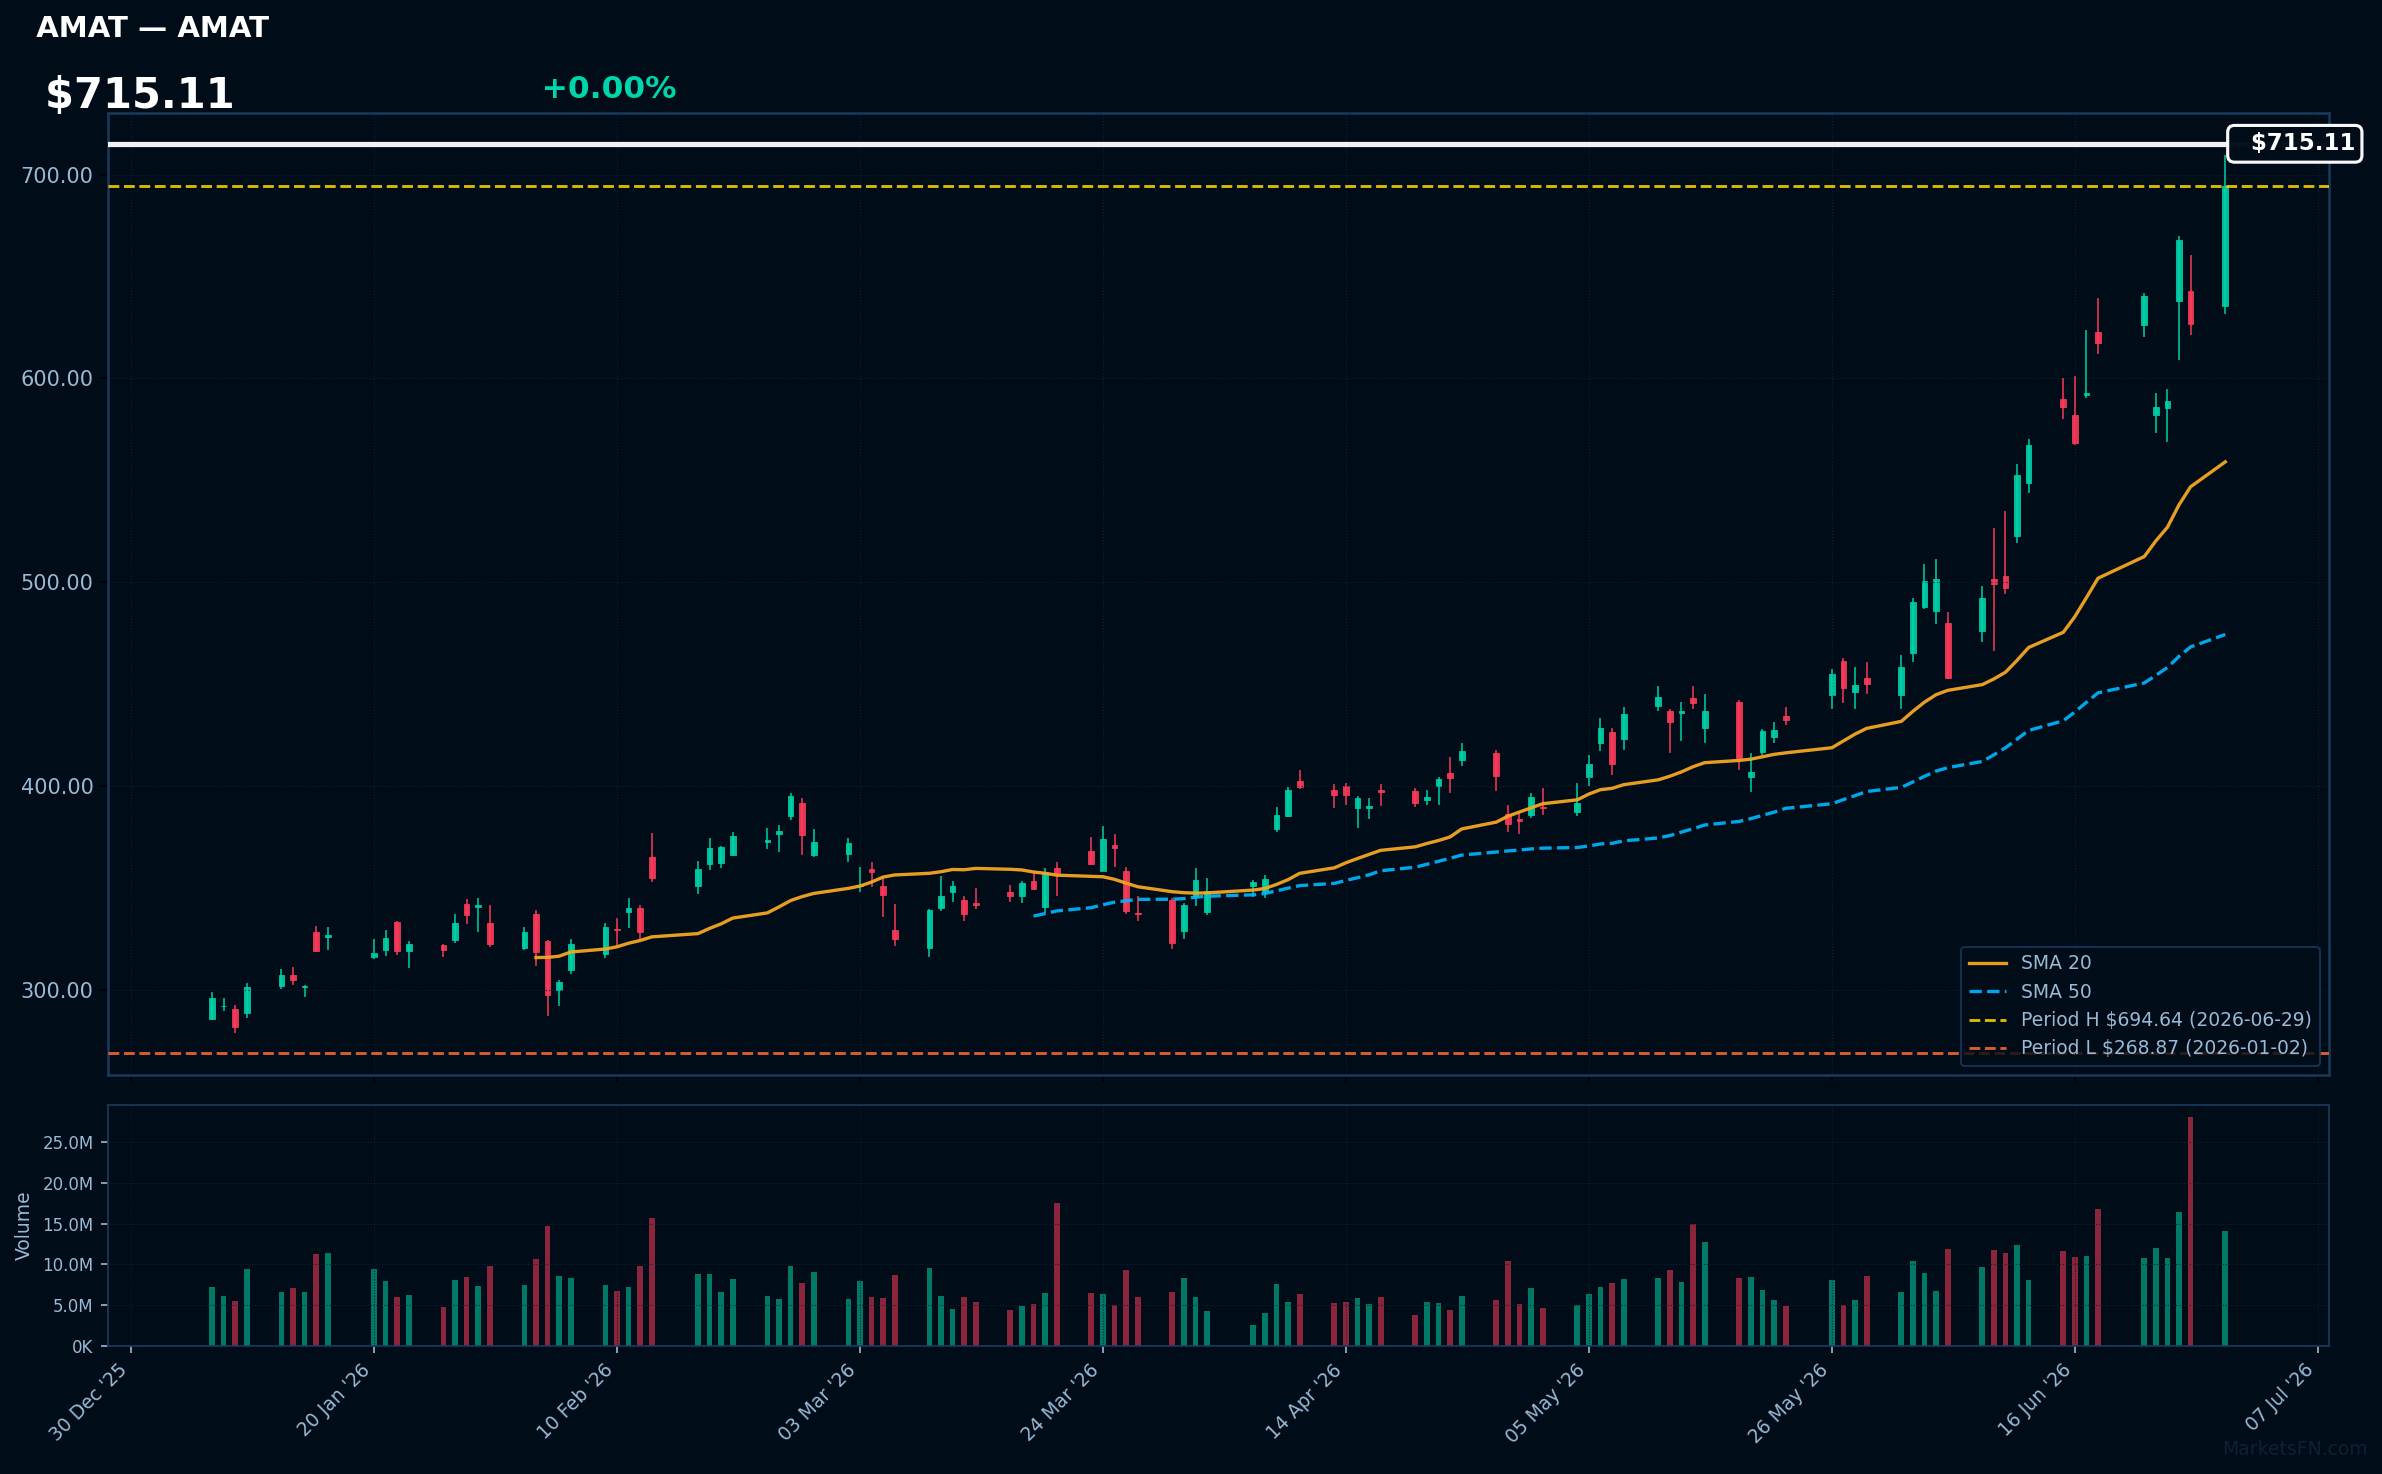
AMAT | Applied Materials Inc | Technology | Price Last: $694.64 | % Realized: +158.36% | RSI: 71.8 | % above MA200: +107.5% | Trend: Above MA20, MA50, MA200
Applied Materials Inc is a leading manufacturer of semiconductor fabrication equipment, crucial for chip production. Investors should care as the company's technology enables advancements in AI, 5G, and other emerging tech sectors, driving growth and profitability.
AMAT's RSI(14) is 71.8, indicating strong momentum. With price > MA20 > MA50 > MA200 and 0.0% below its 2026 YTD high, the stock shows a sustained uptrend and potential breakout, suggesting continued upward pressure.
Related headlines
- Applied Materials Inc. stock outperforms competitors on strong trading day
- Applied Materials Stock Hits Record High After Price-Target Hikes
- This Analyst Sees 20% Upside For AMAT Stock Says High Expectations Around Applied Materials Businesses Create Short-Term Risk
- AMAT Stock Gets Thumbs Up From Wall Street Analysts Remain Confident About Applied Materials Strong Market Position
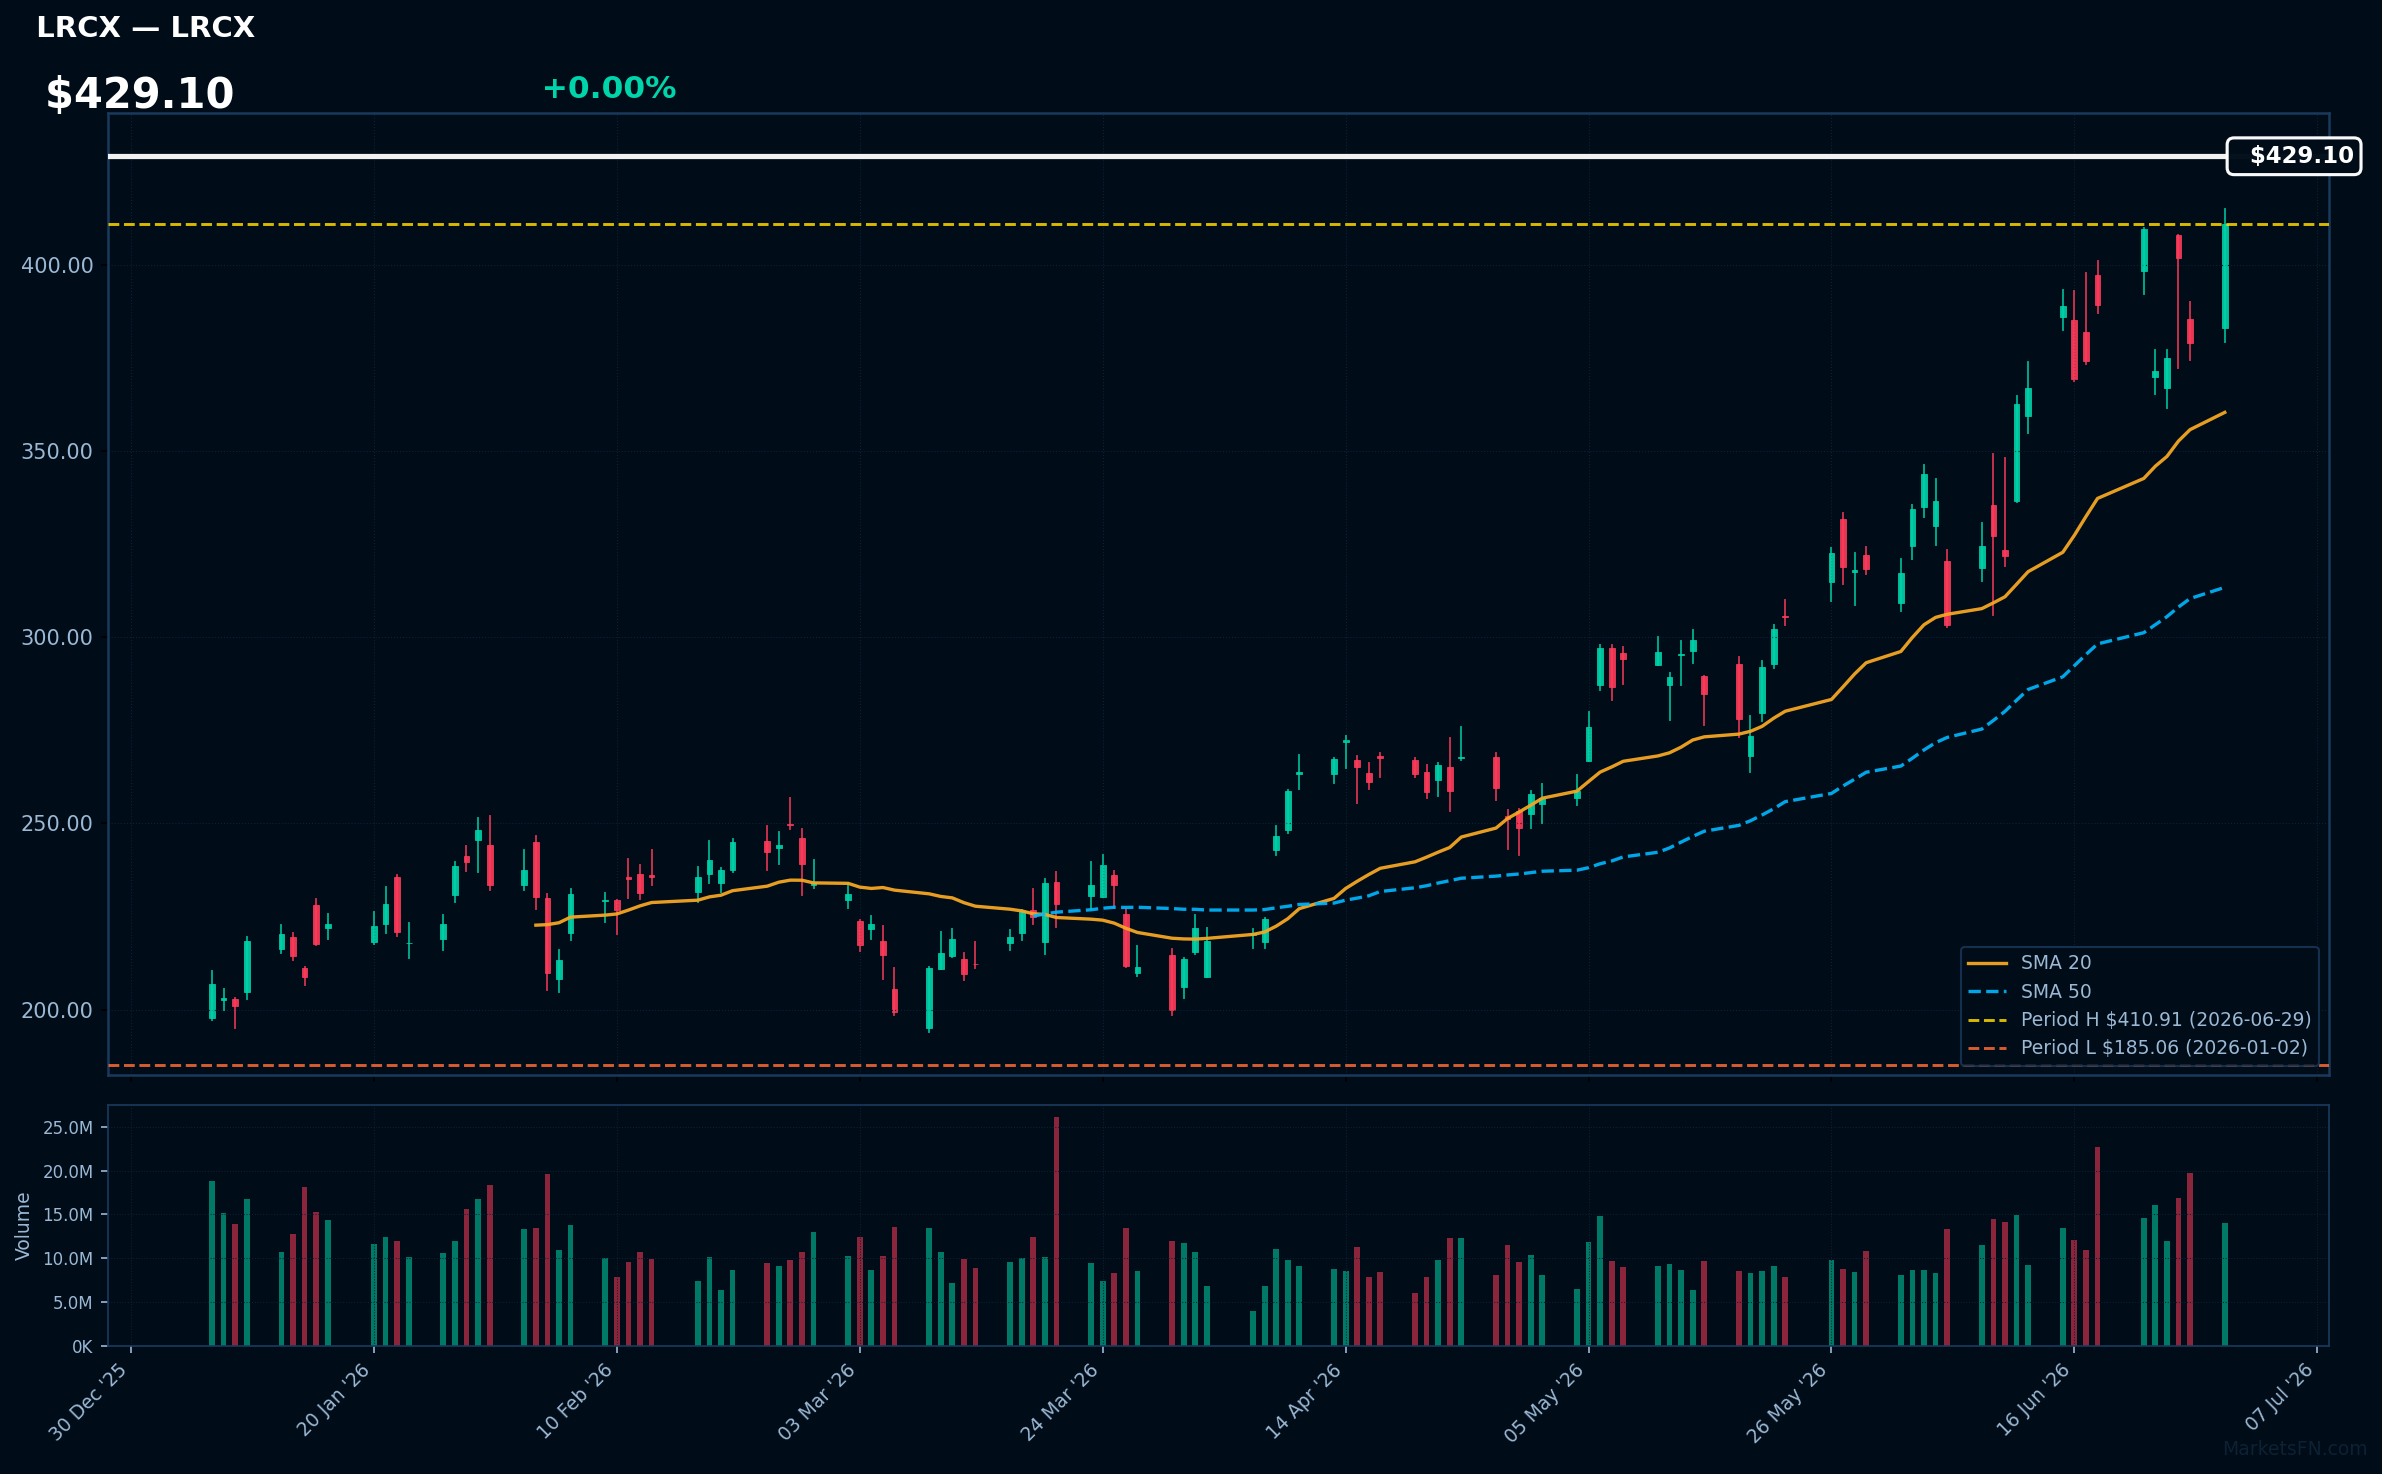
LRCX | Lam Research Corp | Technology | Price Last: $410.91 | % Realized: +122.04% | RSI: 66.5 | % above MA200: +86.5% | Trend: Above MA20, MA50, MA200
Lam Research Corp is a leading supplier of wafer fabrication equipment and services to the semiconductor industry. Investors should care because its products are crucial for chip manufacturing, driving revenue growth tied to the semiconductor cycle.
Lam Research Corp's RSI(14) is 66.5 with a bullish MA alignment: price ($429.10) > MA20 > MA50 > MA200, indicating sustained uptrend momentum. The stock is 0.0% below its 2026 YTD high, near a potential breakout.
Related headlines
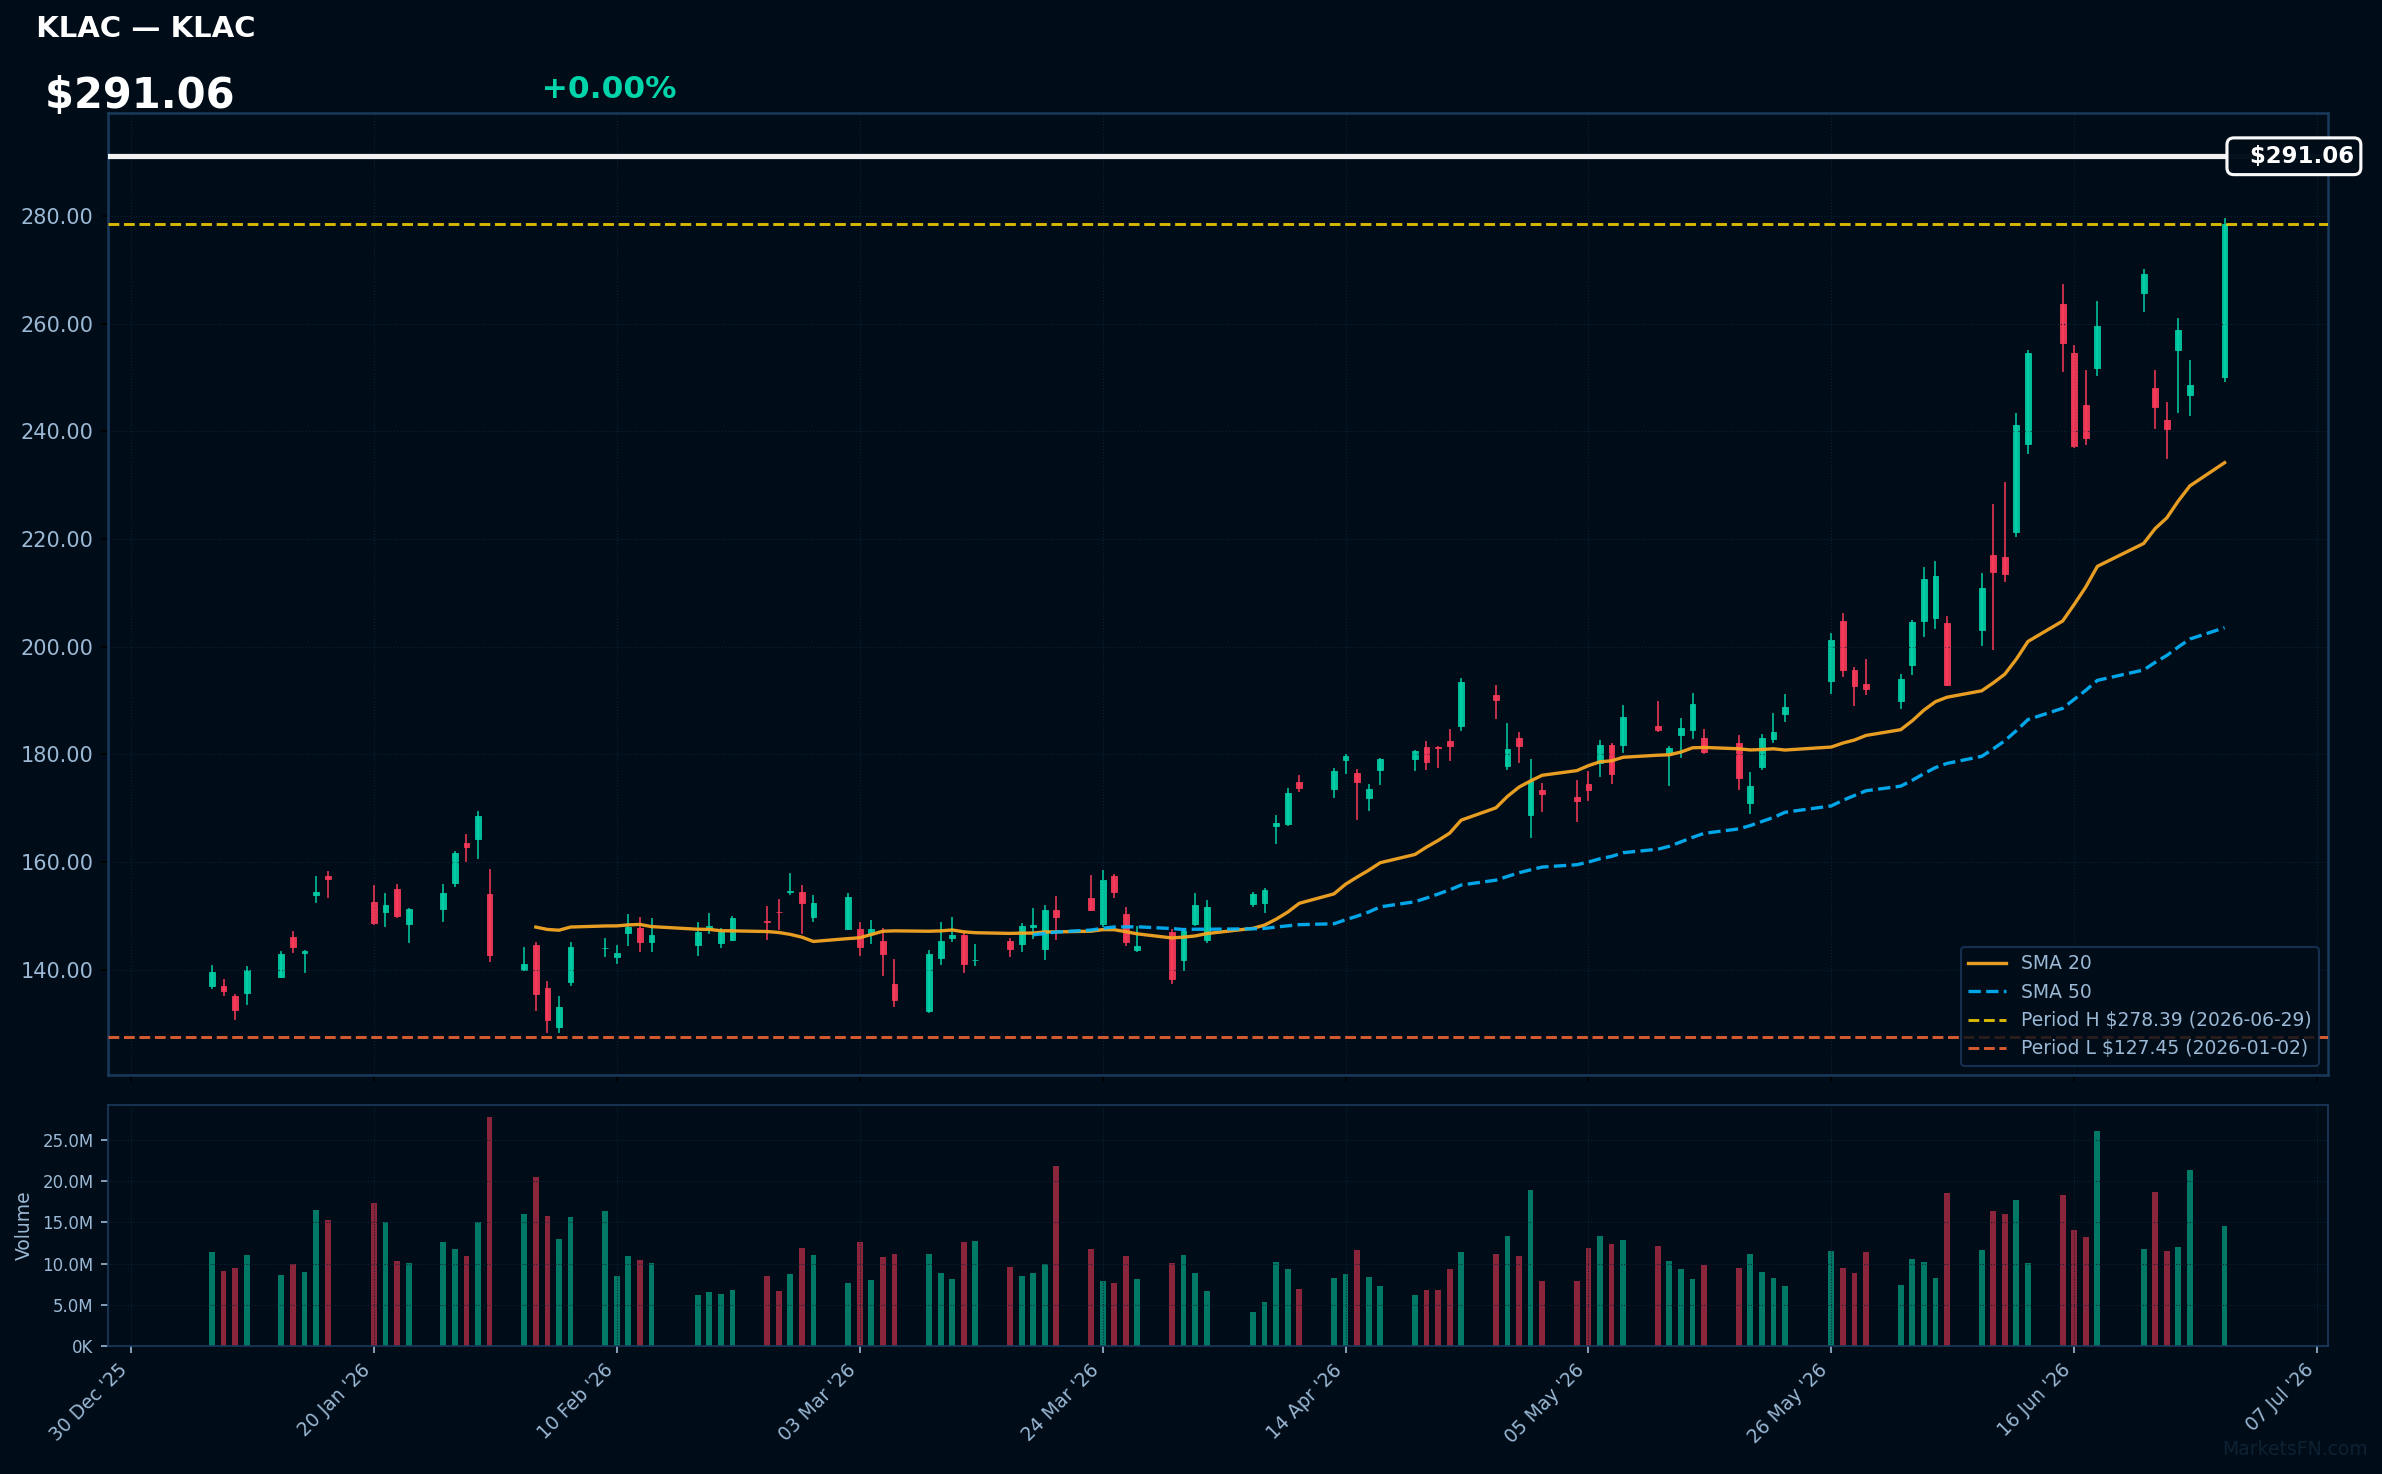
KLAC | KLA Corp | Technology | Price Last: $278.39 | % Realized: +118.44% | RSI: 69.0 | % above MA200: +85.1% | Trend: Above MA20, MA50, MA200
KLA Corp is a process control and yield management solutions provider for the semiconductor industry. Investors should care because its technology enables chip manufacturers to improve production efficiency and reduce costs, making it a crucial partner in the semiconductor supply chain.
KLA Corp's current technical situation indicates strong momentum: RSI(14) is 69.0, and the stock exhibits a bullish MA alignment with price > MA20 > MA50 > MA200. It's near its 2026 YTD high, up 118.4% YTD.
Related headlines
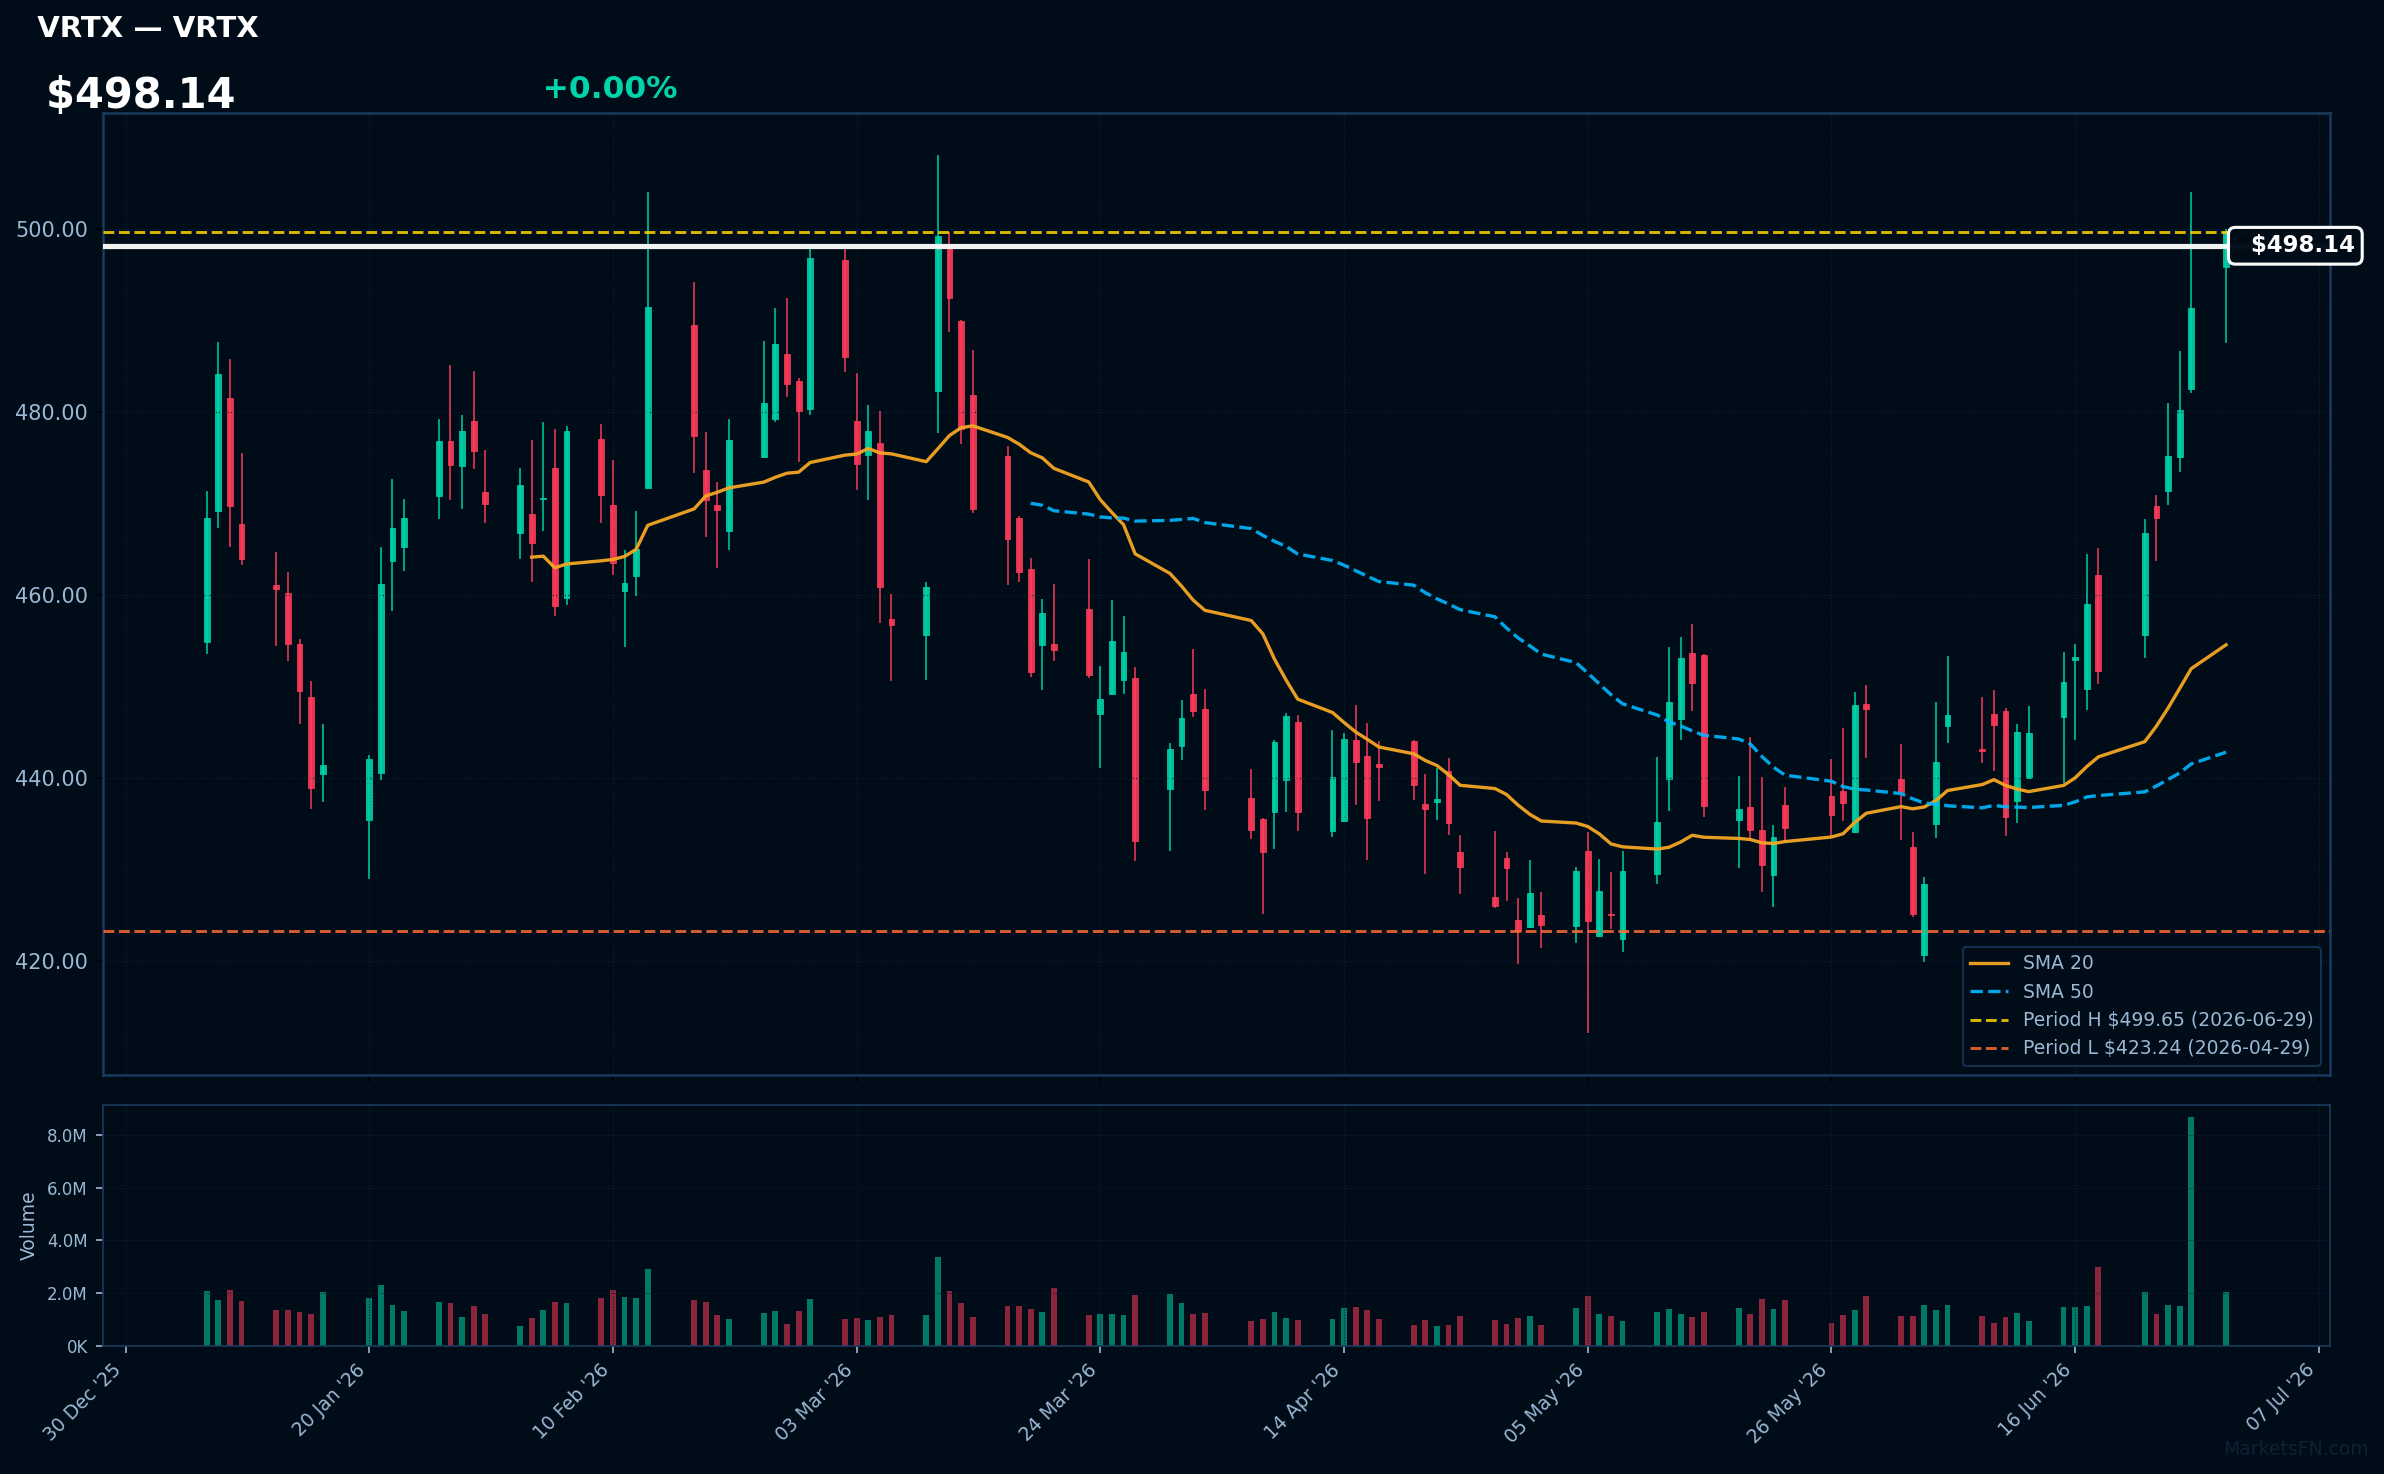
VRTX | Vertex Pharmaceuticals, Inc | Healthcare | Price Last: $499.65 | % Realized: +10.51% | RSI: 74.3 | % above MA200: +12.9% | Trend: Above MA20, MA50, MA200
Vertex Pharmaceuticals, Inc is a biotechnology company that develops and commercializes treatments for cystic fibrosis and other serious diseases. Investors should care because its cystic fibrosis treatments have shown significant market success and potential for continued growth.
The stock exhibits bullish technicals with RSI(14) at 74.3, indicating strong momentum. The MA alignment is bullish as price ($498.14) > MA20 > MA50 > MA200, showing a sustained uptrend. The stock is near its 2026 YTD high, 0.0% below, suggesting a potential breakout.
Related headlines
- Vertex Pharmaceuticals CFOs case for thinking like a portfolio manager
- Vertex Presents New Data on CASGEVY, Including First European Presentation of Data in Children Ages 5-11, at the European Hematology Association Congress and Announces Additional Global Regulatory Submissions
- Vertex Presents New Data on ALYFTREK at European Cystic Fibrosis Conference
- Vertex to Participate in the Goldman Sachs 47th Annual Global Healthcare Conference on June 10
📉 Nearest to 2026 Low
Sectors represented: Communication Services (1), Industrials (1), Technology (1), Consumer Defensive (1), Healthcare (1)
| Ticker | Company | Sector | Price Last | % Realized | 2026 YTD Low Date | RSI | % above MA200 | Trend |
|---|---|---|---|---|---|---|---|---|
| TMUS | T-Mobile US Inc | Communication Services | $173.97 | -12.83% | 2026-06-29 | 31.8 | -15.0% | Below MA20, MA50, MA200 |
| CPRT | Copart, Inc | Industrials | $28.10 | -25.60% | 2026-06-29 | 33.1 | -25.5% | Below MA20, MA50, MA200 |
| CTSH | Cognizant Technology Solutions Corp | Technology | $38.74 | -52.34% | 2026-06-29 | 22.3 | -41.8% | Below MA20, MA50, MA200 |
| PEP | PepsiCo Inc | Consumer Defensive | $138.68 | -2.50% | 2026-01-07 | 36.6 | -7.6% | Below MA20, MA50, MA200 |
| IDXX | Idexx Laboratories, Inc | Healthcare | $535.93 | -20.01% | 2026-05-13 | 37.5 | -14.8% | Below MA20, MA50, MA200 |
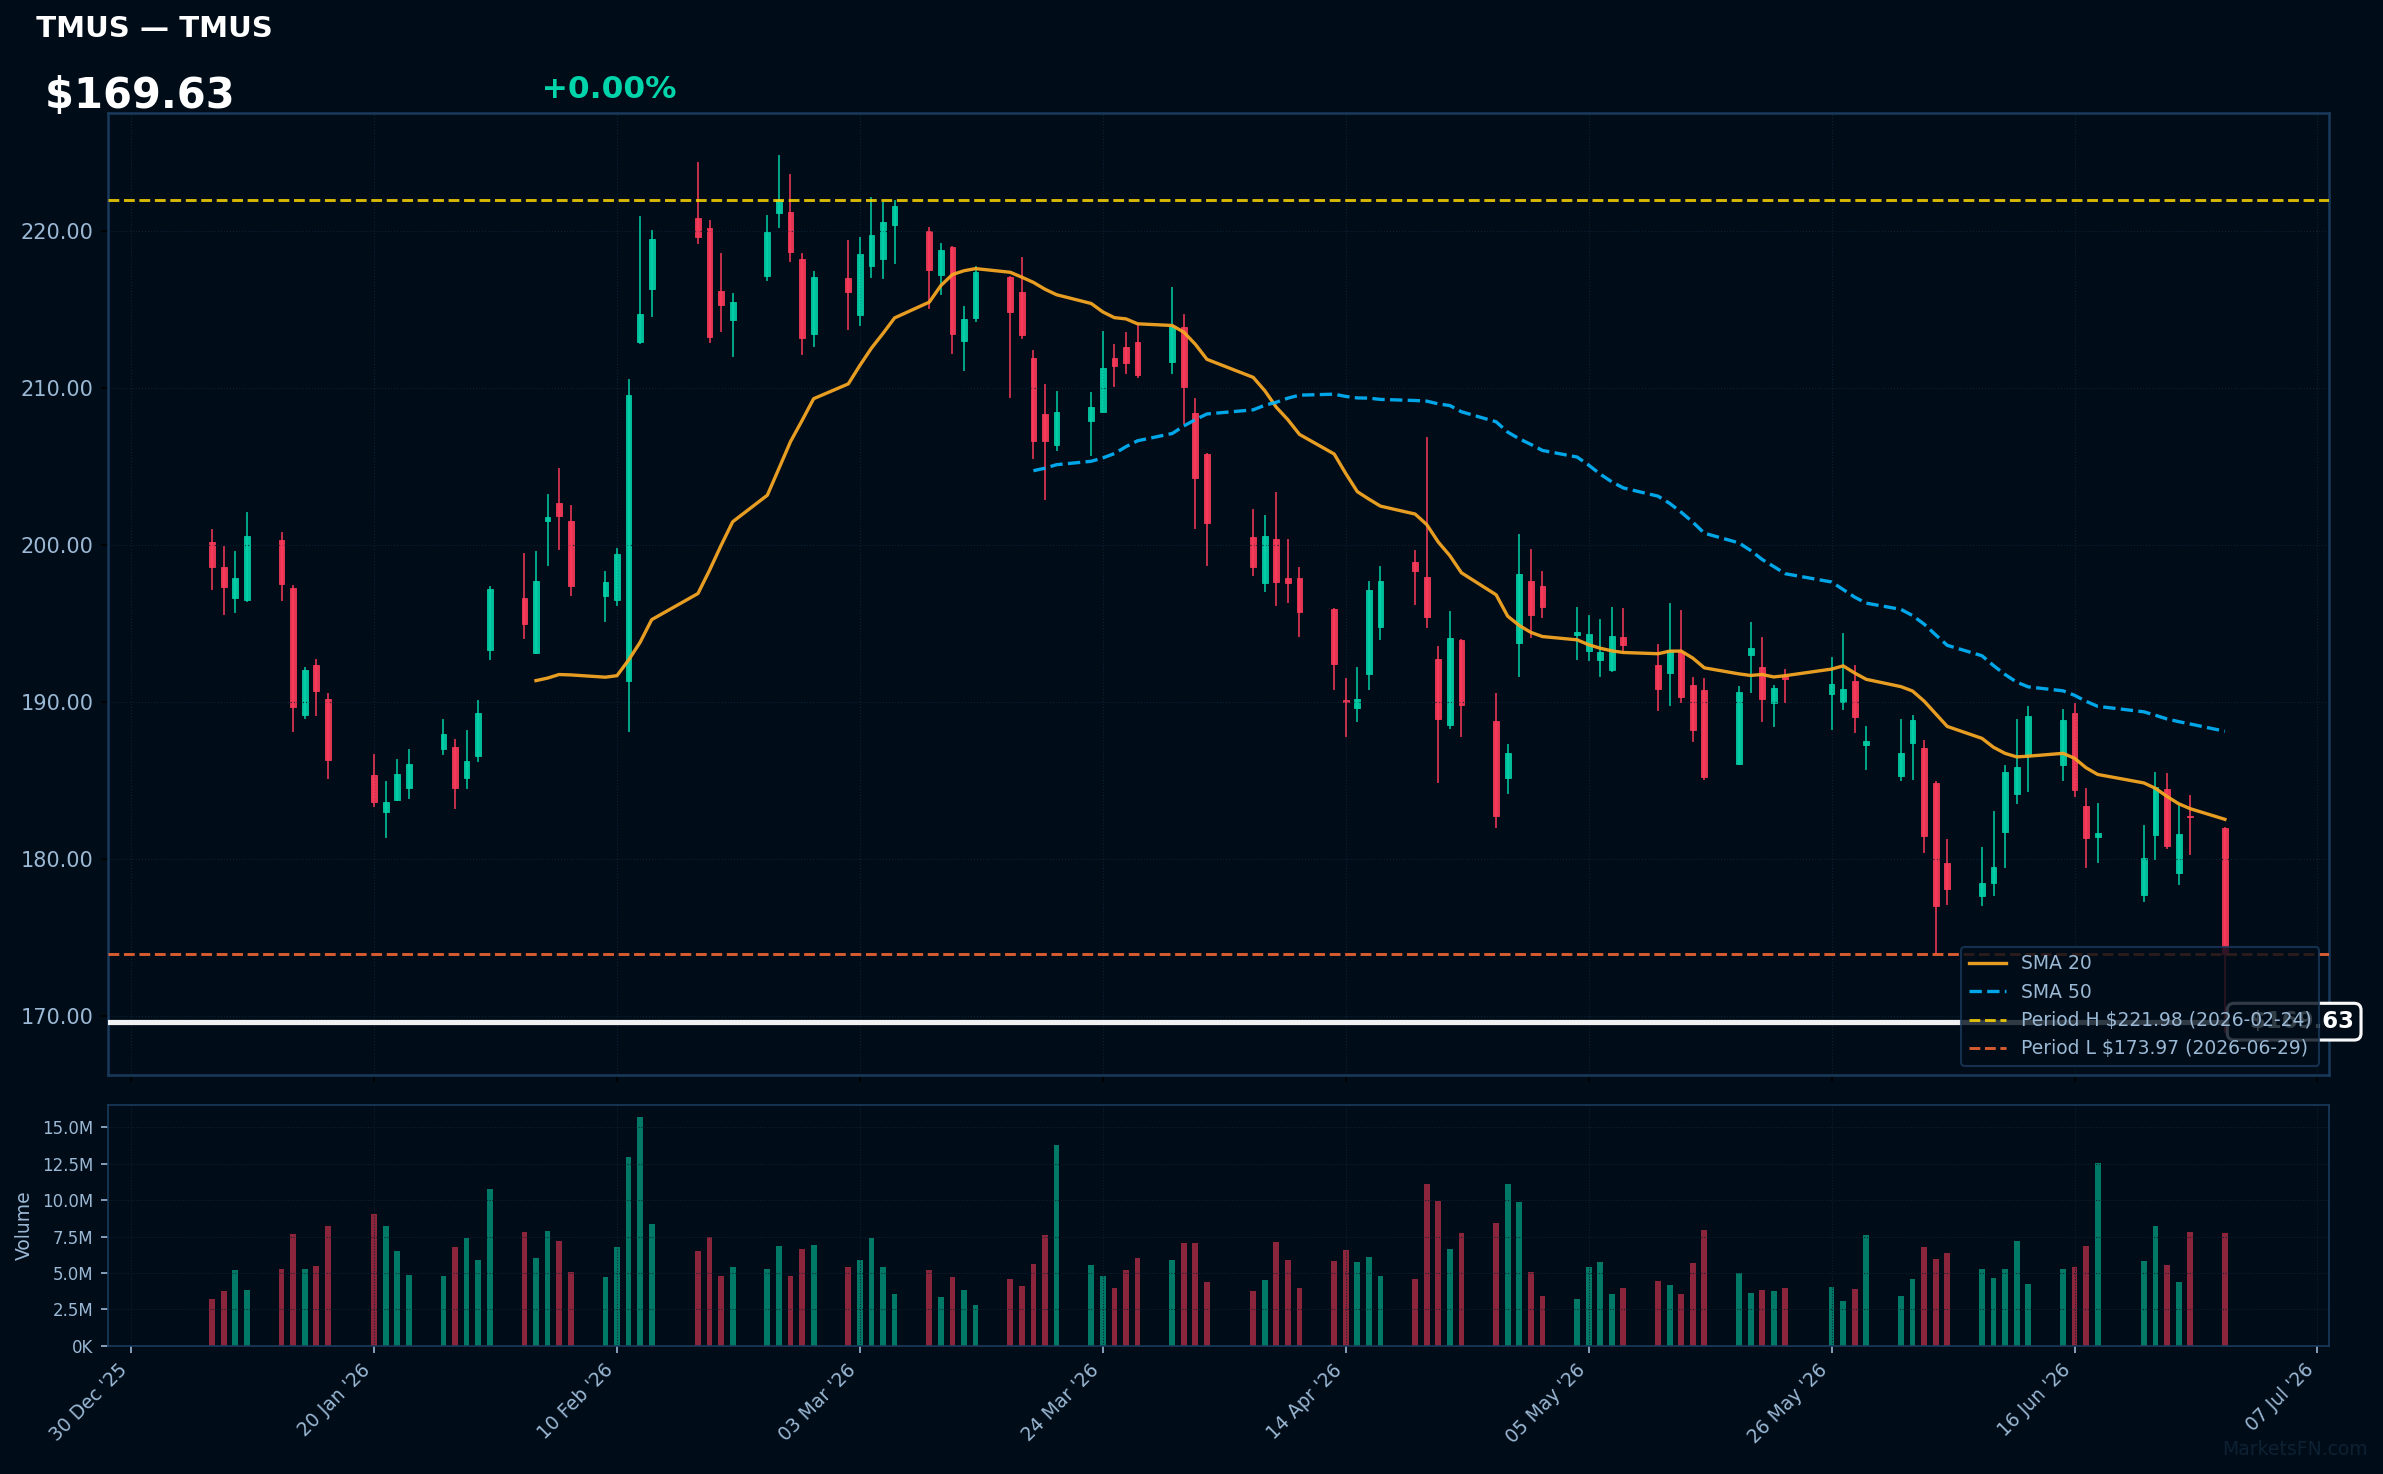
TMUS | T-Mobile US Inc | Communication Services | Price Last: $173.97 | % Realized: -12.83% | RSI: 31.8 | % above MA200: -15.0% | Trend: Below MA20, MA50, MA200
T-Mobile US Inc is a wireless network operator providing mobile services. Investors should care about its competitive positioning, subscriber growth, and 5G rollout progress, as these factors impact revenue and profitability.
T-Mobile US Inc is in a sustained downtrend with price ($169.63) below MA20, MA50, and MA200. RSI(14) is 31.8, near oversold territory. The stock is testing major support at its 2026 YTD low, having fallen 12.8% YTD.
Related headlines
- VZ, T, TMUS Shares Under Pressure SpaceX's Starlink Mobile Service Push Rattles Telecom Stocks
- SpaceX Might Bring Mobile Phone to Market, and Verizon, AT&T, and T-Mobile Are Down
- SPCX Stock: SpaceX's Wireless Ambitions Fuel T-Mobile Acquisition Speculation
- T-Mobile to Host Q2 2026 Earnings Call on July 23, 2026
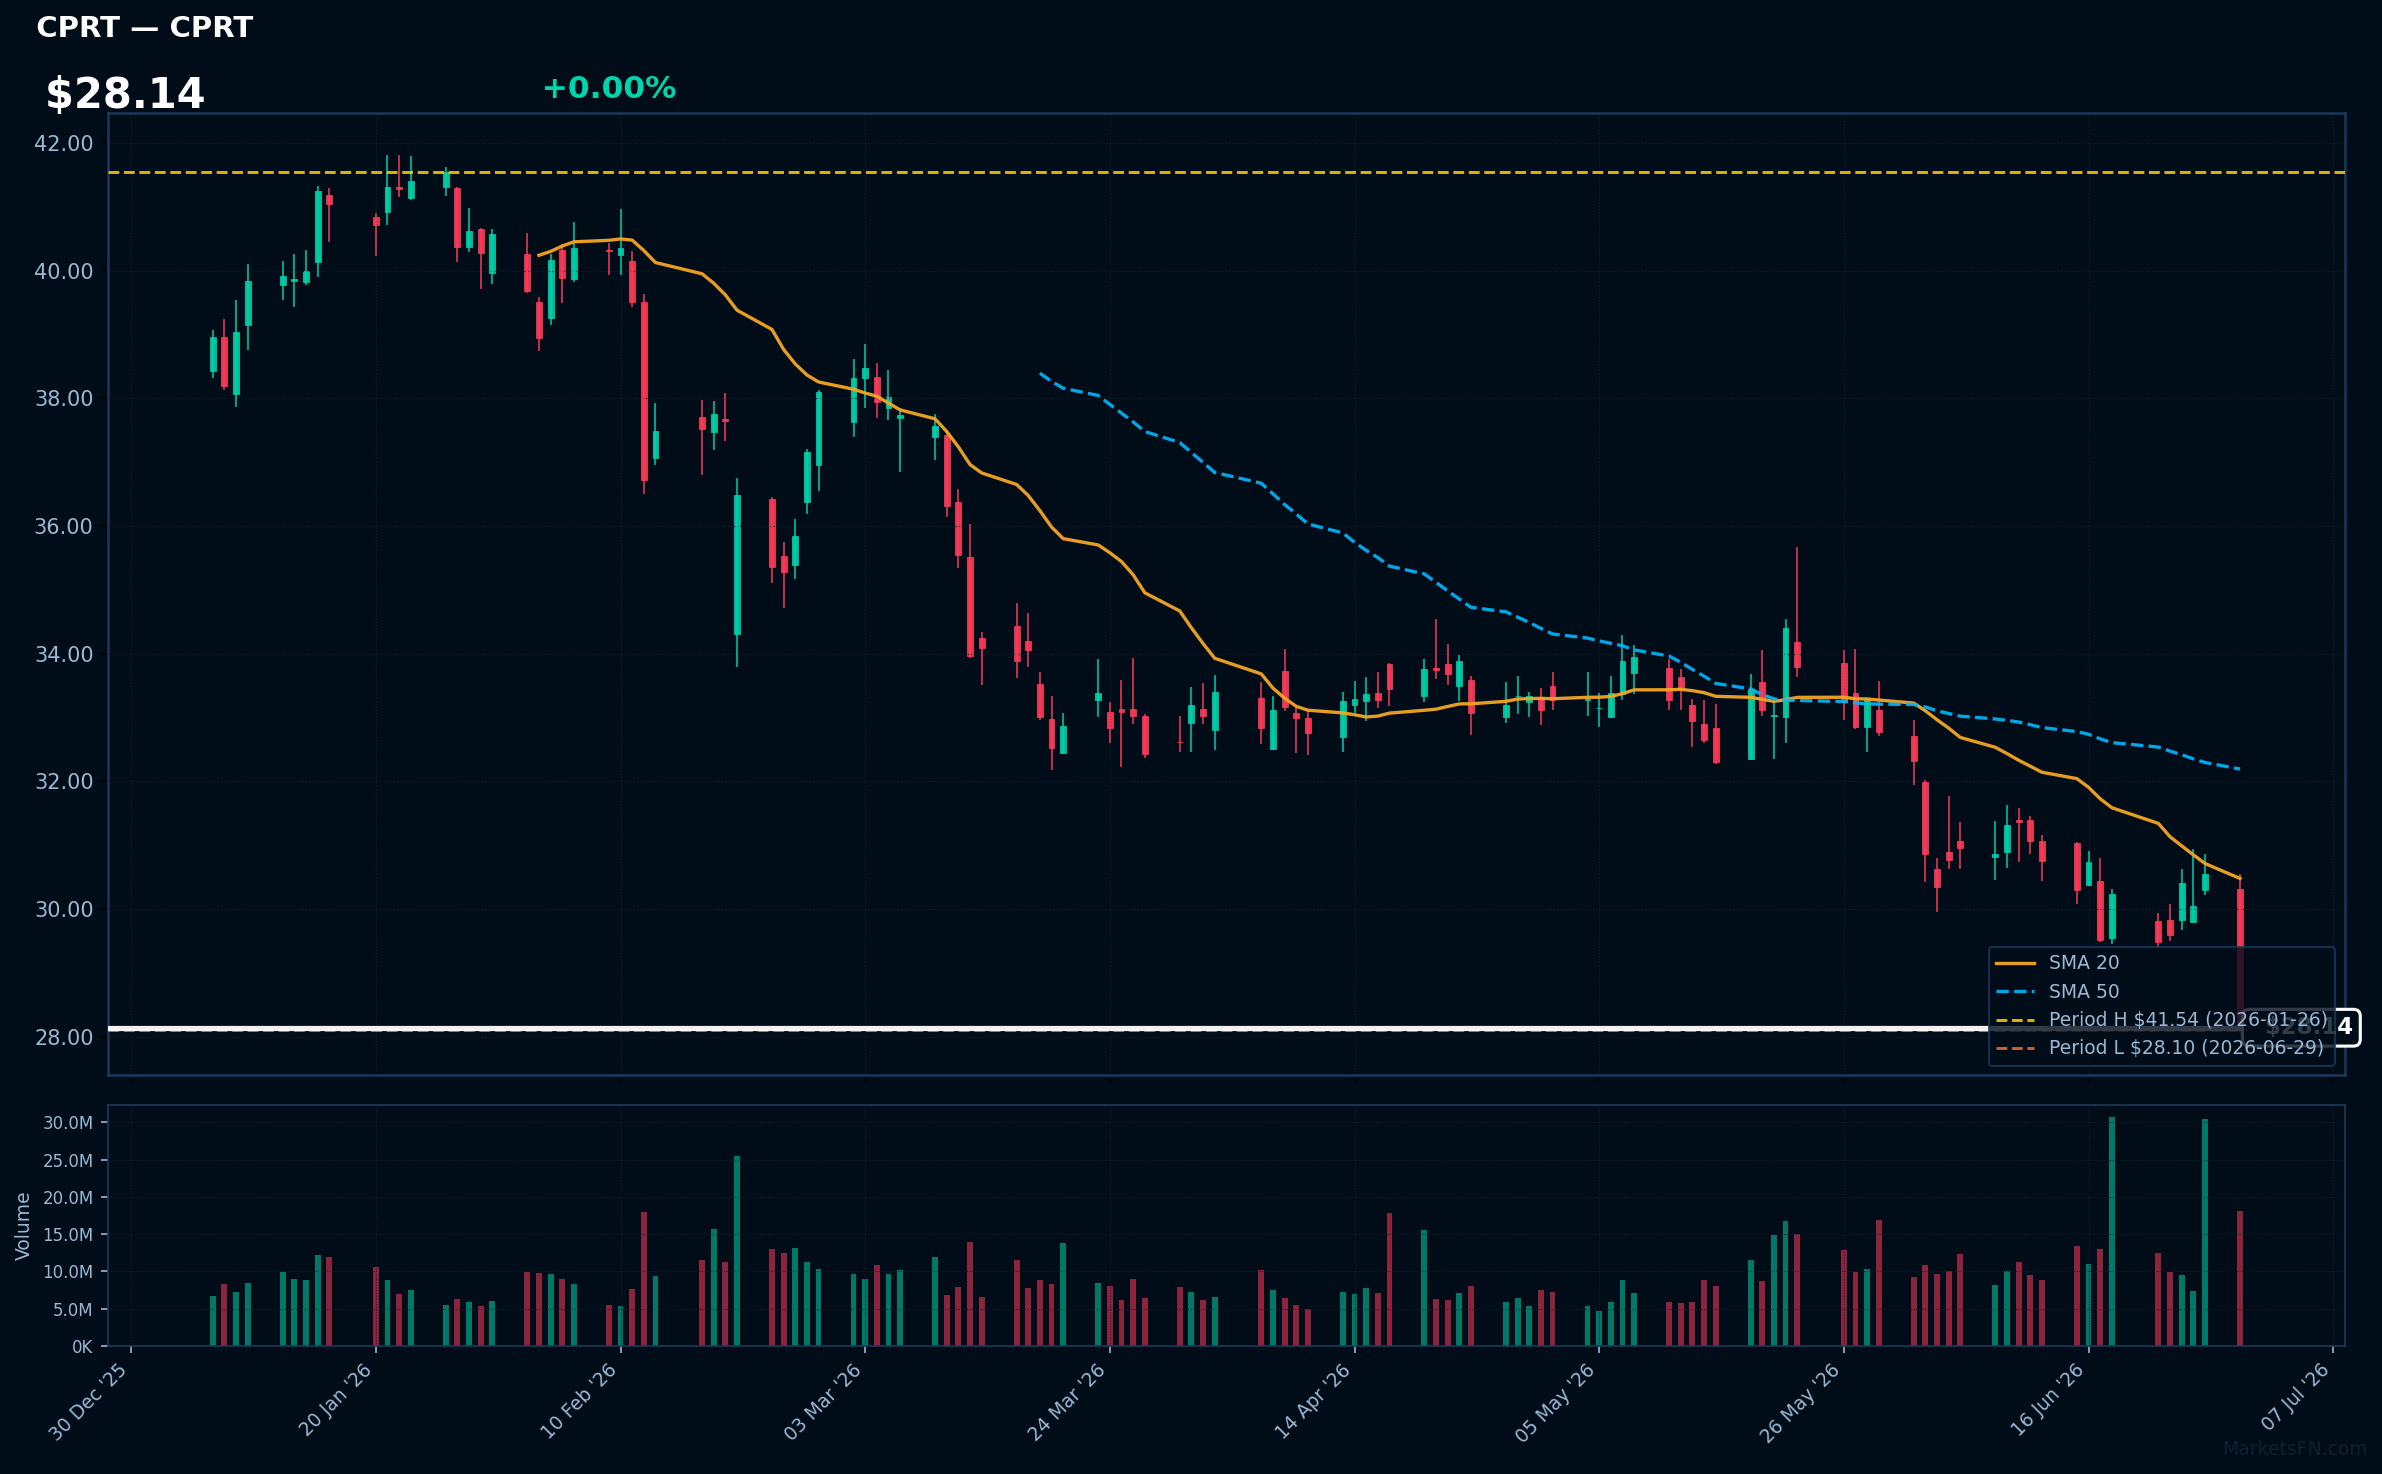
CPRT | Copart, Inc | Industrials | Price Last: $28.10 | % Realized: -25.60% | RSI: 33.1 | % above MA200: -25.5% | Trend: Below MA20, MA50, MA200
Copart, Inc (CPRT) operates online vehicle auction platforms, connecting buyers and sellers in the automotive salvage and used vehicle markets. Investors should care because CPRT's market dominance and pricing power drive revenue growth.
CPRT's technical situation is bearish, with RSI(14) at 33.1 indicating oversold conditions, and a sustained downtrend as price ($28.14) remains below MA20, MA50, and MA200, with the stock testing major support at its 2026 YTD low.
Related headlines
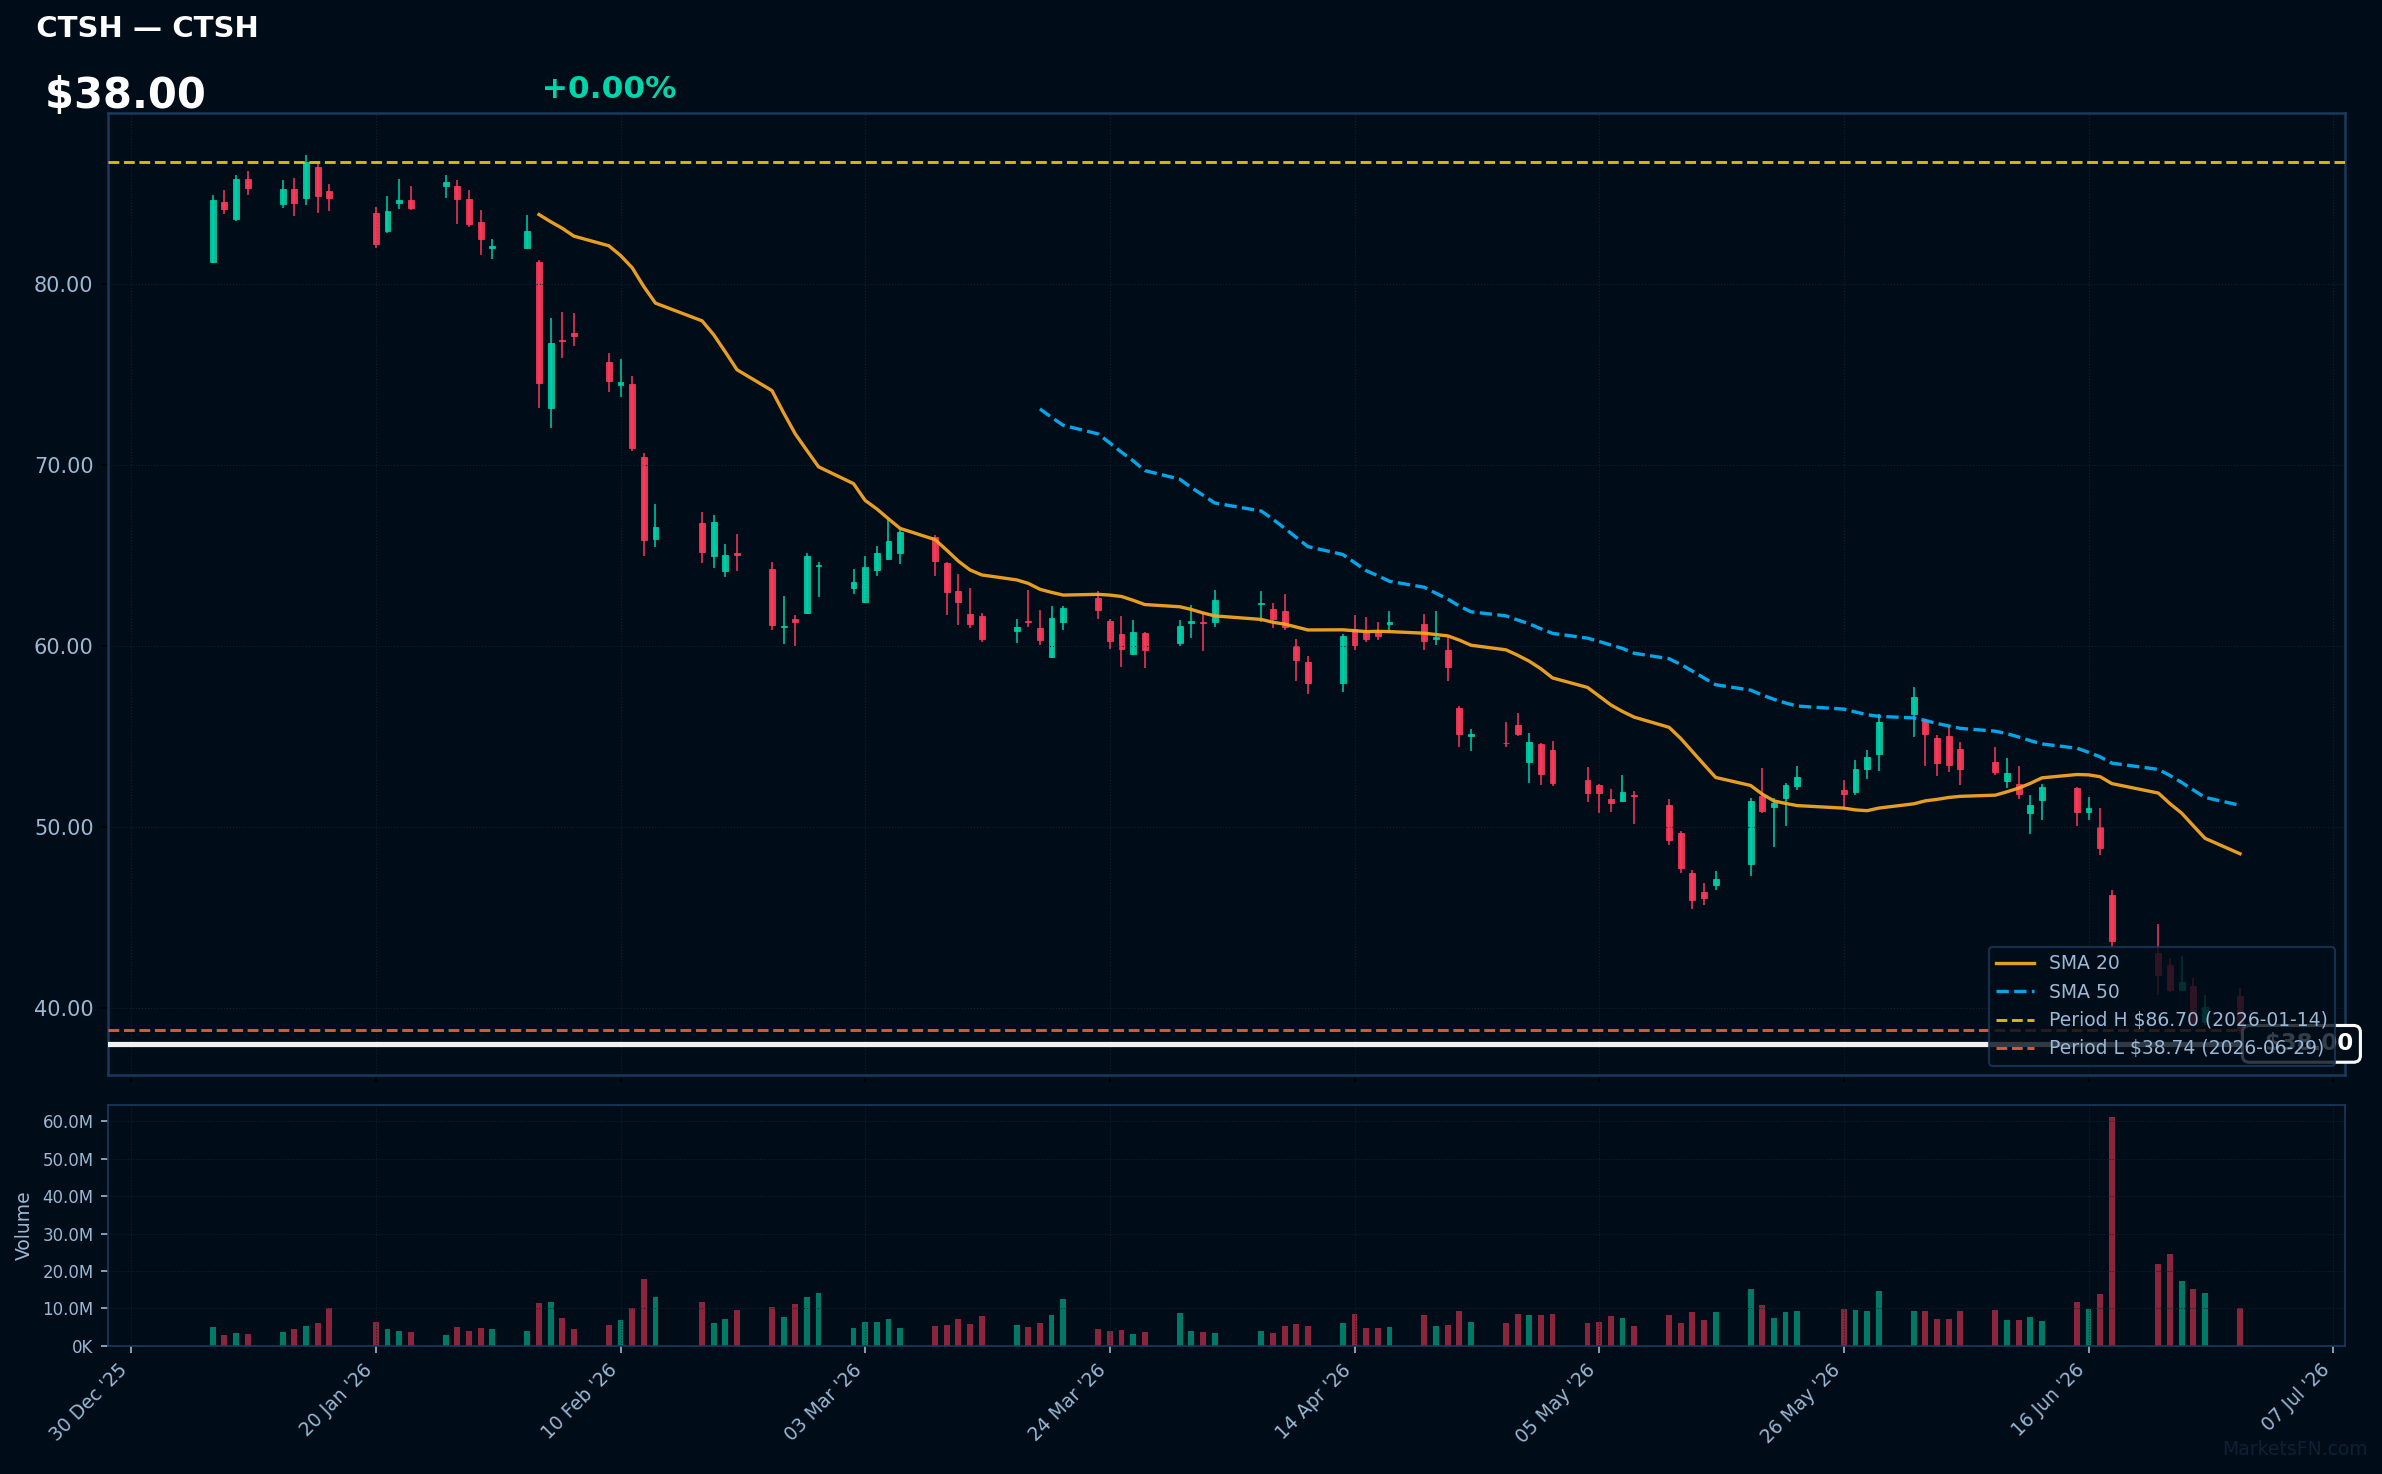
CTSH | Cognizant Technology Solutions Corp | Technology | Price Last: $38.74 | % Realized: -52.34% | RSI: 22.3 | % above MA200: -41.8% | Trend: Below MA20, MA50, MA200
Cognizant Technology Solutions Corp is an IT services company providing digital transformation, consulting, and technology services. Investors should care about its ability to adapt to changing tech landscapes and client needs, impacting revenue growth and profitability.
Cognizant's technical situation is bearish, with RSI(14) at 22.3, indicating oversold conditions. The MA alignment (price < MA20 < MA50 < MA200) confirms a sustained downtrend. The stock is at its 2026 YTD low, having fallen -52.3% YTD, signaling a potential warning sign.
Related headlines
- Cognizant Technology Solutions Corp. stock underperforms Thursday when compared to competitors
- Cognizant expands cross-platform agentic AI with new ServiceNow AI Agent interoperability
- Entry-Level Work Remains Essential: 94% of HR Leaders Expect AI to Create New Entry-Level Roles, Cognizant and Pearson Study Reveals
- Berenberg downgrades Cognizant as AI risks cloud IT services outlook
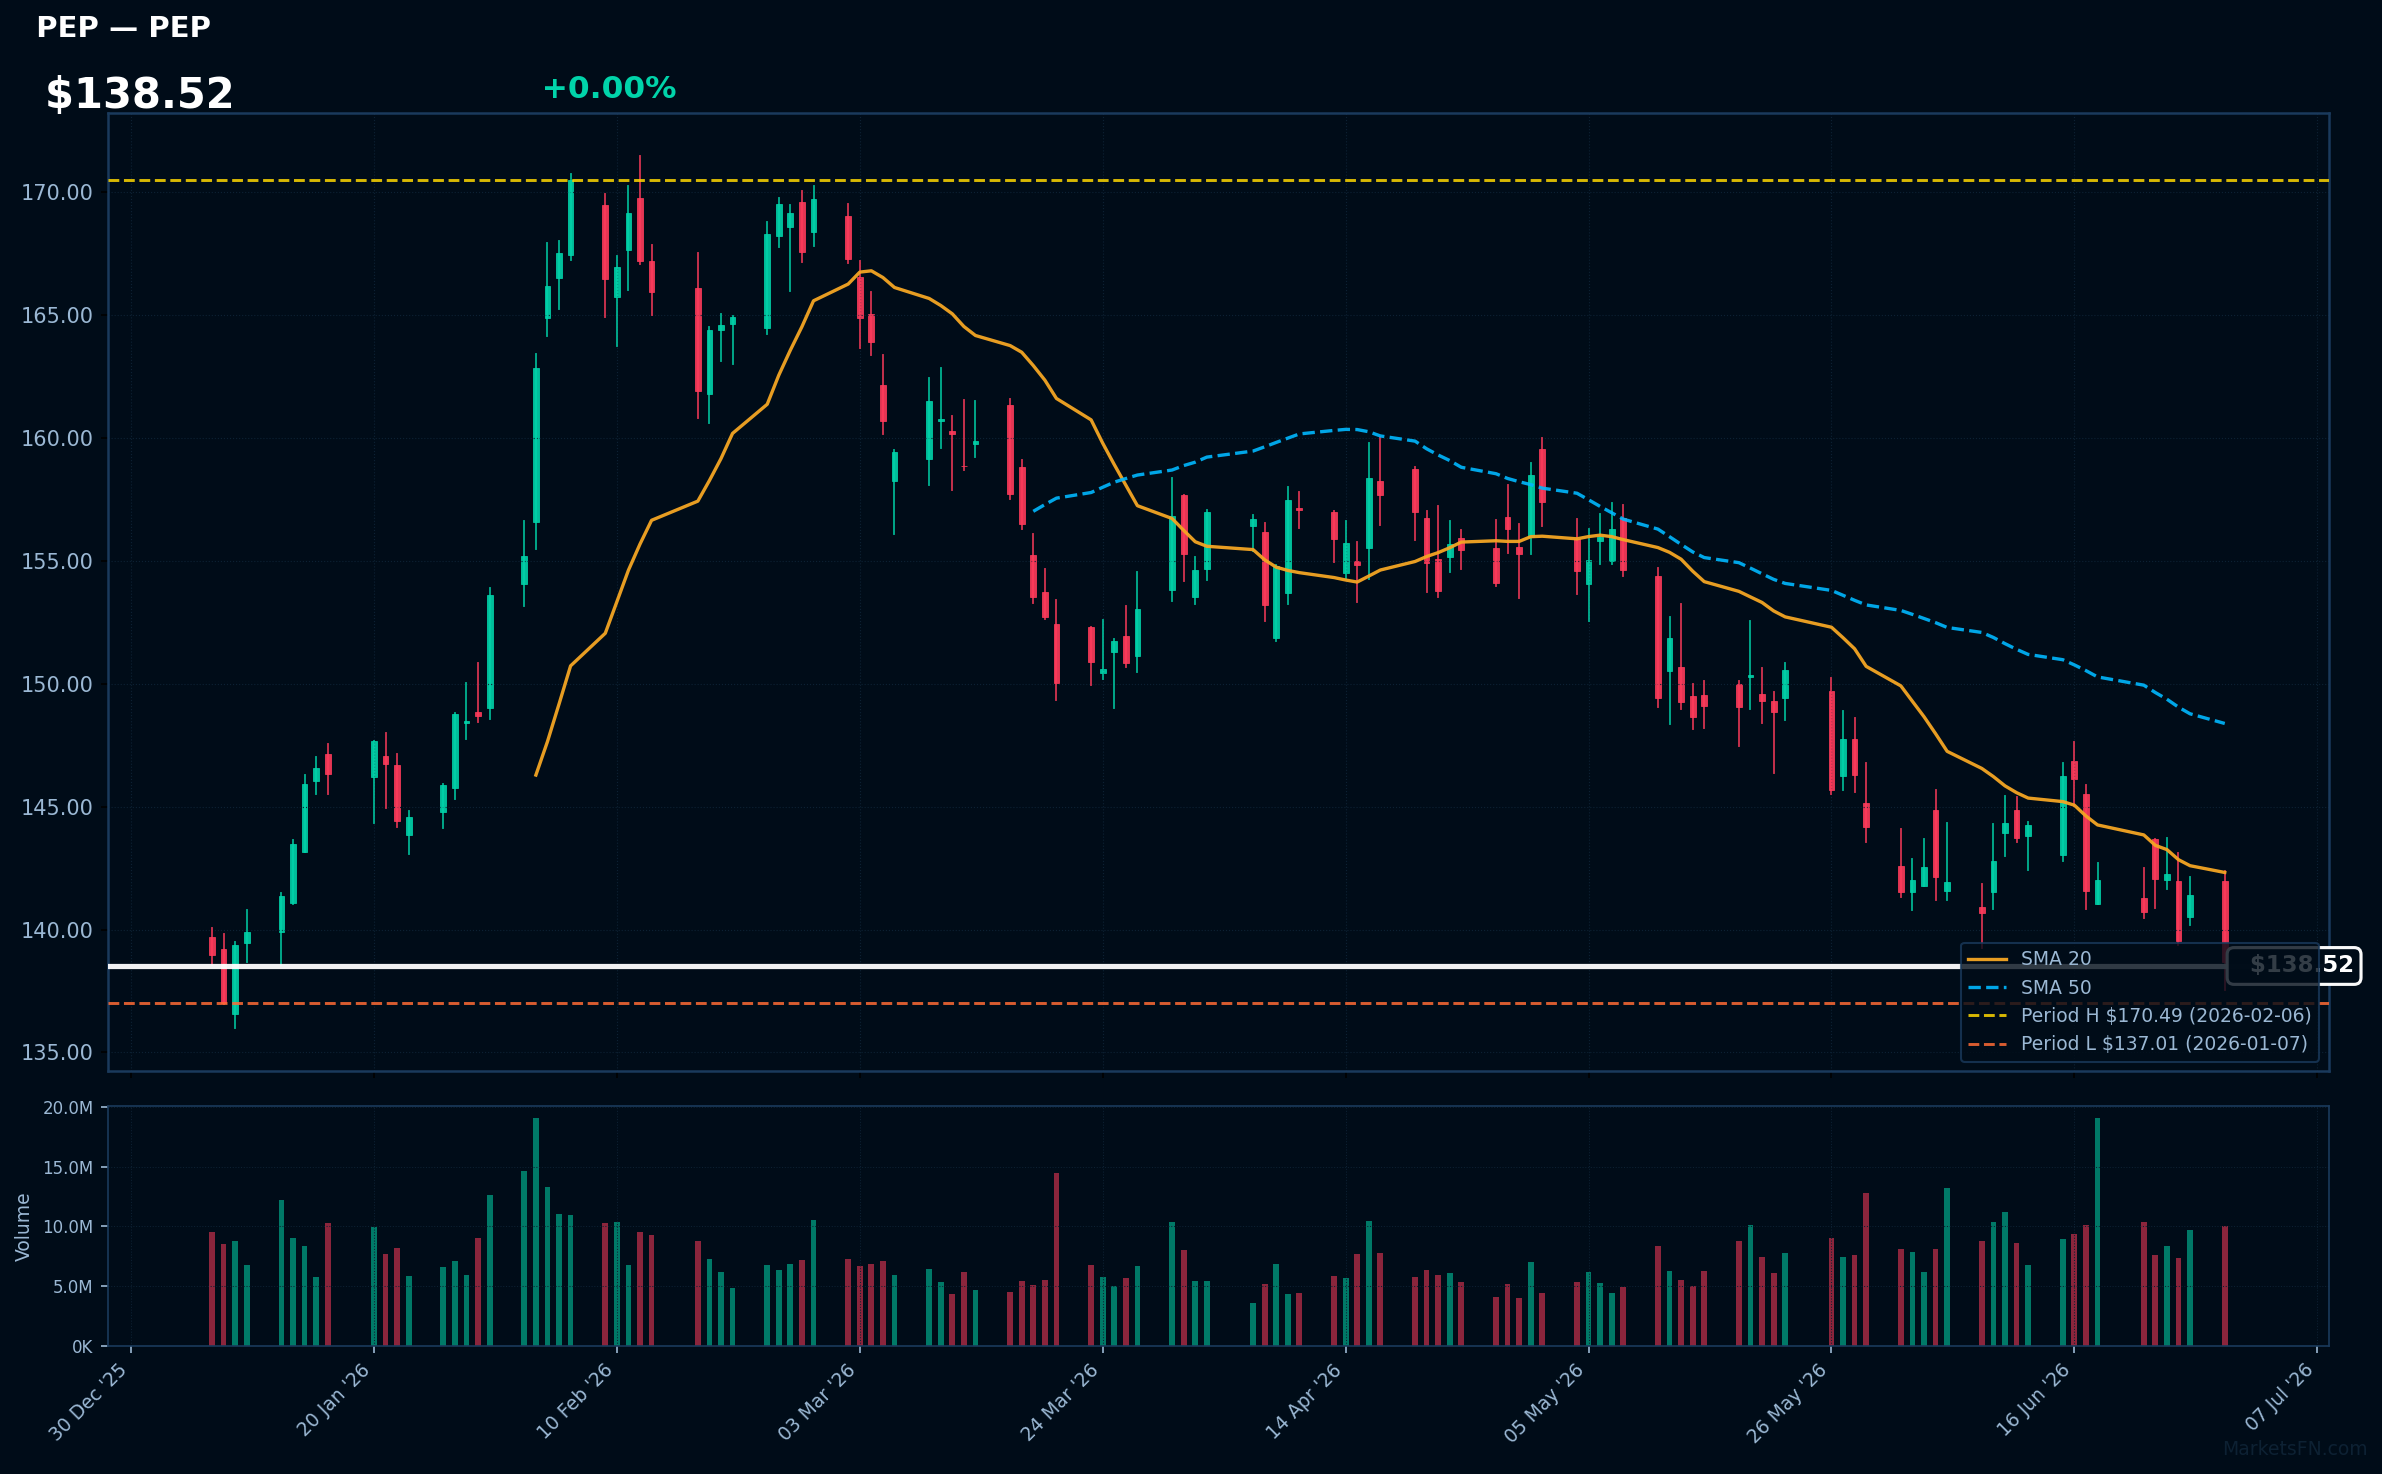
PEP | PepsiCo Inc | Consumer Defensive | Price Last: $138.68 | % Realized: -2.50% | RSI: 36.6 | % above MA200: -7.6% | Trend: Below MA20, MA50, MA200
PepsiCo Inc is a diversified food and beverage company with brands like Pepsi, Lay's, and Gatorade, generating revenue through beverage sales, snack foods, and other categories. Investors care about its performance due to its market presence and dividend yield.
PepsiCo Inc's current technical situation indicates a sustained downtrend with price ($138.52) below MA20, MA50, and MA200. The RSI(14) is 36.6, nearing oversold territory, and the stock is 1.2% above its 2026 YTD low, testing major support.
Related headlines
- PepsiCo Q2 earnings expected to reflect weakness in North American snack business, delayed recovery
- Hershey taps PepsiCo executive for US president role
- PepsiCo: Growth Initiatives, Margin Expansion, and Attractively Valued
- Compeer Financial Collaborates with PepsiCo to Provide Strip-Till Equipment Financing
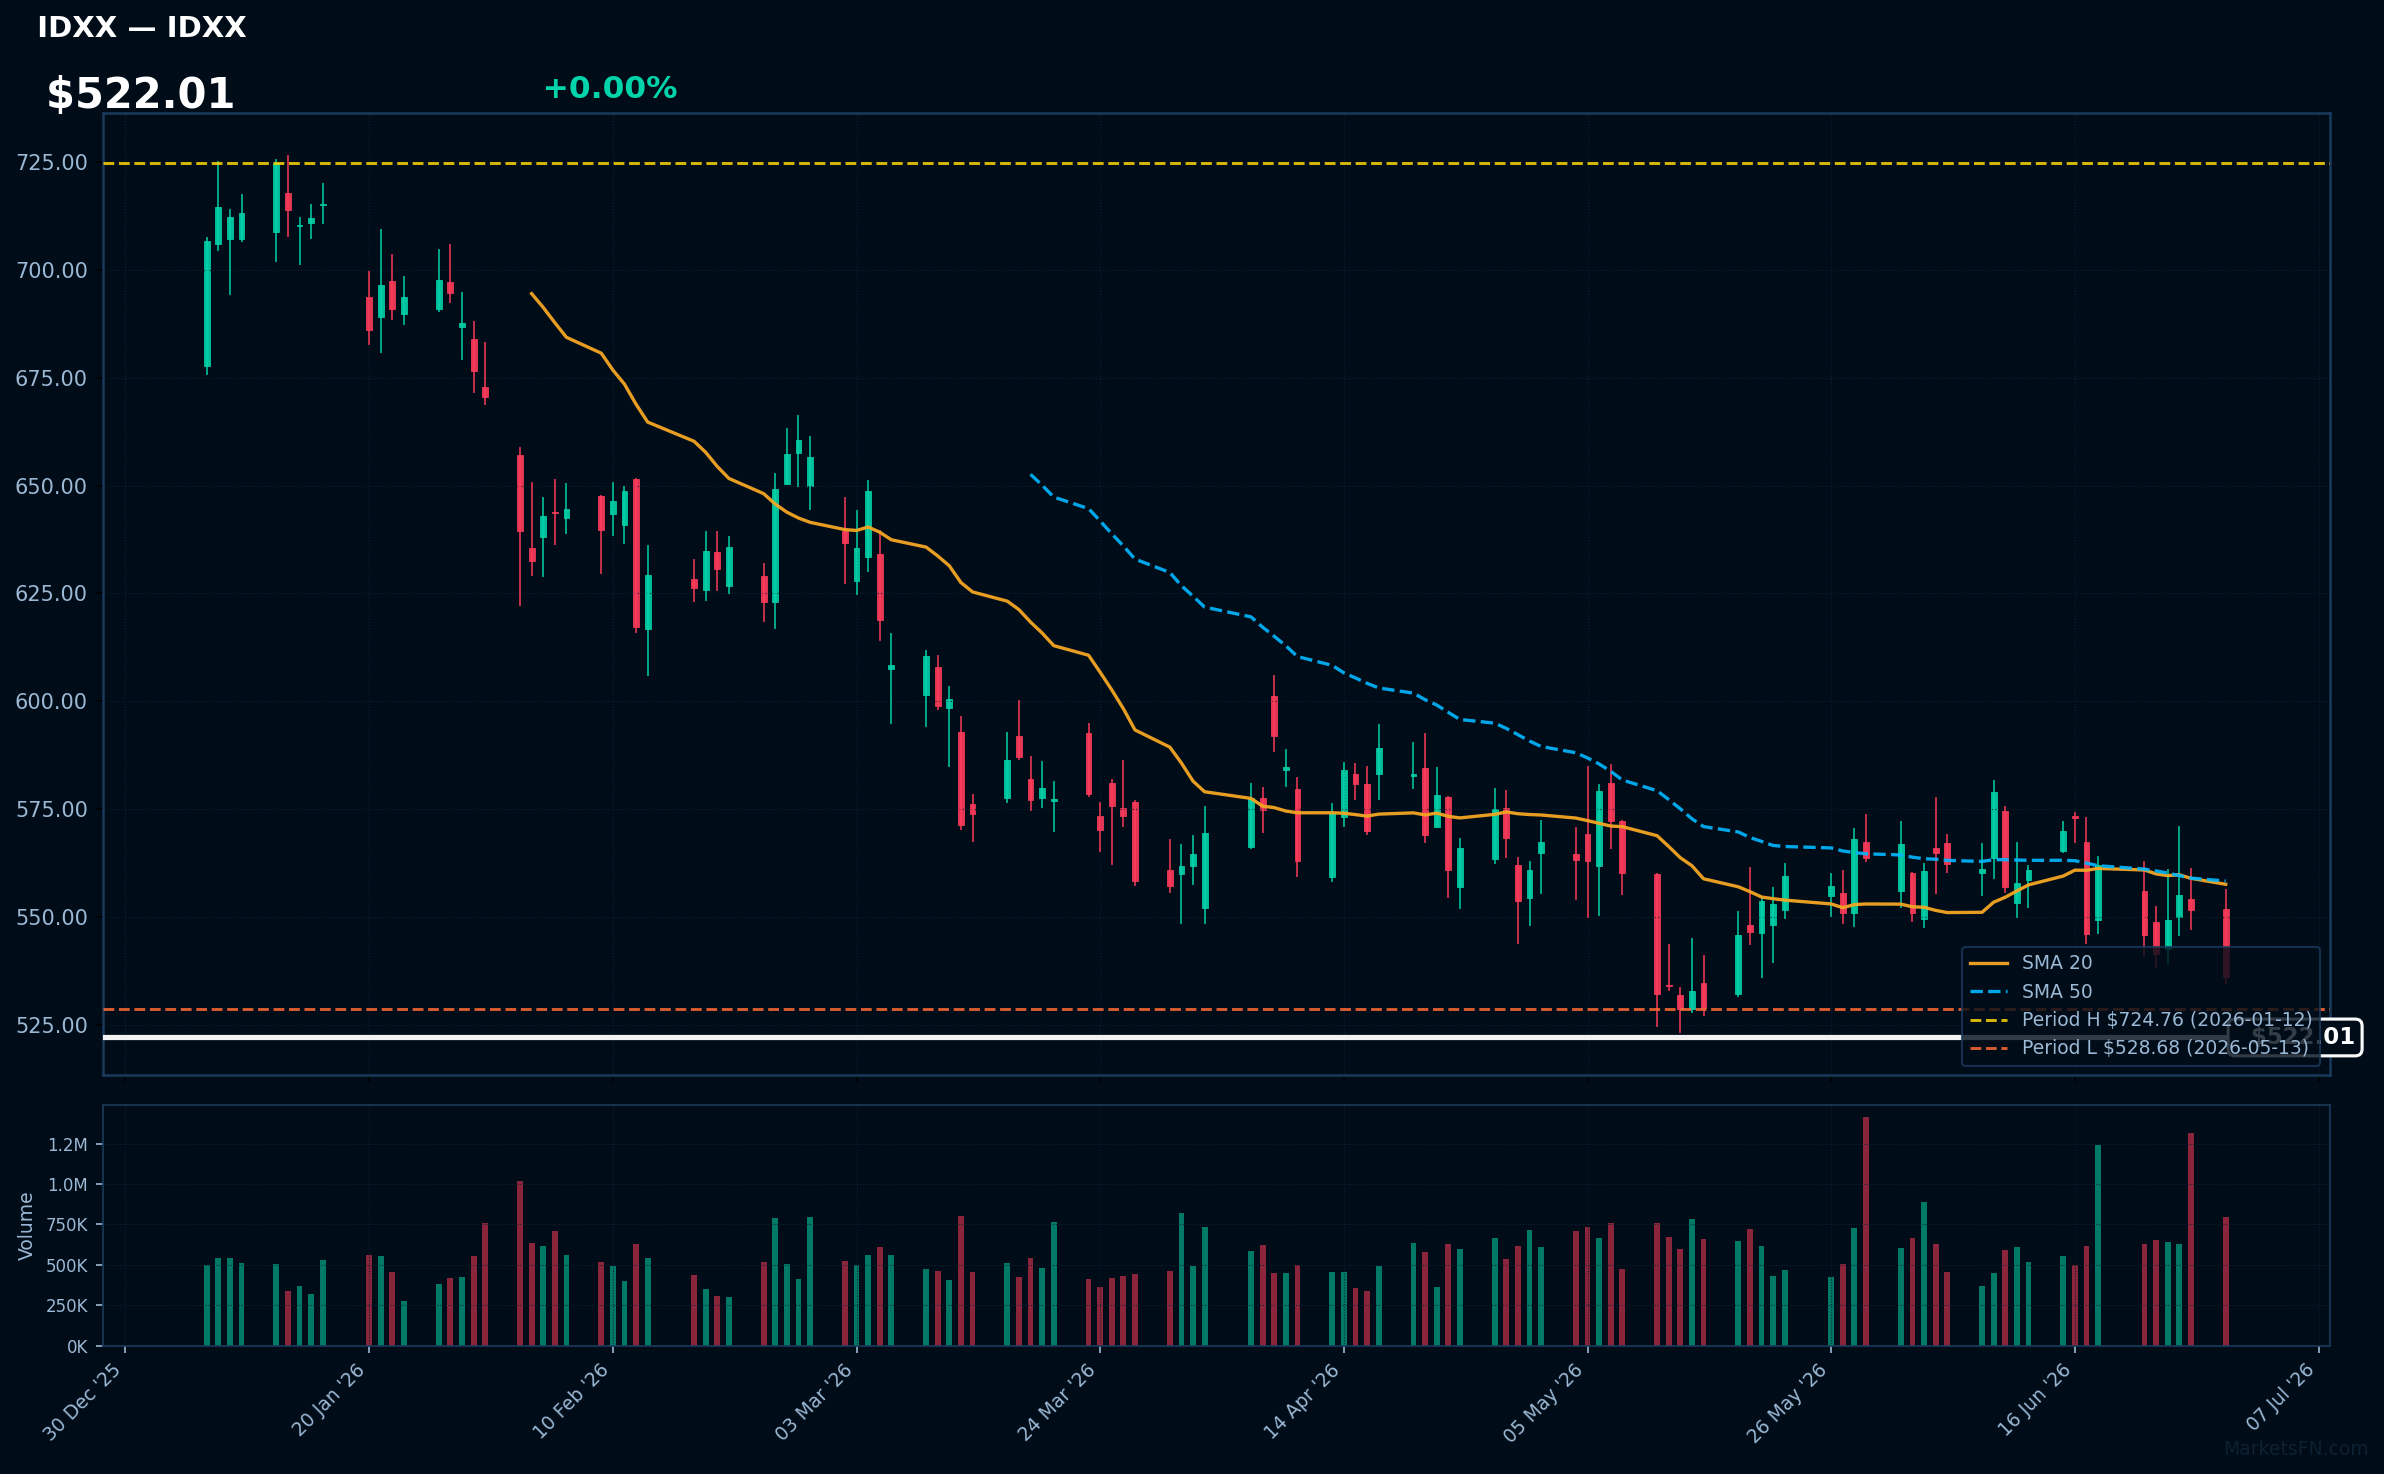
IDXX | Idexx Laboratories, Inc | Healthcare | Price Last: $535.93 | % Realized: -20.01% | RSI: 37.5 | % above MA200: -14.8% | Trend: Below MA20, MA50, MA200
Idexx Laboratories, Inc is a veterinary diagnostics company providing testing solutions and companion animal care products. Investors should care due to its dominant market position and growth prospects driven by increasing pet ownership and advancements in animal healthcare technology.
IDXX is in a sustained downtrend with price ($522.01) below MA20, MA50, and MA200. The RSI(14) is 37.5, nearing oversold territory. The stock is 1.4% above its 2026 YTD low, testing major support, with a -20.0% return over the 2026 YTD period, indicating potential further downside.
Related headlines
Market Commentary
The Nasdaq 100 stocks listed are currently trading near their 2026 year-to-date (YTD) extremes, with some at their highs and others at their lows. Stocks like PANW, AMAT, LRCX, KLAC, and VRTX are at their 2026 YTD highs, indicating strong performance, while TMUS, CPRT, and CTSH are at their 2026 YTD lows, suggesting weaker performance.
The technology sector themes driving these moves include semiconductor industry strength, as evidenced by AMAT, LRCX, and KLAC being at their YTD highs. This could be related to demand for chips and semiconductor equipment. Conversely, stocks like TMUS and CTSH are at their YTD lows, potentially indicating concerns in the telecommunications and IT services sectors.
Investors and traders should watch the macroeconomic conditions and sector-specific news that could impact these stocks. For instance, trends in chip demand, technological advancements, and global economic conditions could influence the performance of these stocks. Monitoring the percentage changes above their YTD lows for stocks like PEP and IDXX, which are slightly above their lows, could also provide insights into market sentiment and potential future movements.
Methodology: All 101 Nasdaq 100 constituents screened. Close prices downloaded from 2026-01-01. Period high = highest close since Jan 1 2026; period low = lowest close since Jan 1 2026. Distance = (current price / period extreme − 1) × 100. Technical indicators computed on up to 1 year of daily OHLCV data.
Disclaimer: For informational purposes only. Not investment advice. Past performance is not indicative of future results.