S&P 500 52-Week Highs & Lows Radar: GE Aerospace (GE), T-Mobile US (TMUS) and more
· Stocks · MarketsFN Team
S&P 500 52-Week Highs & Lows Radar: GE Aerospace (GE), T-Mobile US (TMUS) and more
Screening all 503 S&P 500 constituents for stocks nearest to their 52-week high and their 52-week low. Data as of June 30, 2026. % Realized = 52-week total return.
Legend: RSI > 70 = overbought · RSI < 30 = oversold · Green % Realized = positive 52W return · Red = negative.
📈 Nearest to 52-Week High
Sectors represented: Technology (4), Industrials (1)
| Ticker | Company | Sector | Price Last | % Realized | 52-Week High Date | RSI | % above MA200 | Trend |
|---|---|---|---|---|---|---|---|---|
| GE | GE Aerospace | Industrials | $375.89 | +46.04% | 2026-06-30 | 75.4 | +21.8% | Above MA20, MA50, MA200 |
| APH | Amphenol Corp | Technology | $171.72 | +73.89% | 2026-06-30 | 68.6 | +24.1% | Above MA20, MA50, MA200 |
| PANW | Palo Alto Networks Inc | Technology | $341.00 | +66.63% | 2026-06-30 | 79.5 | +70.5% | Above MA20, MA50, MA200 |
| AMAT | Applied Materials Inc | Technology | $724.65 | +295.83% | 2026-06-30 | 72.4 | +116.5% | Above MA20, MA50, MA200 |
| LRCX | Lam Research Corp | Technology | $434.53 | +346.40% | 2026-06-30 | 67.2 | +97.2% | Above MA20, MA50, MA200 |
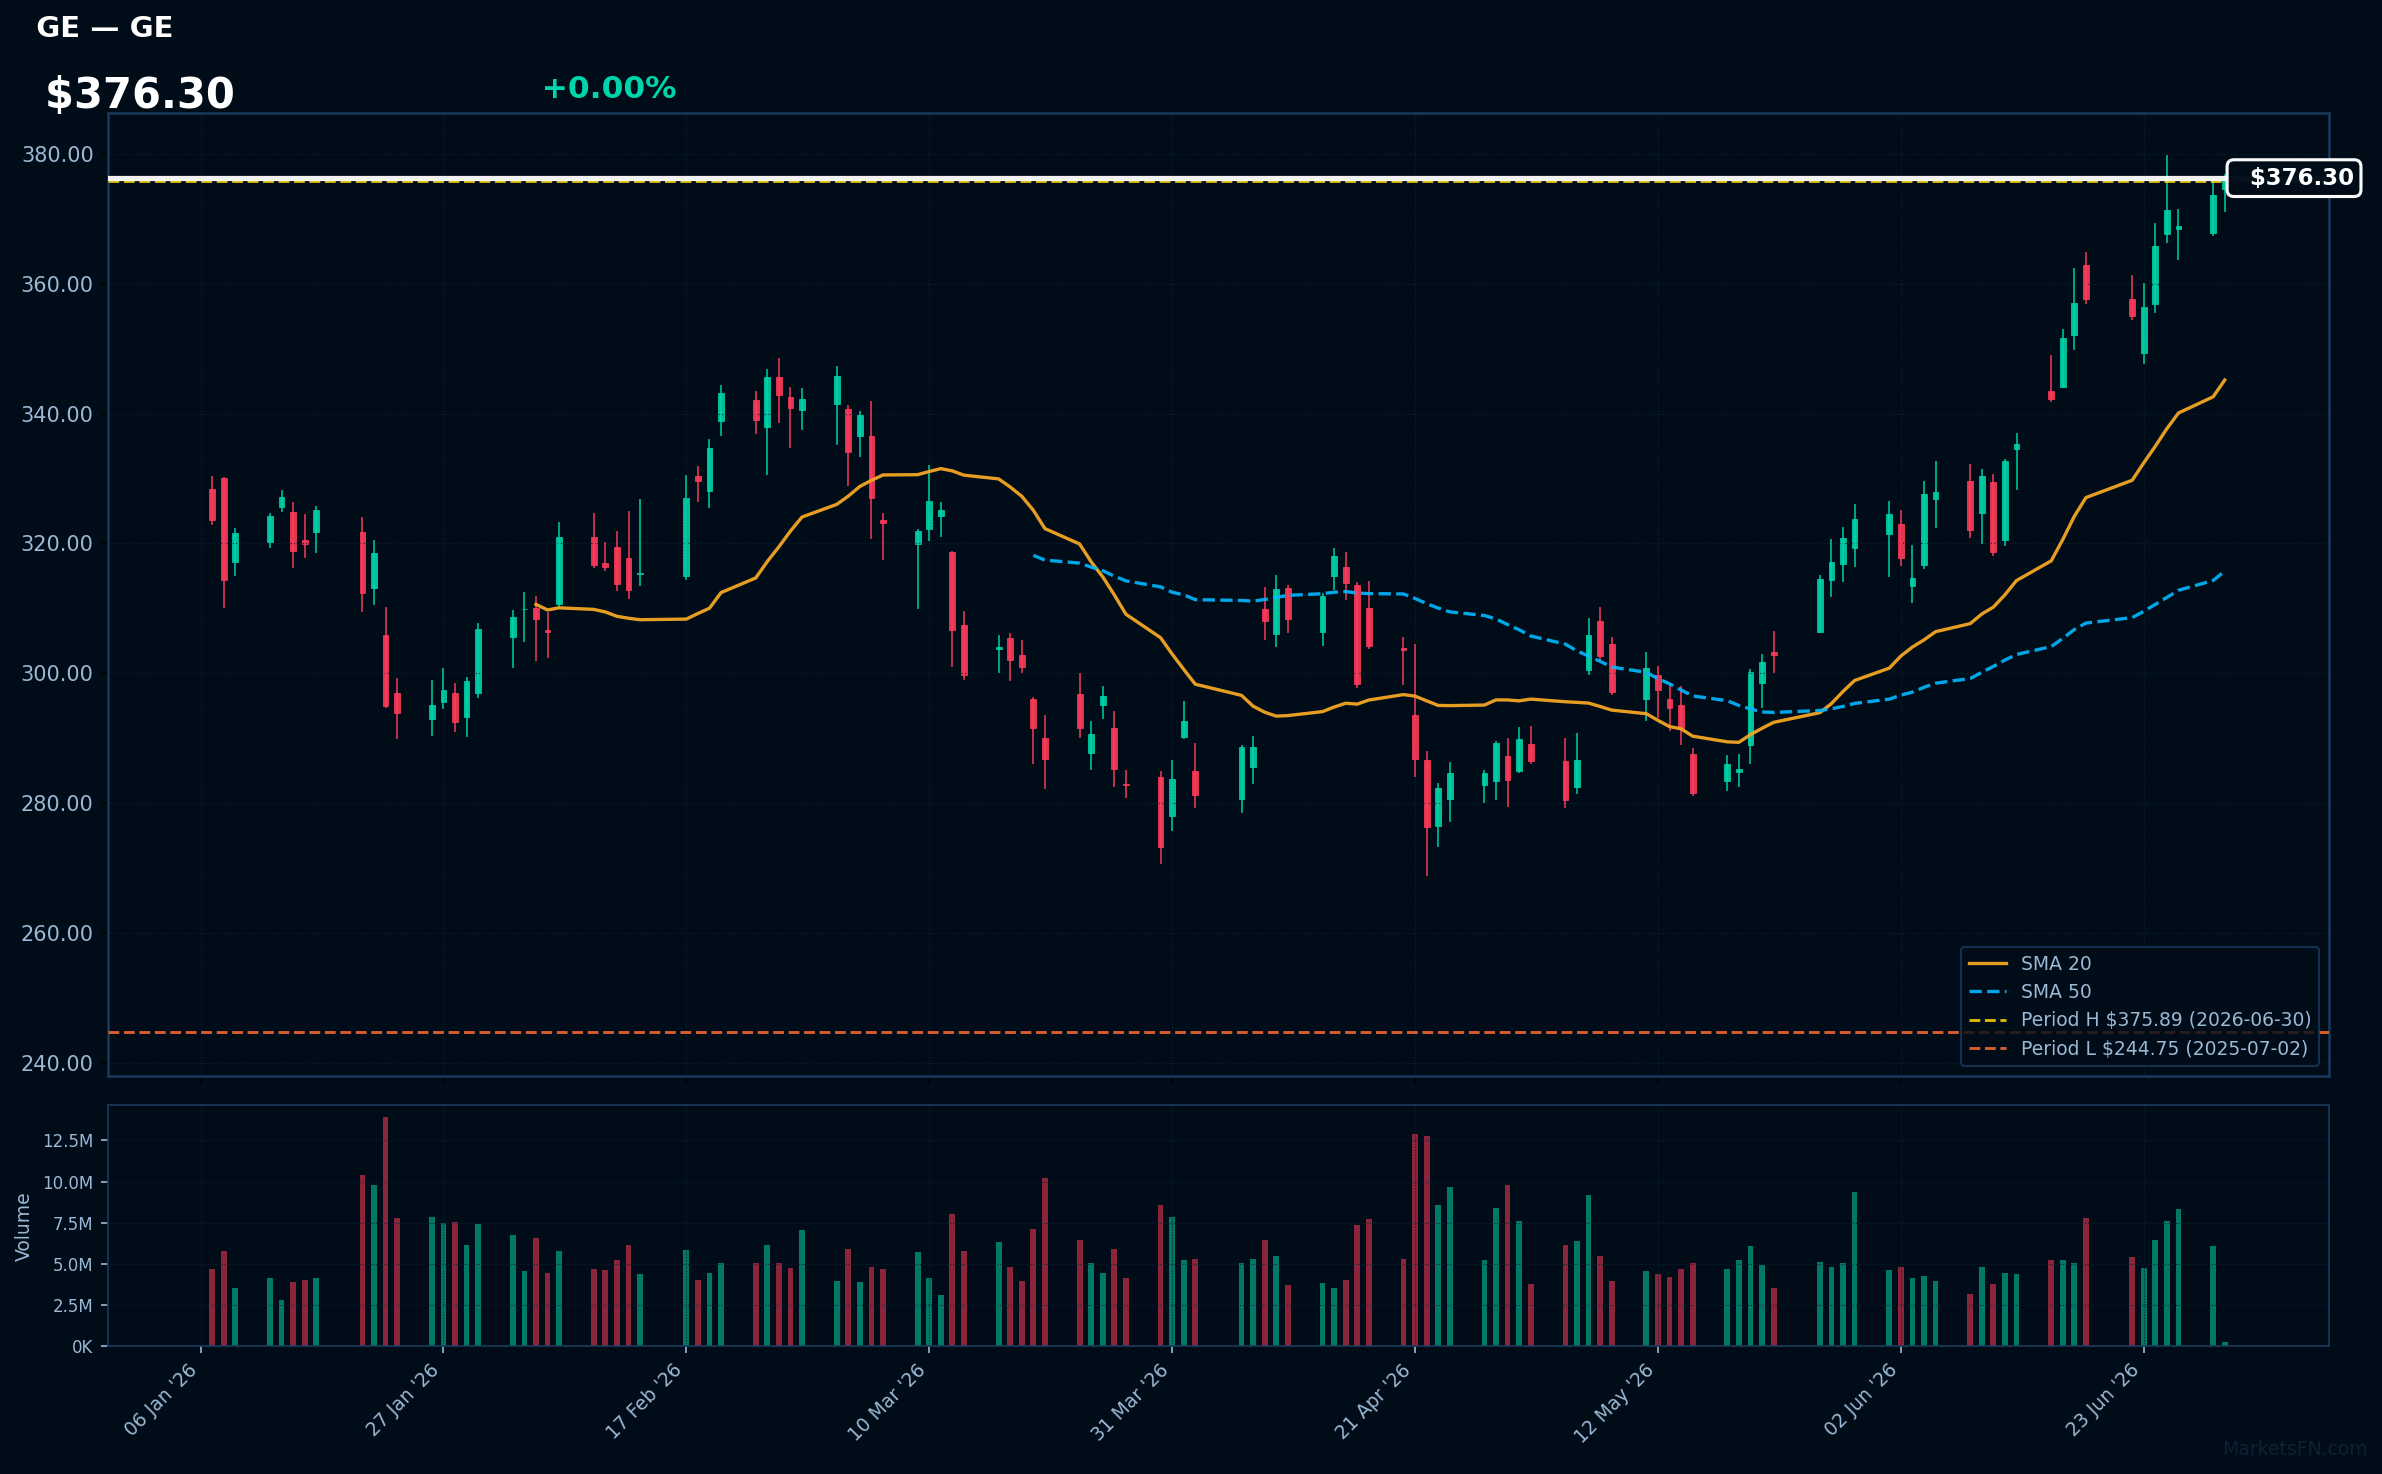
GE | GE Aerospace | Industrials | Price Last: $375.89 | % Realized: +46.04% | RSI: 75.4 | % above MA200: +21.8% | Trend: Above MA20, MA50, MA200
GE Aerospace is a leader in the aerospace industry, manufacturing commercial and military jet engines, and providing related services. Investors should care about its technological advancements, market share, and aftermarket services, which drive revenue and profitability.
GE Aerospace's RSI(14) is 75.4, indicating strong momentum with price > MA20 > MA50 > MA200, a bullish alignment. The stock is 0.0% below its 52-Week high, near a potential breakout, with a 46.0% 52-Week return, suggesting sustained uptrend.
Related headlines
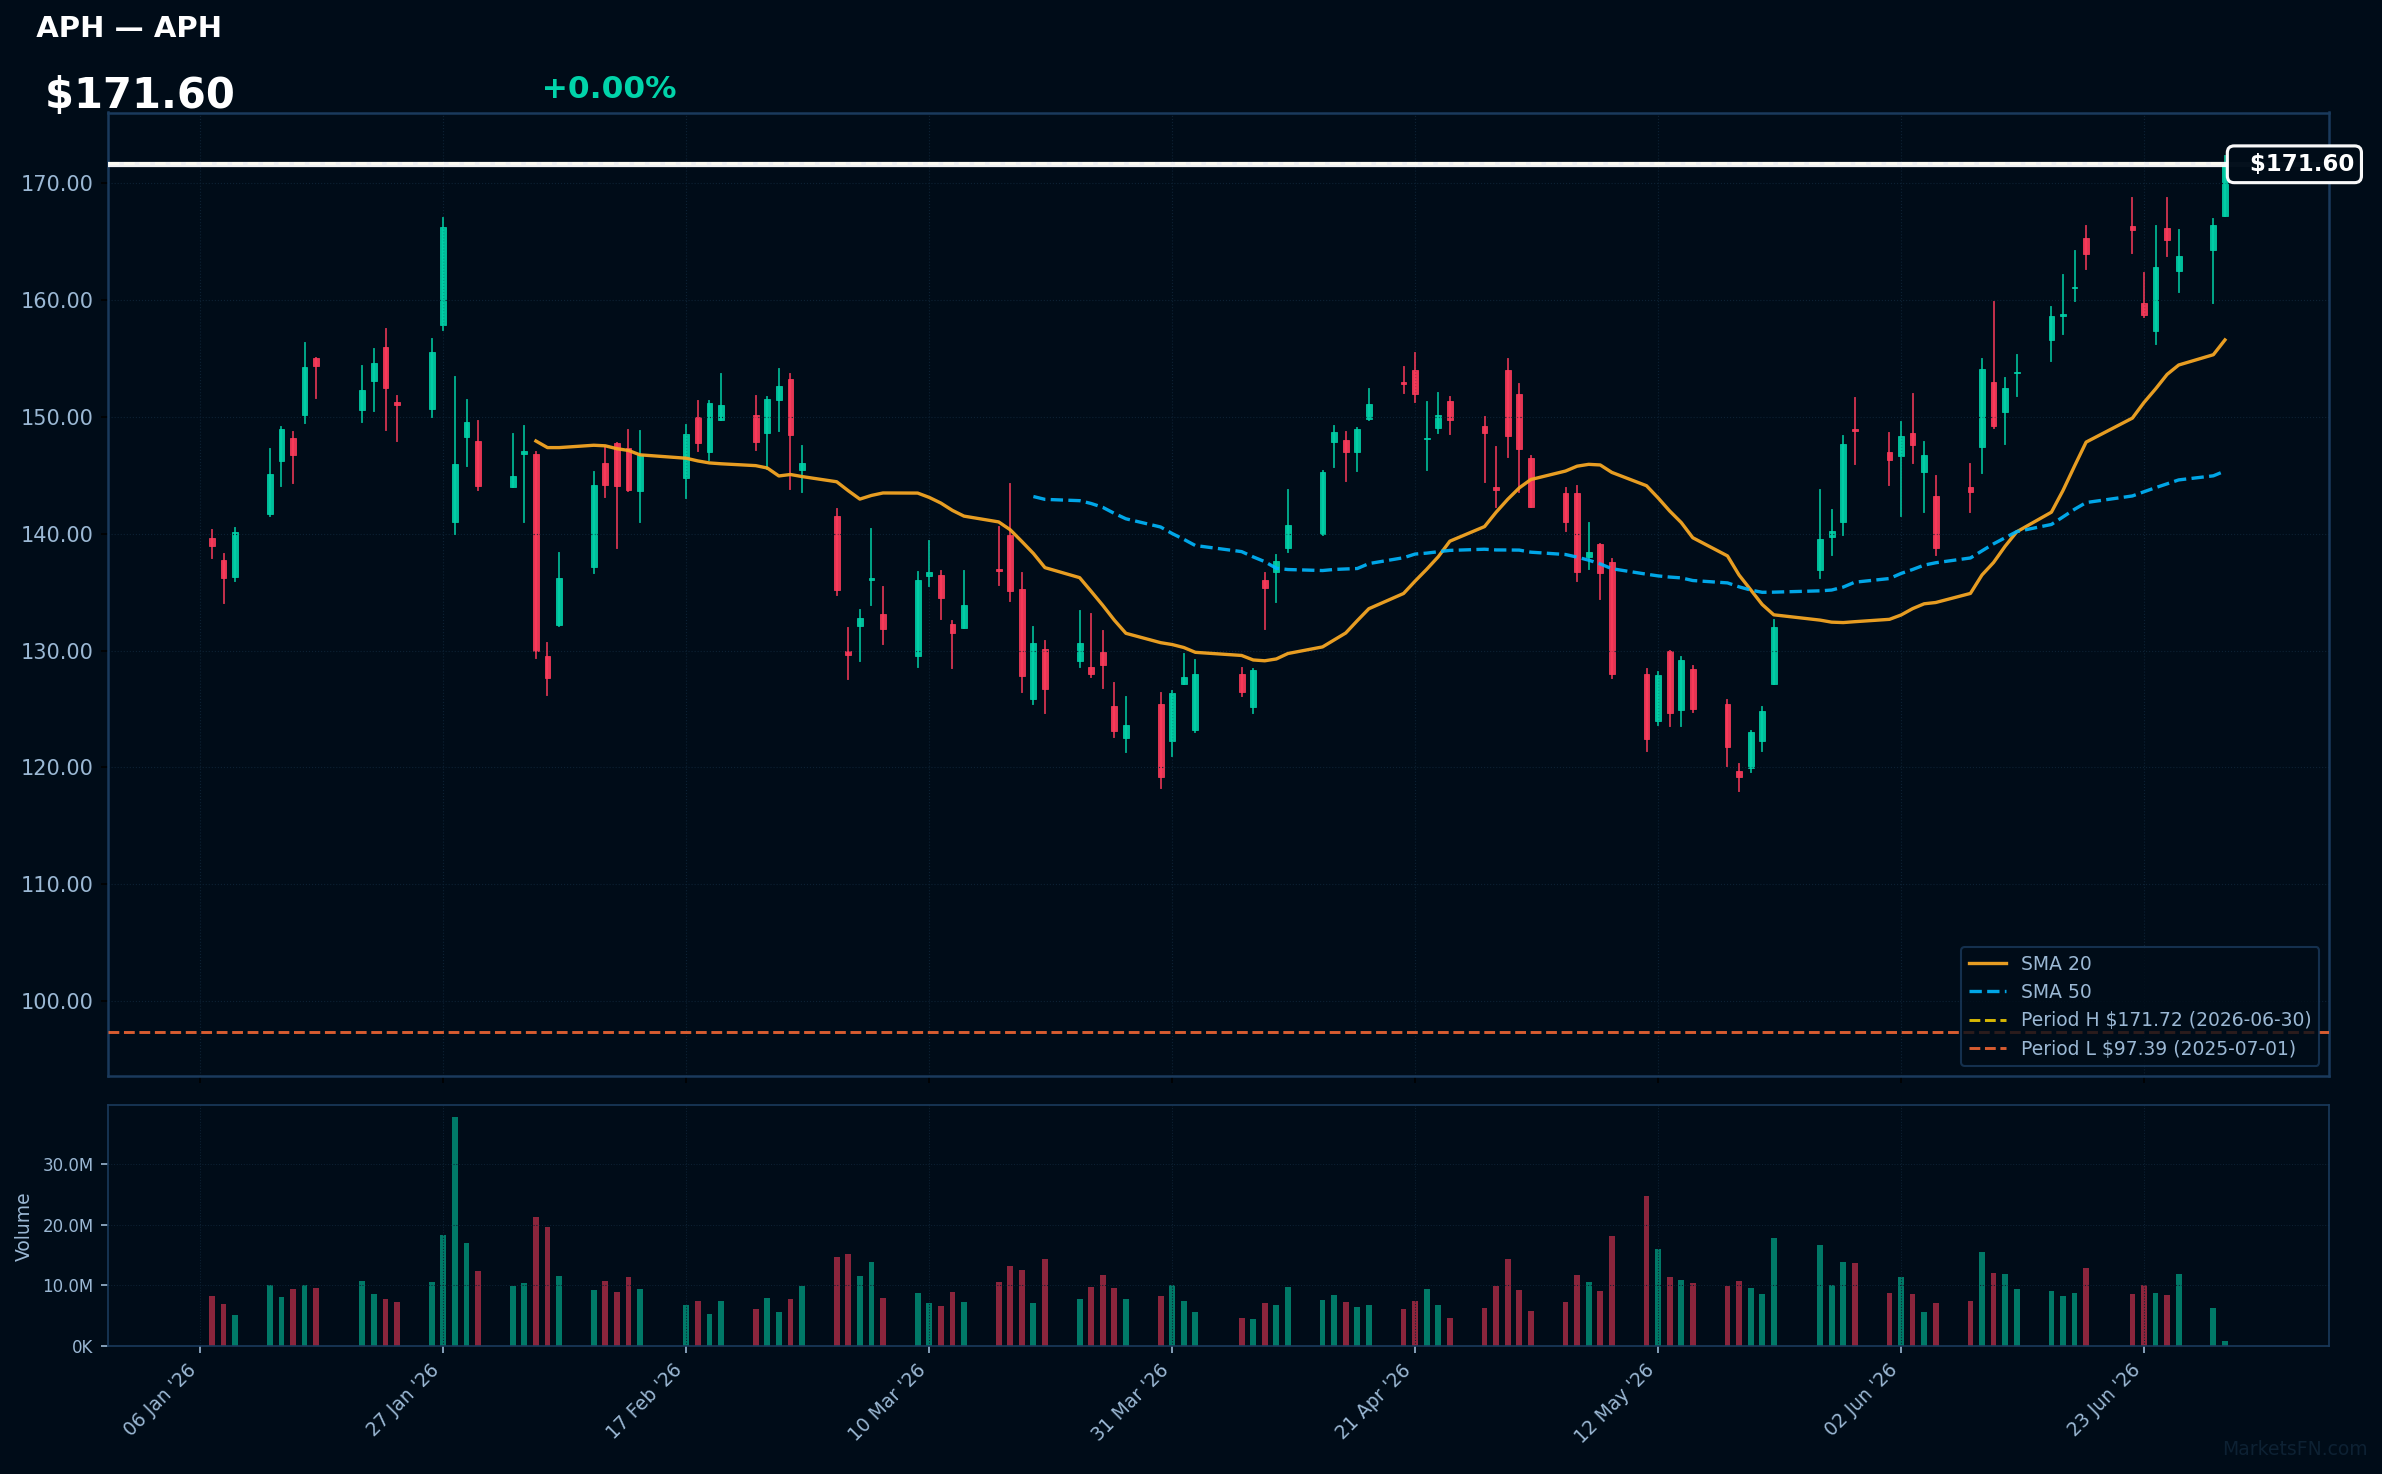
APH | Amphenol Corp | Technology | Price Last: $171.72 | % Realized: +73.89% | RSI: 68.6 | % above MA200: +24.1% | Trend: Above MA20, MA50, MA200
Amphenol Corp designs and manufactures interconnect products, such as connectors and sensors, used in various industries including aerospace, automotive, and industrial. Investors should care due to the company's exposure to growing demand in these sectors.
Amphenol Corp's RSI(14) is 68.6, indicating rising momentum. The stock is in a sustained uptrend with price > MA20 > MA50 > MA200, and is 0.0% below its 52-Week high, suggesting potential for a breakout.
Related headlines
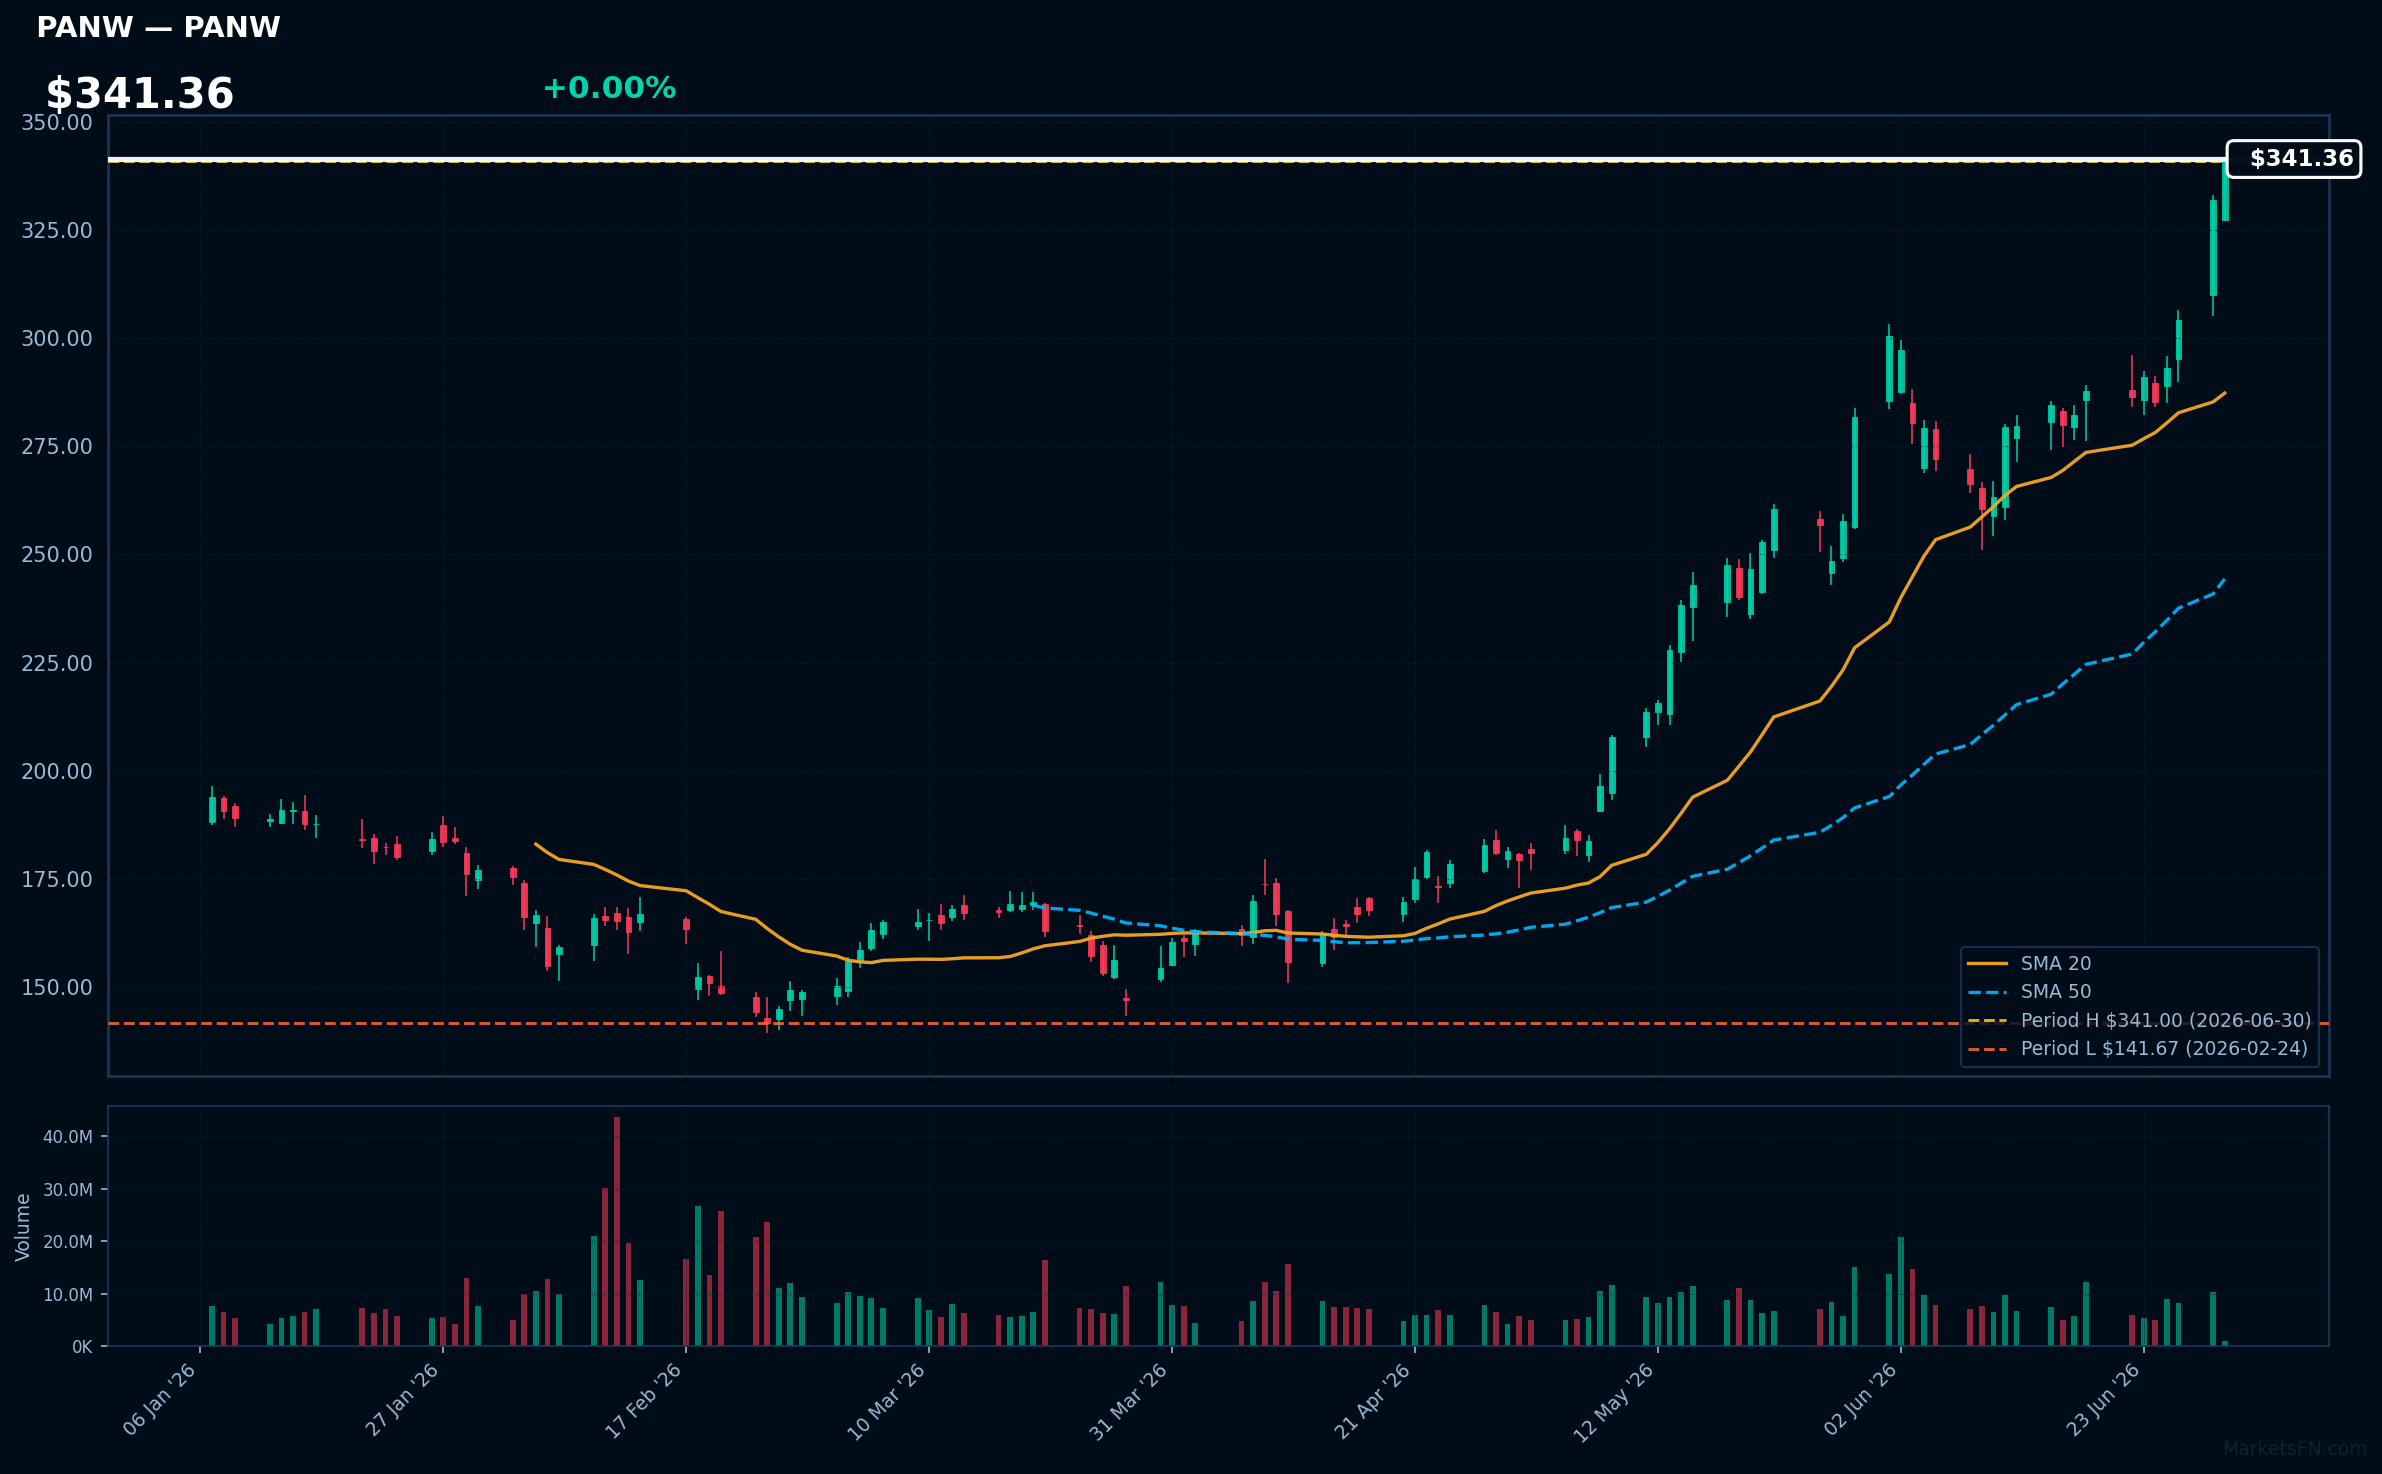
PANW | Palo Alto Networks Inc | Technology | Price Last: $341.00 | % Realized: +66.63% | RSI: 79.5 | % above MA200: +70.5% | Trend: Above MA20, MA50, MA200
Palo Alto Networks Inc is a cybersecurity company providing advanced threat prevention and security solutions. Investors should care due to its strong market position and growth prospects driven by increasing demand for robust cybersecurity measures.
Palo Alto Networks Inc is in a sustained uptrend with price at $341.36, RSI(14) at 79.5, and MA alignment: price > MA20 > MA50 > MA200. The stock is 0.0% below its 52-Week high, indicating potential breakout momentum.
Related headlines
- The Old-School Signal That Lit Up Palo Alto Networks Stock
- Is the Market Totally Wrong About PANW Stock?
- PANW vs CRWD vs AVGO: Morningstar Has A 'Top Pick' Trading At A 40% Discount After Earnings
- Palo Alto Networks and Deutsche Telekom Bring AI-Driven Security with Advanced Sovereignty Controls for European Regulated Industries
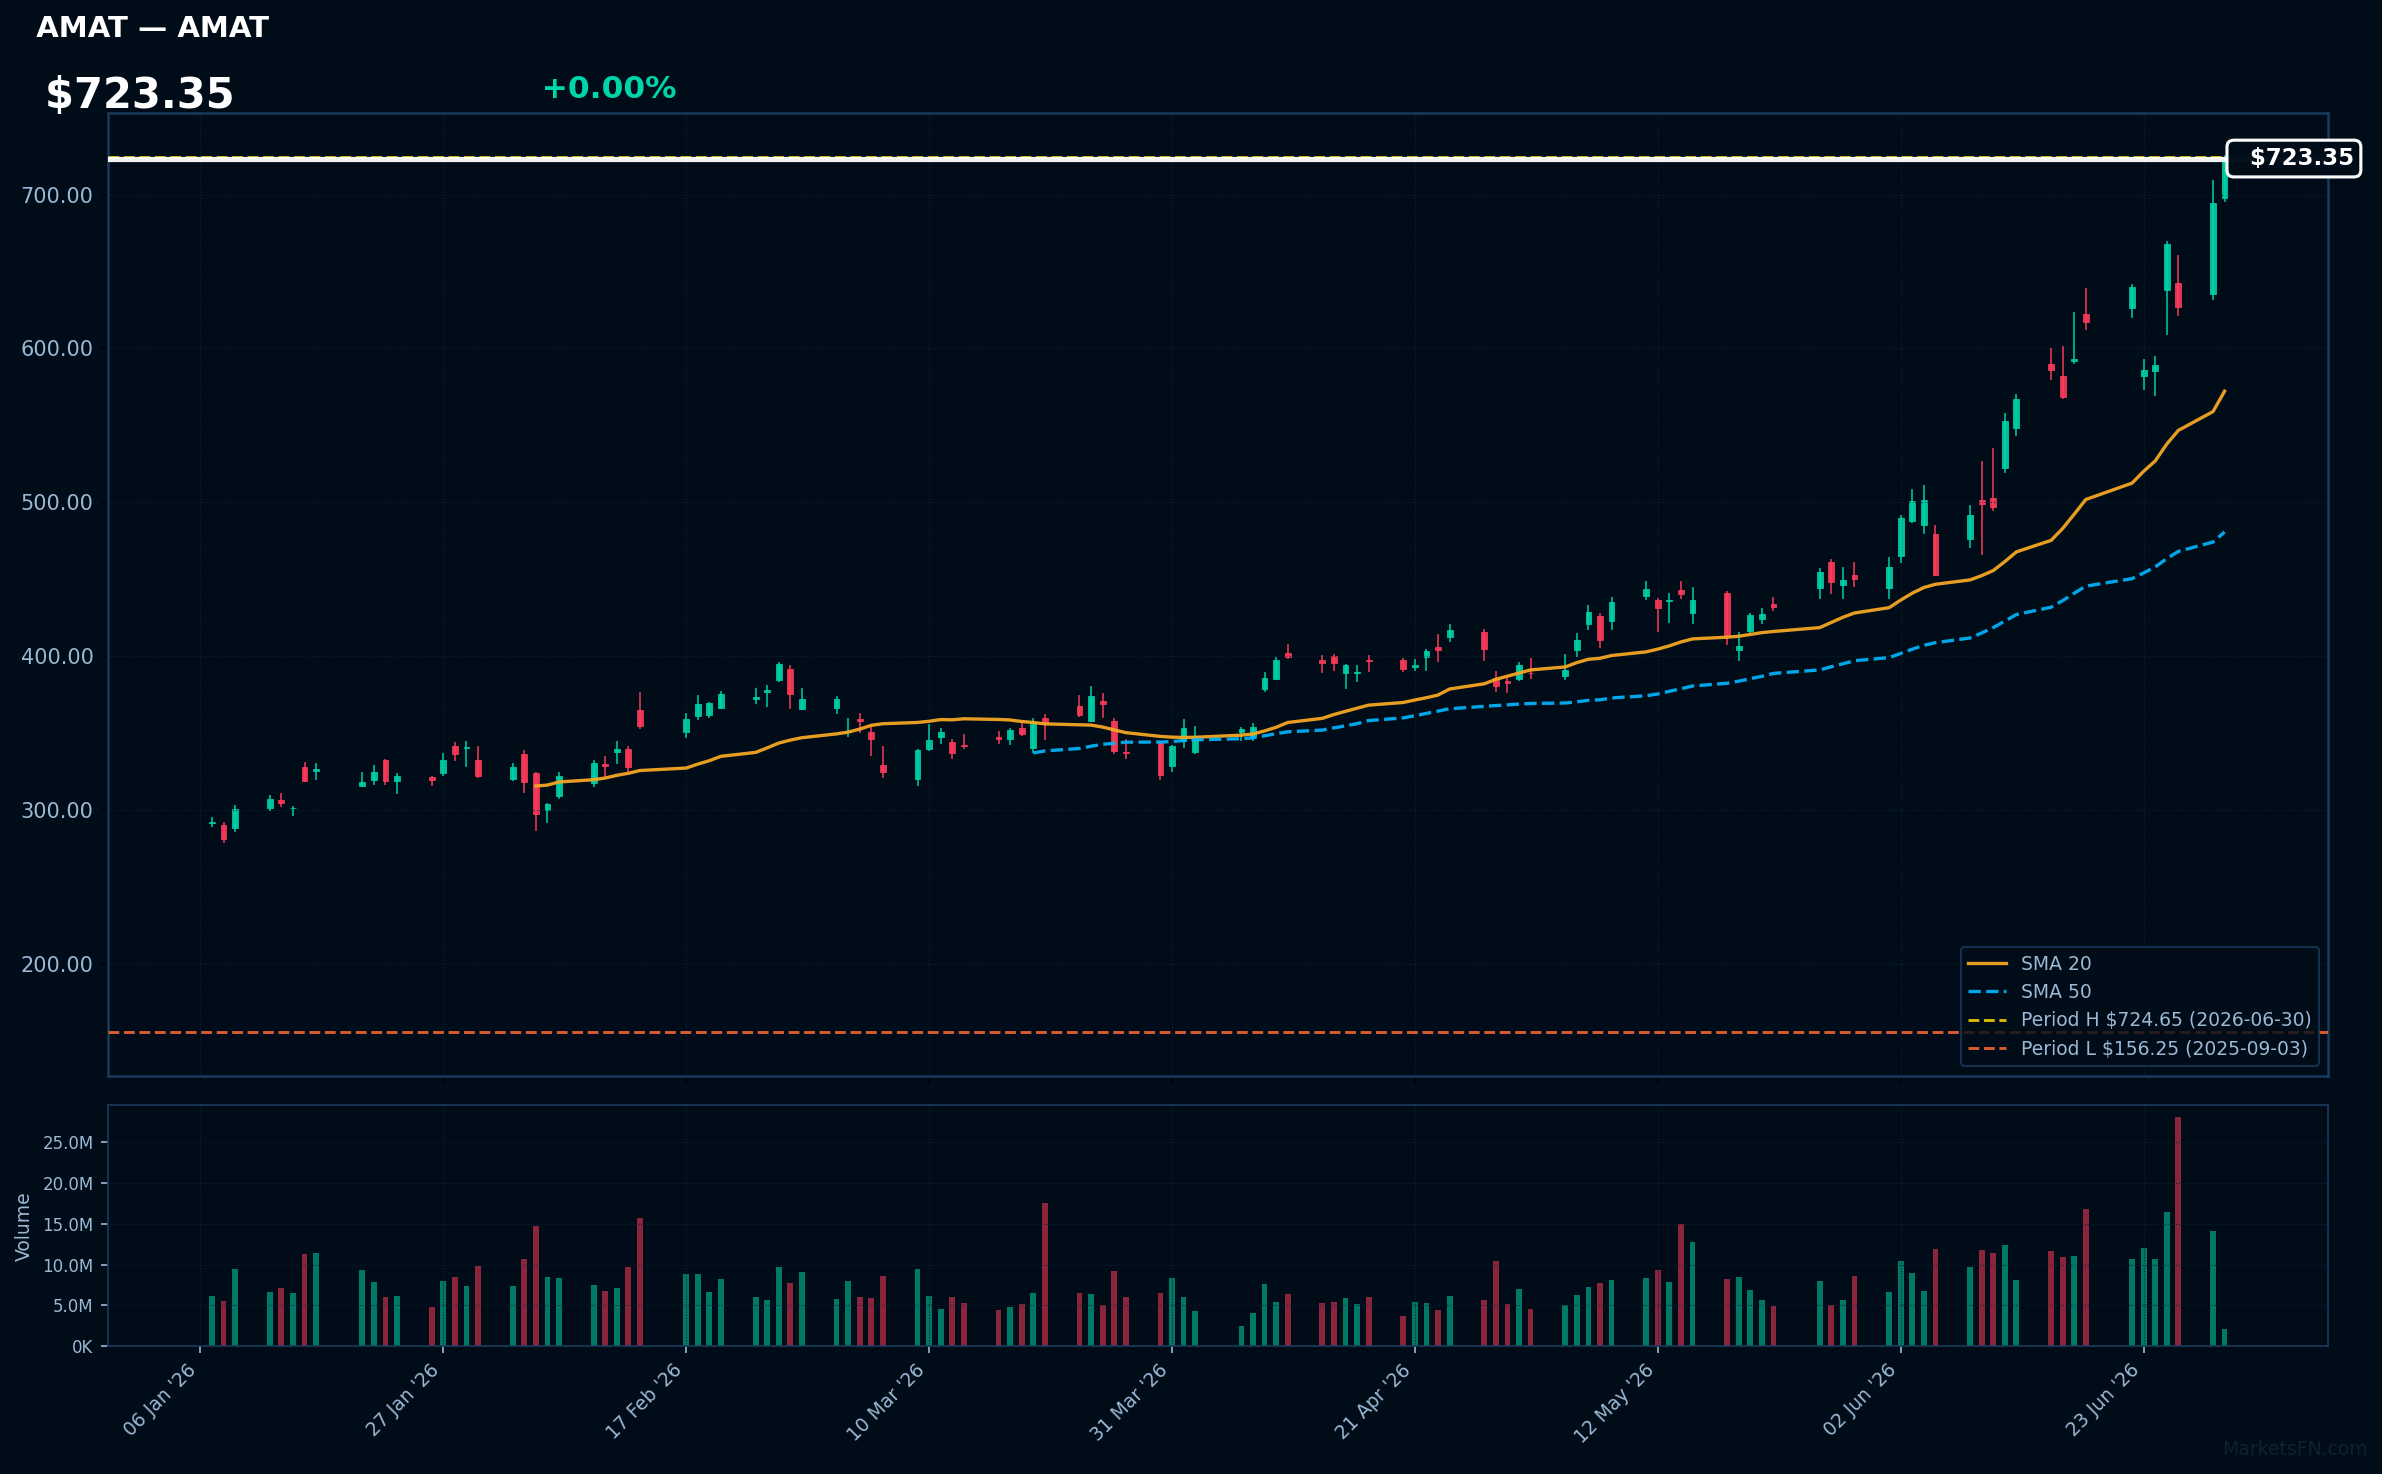
AMAT | Applied Materials Inc | Technology | Price Last: $724.65 | % Realized: +295.83% | RSI: 72.4 | % above MA200: +116.5% | Trend: Above MA20, MA50, MA200
Applied Materials Inc is a semiconductor equipment manufacturer, providing critical tools for chip fabrication. Investors should care because its technology enables advancements in AI, 5G, and other emerging fields, driving growth in the semiconductor industry.
The stock exhibits strong momentum with RSI(14) at 72.4 and a bullish MA alignment (price > MA20 > MA50 > MA200), indicating a sustained uptrend. The stock is 0.0% below its 52-Week high, nearing a potential breakout.
Related headlines
- Applied Materials Inc. stock outperforms competitors on strong trading day
- Applied Materials Stock Hits Record High After Price-Target Hikes
- This Analyst Sees 20% Upside For AMAT Stock Says High Expectations Around Applied Materials Businesses Create Short-Term Risk
- AMAT Stock Gets Thumbs Up From Wall Street Analysts Remain Confident About Applied Materials Strong Market Position
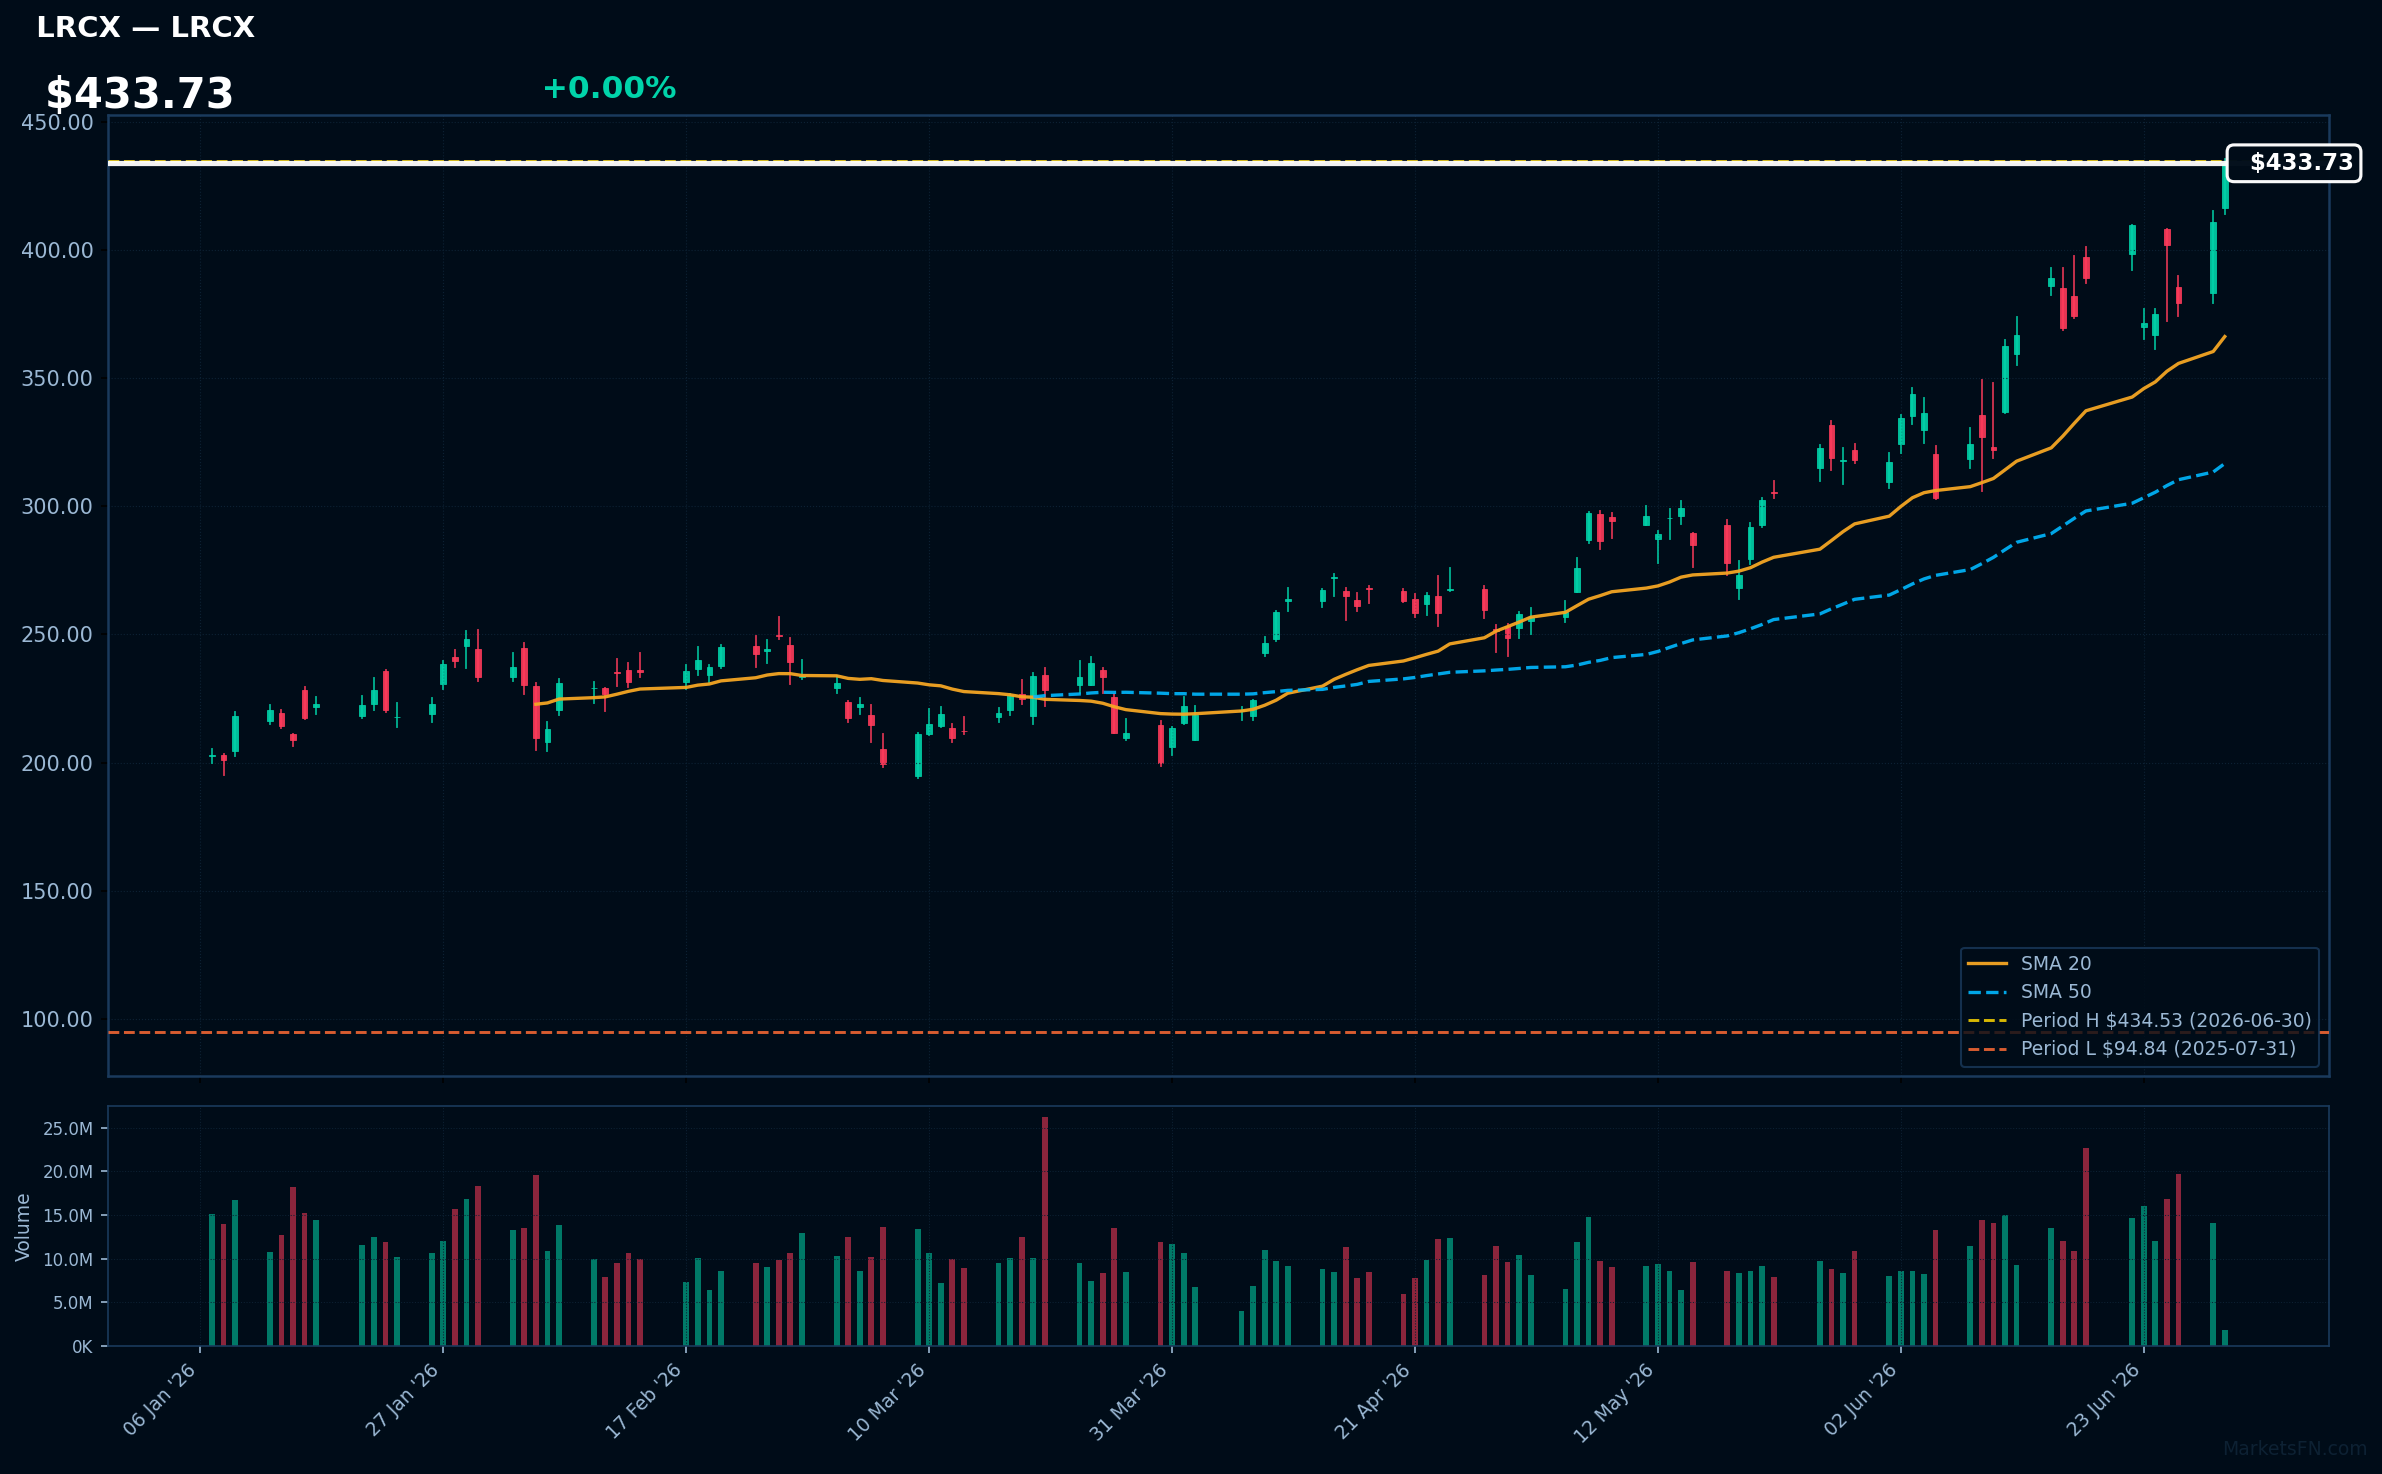
LRCX | Lam Research Corp | Technology | Price Last: $434.53 | % Realized: +346.40% | RSI: 67.2 | % above MA200: +97.2% | Trend: Above MA20, MA50, MA200
Lam Research Corp is a leading supplier of wafer fabrication equipment and services to the semiconductor industry. Investors should care because its products are crucial for chip manufacturing, driving revenue growth tied to industry trends and technological advancements.
LRCX is in a sustained uptrend with price > MA20 > MA50 > MA200, RSI(14) at 67.2, and is 0.0% below its 52-Week high, indicating strong momentum with no immediate signs of reversal, supported by its bullish MA alignment.
Related headlines
📉 Nearest to 52-Week Low
Sectors represented: Communication Services (2), Healthcare (1), Technology (1), Real Estate (1)
| Ticker | Company | Sector | Price Last | % Realized | 52-Week Low Date | RSI | % above MA200 | Trend |
|---|---|---|---|---|---|---|---|---|
| TMUS | T-Mobile US Inc | Communication Services | $167.41 | -29.73% | 2026-06-30 | 30.3 | -18.2% | Below MA20, MA50, MA200 |
| T | AT&T, Inc | Communication Services | $21.16 | -26.90% | 2026-06-30 | 30.7 | -18.1% | Below MA20, MA50, MA200 |
| BSX | Boston Scientific Corp | Healthcare | $42.87 | -60.09% | 2026-06-30 | 25.8 | -45.7% | Below MA20, MA50, MA200 |
| ACN | Accenture plc | Technology | $123.09 | -58.82% | 2026-06-30 | 24.7 | -44.5% | Below MA20, MA50, MA200 |
| AMT | American Tower Corp | Real Estate | $164.77 | -25.45% | 2026-06-30 | 33.9 | -9.2% | Below MA20, MA50, MA200 |
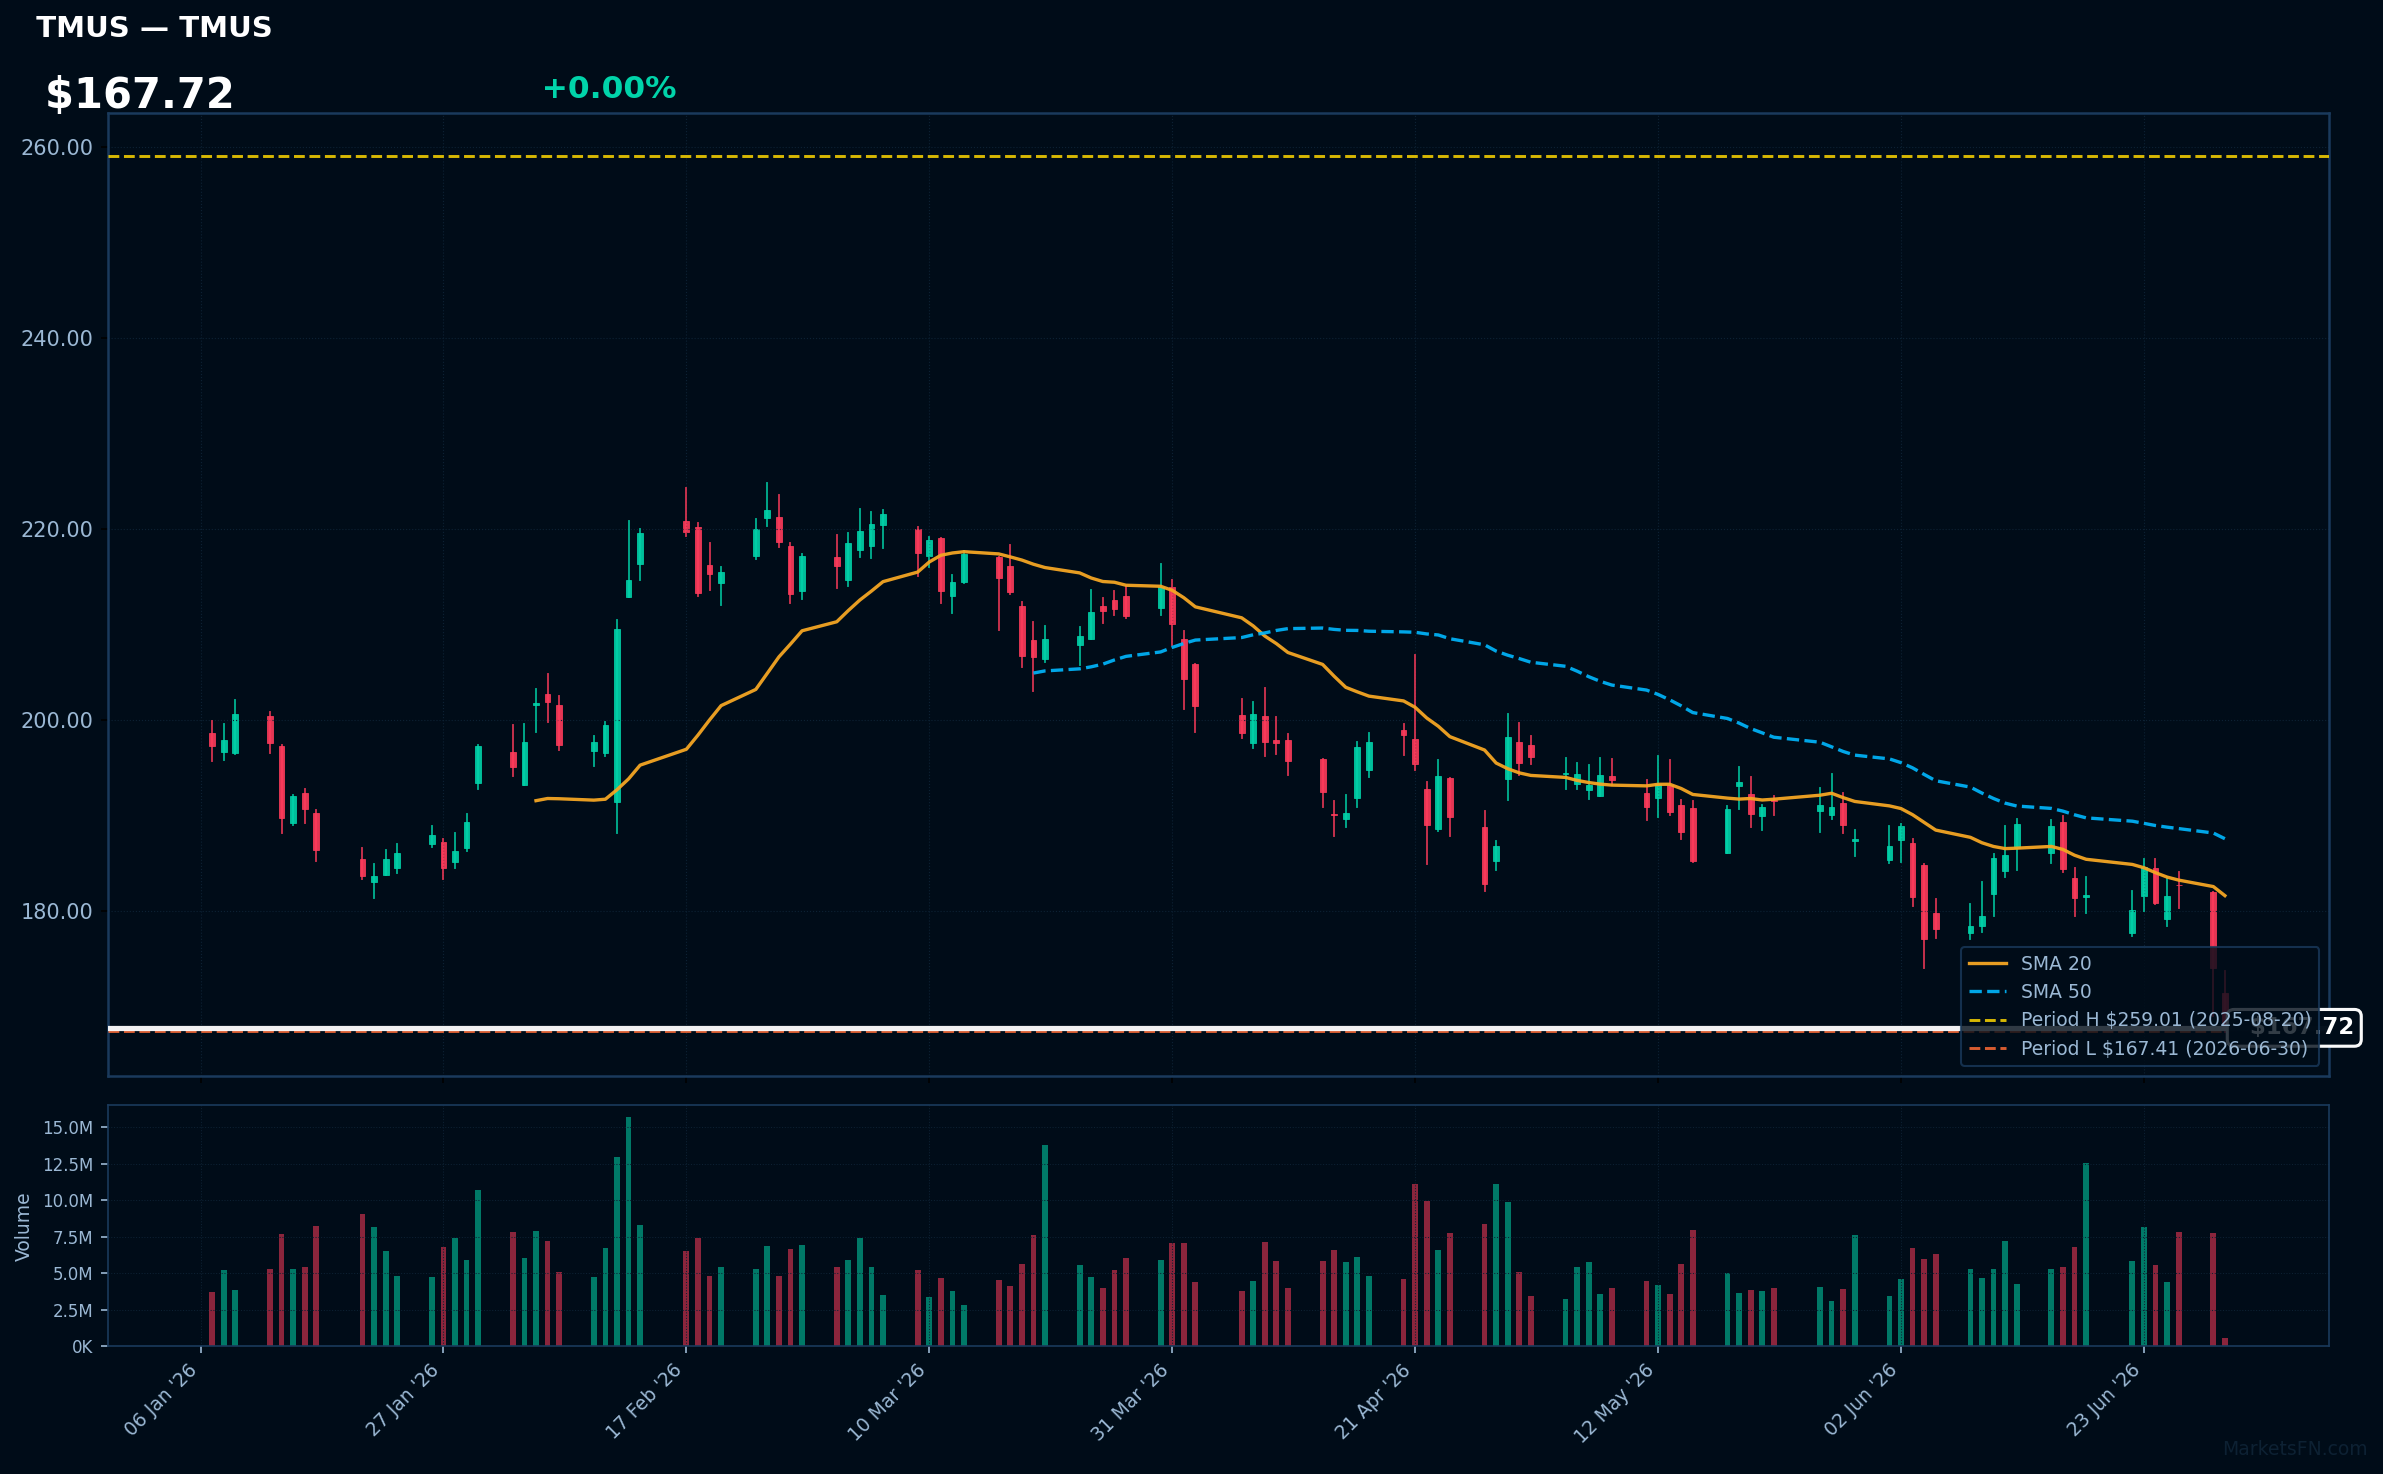
TMUS | T-Mobile US Inc | Communication Services | Price Last: $167.41 | % Realized: -29.73% | RSI: 30.3 | % above MA200: -18.2% | Trend: Below MA20, MA50, MA200
T-Mobile US Inc is a wireless network operator providing mobile services to consumers and businesses. Investors should care about its competitive positioning, 5G rollout, and subscriber growth, as these factors drive revenue and profitability in the telecom sector.
T-Mobile US Inc is in a sustained downtrend with price ($167.72) below MA20, MA50, and MA200. The RSI(14) is 30.3, near oversold territory, and the stock is at its 52-Week low, indicating potential support testing, a warning sign for investors.
Related headlines
- VZ, T, TMUS Shares Under Pressure SpaceX's Starlink Mobile Service Push Rattles Telecom Stocks
- SpaceX Might Bring Mobile Phone to Market, and Verizon, AT&T, and T-Mobile Are Down
- SPCX Stock: SpaceX's Wireless Ambitions Fuel T-Mobile Acquisition Speculation
- T-Mobile to Host Q2 2026 Earnings Call on July 23, 2026
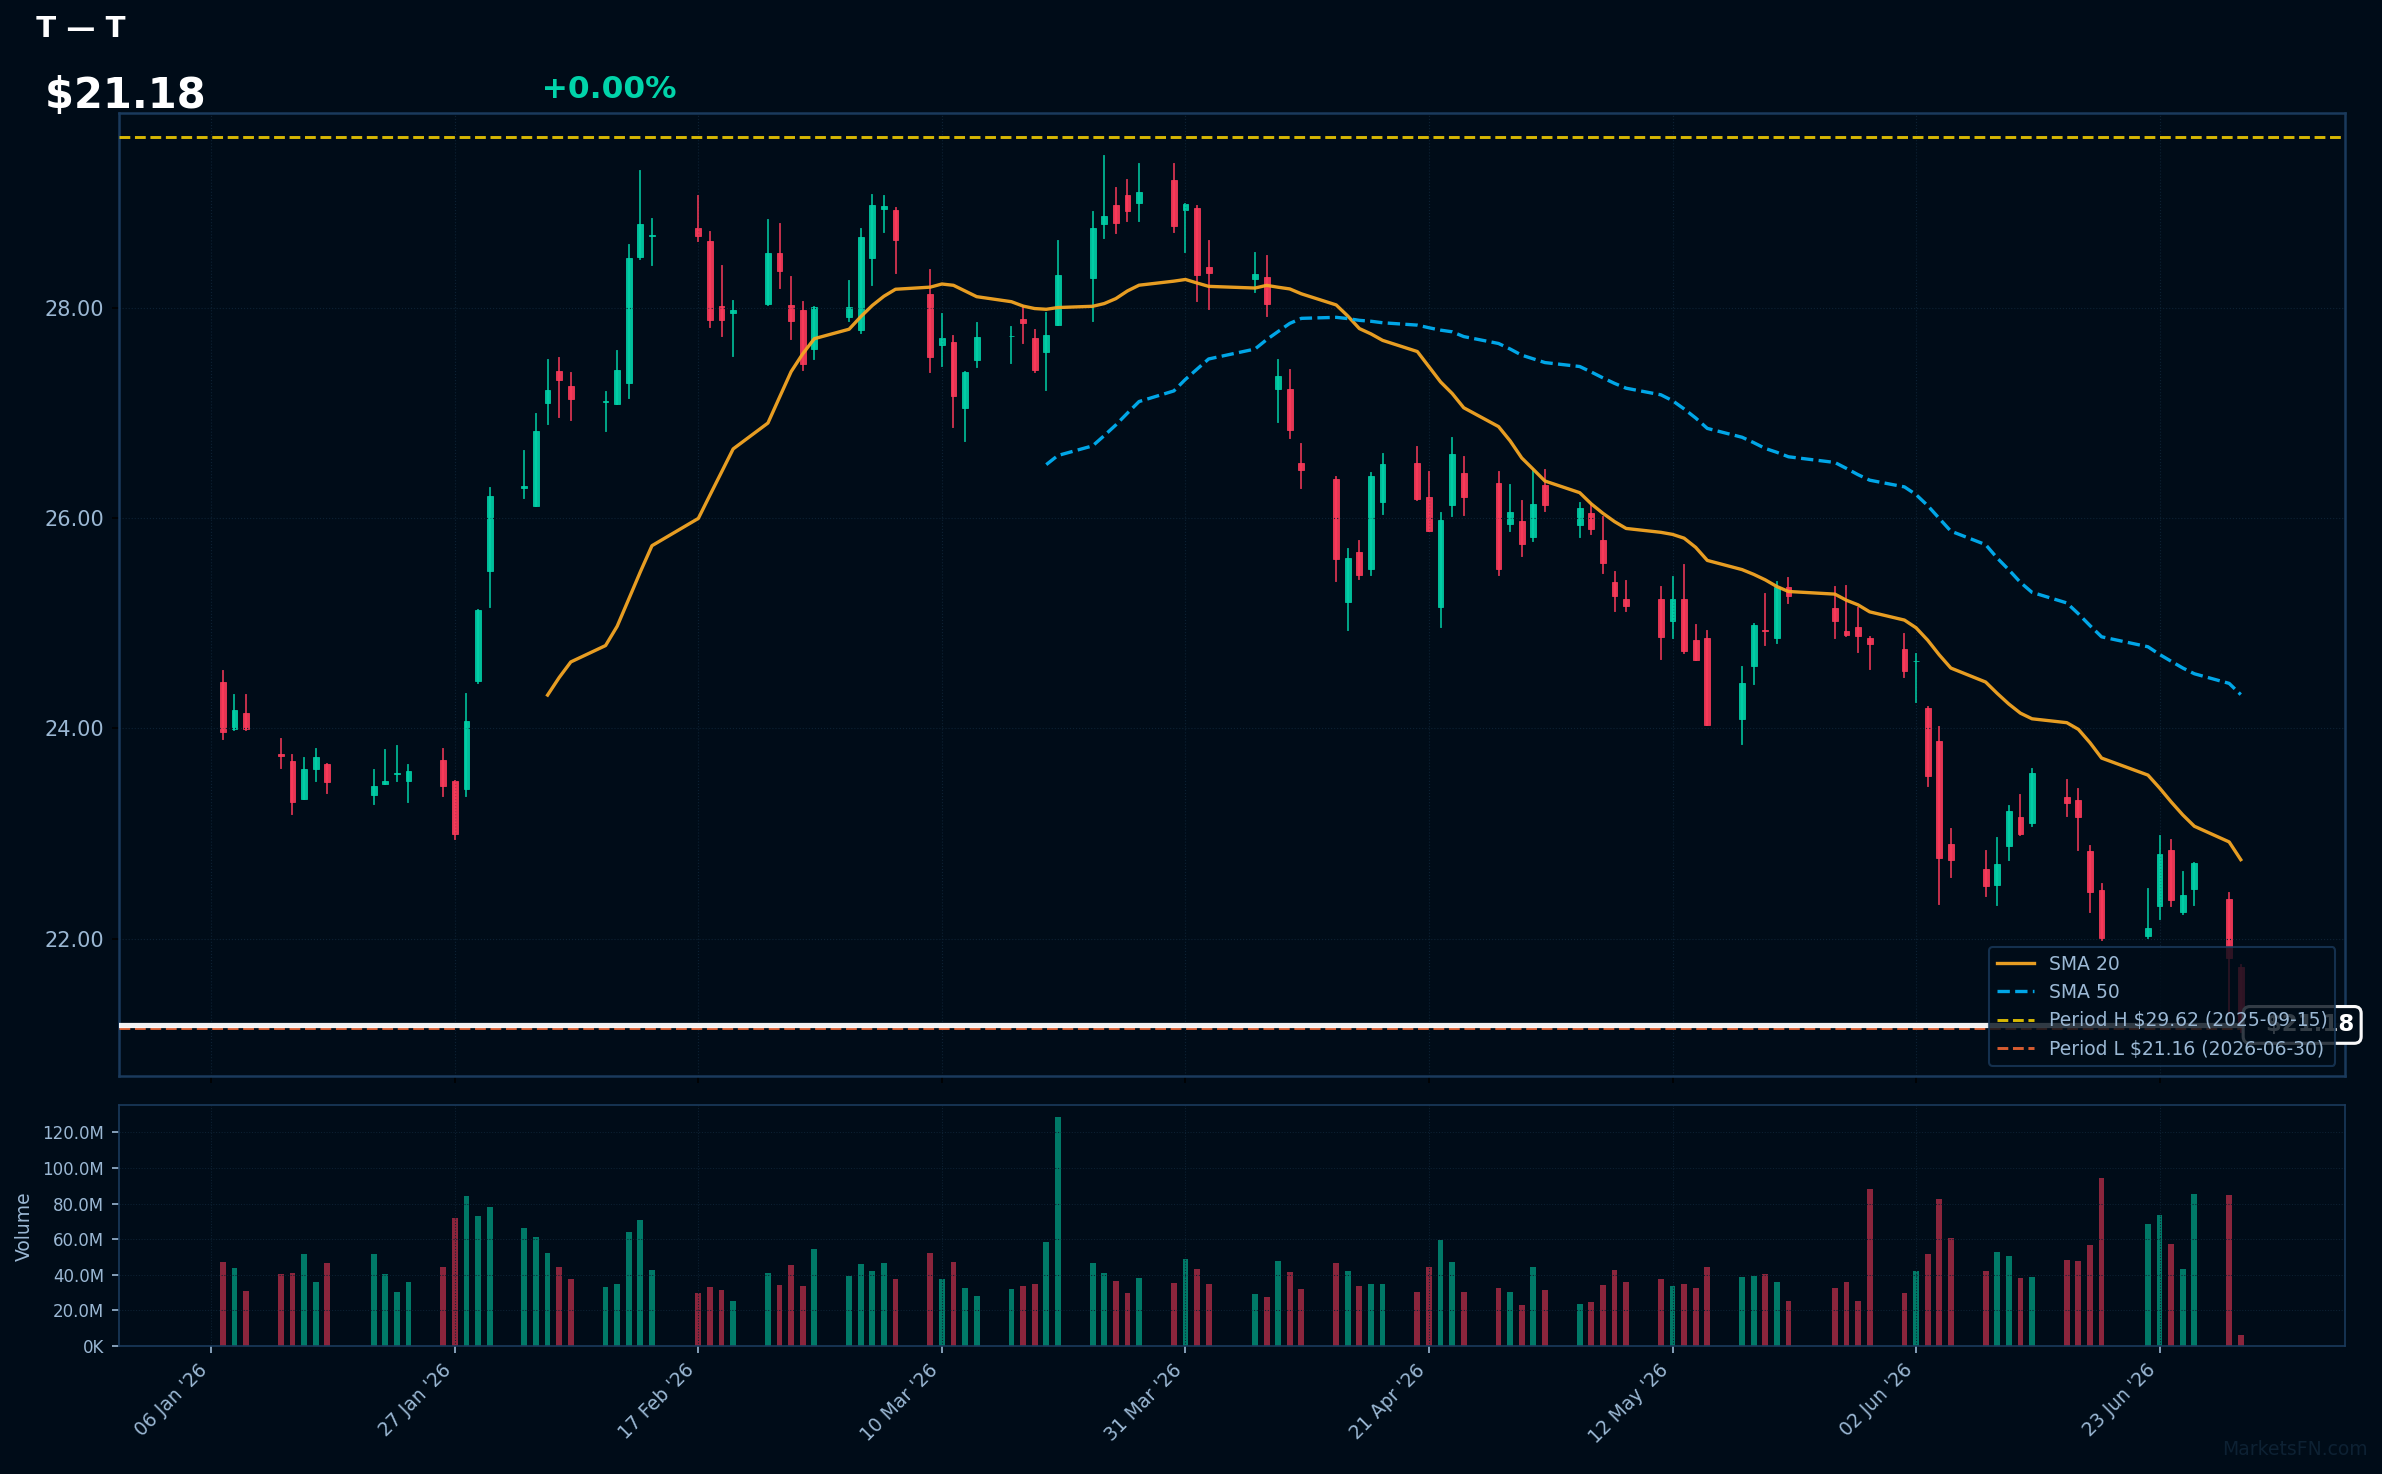
T | AT&T, Inc | Communication Services | Price Last: $21.16 | % Realized: -26.90% | RSI: 30.7 | % above MA200: -18.1% | Trend: Below MA20, MA50, MA200
AT&T, Inc is a telecommunications conglomerate providing wireless services, broadband, and media content. Investors care due to its significant market share and dividend yield, making it a staple in income-focused portfolios.
AT&T's technicals indicate a sustained downtrend with price ($21.18) below MA20, MA50, and MA200. RSI(14) at 30.7 suggests oversold conditions, and being 0.0% above its 52-Week low signals testing of major support, potentially a warning sign.
Related headlines
- AT&T Expands Build-A-Plan: Flexible Custom Wireless Plan Now Includes the Ability to Easily Add America's Best and Fastest Home Internet
- Why Did T, HTZ, GAP Stocks Plunge To 52-Week Lows Today?
- Comcasts NBC Spinoff Raises Questions About Businesses Future
- AT&T Hits 52-Week Low as SpaceX Eyes U.S. Wireless Market
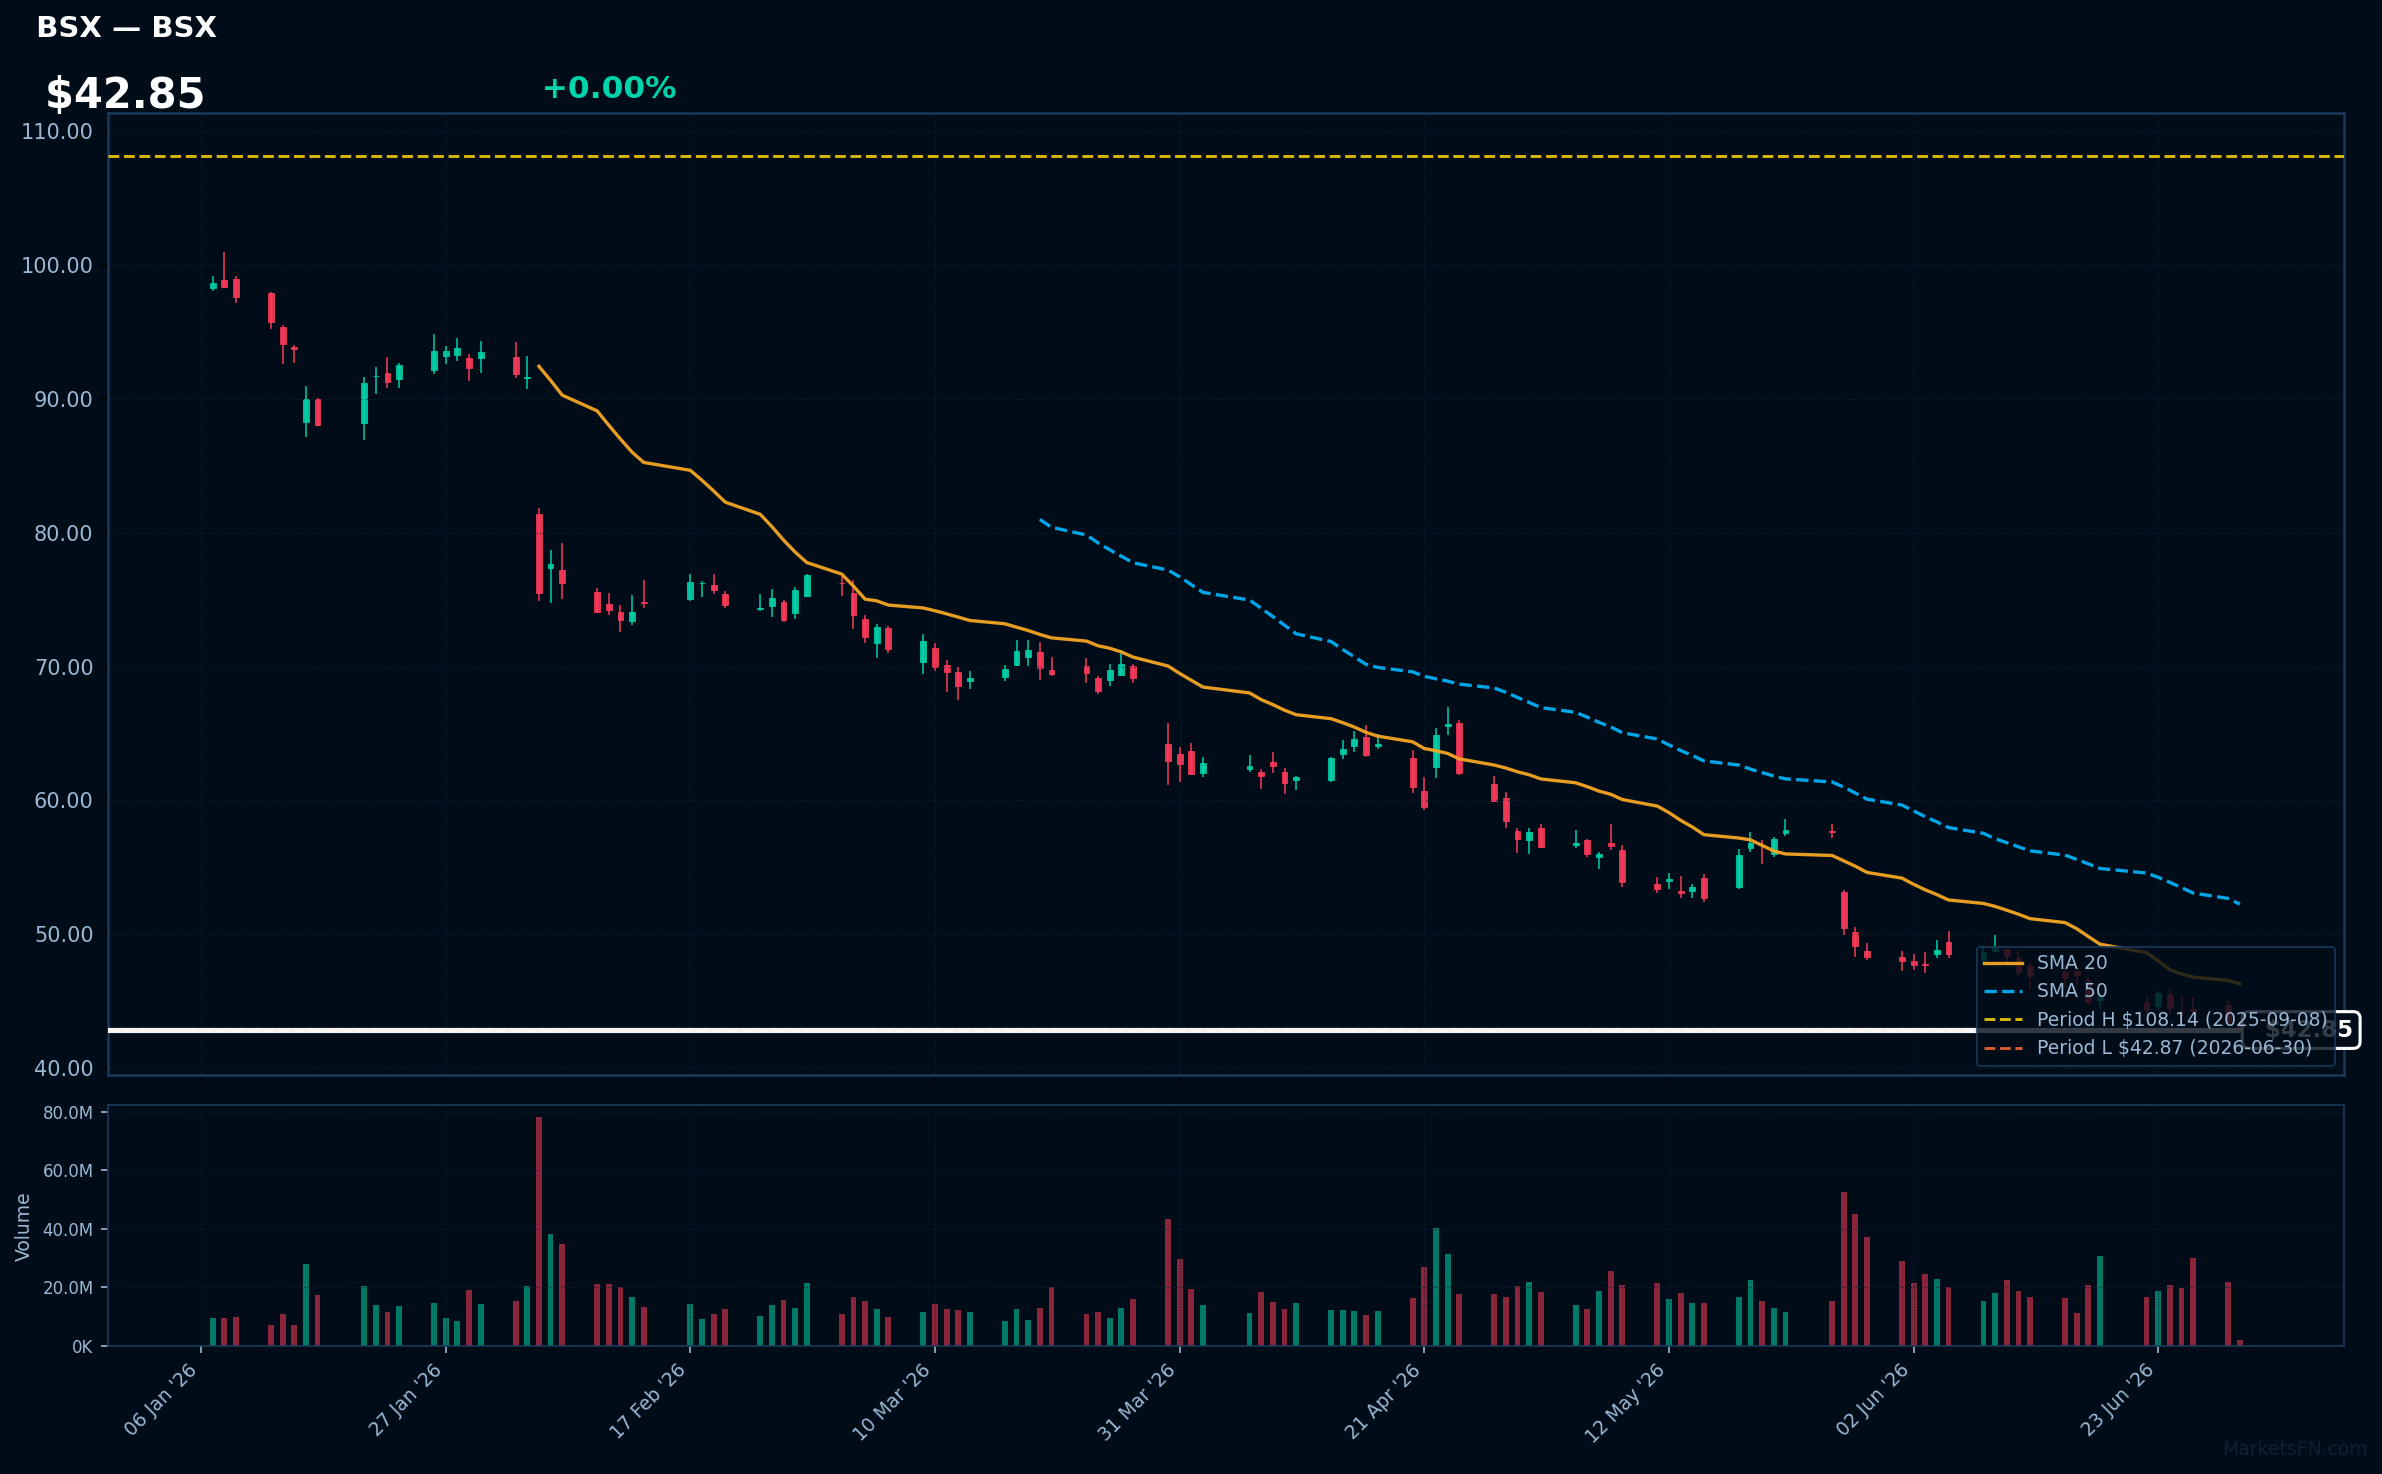
BSX | Boston Scientific Corp | Healthcare | Price Last: $42.87 | % Realized: -60.09% | RSI: 25.8 | % above MA200: -45.7% | Trend: Below MA20, MA50, MA200
Boston Scientific Corp (BSX) develops and manufactures medical devices, including stents, pacemakers, and neurovascular intervention products, addressing cardiovascular and other medical conditions; investors should care about its innovation pipeline and market share in the medical device industry.
BSX's technical situation is bearish, with an RSI(14) of 25.8 indicating oversold conditions, price ($42.85) below MA20, MA50, and MA200, and a 52-Week low proximity of 0.0%, warning of potential further downside; the sustained downtrend and -60.1% 52-Week return reinforce this negative momentum.
Related headlines
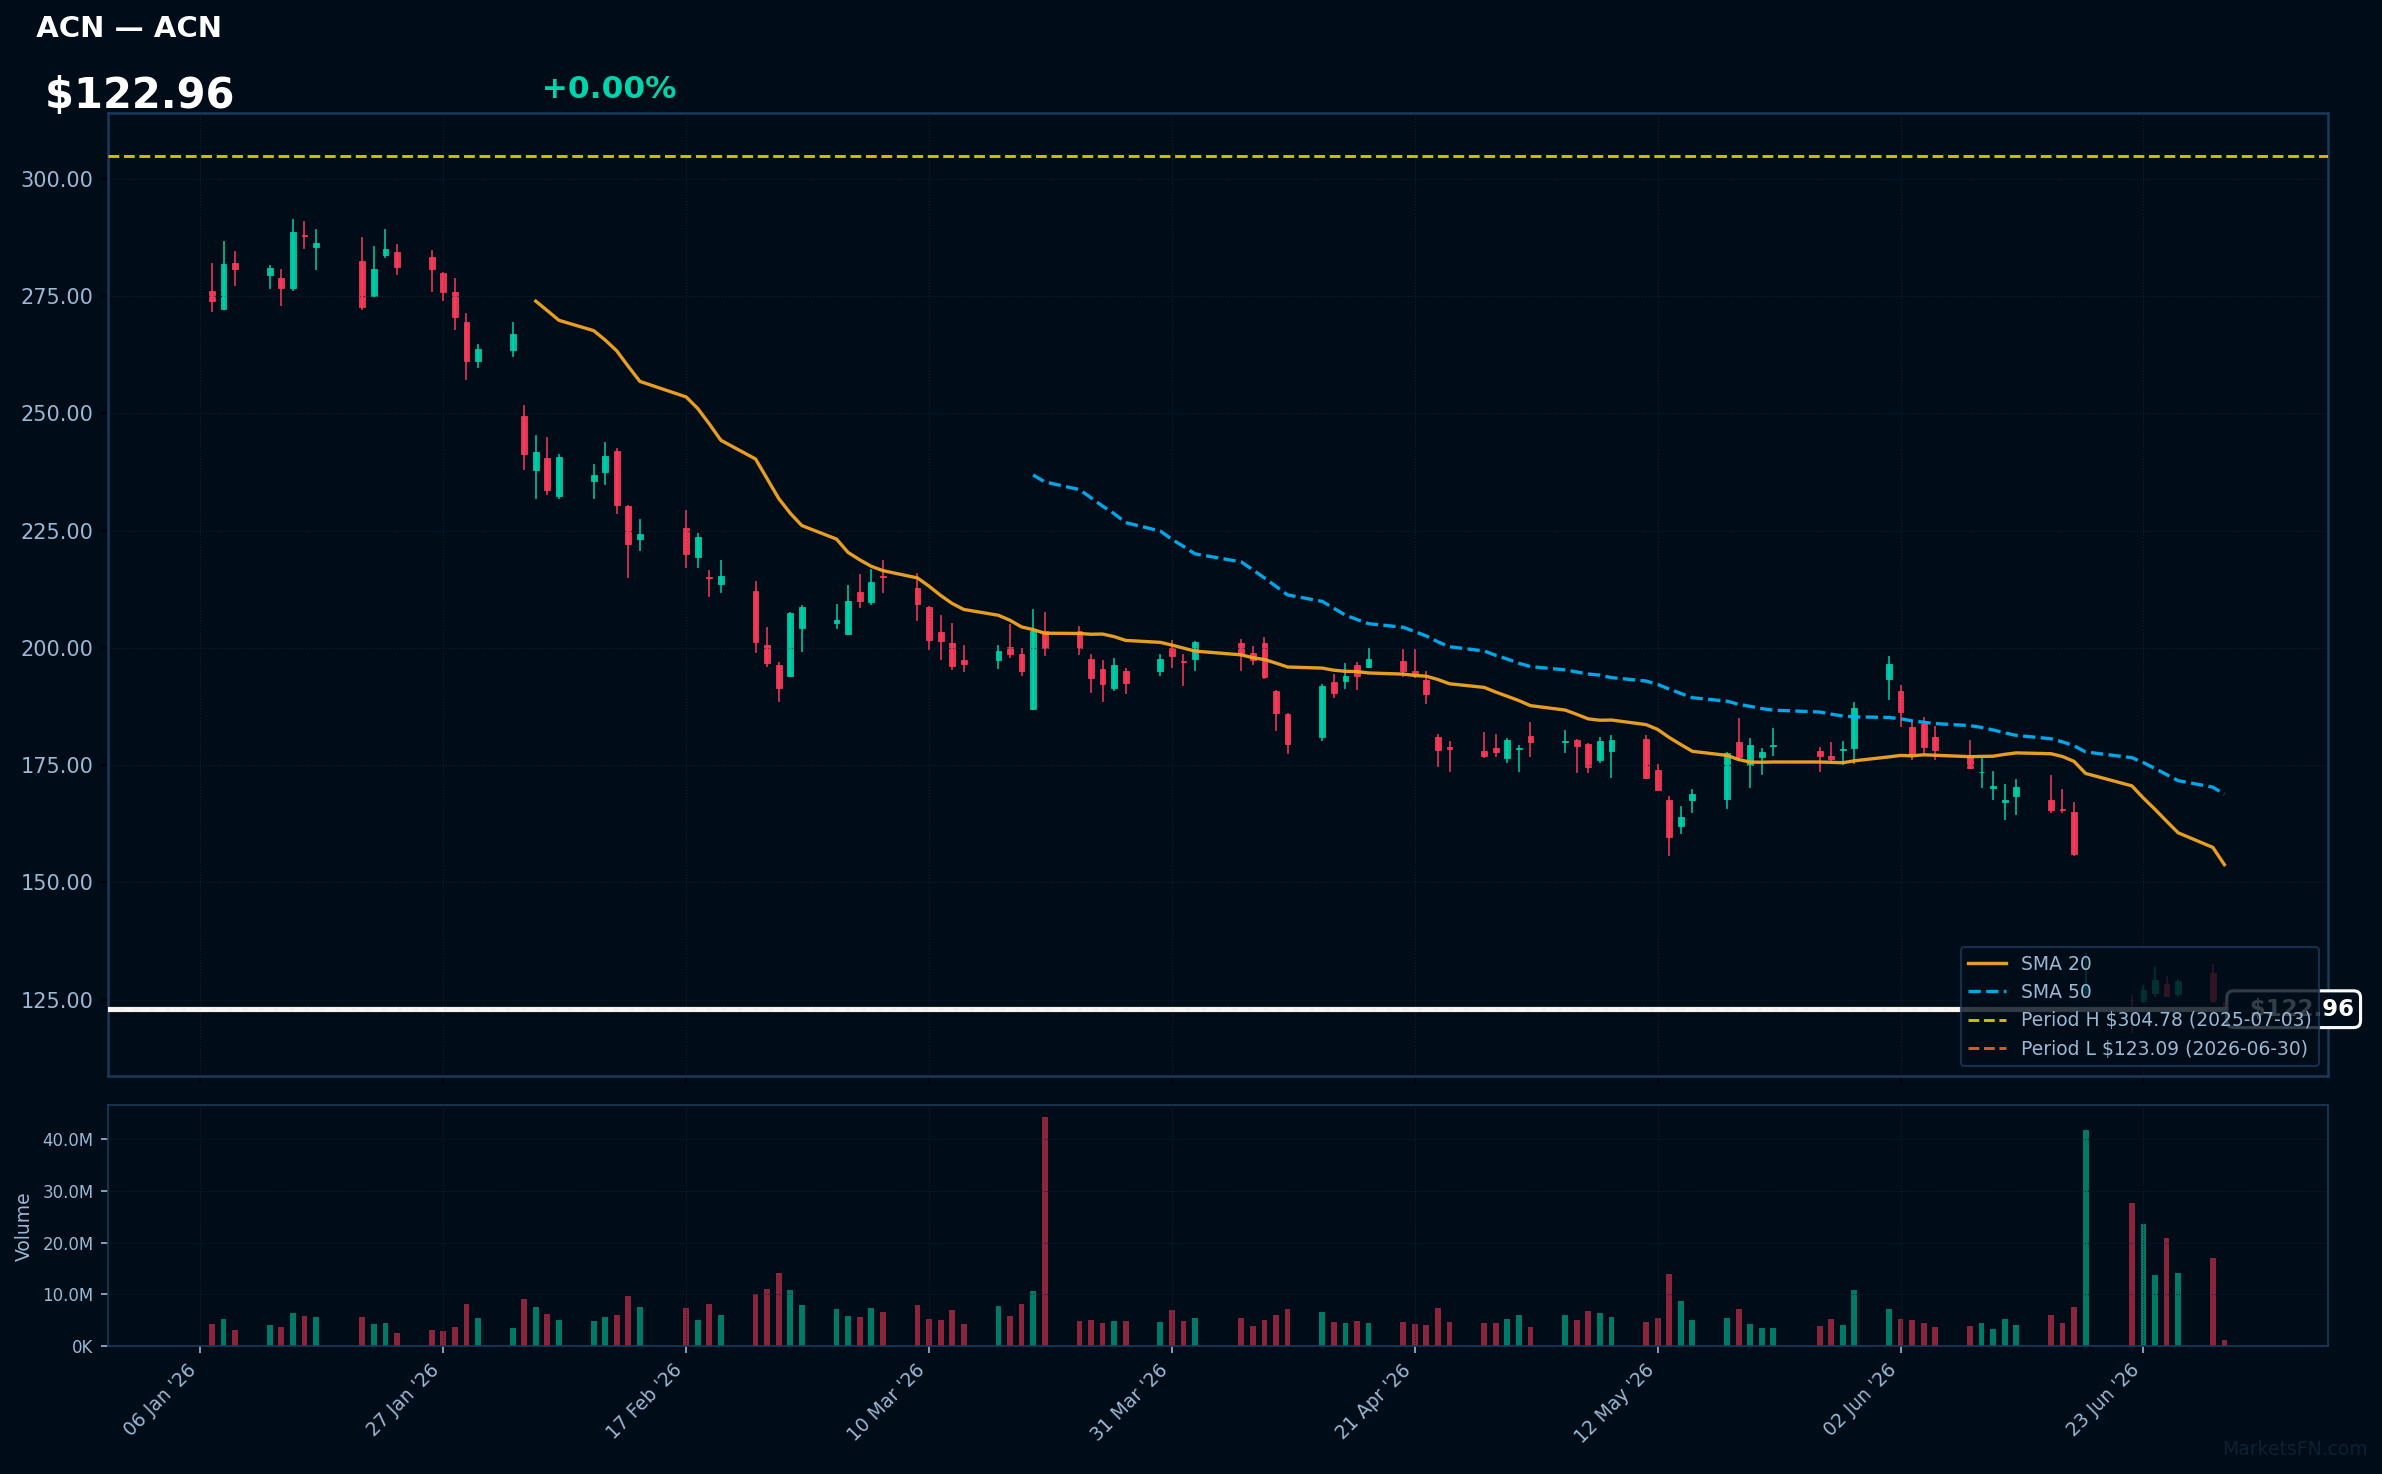
ACN | Accenture plc | Technology | Price Last: $123.09 | % Realized: -58.82% | RSI: 24.7 | % above MA200: -44.5% | Trend: Below MA20, MA50, MA200
Accenture plc is a global professional services company providing strategy, consulting, digital, technology, and operations services. Investors should care because its performance reflects demand for digital transformation and consulting services, impacting its revenue and profitability.
Accenture plc is in a sustained downtrend with price ($122.96) below MA20, MA50, and MA200. The RSI(14) is 24.7, near oversold territory, and the stock is at its 52-Week low, indicating potential major support testing, a warning sign for investors.
Related headlines
- ServiceNow, Accenture unveil AI-driven cyber risk management offering
- Accenture Stock Is Under Pressure. Its Biggest Clients Tell A Different Story.
- ServiceNow, Accenture Expand AI Cyber Push
- ServiceNow and Accenture launch AI-powered services to accelerate the shift from legacy risk platforms to agentic AI
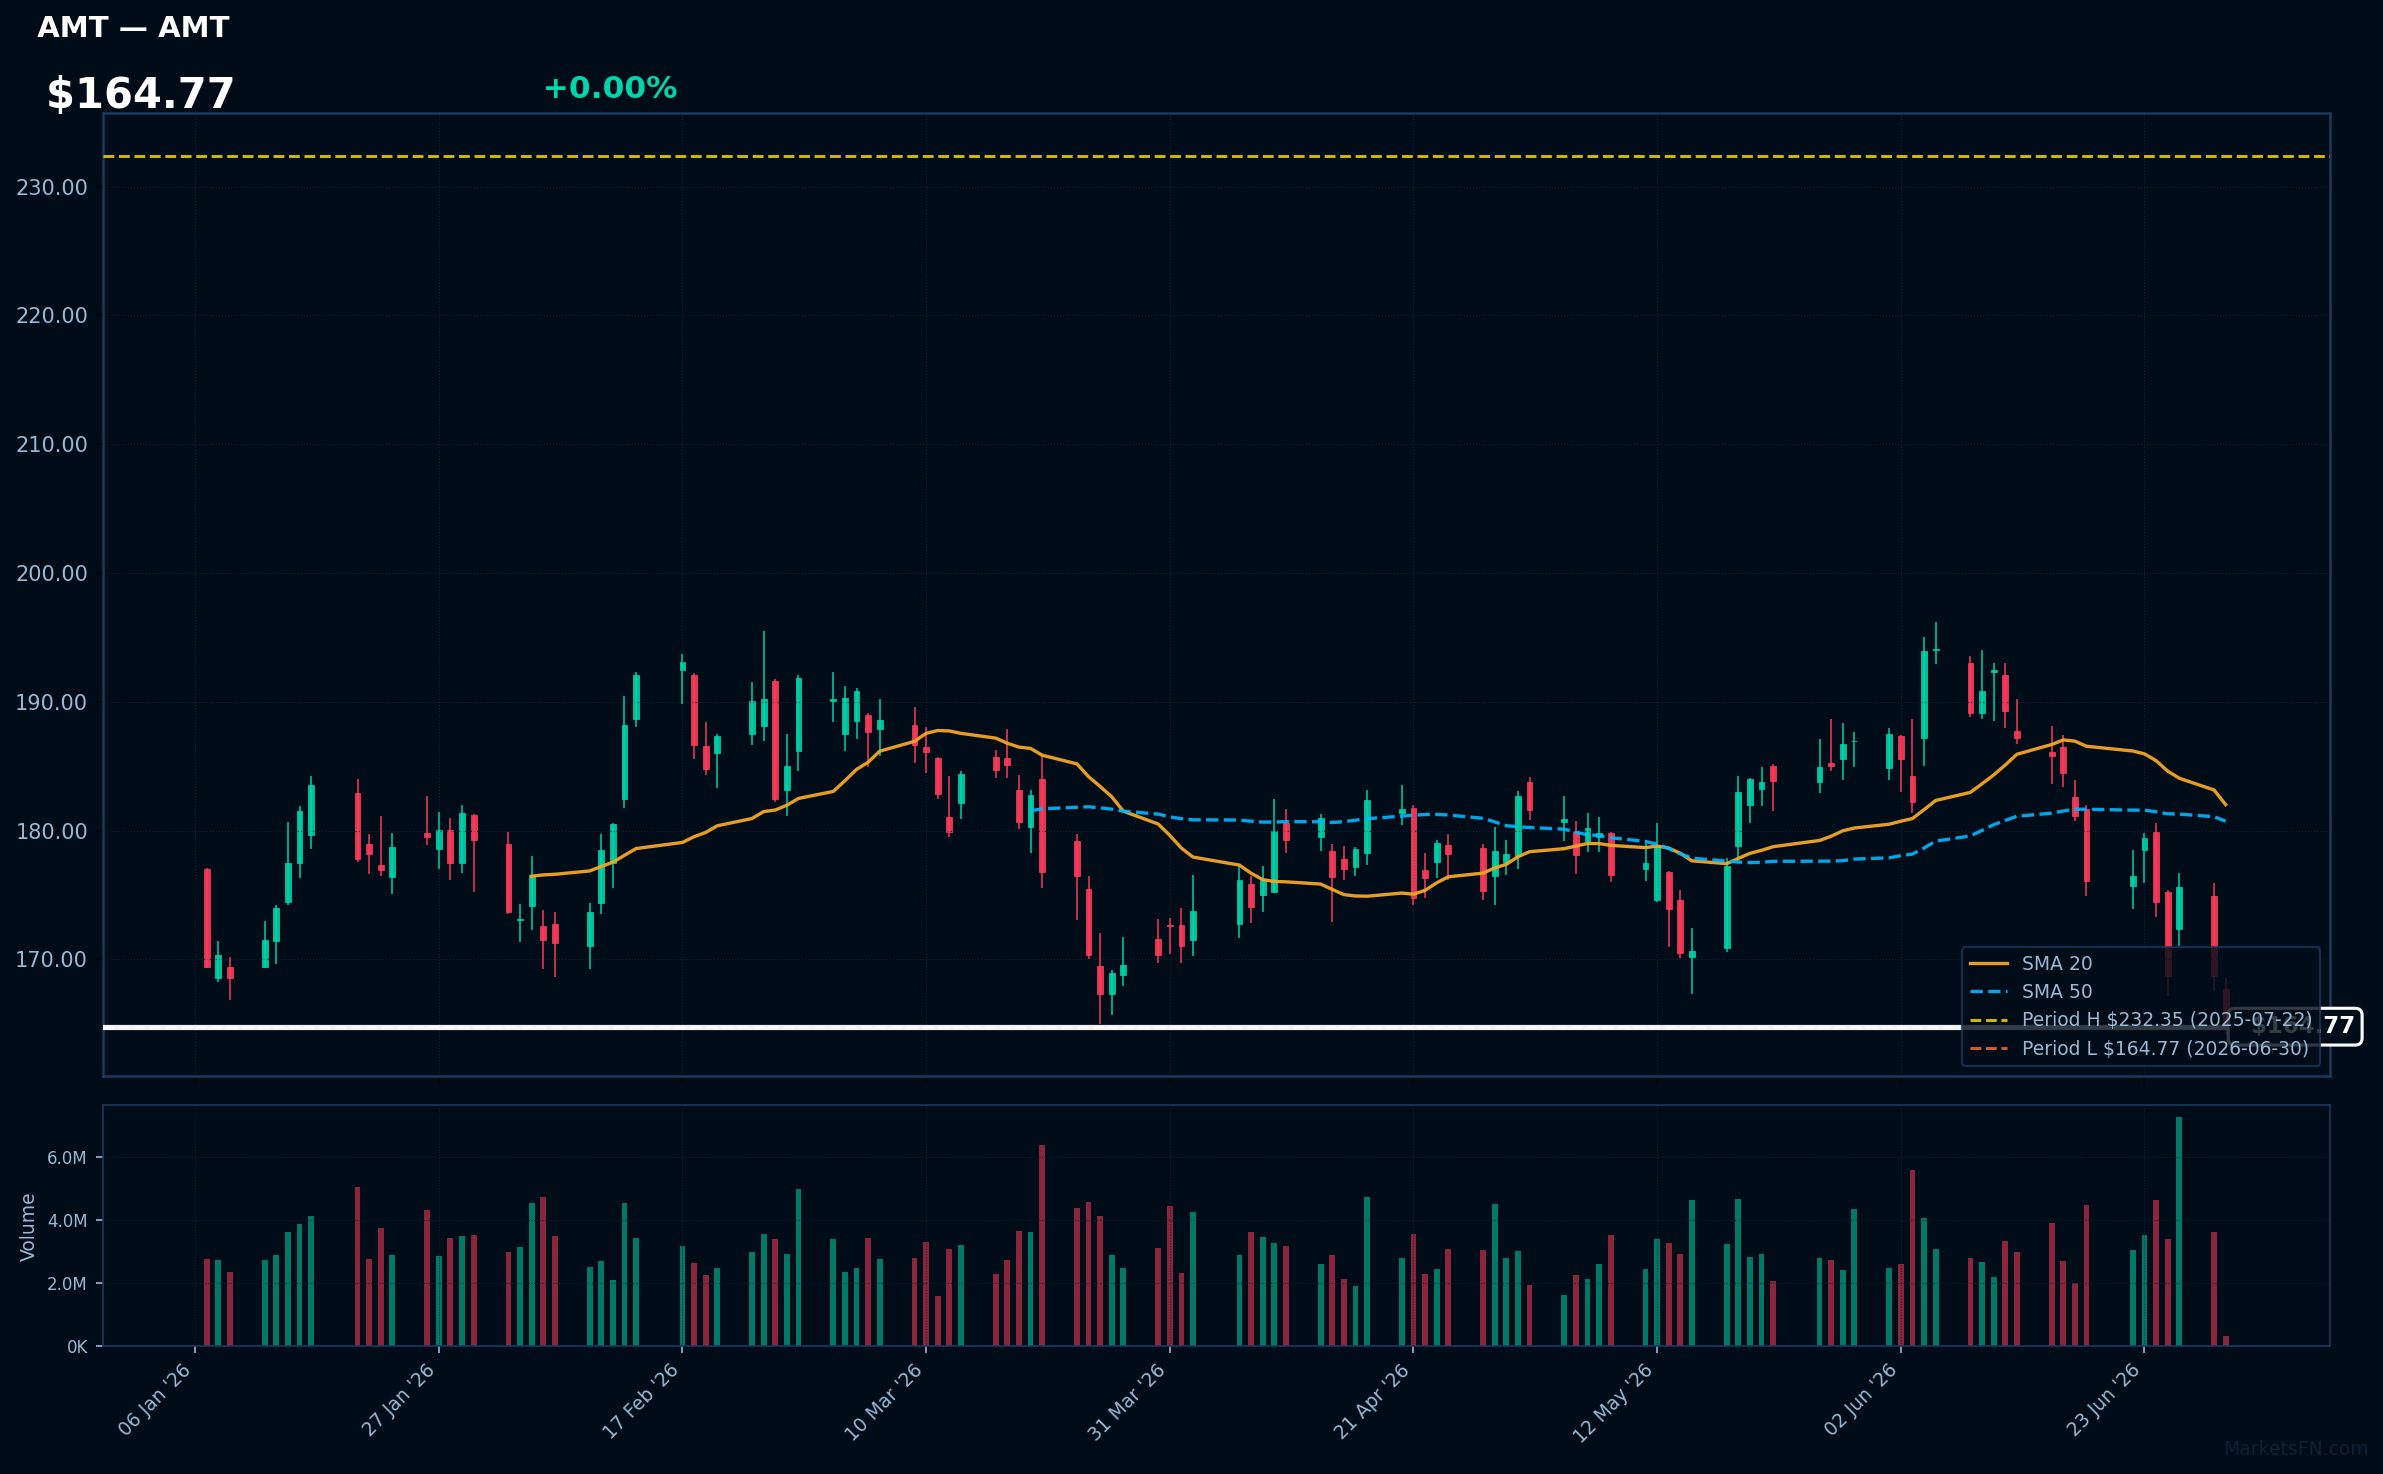
AMT | American Tower Corp | Real Estate | Price Last: $164.77 | % Realized: -25.45% | RSI: 33.9 | % above MA200: -9.2% | Trend: Below MA20, MA50, MA200
American Tower Corp is a real estate investment trust that owns and operates wireless and broadcast communications infrastructure, generating revenue primarily through leasing tower space to telecom carriers, which is crucial for 5G and mobile network expansion.
The stock is testing major support at its 52-Week low with an RSI(14) of 33.9, indicating oversold conditions, and is below MA20, MA50, and MA200, showing a bearish trend; the 52-Week return is -25.5%, signaling potential weakness.
Related headlines
Market Commentary
The S&P 500 stocks listed are currently trading at their 52-week extremes, with some at highs and others at lows. Stocks like GE, APH, PANW, AMAT, and LRCX are at their 52-week highs, while TMUS, T, BSX, ACN, and AMT are at their 52-week lows. This indicates a significant price movement, potentially driven by fundamental factors or market sentiment.
The stocks near 52-week highs are primarily from the technology and industrials sectors, suggesting a potential rotation into these areas. The presence of semiconductor equipment manufacturers like AMAT and LRCX at 52-week highs may indicate a positive outlook for the tech sector. Conversely, the stocks near 52-week lows are from the communication services and healthcare sectors, potentially signaling challenges in these areas.
Key levels to watch include the current prices of these stocks, as a break above or below their 52-week extremes could indicate further momentum. Potential catalysts include earnings reports, macroeconomic data releases, and sector-specific news that could influence the price movement of these stocks. Monitoring these levels and catalysts will be crucial in understanding the future direction of these S&P 500 stocks.
Methodology: All 503 S&P 500 constituents screened. 52-week high = highest daily close over the past 252 trading days (approx. 1 year). 52-week low = lowest daily close over the same period. Distance = (current price / extreme − 1) × 100. Technical indicators computed on up to 1 year of daily OHLCV data.
Disclaimer: For informational purposes only. Not investment advice. Past performance is not indicative of future results.