S&P 500 2026 YTD Highs & Lows Radar: Lilly(Eli) & (LLY), T-Mobile US (TMUS) and more
· Stocks · MarketsFN Team
S&P 500 2026 YTD Highs & Lows Radar: Lilly(Eli) & (LLY), T-Mobile US (TMUS) and more
Screening all 503 S&P 500 constituents for stocks nearest to their 2026 year-to-date high and their 2026 YTD low. Data as of June 30, 2026. % Realized = total return since Jan 1 2026.
Legend: RSI > 70 = overbought · RSI < 30 = oversold · Green % Realized = positive YTD return · Red = negative.
📈 Nearest to 2026 High
Sectors represented: Healthcare (4), Industrials (1)
| Ticker | Company | Sector | Price Last | % Realized | 2026 YTD High Date | RSI | % above MA200 | Trend |
|---|---|---|---|---|---|---|---|---|
| LLY | Lilly(Eli) & Co | Healthcare | $1229.93 | +13.84% | 2026-06-29 | 69.9 | +25.4% | Above MA20, MA50, MA200 |
| JNJ | Johnson & Johnson | Healthcare | $258.51 | +24.67% | 2026-06-29 | 72.3 | +18.5% | Above MA20, MA50, MA200 |
| ABBV | Abbvie Inc | Healthcare | $254.31 | +10.90% | 2026-06-29 | 76.4 | +14.7% | Above MA20, MA50, MA200 |
| GE | GE Aerospace | Industrials | $373.71 | +16.51% | 2026-06-29 | 73.0 | +21.1% | Above MA20, MA50, MA200 |
| MRK | Merck & Co Inc | Healthcare | $129.38 | +21.54% | 2026-06-29 | 69.3 | +21.2% | Above MA20, MA50, MA200 |
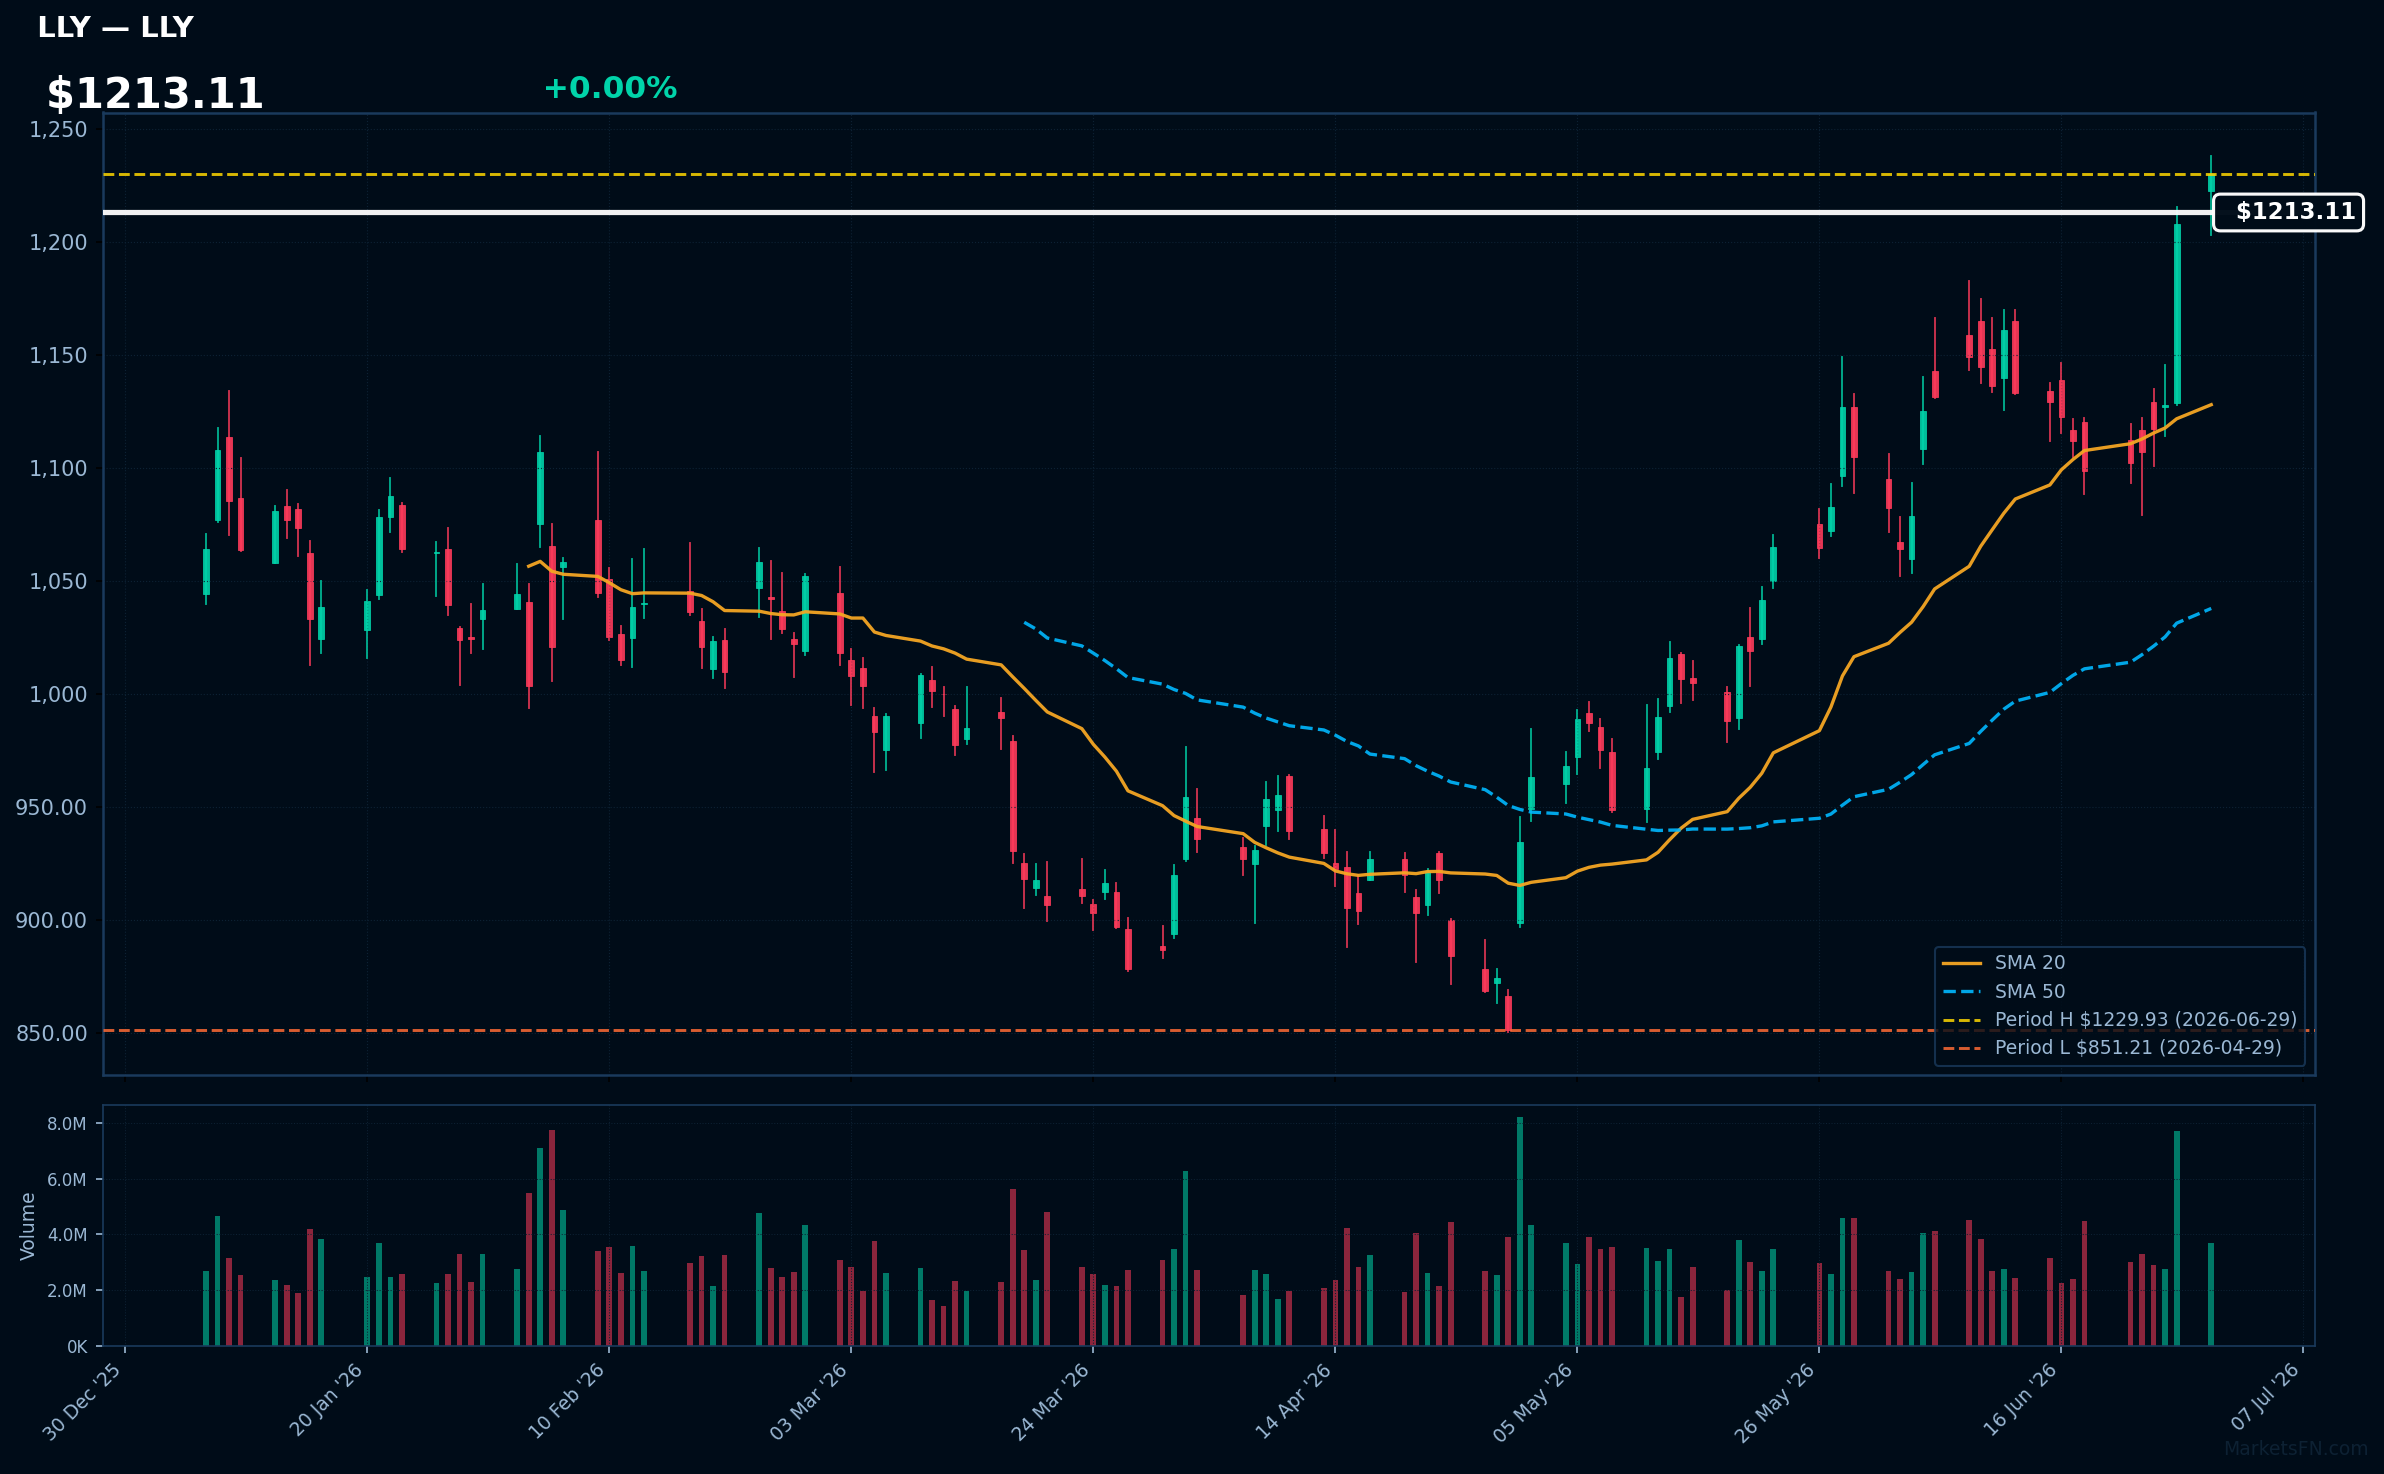
LLY | Lilly(Eli) & Co | Healthcare | Price Last: $1229.93 | % Realized: +13.84% | RSI: 69.9 | % above MA200: +25.4% | Trend: Above MA20, MA50, MA200
Eli Lilly is a pharmaceutical company developing and marketing medicines; investors should care about its pipeline and product sales. Specific products and approvals drive its value.
Lilly's RSI is 69.9, nearing overbought territory. MA alignment is bullish with price > MA20 > MA50 > MA200. The stock is at its 2026 YTD high, up 13.8% YTD, indicating strong momentum.
Related headlines
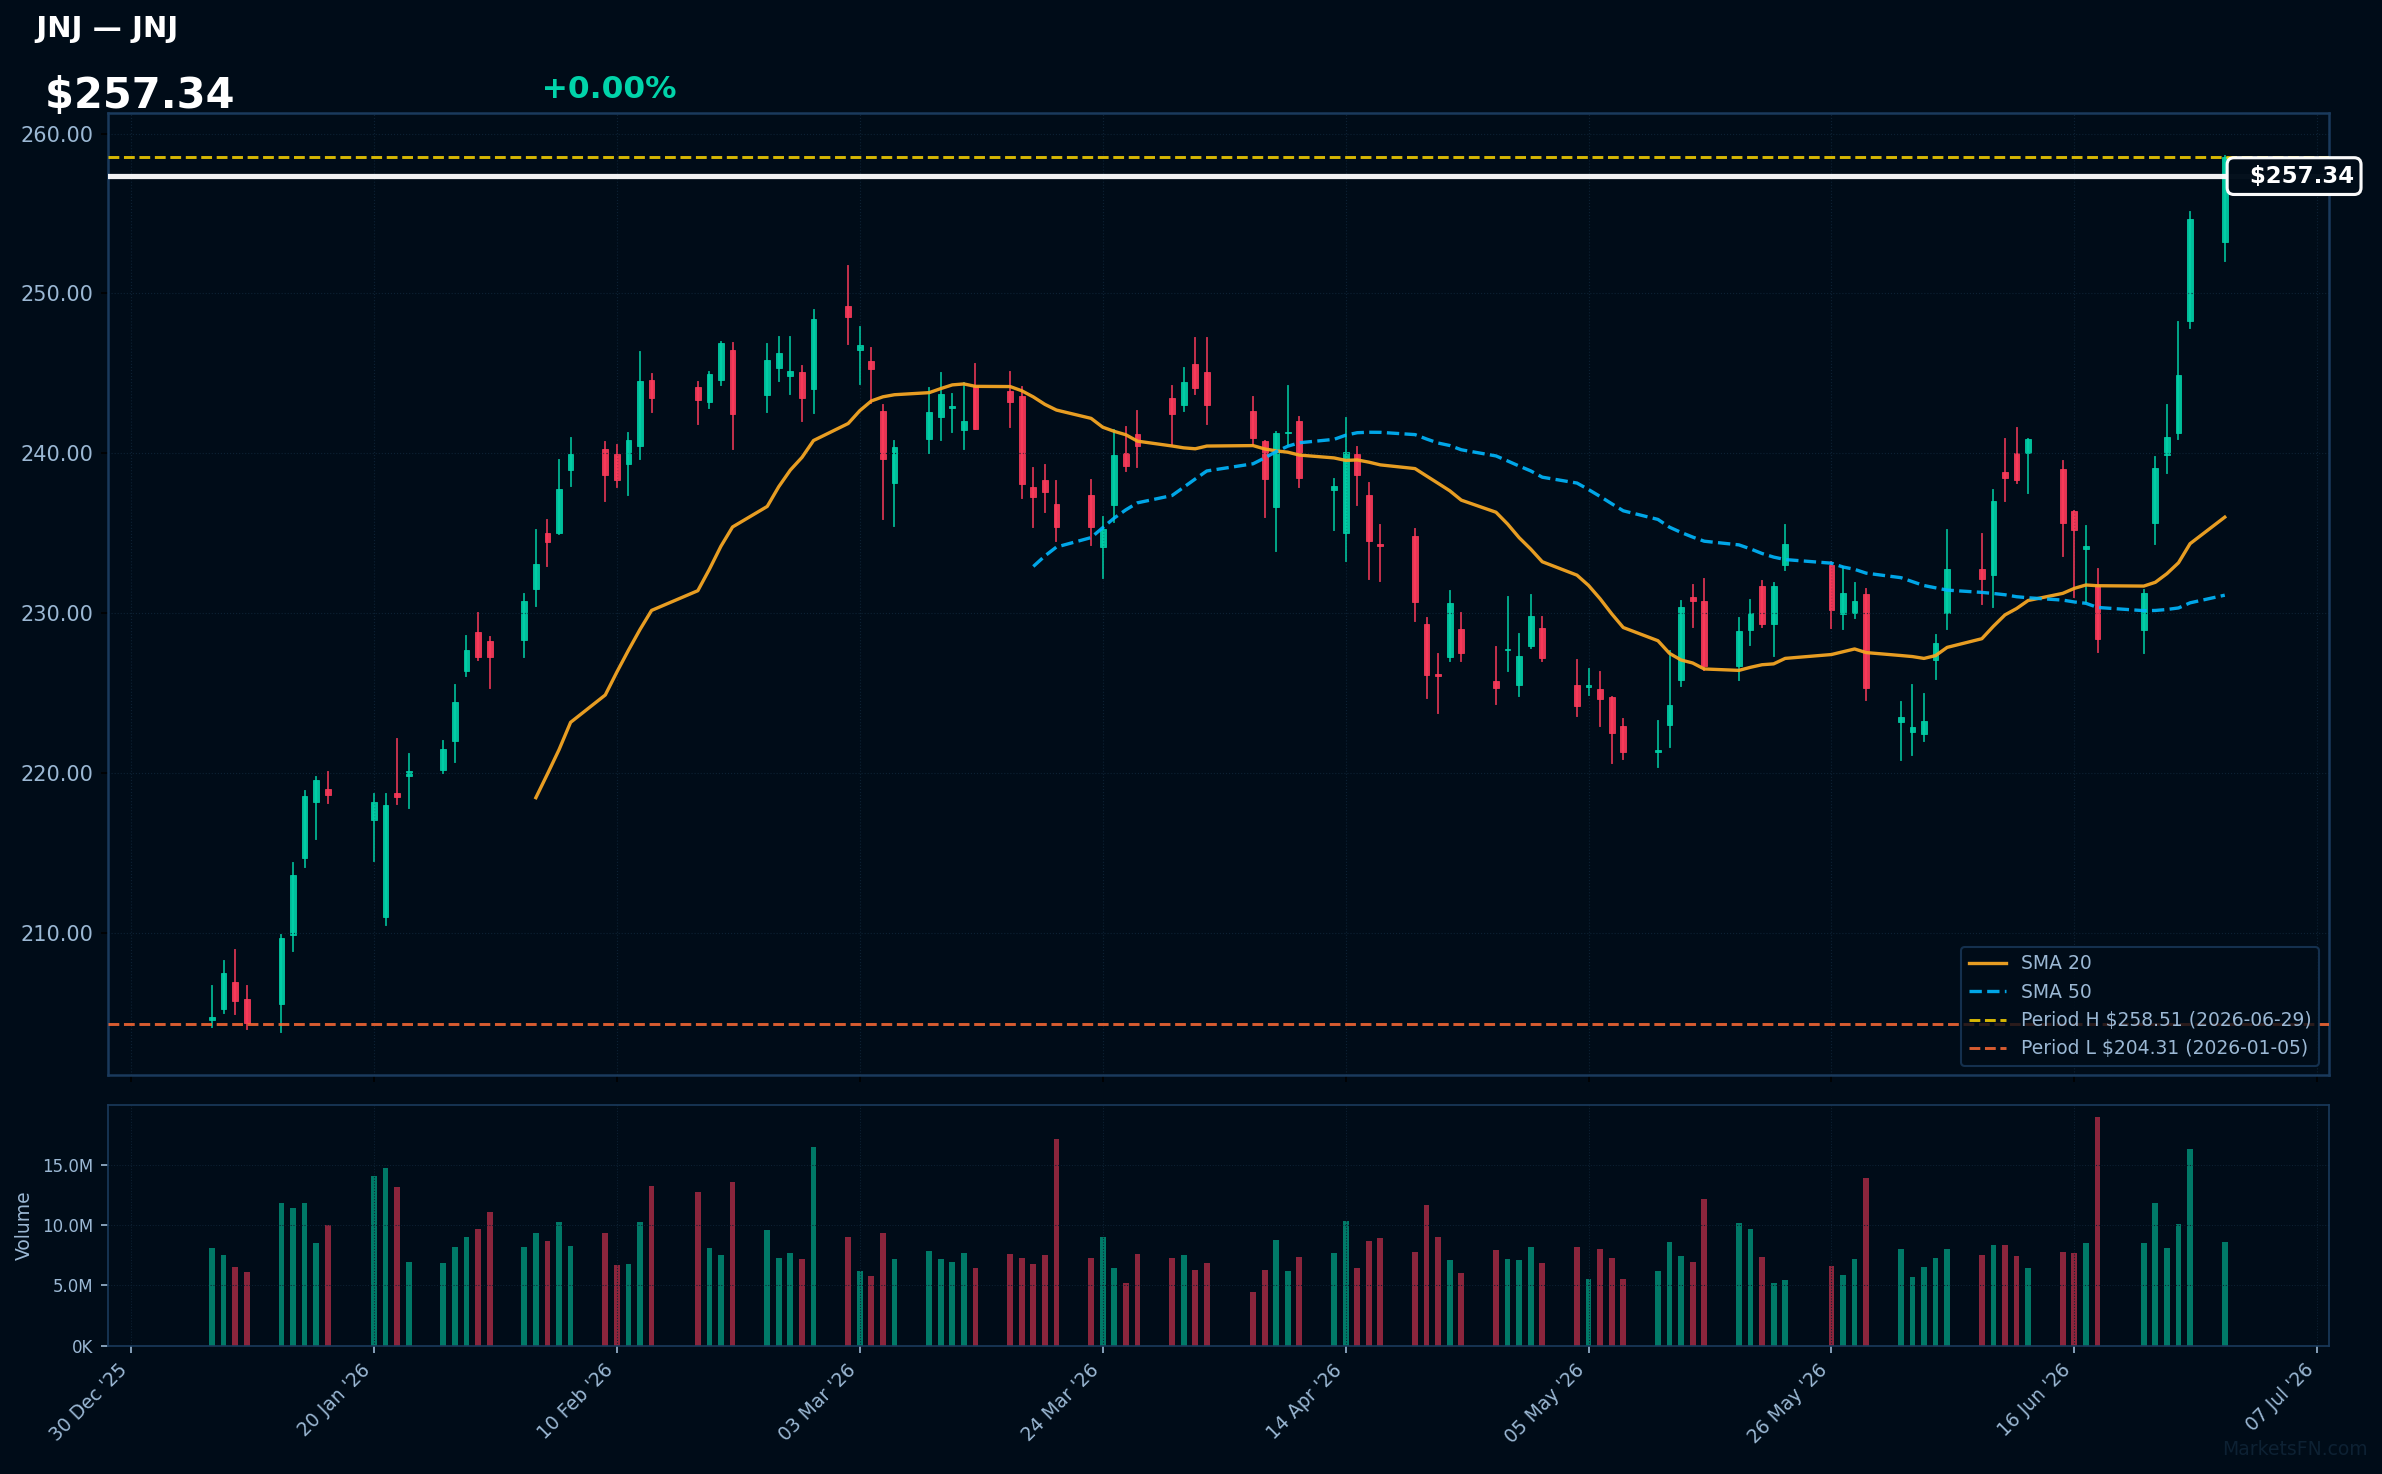
JNJ | Johnson & Johnson | Healthcare | Price Last: $258.51 | % Realized: +24.67% | RSI: 72.3 | % above MA200: +18.5% | Trend: Above MA20, MA50, MA200
Johnson & Johnson is a diversified healthcare company with significant pharmaceutical, medical devices, and consumer products segments. Investors should care about its broad portfolio, including innovative pharmaceuticals like Darzalex and Stelara, which drive revenue growth.
Johnson & Johnson's RSI(14) is 72.3, indicating strong momentum. The MA alignment (price > MA20 > MA50 > MA200) confirms a sustained uptrend. With the stock 0.0% below its 2026 YTD high, it nears a potential breakout level, suggesting continued upward momentum.
Related headlines
- Johnson & Johnson presents new IMAAVY (nipocalimab-aahu) data at European Academy of Neurology (EAN) 2026 Congress reinforcing sustained disease control in generalized myasthenia gravis
- The Number That Could Test Johnson & Johnson Stock
- Johnson & Johnson to stay out of obesity drugs, focus on cancer, CEO says
- Johnson & Johnson Invests more than $1 Billion to Strengthen U.S. Vision Manufacturing in Jacksonville, Florida
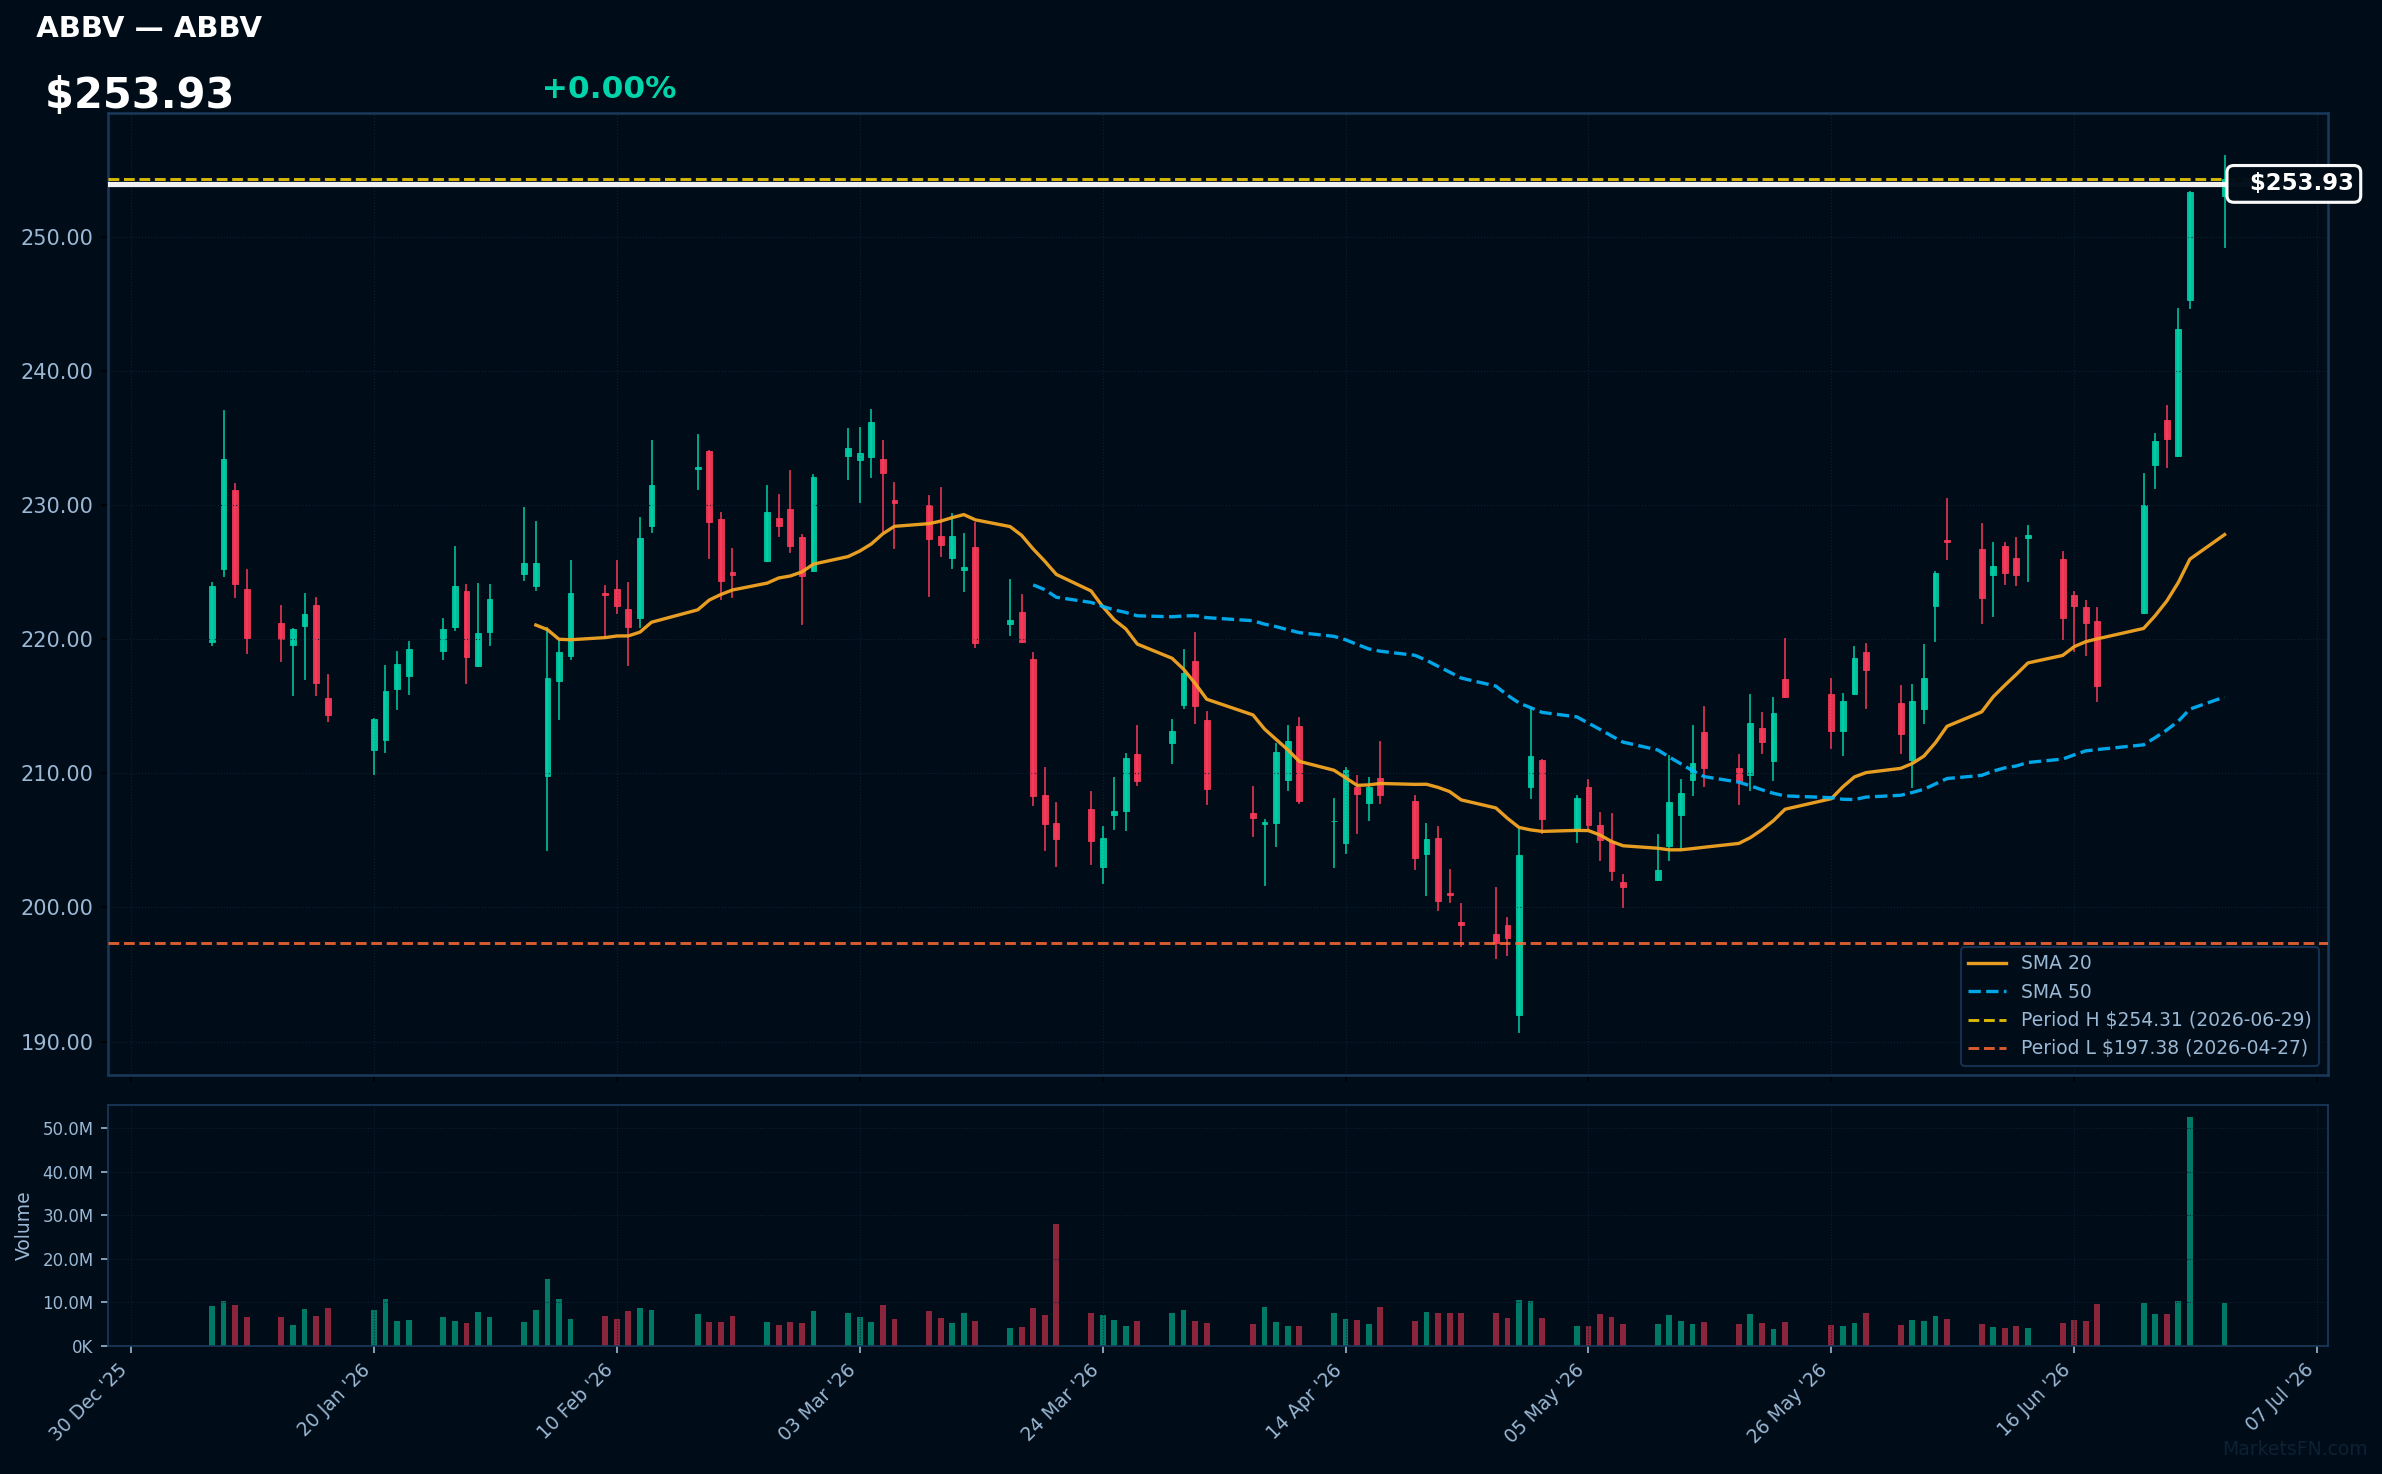
ABBV | Abbvie Inc | Healthcare | Price Last: $254.31 | % Realized: +10.90% | RSI: 76.4 | % above MA200: +14.7% | Trend: Above MA20, MA50, MA200
Abbvie Inc is a biopharmaceutical company that develops and markets therapies for chronic diseases, including immunology and oncology treatments like Humira and Rinvoq. Investors care about its pipeline and market dominance in these areas.
Abbvie Inc's RSI(14) is 76.4, indicating strong momentum as it's above MA20, MA50, and MA200. The stock is near its 2026 YTD high, up 10.9% YTD, suggesting continued upward pressure.
Related headlines
- Merck, AbbVie investigated over China military hospital drug trials
- Exclusive-US House committee opens investigation into Merck, AbbVie China drug trials
- AbbVie Announces Positive Phase 3 Results for Epcoritamab Plus Lenalidomide in Patients with Relapsed or Refractory Diffuse Large B-Cell Lymphoma
- AbbVie Stock Rockets 17% With 5-Day Winning Streak

GE | GE Aerospace | Industrials | Price Last: $373.71 | % Realized: +16.51% | RSI: 73.0 | % above MA200: +21.1% | Trend: Above MA20, MA50, MA200
GE Aerospace is a leader in the aerospace industry, manufacturing commercial and military jet engines, and other aircraft components. Investors should care about its technological advancements and market share in the growing aviation sector.
GE Aerospace's RSI is 73.0, indicating strong momentum. The stock is in a sustained uptrend with price > MA20 > MA50 > MA200, and is 0.0% below its 2026 YTD high, suggesting a potential breakout.
Related headlines
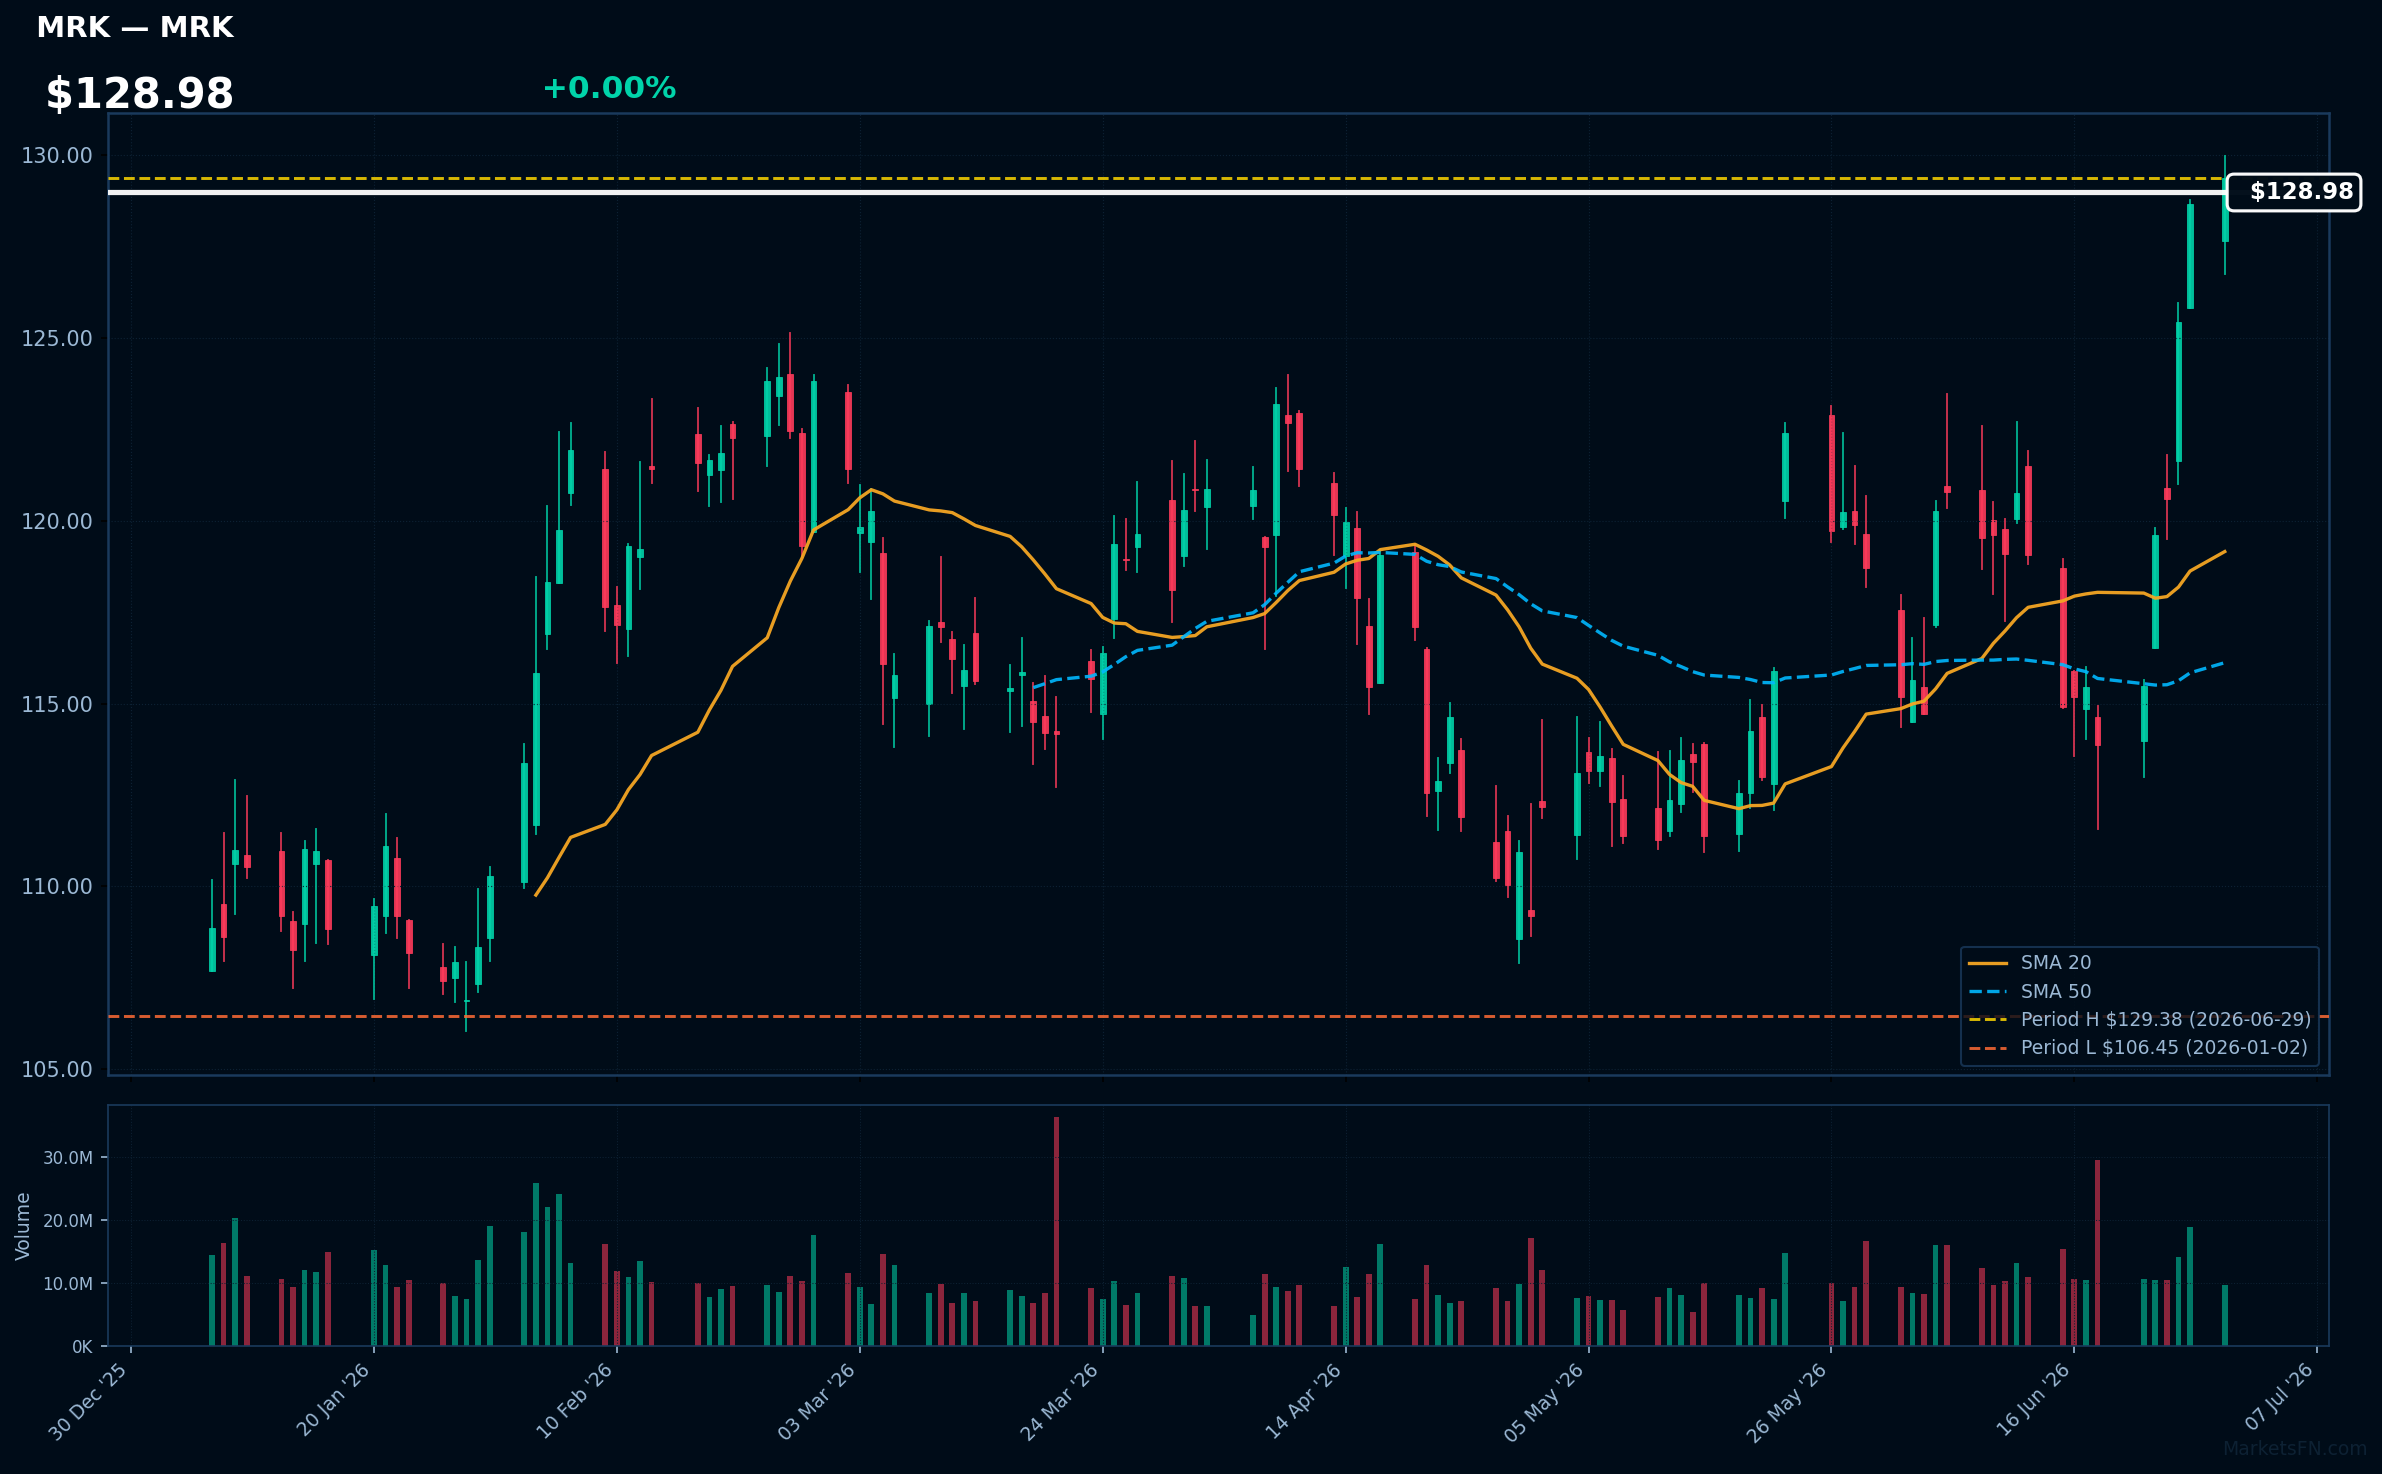
MRK | Merck & Co Inc | Healthcare | Price Last: $129.38 | % Realized: +21.54% | RSI: 69.3 | % above MA200: +21.2% | Trend: Above MA20, MA50, MA200
Merck & Co Inc is a pharmaceutical company that develops and markets human and animal health products, including Keytruda, a leading immunotherapy cancer treatment, and Gardasil, a vaccine for human papillomavirus; investors should care about its pipeline and product performance.
MRK's RSI(14) is 69.3, nearing overbought territory, with a bullish MA alignment (price > MA20 > MA50 > MA200) indicating sustained uptrend; it's 0.0% below its 2026 YTD high, suggesting potential breakout momentum.
Related headlines
📉 Nearest to 2026 Low
Sectors represented: Communication Services (2), Healthcare (1), Technology (1), Financial (1)
| Ticker | Company | Sector | Price Last | % Realized | 2026 YTD Low Date | RSI | % above MA200 | Trend |
|---|---|---|---|---|---|---|---|---|
| TMUS | T-Mobile US Inc | Communication Services | $173.97 | -12.83% | 2026-06-29 | 33.1 | -15.0% | Below MA20, MA50, MA200 |
| T | AT&T, Inc | Communication Services | $21.82 | -11.16% | 2026-06-29 | 33.2 | -15.5% | Below MA20, MA50, MA200 |
| BSX | Boston Scientific Corp | Healthcare | $43.48 | -54.09% | 2026-06-29 | 26.1 | -45.0% | Below MA20, MA50, MA200 |
| ACN | Accenture plc | Technology | $124.74 | -52.01% | 2026-06-29 | 25.0 | -43.7% | Below MA20, MA50, MA200 |
| ICE | Intercontinental Exchange Inc | Financial | $122.91 | -23.18% | 2026-06-29 | 21.1 | -21.9% | Below MA20, MA50, MA200 |
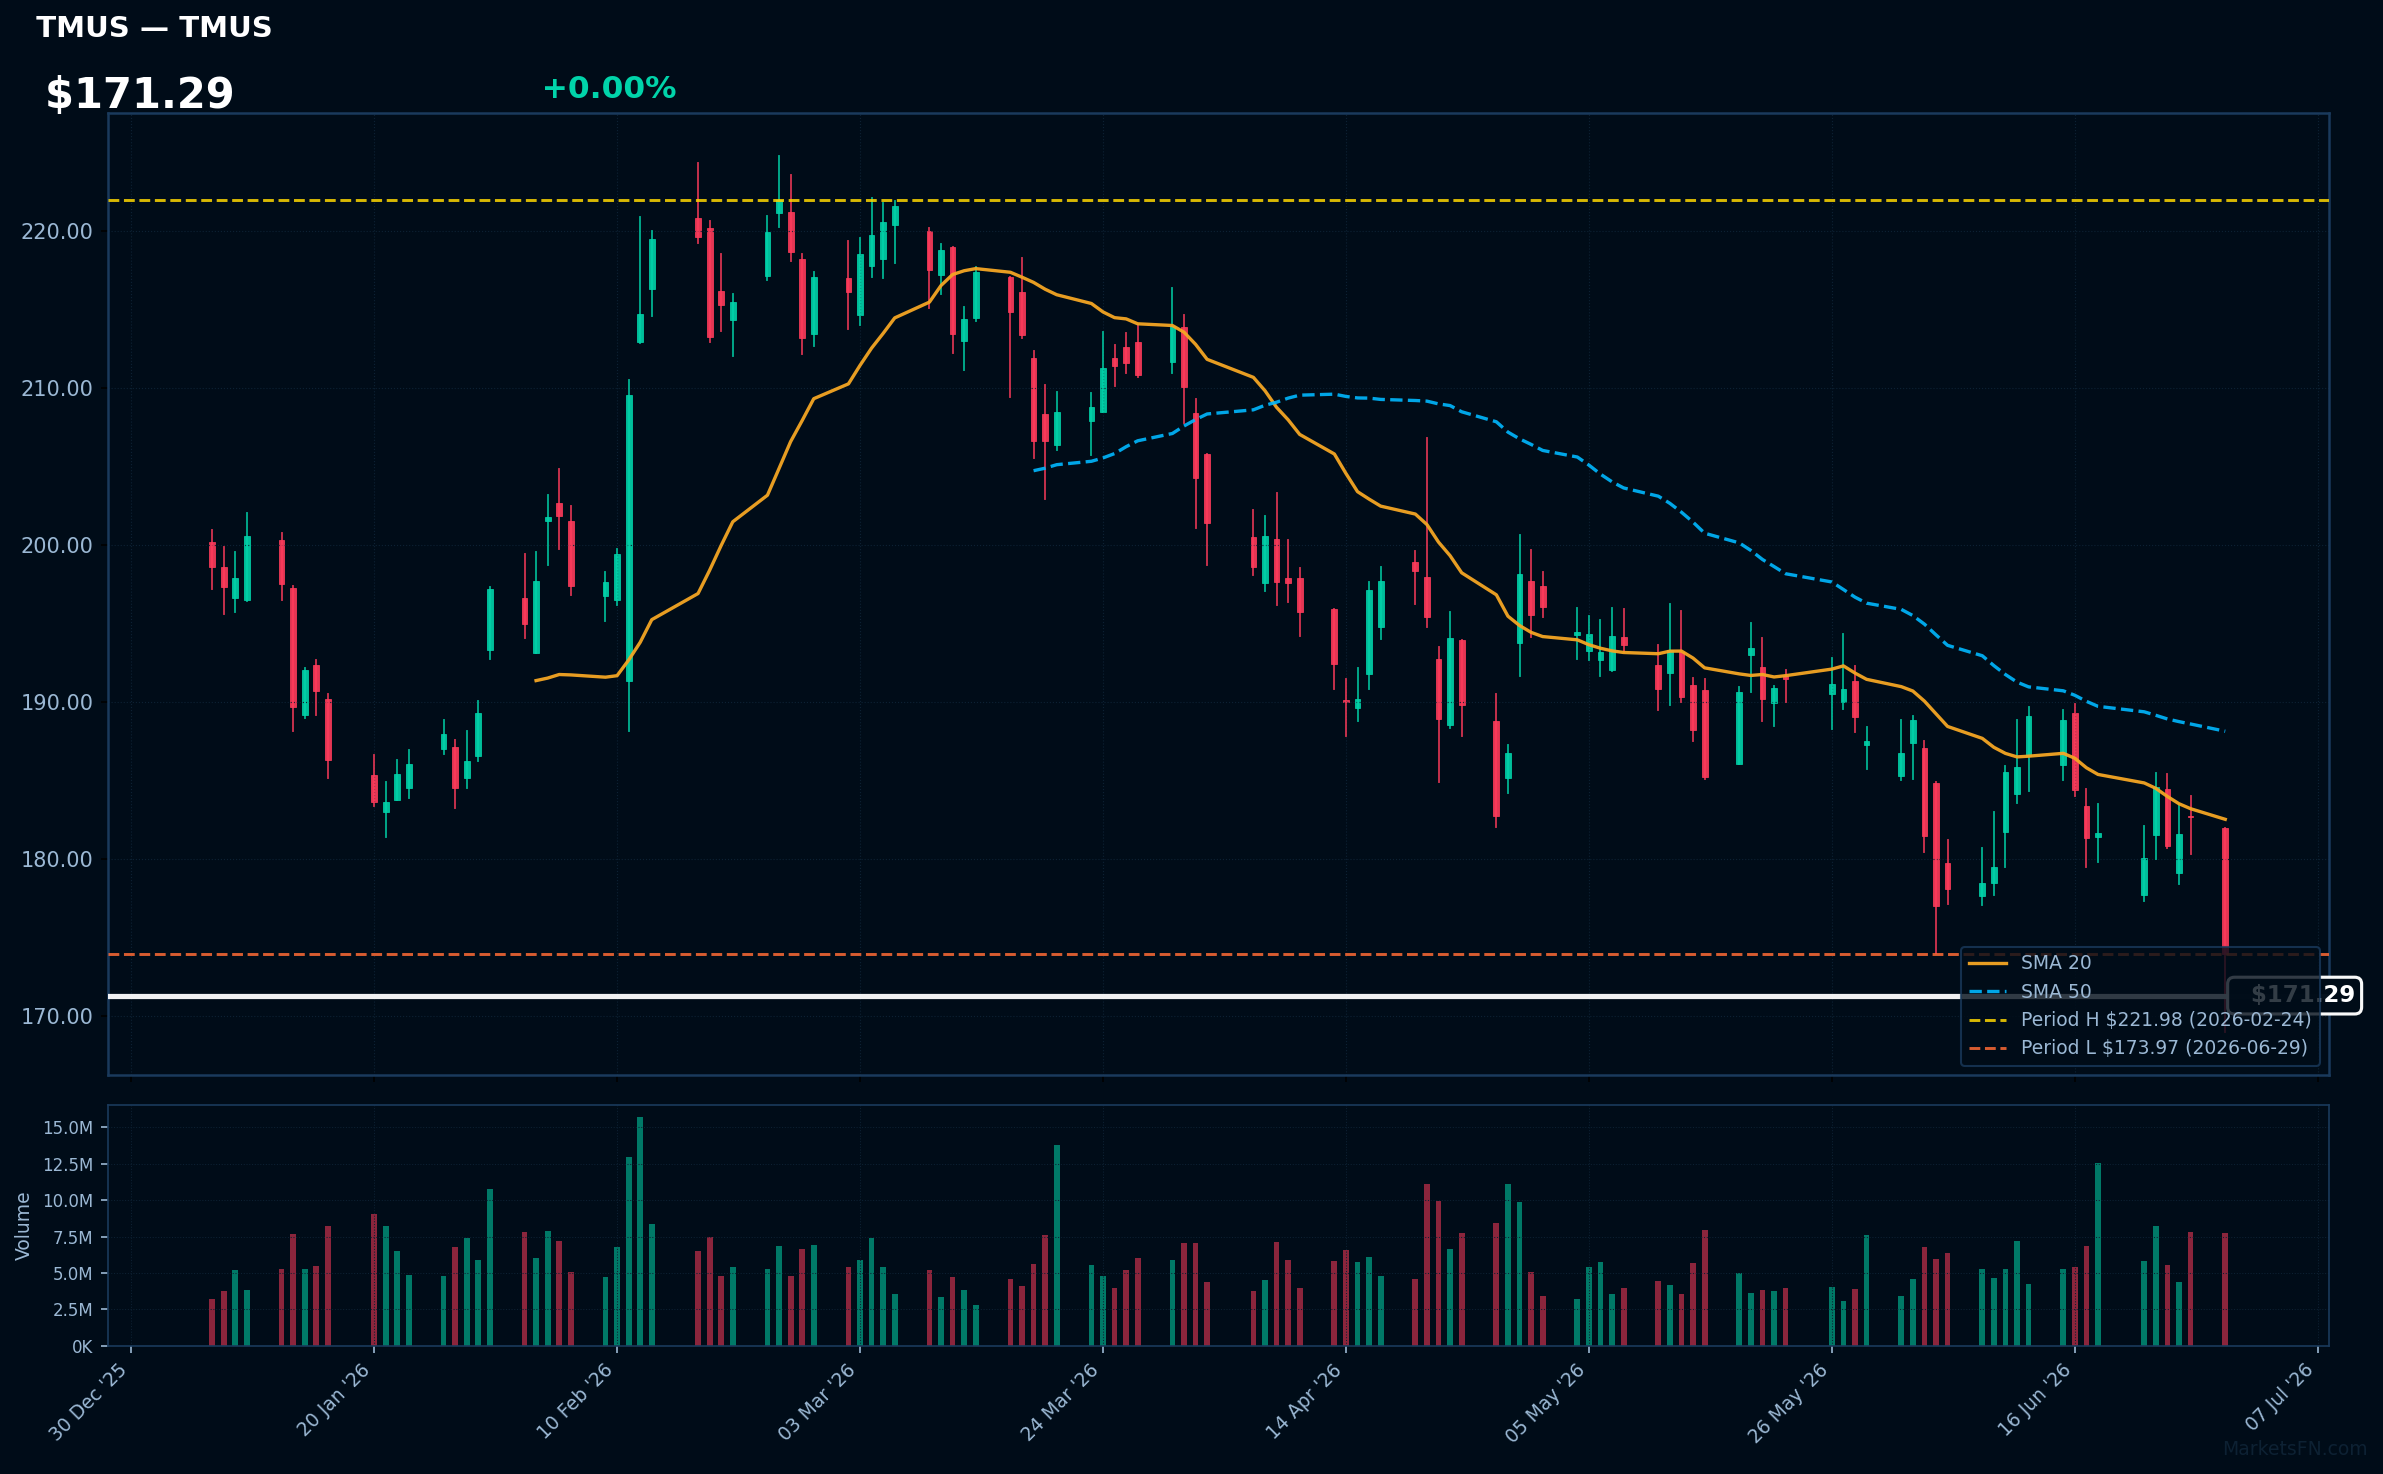
TMUS | T-Mobile US Inc | Communication Services | Price Last: $173.97 | % Realized: -12.83% | RSI: 33.1 | % above MA200: -15.0% | Trend: Below MA20, MA50, MA200
T-Mobile US Inc is a wireless network operator providing mobile services. Investors should care about its competitive positioning in the US telecom market and growth prospects driven by 5G adoption and subscriber acquisition.
T-Mobile US Inc is in a sustained downtrend with price ($171.29) below MA20, MA50, and MA200. RSI(14) is 33.1, near oversold territory. The stock is testing major support at its 2026 YTD low, having fallen 12.8% YTD.
Related headlines
- VZ, T, TMUS Shares Under Pressure SpaceX's Starlink Mobile Service Push Rattles Telecom Stocks
- SpaceX Might Bring Mobile Phone to Market, and Verizon, AT&T, and T-Mobile Are Down
- SPCX Stock: SpaceX's Wireless Ambitions Fuel T-Mobile Acquisition Speculation
- T-Mobile to Host Q2 2026 Earnings Call on July 23, 2026
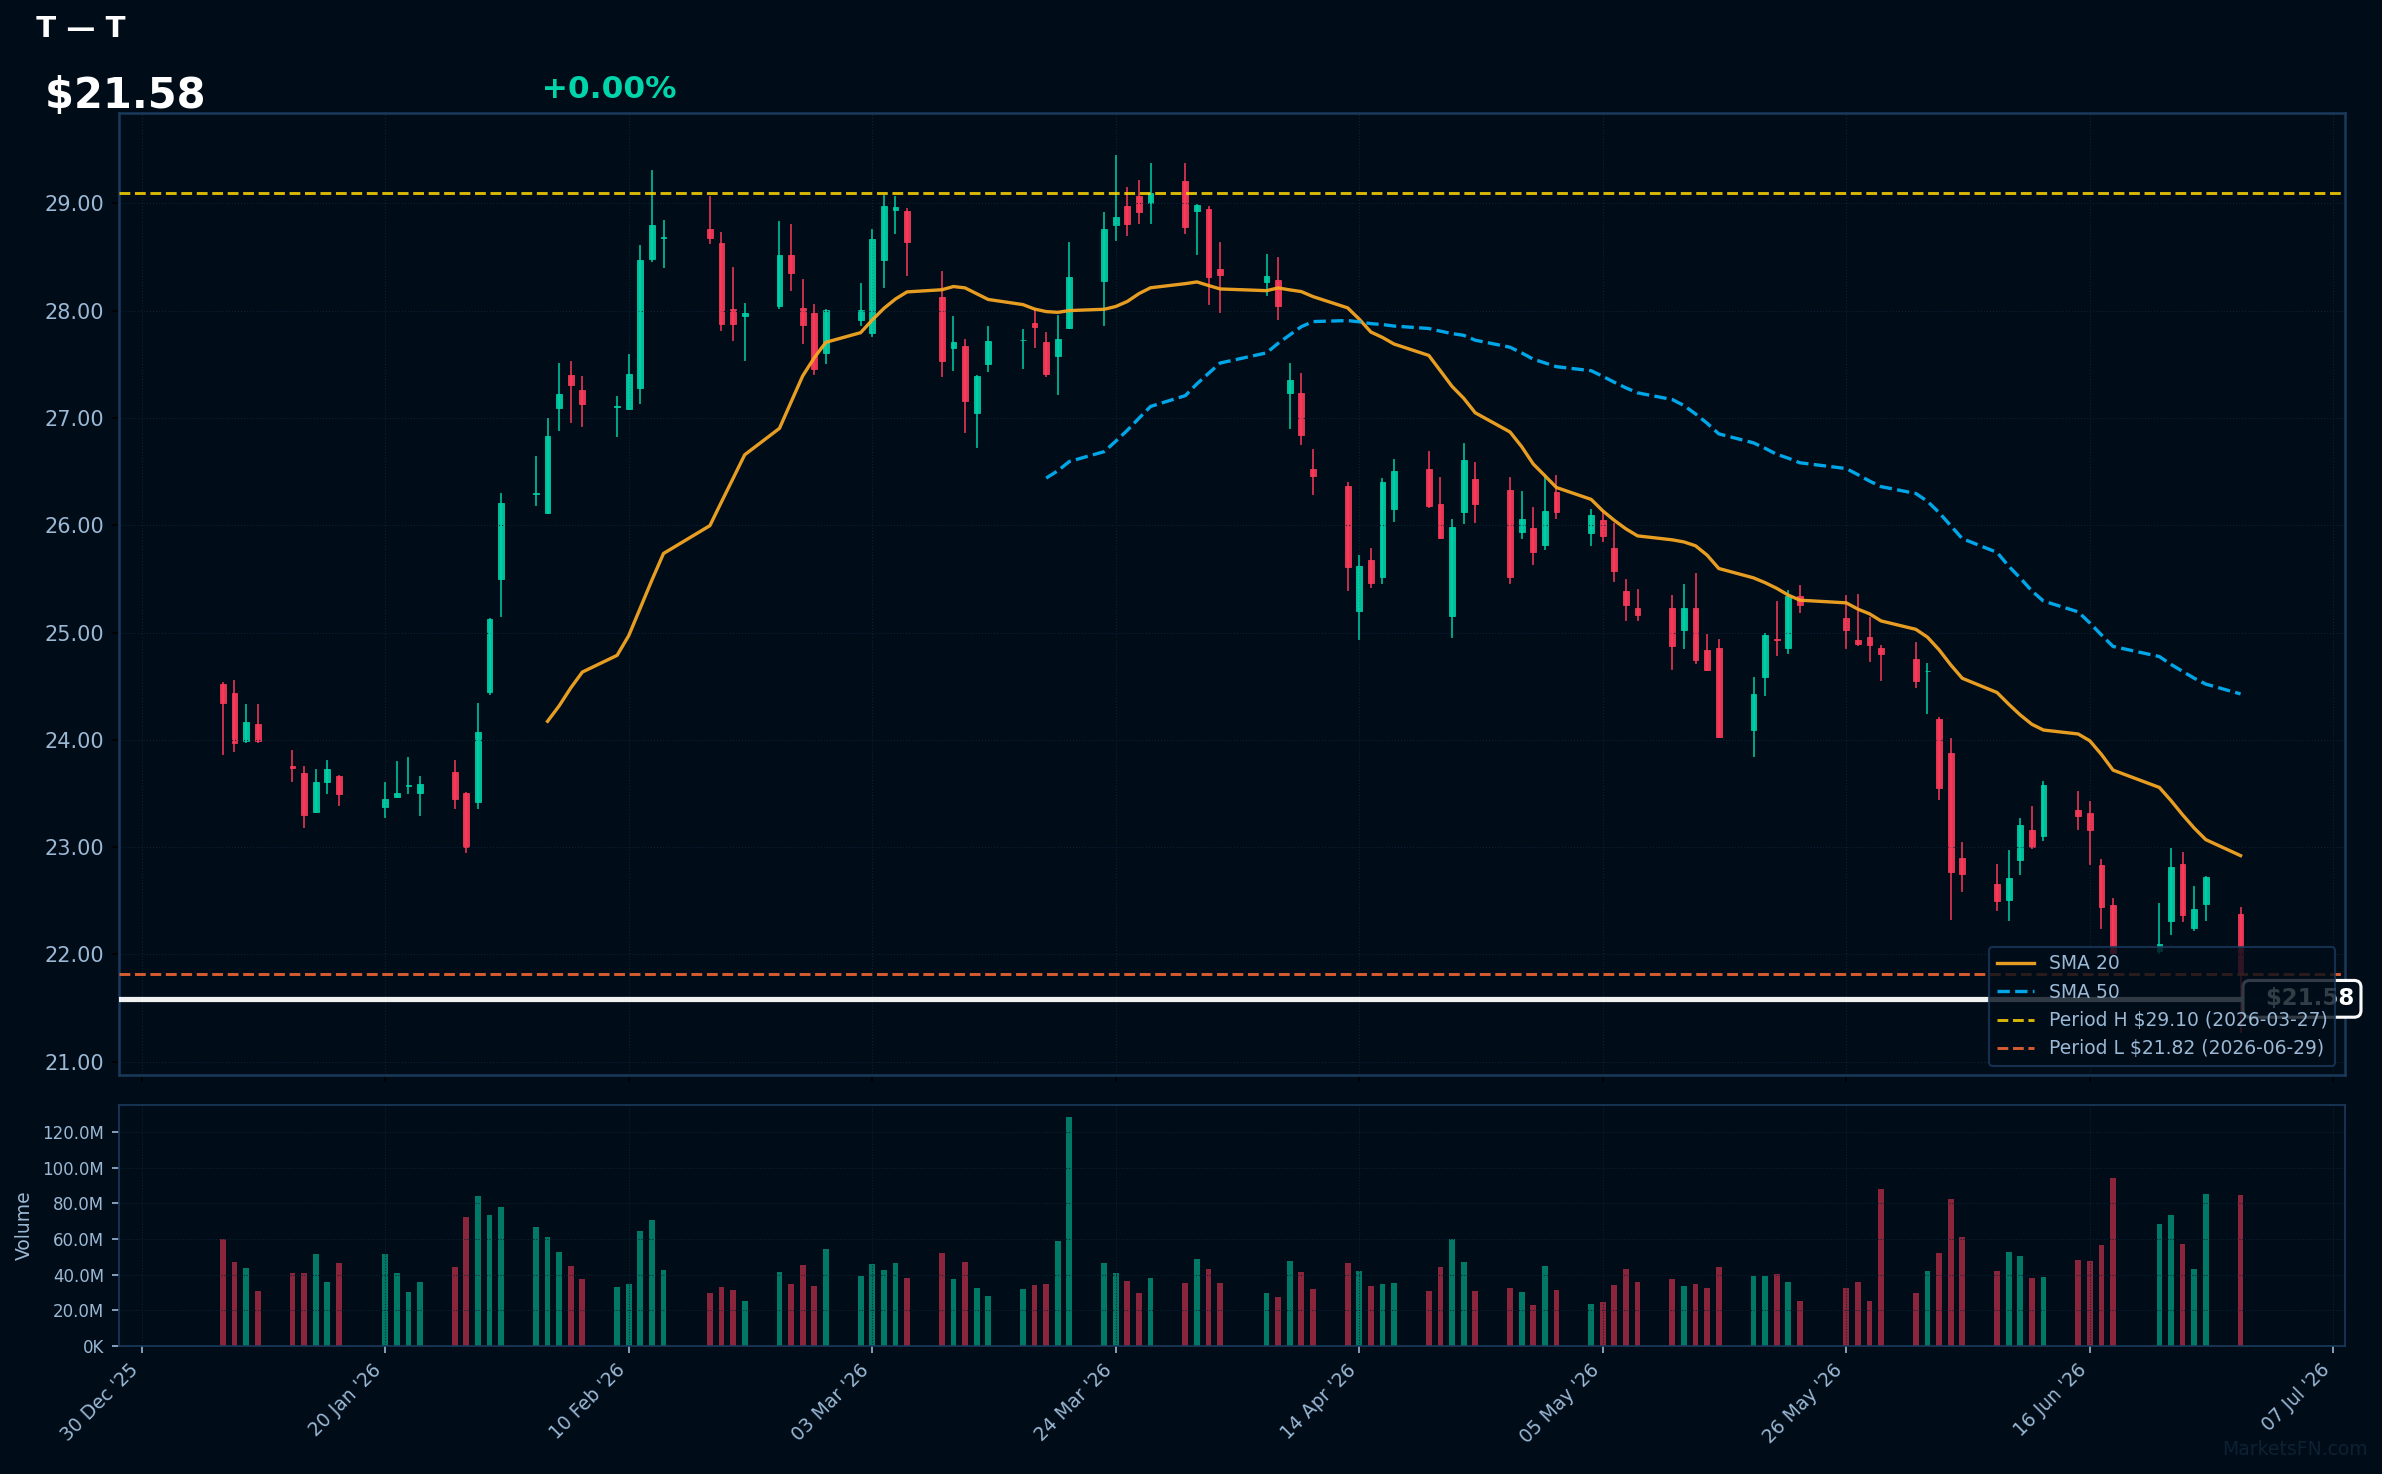
T | AT&T, Inc | Communication Services | Price Last: $21.82 | % Realized: -11.16% | RSI: 33.2 | % above MA200: -15.5% | Trend: Below MA20, MA50, MA200
AT&T, Inc is a telecommunications conglomerate providing wireless communications, local exchange, and long-distance services. Investors should care about its ability to adapt to changing telecom landscapes and manage its substantial debt.
AT&T's current technical situation is bearish, with an RSI(14) of 33.2 indicating oversold conditions, and a sustained downtrend as price ($21.58) remains below MA20, MA50, and MA200, testing major support at its 2026 YTD low.
Related headlines
- AT&T Expands Build-A-Plan: Flexible Custom Wireless Plan Now Includes the Ability to Easily Add America's Best and Fastest Home Internet
- Why Did T, HTZ, GAP Stocks Plunge To 52-Week Lows Today?
- Comcasts NBC Spinoff Raises Questions About Businesses Future
- AT&T Hits 52-Week Low as SpaceX Eyes U.S. Wireless Market
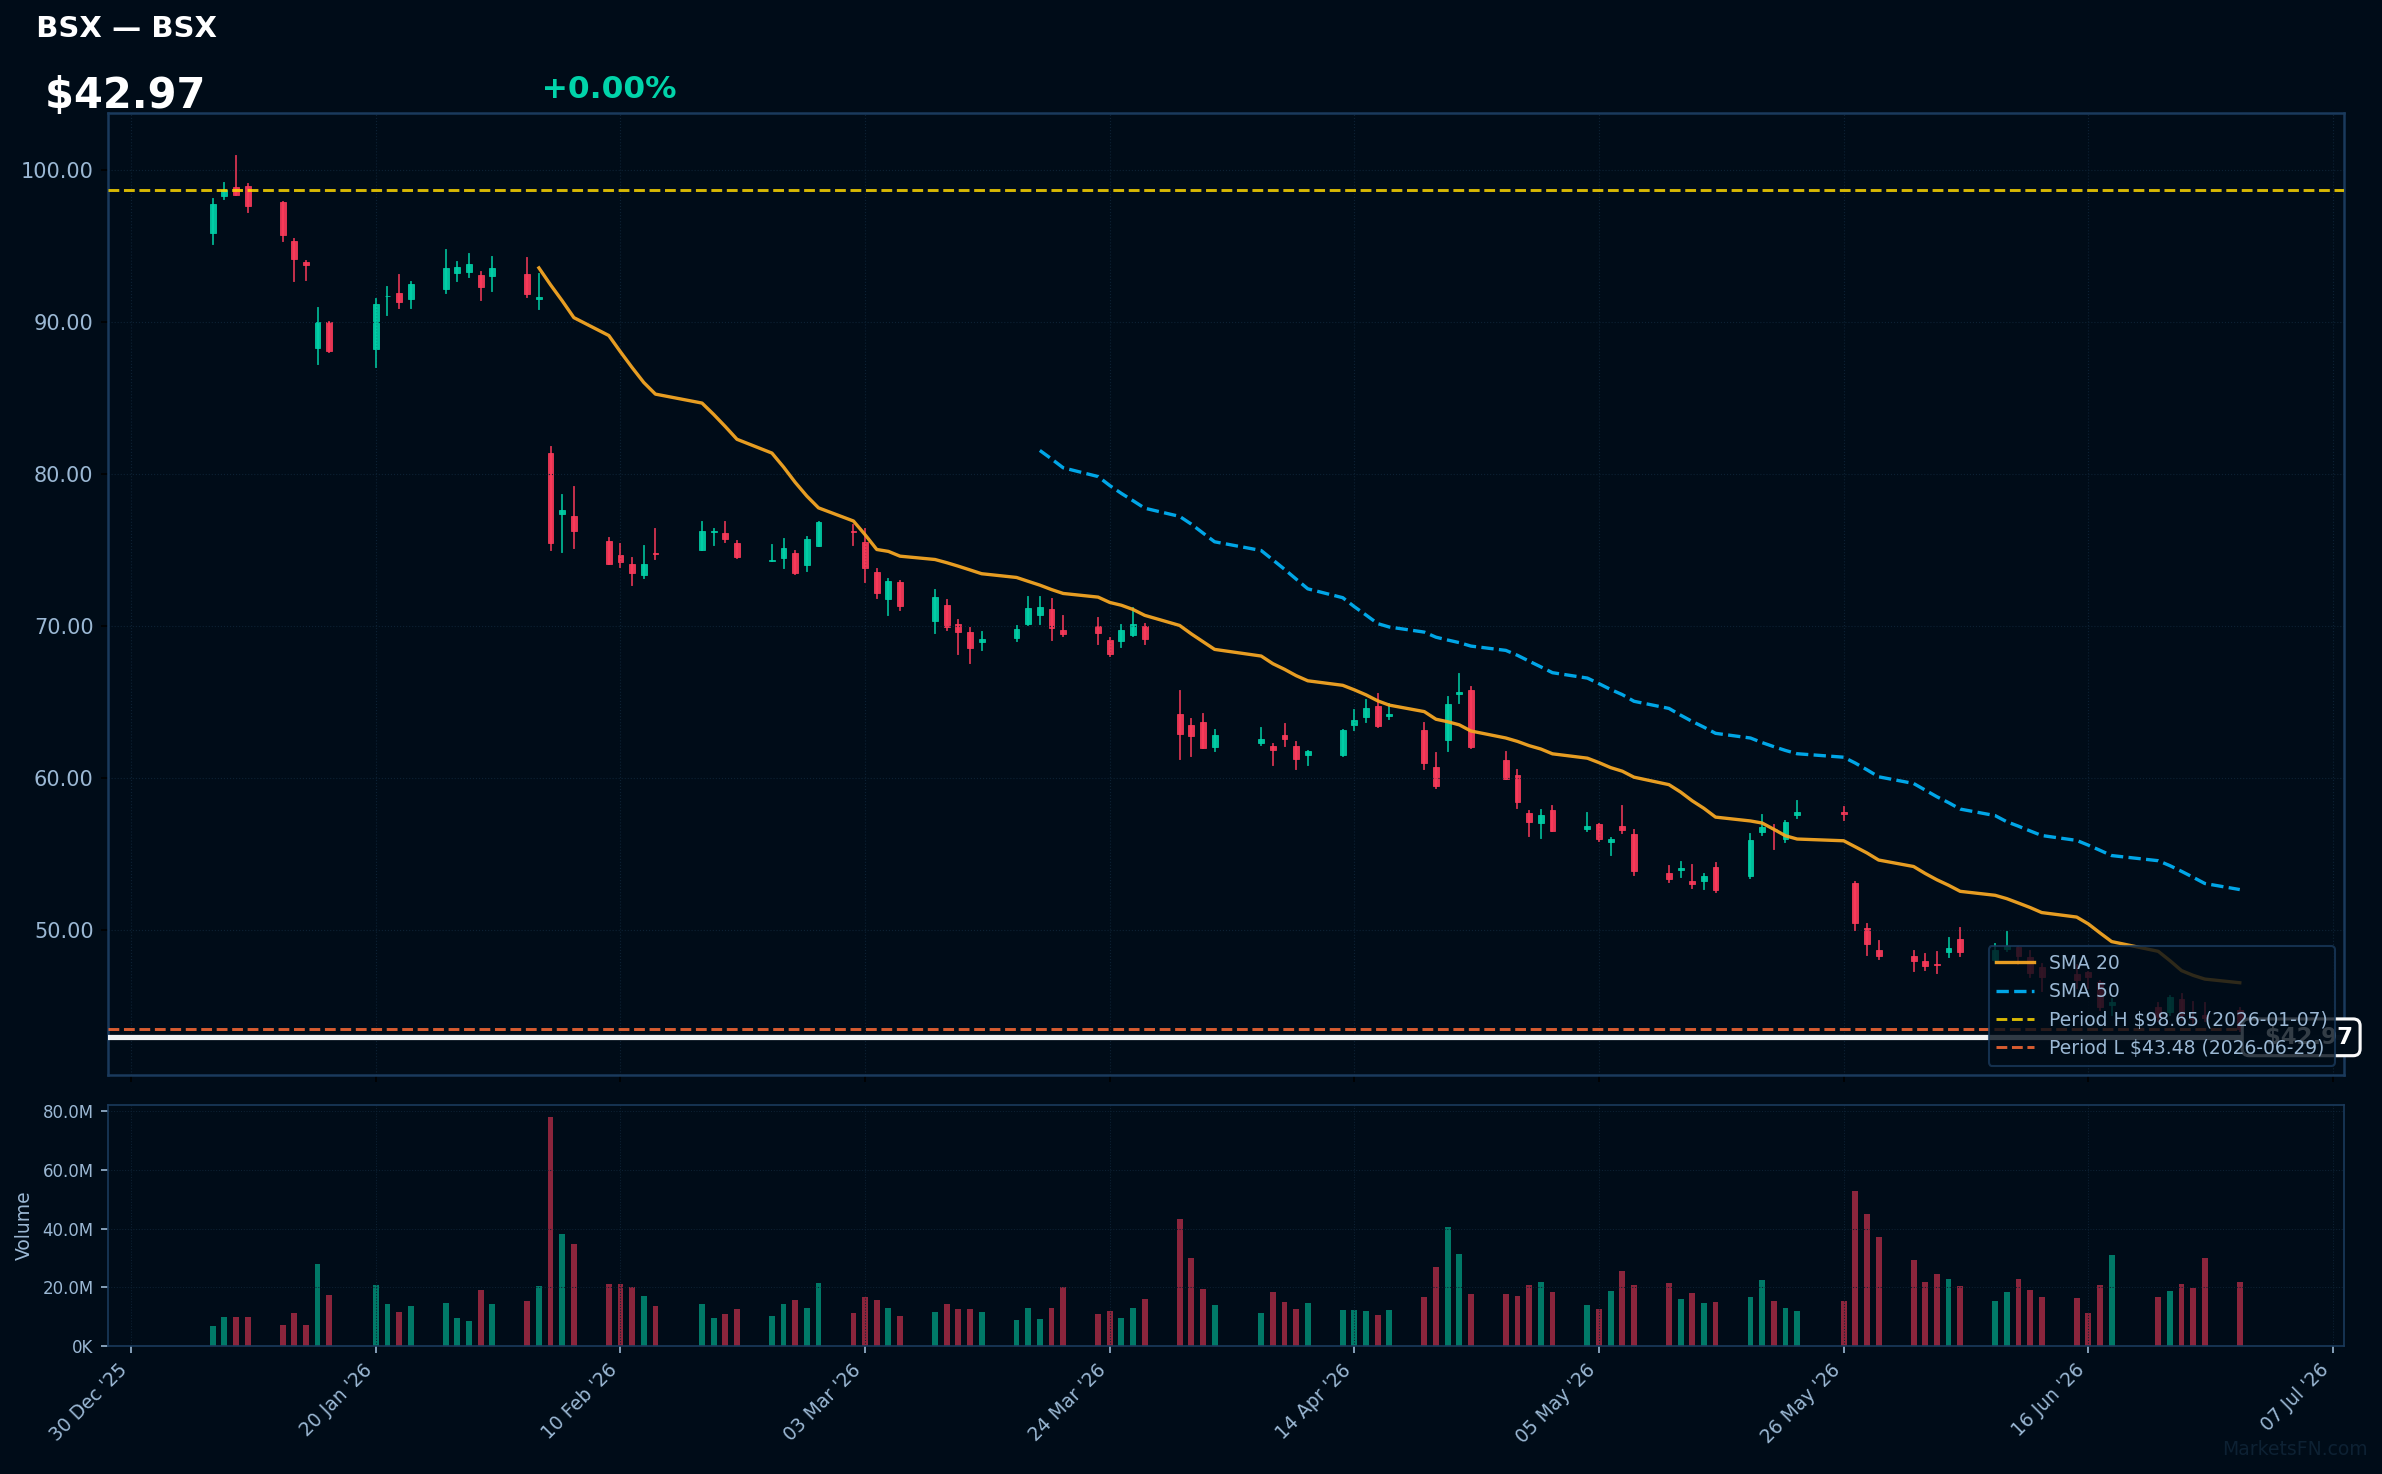
BSX | Boston Scientific Corp | Healthcare | Price Last: $43.48 | % Realized: -54.09% | RSI: 26.1 | % above MA200: -45.0% | Trend: Below MA20, MA50, MA200
Boston Scientific Corp develops and manufactures medical devices, including stents, heart devices, and endoscopy equipment, treating conditions like cardiovascular disease and gastrointestinal disorders. Investors should care about its innovation pipeline and market share in these critical healthcare segments.
The stock's RSI(14) is 26.1, indicating oversold conditions. With price below all MAs (MA20, MA50, MA200) and a -54.1% 2026 YTD return, the sustained downtrend is clear. The stock is at its 2026 YTD low, testing major support.
Related headlines
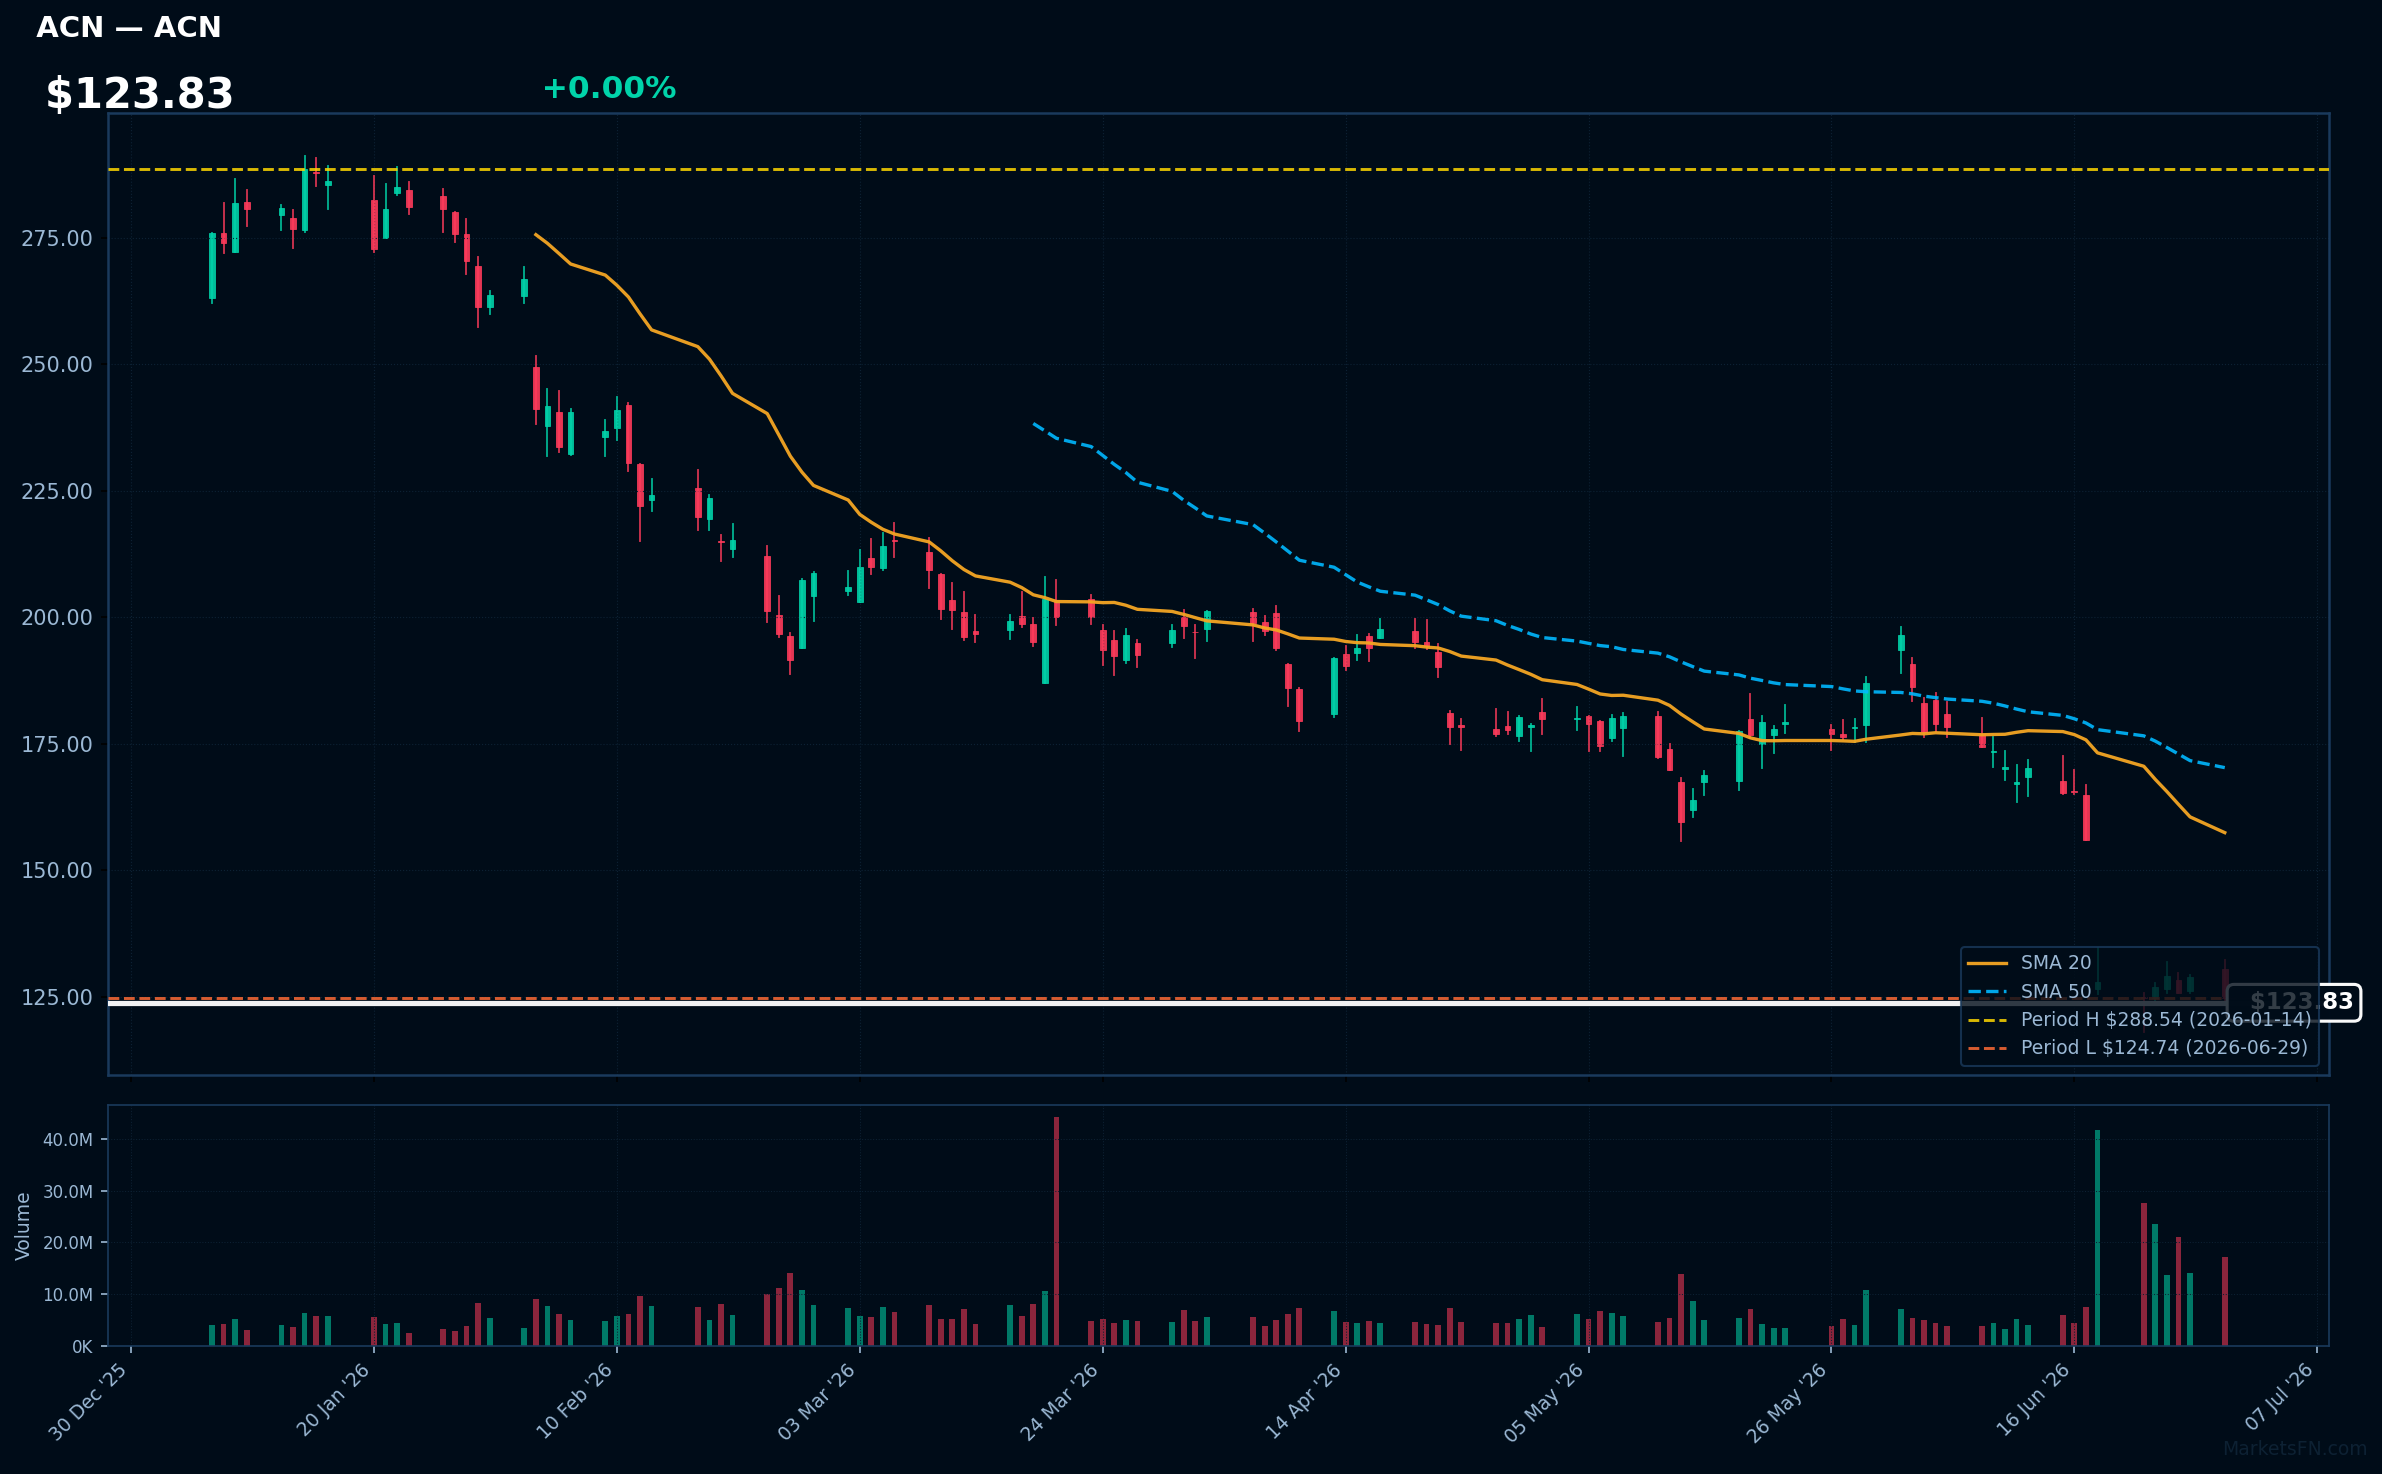
ACN | Accenture plc | Technology | Price Last: $124.74 | % Realized: -52.01% | RSI: 25.0 | % above MA200: -43.7% | Trend: Below MA20, MA50, MA200
Accenture plc is a global professional services company providing strategy, consulting, digital, technology, and operations services. Investors should care because its performance reflects demand for digital transformation and consulting services, impacting its revenue and profitability.
Accenture plc is in a sustained downtrend with price ($123.83) below MA20, MA50, and MA200. The RSI(14) is 25.0, near oversold territory. The stock is testing major support at its 2026 YTD low, having fallen -52.0% YTD, indicating a potential warning sign.
Related headlines
- ServiceNow, Accenture unveil AI-driven cyber risk management offering
- Accenture Stock Is Under Pressure. Its Biggest Clients Tell A Different Story.
- ServiceNow, Accenture Expand AI Cyber Push
- ServiceNow and Accenture launch AI-powered services to accelerate the shift from legacy risk platforms to agentic AI
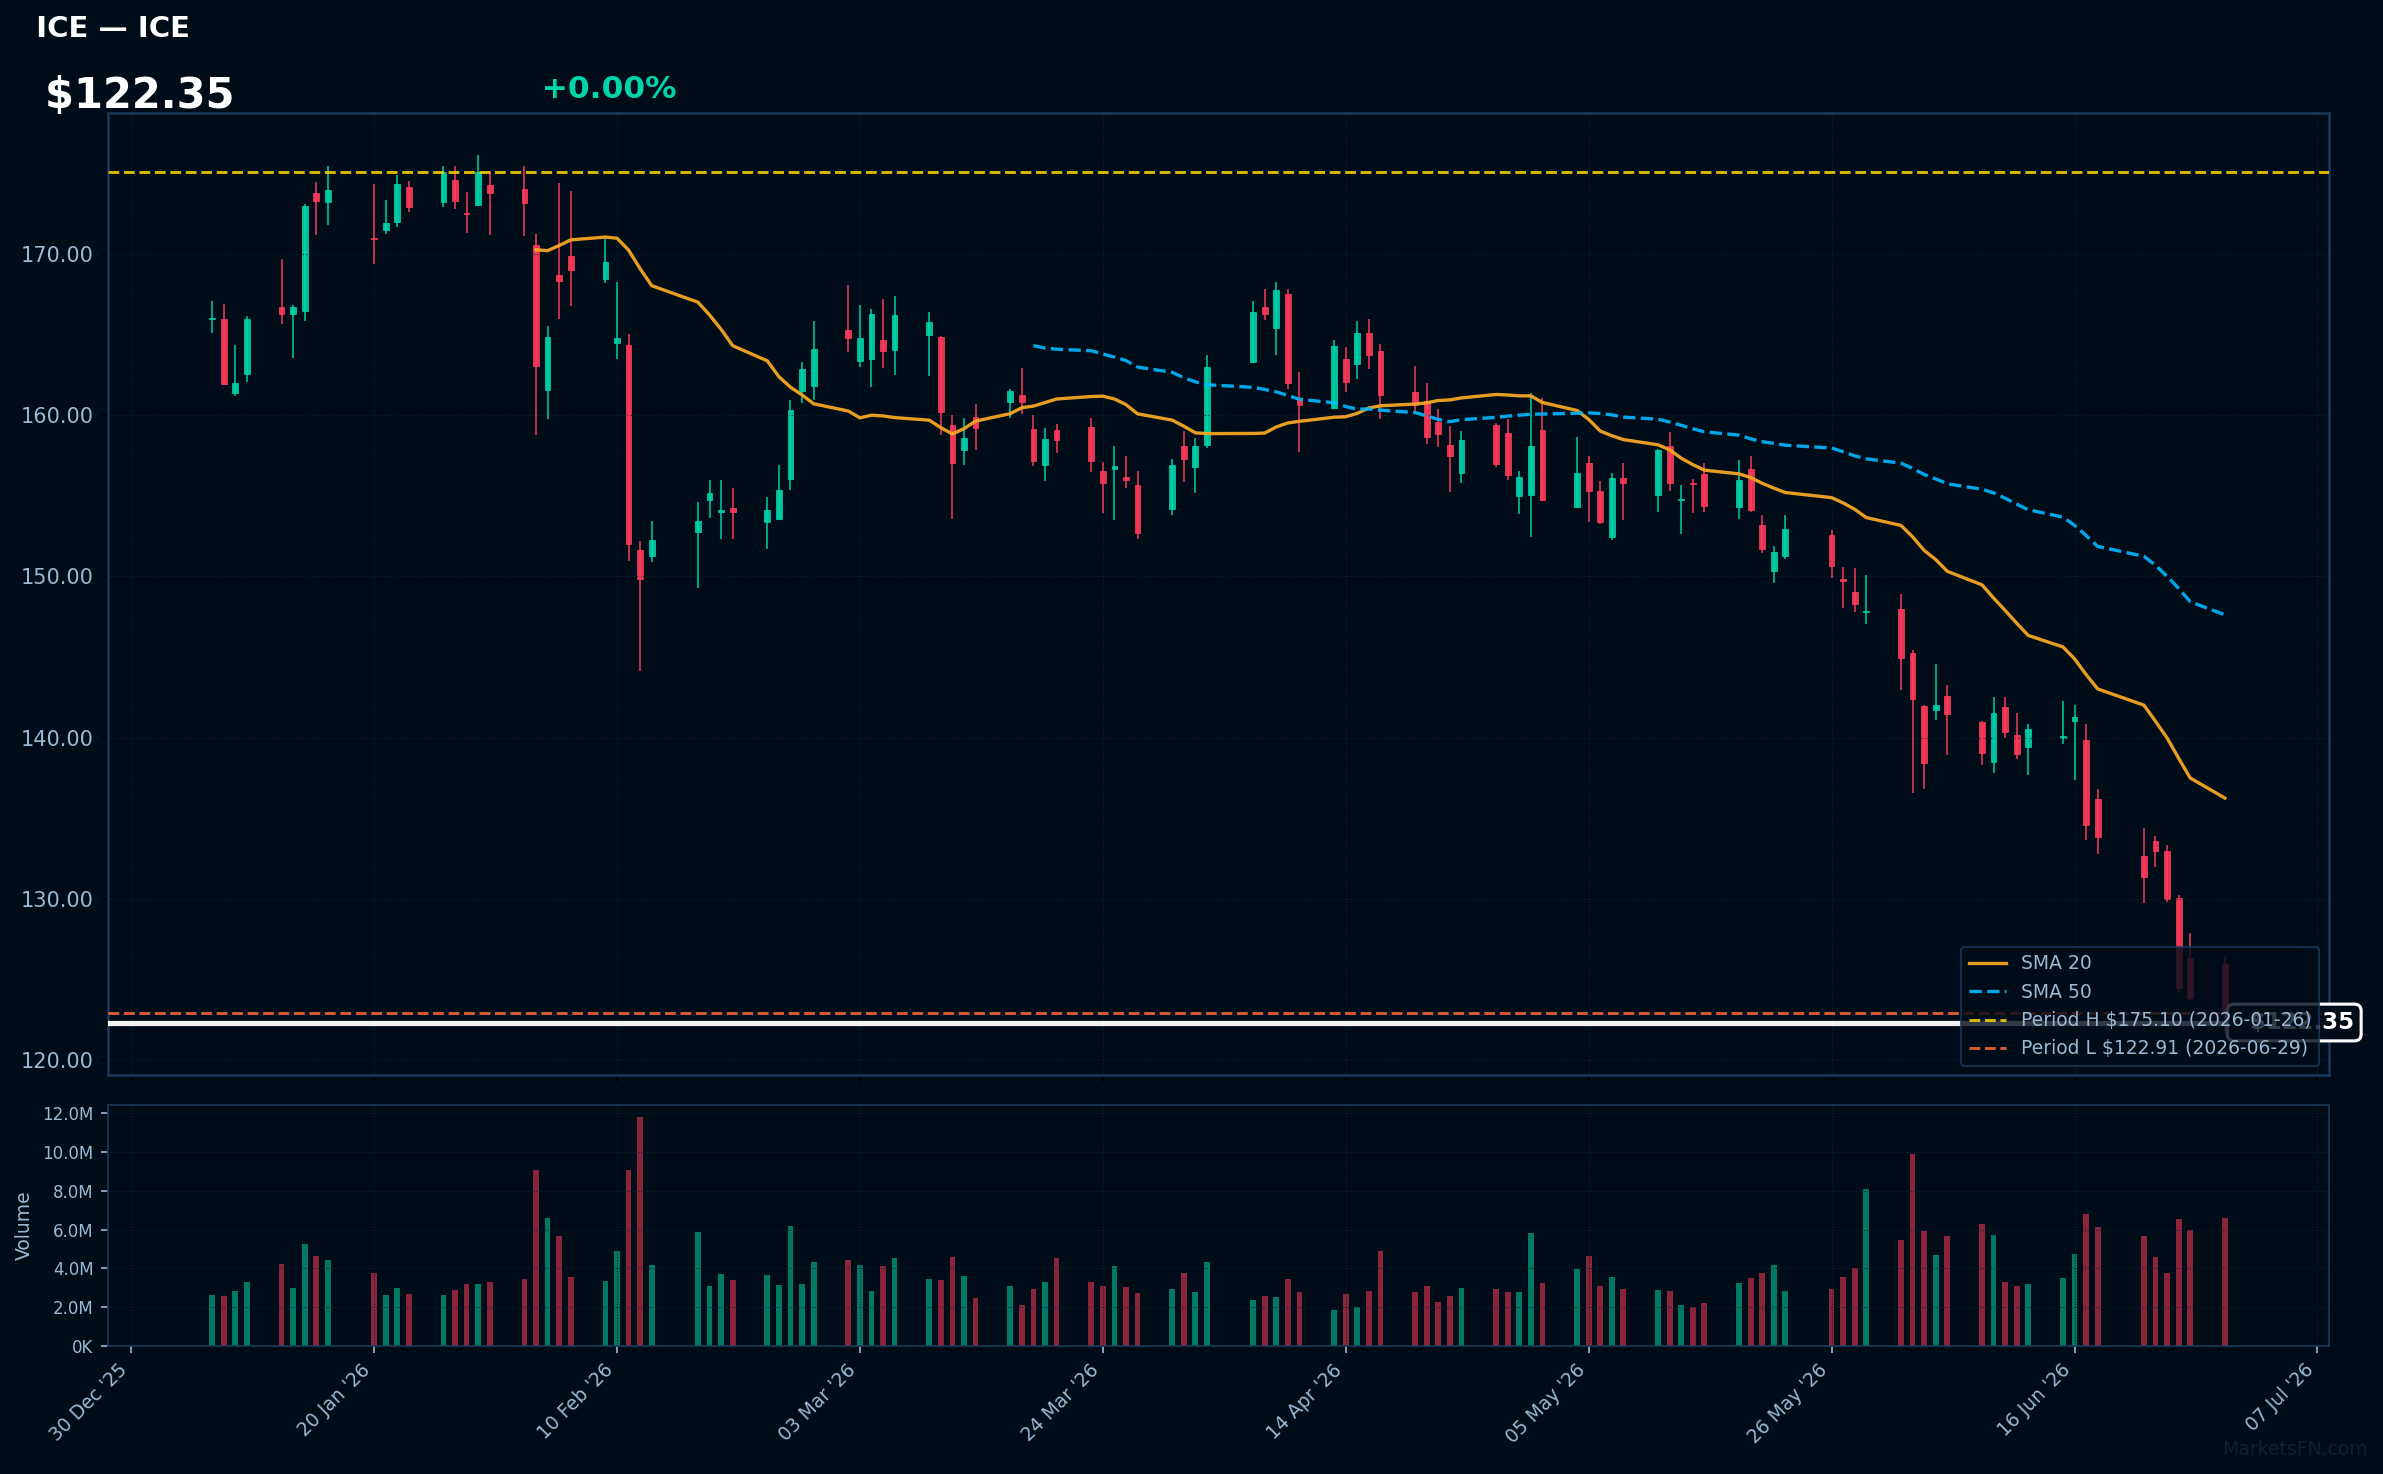
ICE | Intercontinental Exchange Inc | Financial | Price Last: $122.91 | % Realized: -23.18% | RSI: 21.1 | % above MA200: -21.9% | Trend: Below MA20, MA50, MA200
Intercontinental Exchange Inc (ICE) operates global exchanges, clearing houses, and data services, facilitating trading in financial and commodity markets; investors should care because ICE's platforms handle significant trading volumes and provide critical infrastructure for global financial markets.
ICE's technical situation indicates a warning sign: RSI(14) is 21.1, indicating oversold conditions, and the stock is in a sustained downtrend with price ($122.35) below MA20, MA50, and MA200; it's testing major support at its 2026 YTD low.
Related headlines
- ICE to Launch Economic Indicator Futures Contracts
- ICE First Look at Mortgage Performance: Mortgage Performance Holds Steady Despite Calendar-Driven Rise in Delinquencies
- ICE & OKX Are Getting Ready to Drink Coinbases Tokenized Milkshake
- ICE Invests in OKX at $25 Billion to Launch Tokenized NYSE Stocks
Market Commentary
The S&P 500 stocks listed are currently trading near their year-to-date (YTD) extremes for 2026. Specifically, LLY, JNJ, ABBV, GE, and MRK are at their YTD highs, while TMUS, T, BSX, ACN, and ICE are at their YTD lows. This indicates that these stocks have either reached new highs or lows since the beginning of 2026 and are currently trading at or very near those levels.
The stocks near YTD highs are primarily from the healthcare sector, with Eli Lilly, Johnson & Johnson, AbbVie, and Merck all being major pharmaceutical companies. GE Aerospace, a conglomerate with a significant presence in the aerospace industry, is also at its high. In contrast, the stocks near YTD lows are from a mix of sectors, including telecommunications (TMUS and T), medical devices (BSX), technology consulting (ACN), and financial services (ICE). This divergence may indicate varying sector-specific market conditions and investor sentiment.
Investors should monitor these stocks for any signs of breakout or reversal, as a move away from these extreme levels could indicate a shift in market sentiment or sector rotation. Watching the underlying factors driving these stocks, such as earnings reports and industry trends, will be crucial in determining their next moves.
Methodology: All 503 S&P 500 constituents screened. Close prices downloaded from 2026-01-01. Period high = highest close since Jan 1 2026; period low = lowest close since Jan 1 2026. Distance = (current price / period extreme − 1) × 100. Technical indicators computed on up to 1 year of daily OHLCV data.
Disclaimer: For informational purposes only. Not investment advice. Past performance is not indicative of future results.