Nasdaq 100 Bull & Bear Radar — June 30, 2026
· Stocks · QuoteReporter
Nasdaq 100 Bull & Bear Radar — June 30, 2026
A daily technical sweep of 101 Nasdaq 100 constituents ranked by session performance, enriched with RSI, MA20/MA50/MA200 trend signals, Bloomberg-style charts, and recent news.
Index-Wide Breadth
| Constituents tracked | 101 |
| Advancing | 44 (43.6%) |
| Declining | 57 (56.4%) |
| Average daily change | +0.10% |
| Above MA200 | 13 (12.9%) |
Top 10 Gainers
Today's strongest Nasdaq 100 performers. Sector leadership: Technology (9), Industrials (1).
| Ticker | Company | Sector | Price | Day % | 1W % | 1M % | RSI | vs MA200 | Trend |
|---|---|---|---|---|---|---|---|---|---|
| AXON | Axon Enterprise Inc | Industrials | $543.76 | +6.49% | +25.57% | +21.18% | 71.4 | +1.6% | Above MA20, MA50, MA200 |
| KLAC | KLA Corp | Technology | $295.79 | +6.25% | +21.07% | +54.03% | 69.9 | +96.6% | Above MA20, MA50, MA200 |
| MRVL | Marvell Technology Inc | Technology | $294.69 | +6.10% | +5.62% | +43.76% | 58.7 | +144.2% | Above MA20, MA50, MA200 |
| ON | ON Semiconductor Corp | Technology | $93.31 | +5.35% | -20.33% | -22.68% | 39.6 | +32.2% | Above MA200 · Below MA20, MA50 |
| LRCX | Lam Research Corp | Technology | $432.21 | +5.18% | +16.40% | +35.84% | 67.0 | +96.2% | Above MA20, MA50, MA200 |
| INTC | Intel Corp | Technology | $137.34 | +4.27% | +3.92% | +19.87% | 62.1 | +131.5% | Above MA20, MA50, MA200 |
| ASML | ASML Holding NV | Technology | $1962.79 | +4.23% | +10.36% | +21.70% | 62.6 | +50.4% | Above MA20, MA50, MA200 |
| ARM | Arm Holdings plc. ADR | Technology | $358.11 | +4.23% | -2.35% | +1.27% | 52.7 | +104.1% | Above MA50, MA200 · Below MA20 |
| AMAT | Applied Materials Inc | Technology | $721.75 | +3.90% | +23.23% | +60.42% | 72.3 | +115.6% | Above MA20, MA50, MA200 |
| TXN | Texas Instruments Inc | Technology | $294.21 | +3.06% | -3.25% | -3.67% | 48.4 | +37.3% | Above MA50, MA200 · Below MA20 |
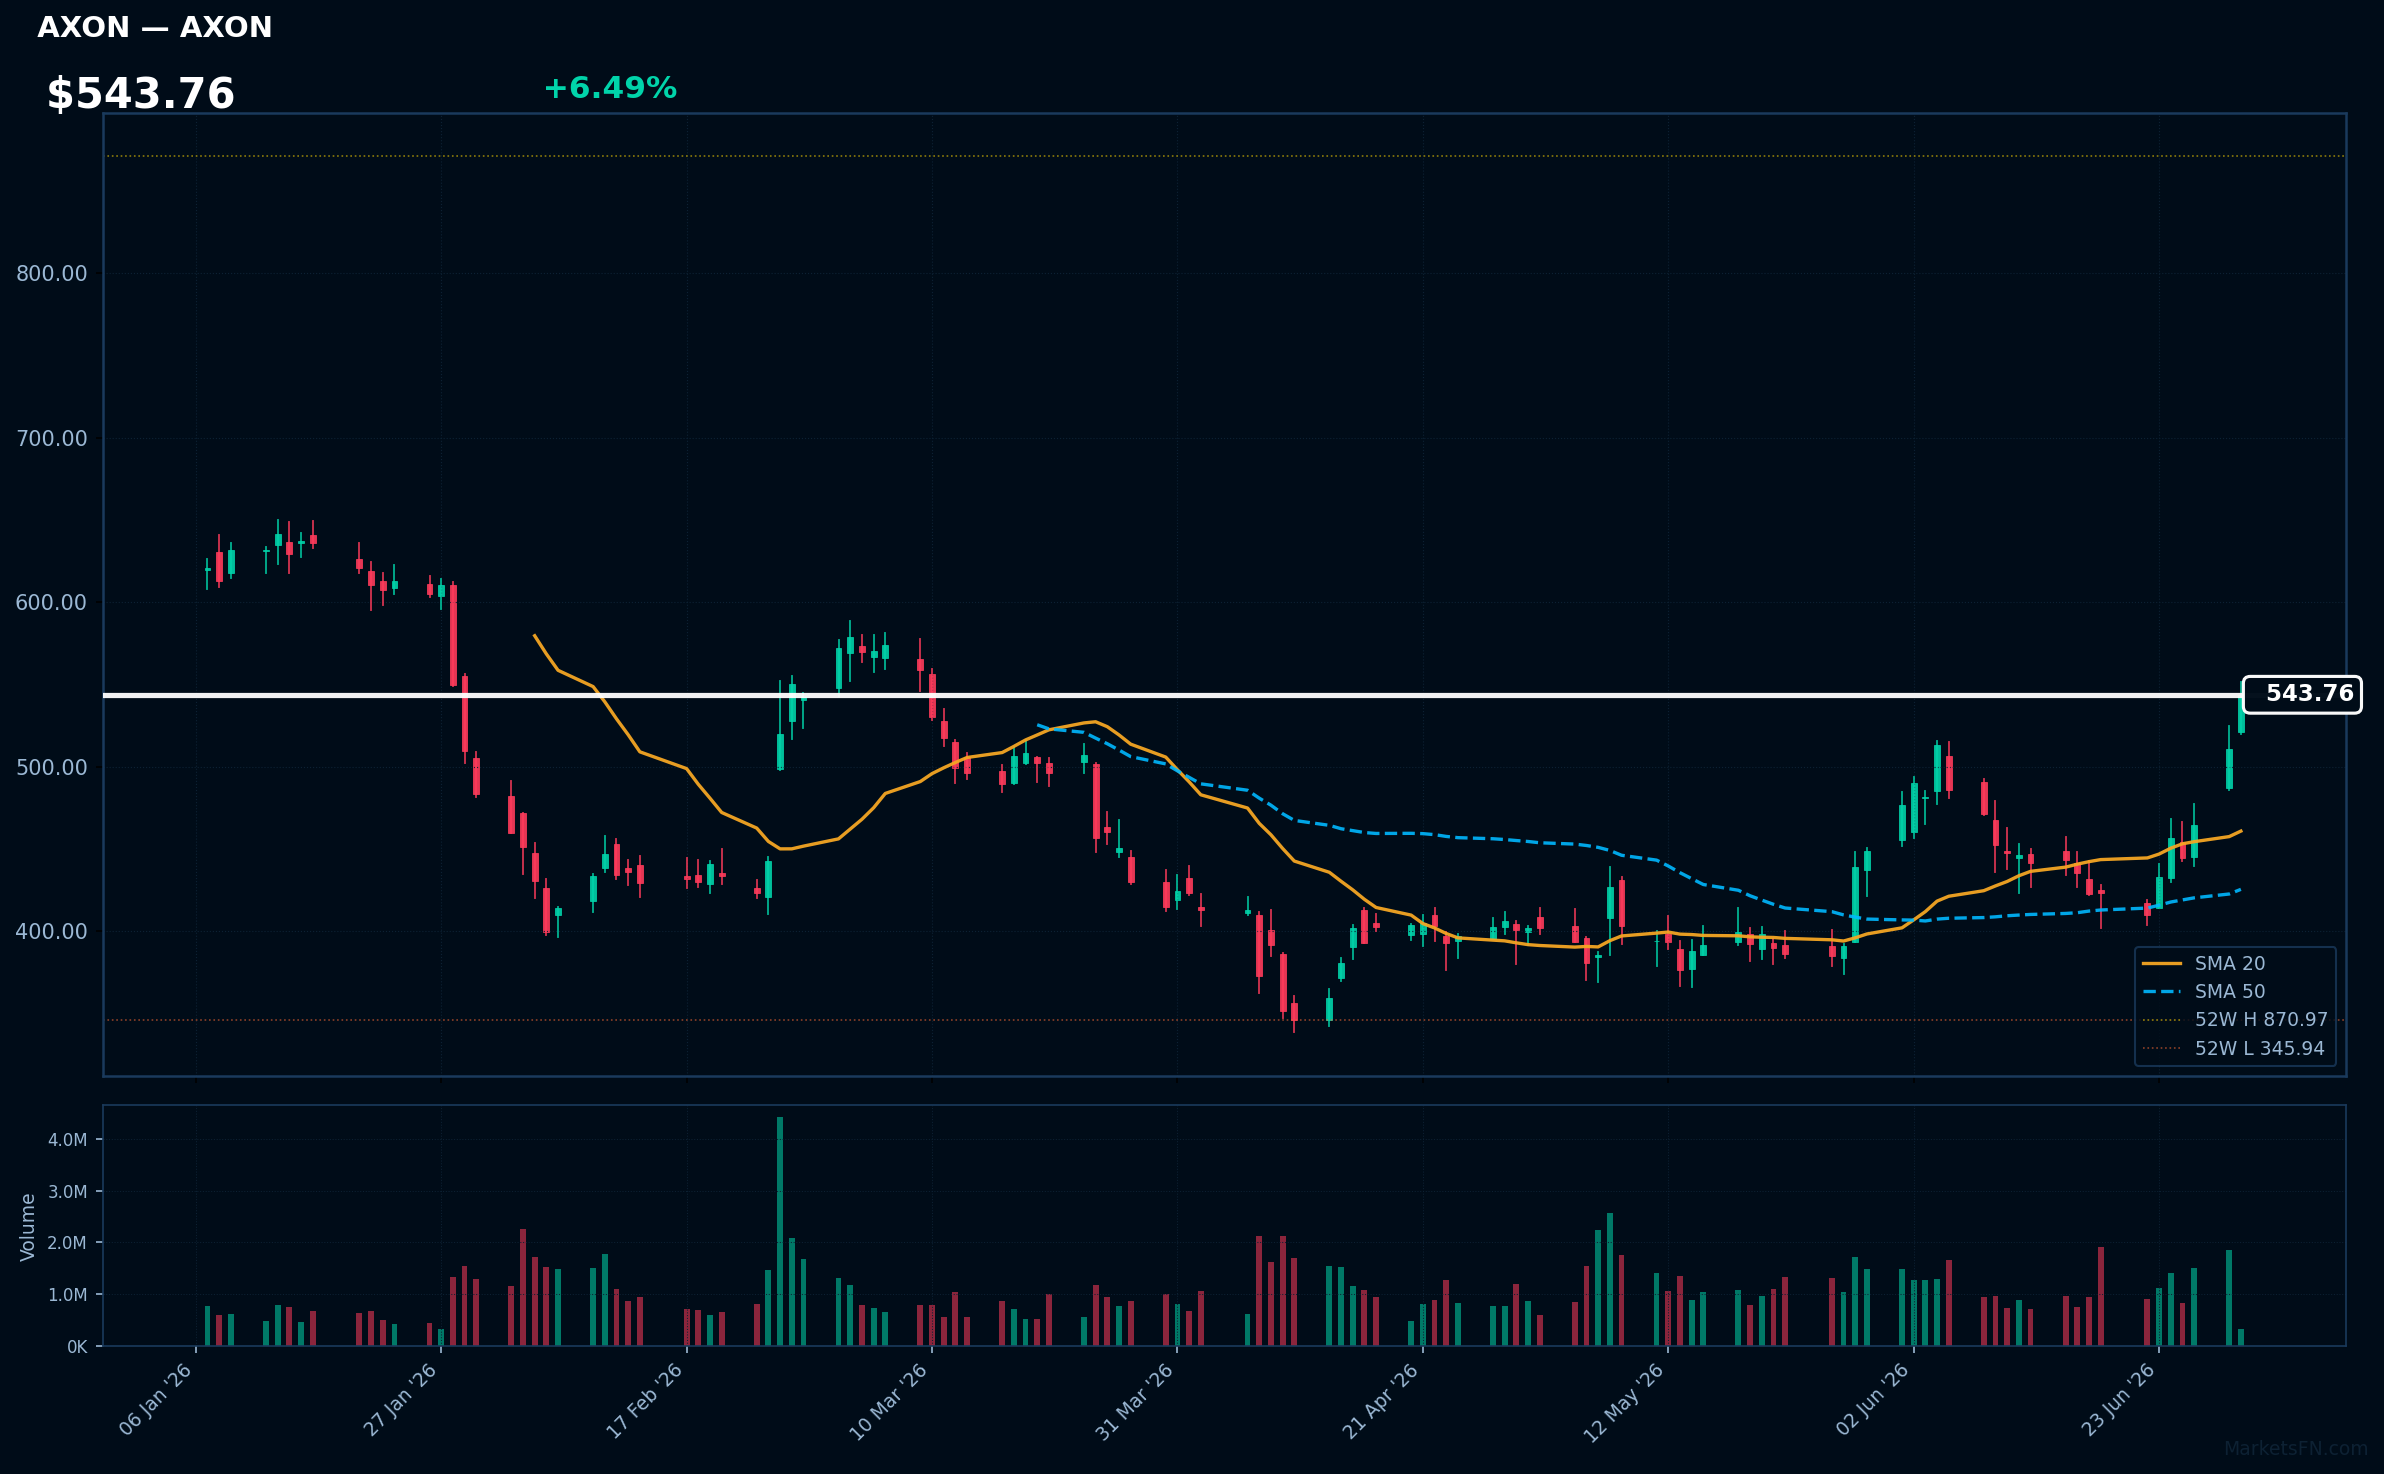
AXON | Axon Enterprise Inc | Industrials | Price: $543.76 | Day: +6.49% | 1W: +25.57% | 1M: +21.18% | RSI: 71.4 | vs MA200: +1.6% | Trend: Above MA20, MA50, MA200
Recent headlines (last 12h)
- CEO of Taser maker Axon: We are moving closer to making bullets extinct
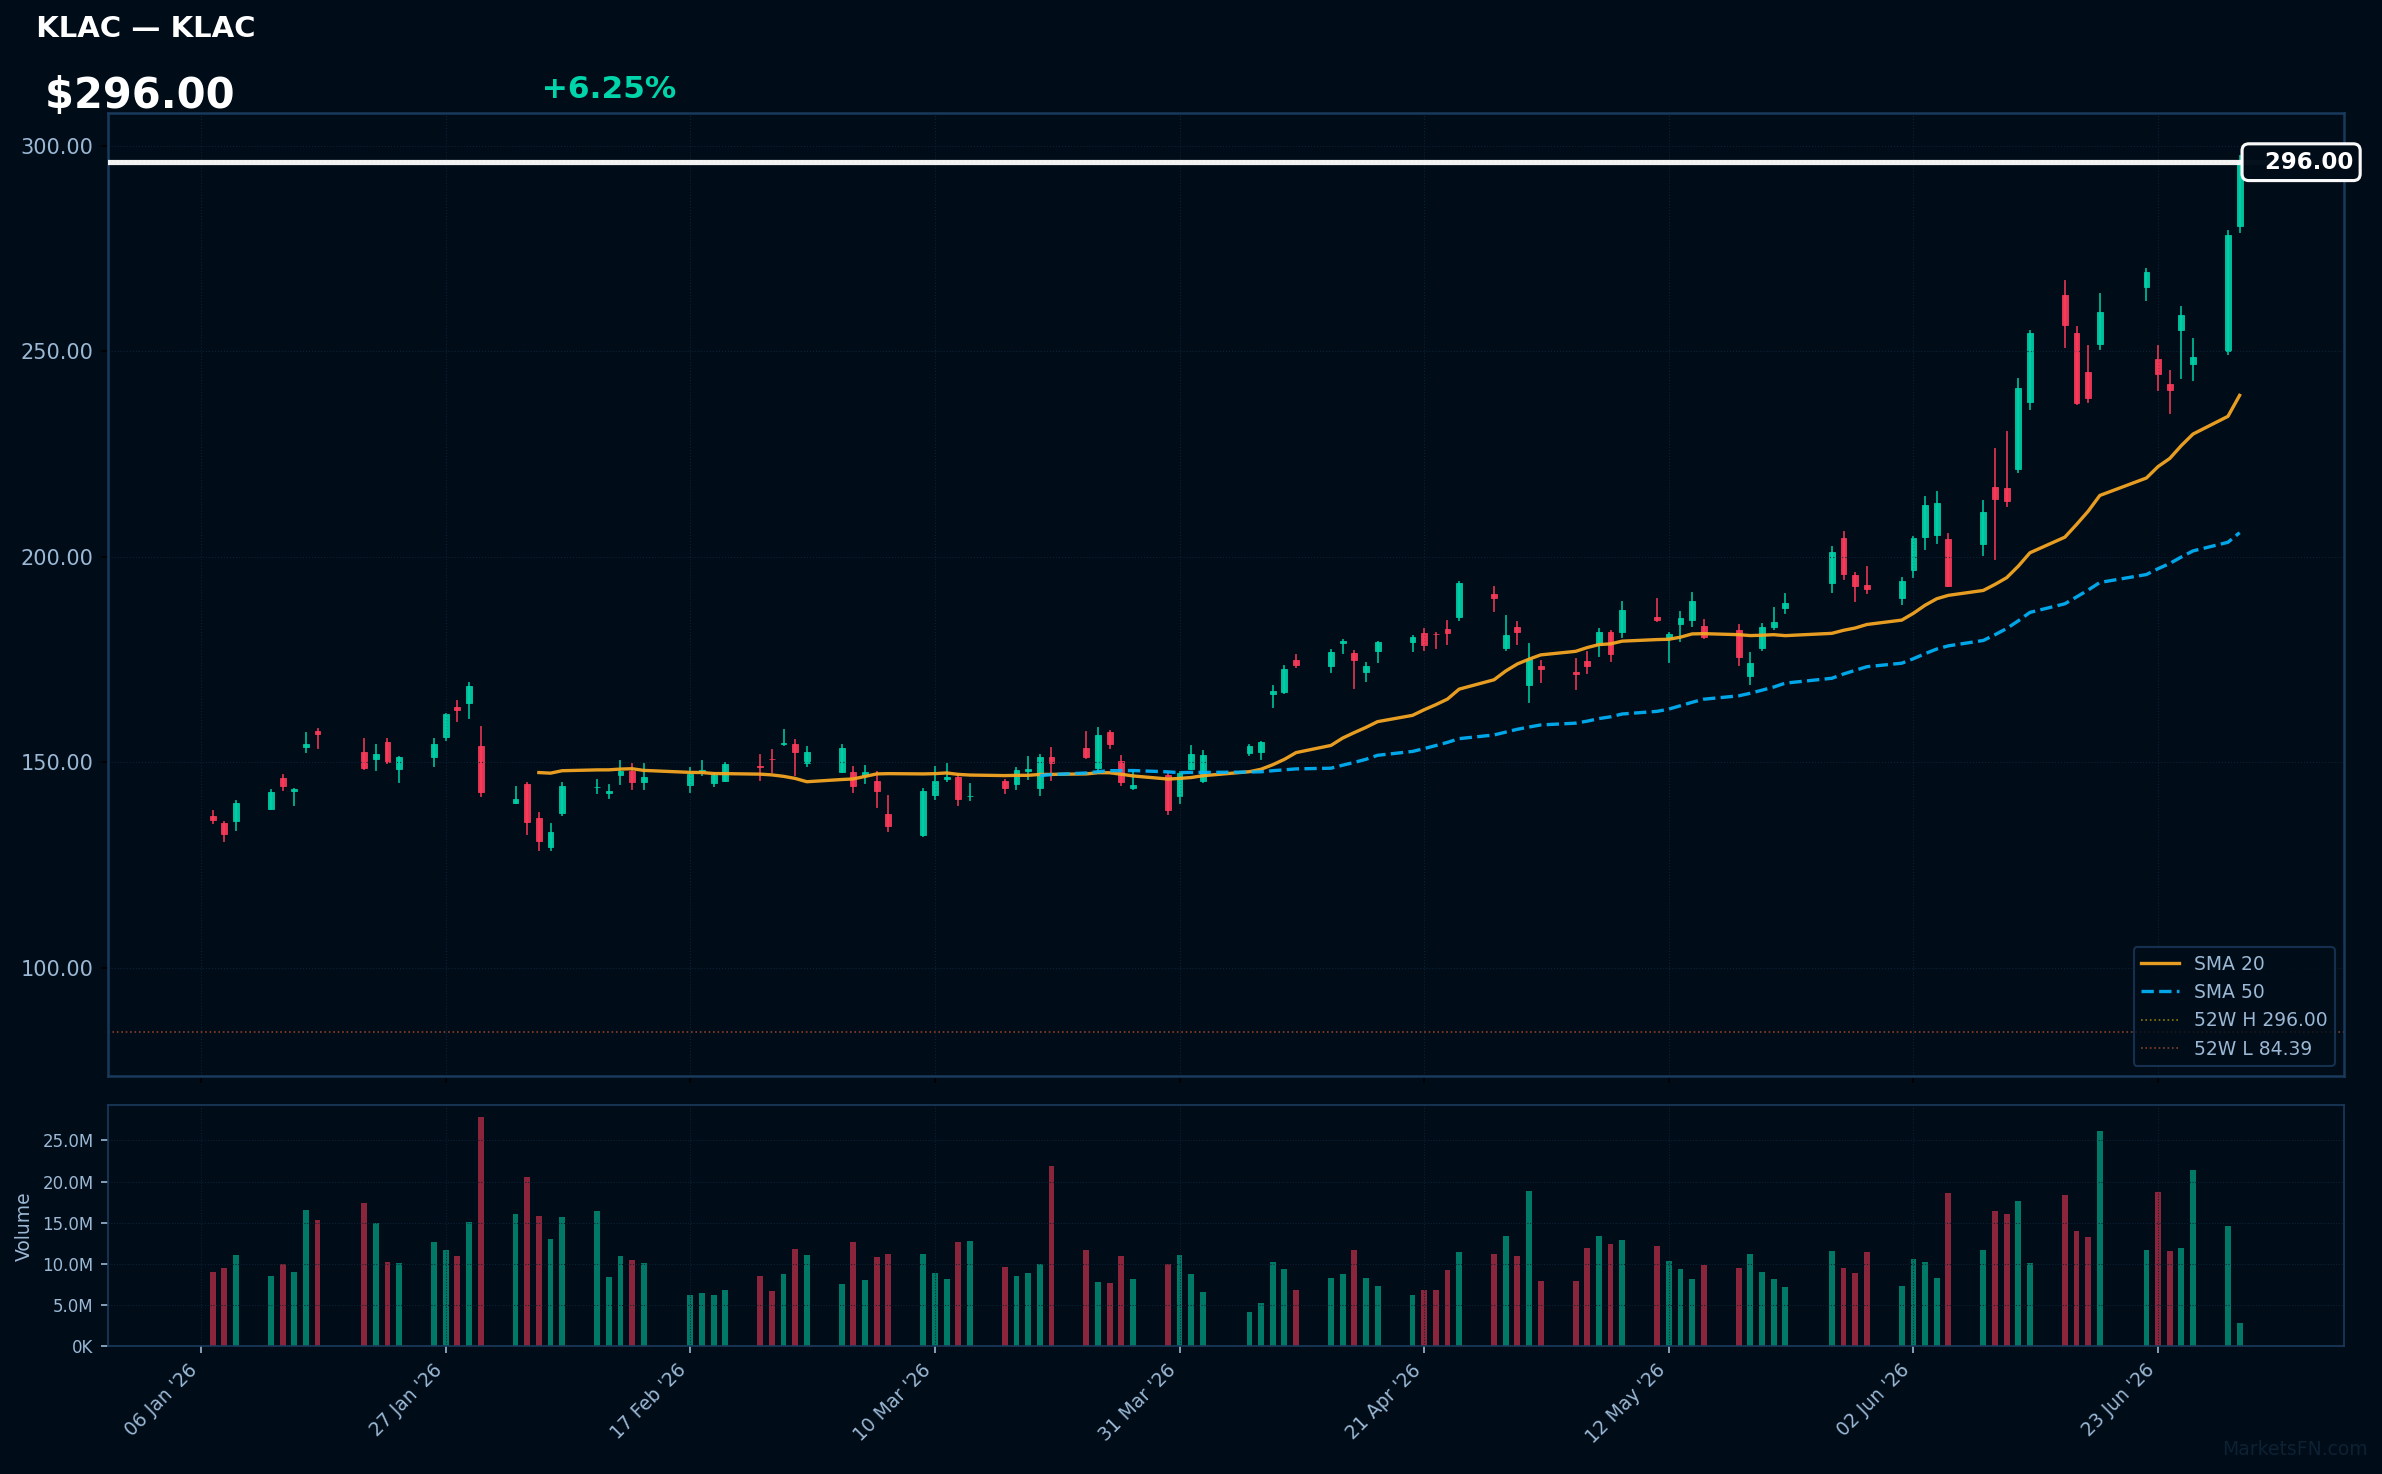
KLAC | KLA Corp | Technology | Price: $295.79 | Day: +6.25% | 1W: +21.07% | 1M: +54.03% | RSI: 69.9 | vs MA200: +96.6% | Trend: Above MA20, MA50, MA200
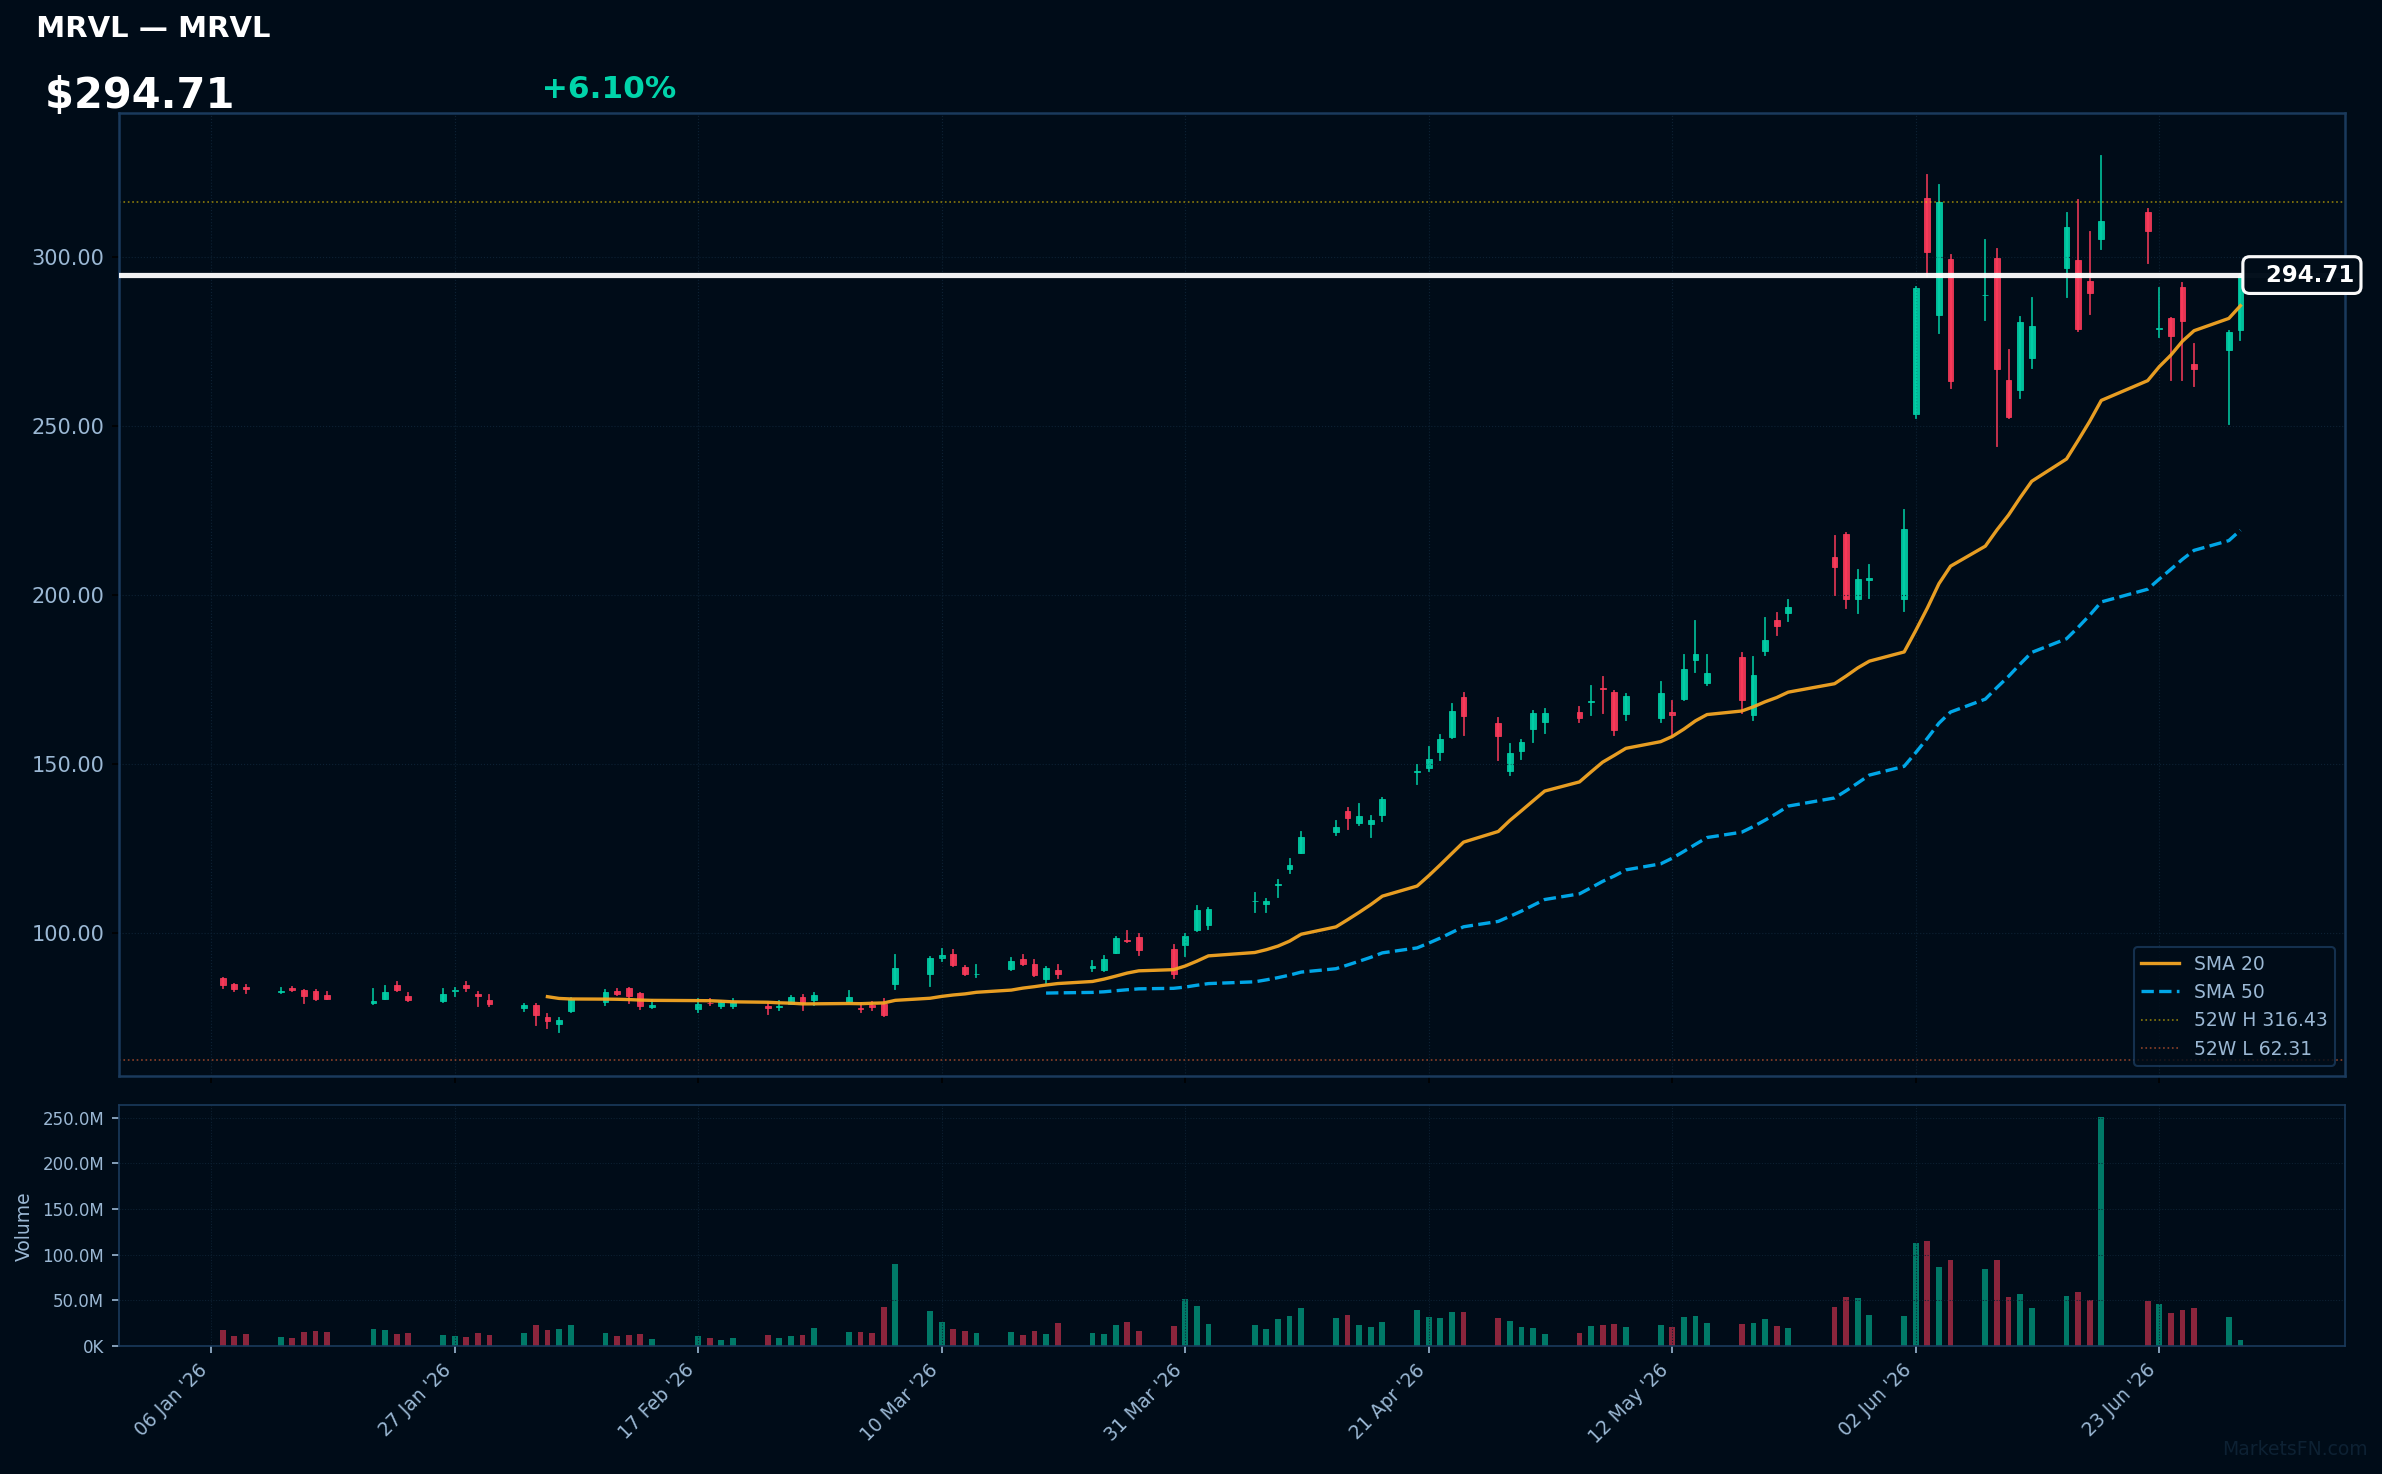
MRVL | Marvell Technology Inc | Technology | Price: $294.69 | Day: +6.10% | 1W: +5.62% | 1M: +43.76% | RSI: 58.7 | vs MA200: +144.2% | Trend: Above MA20, MA50, MA200
Recent headlines (last 12h)
- Marvell's CXL Outlook Brightens
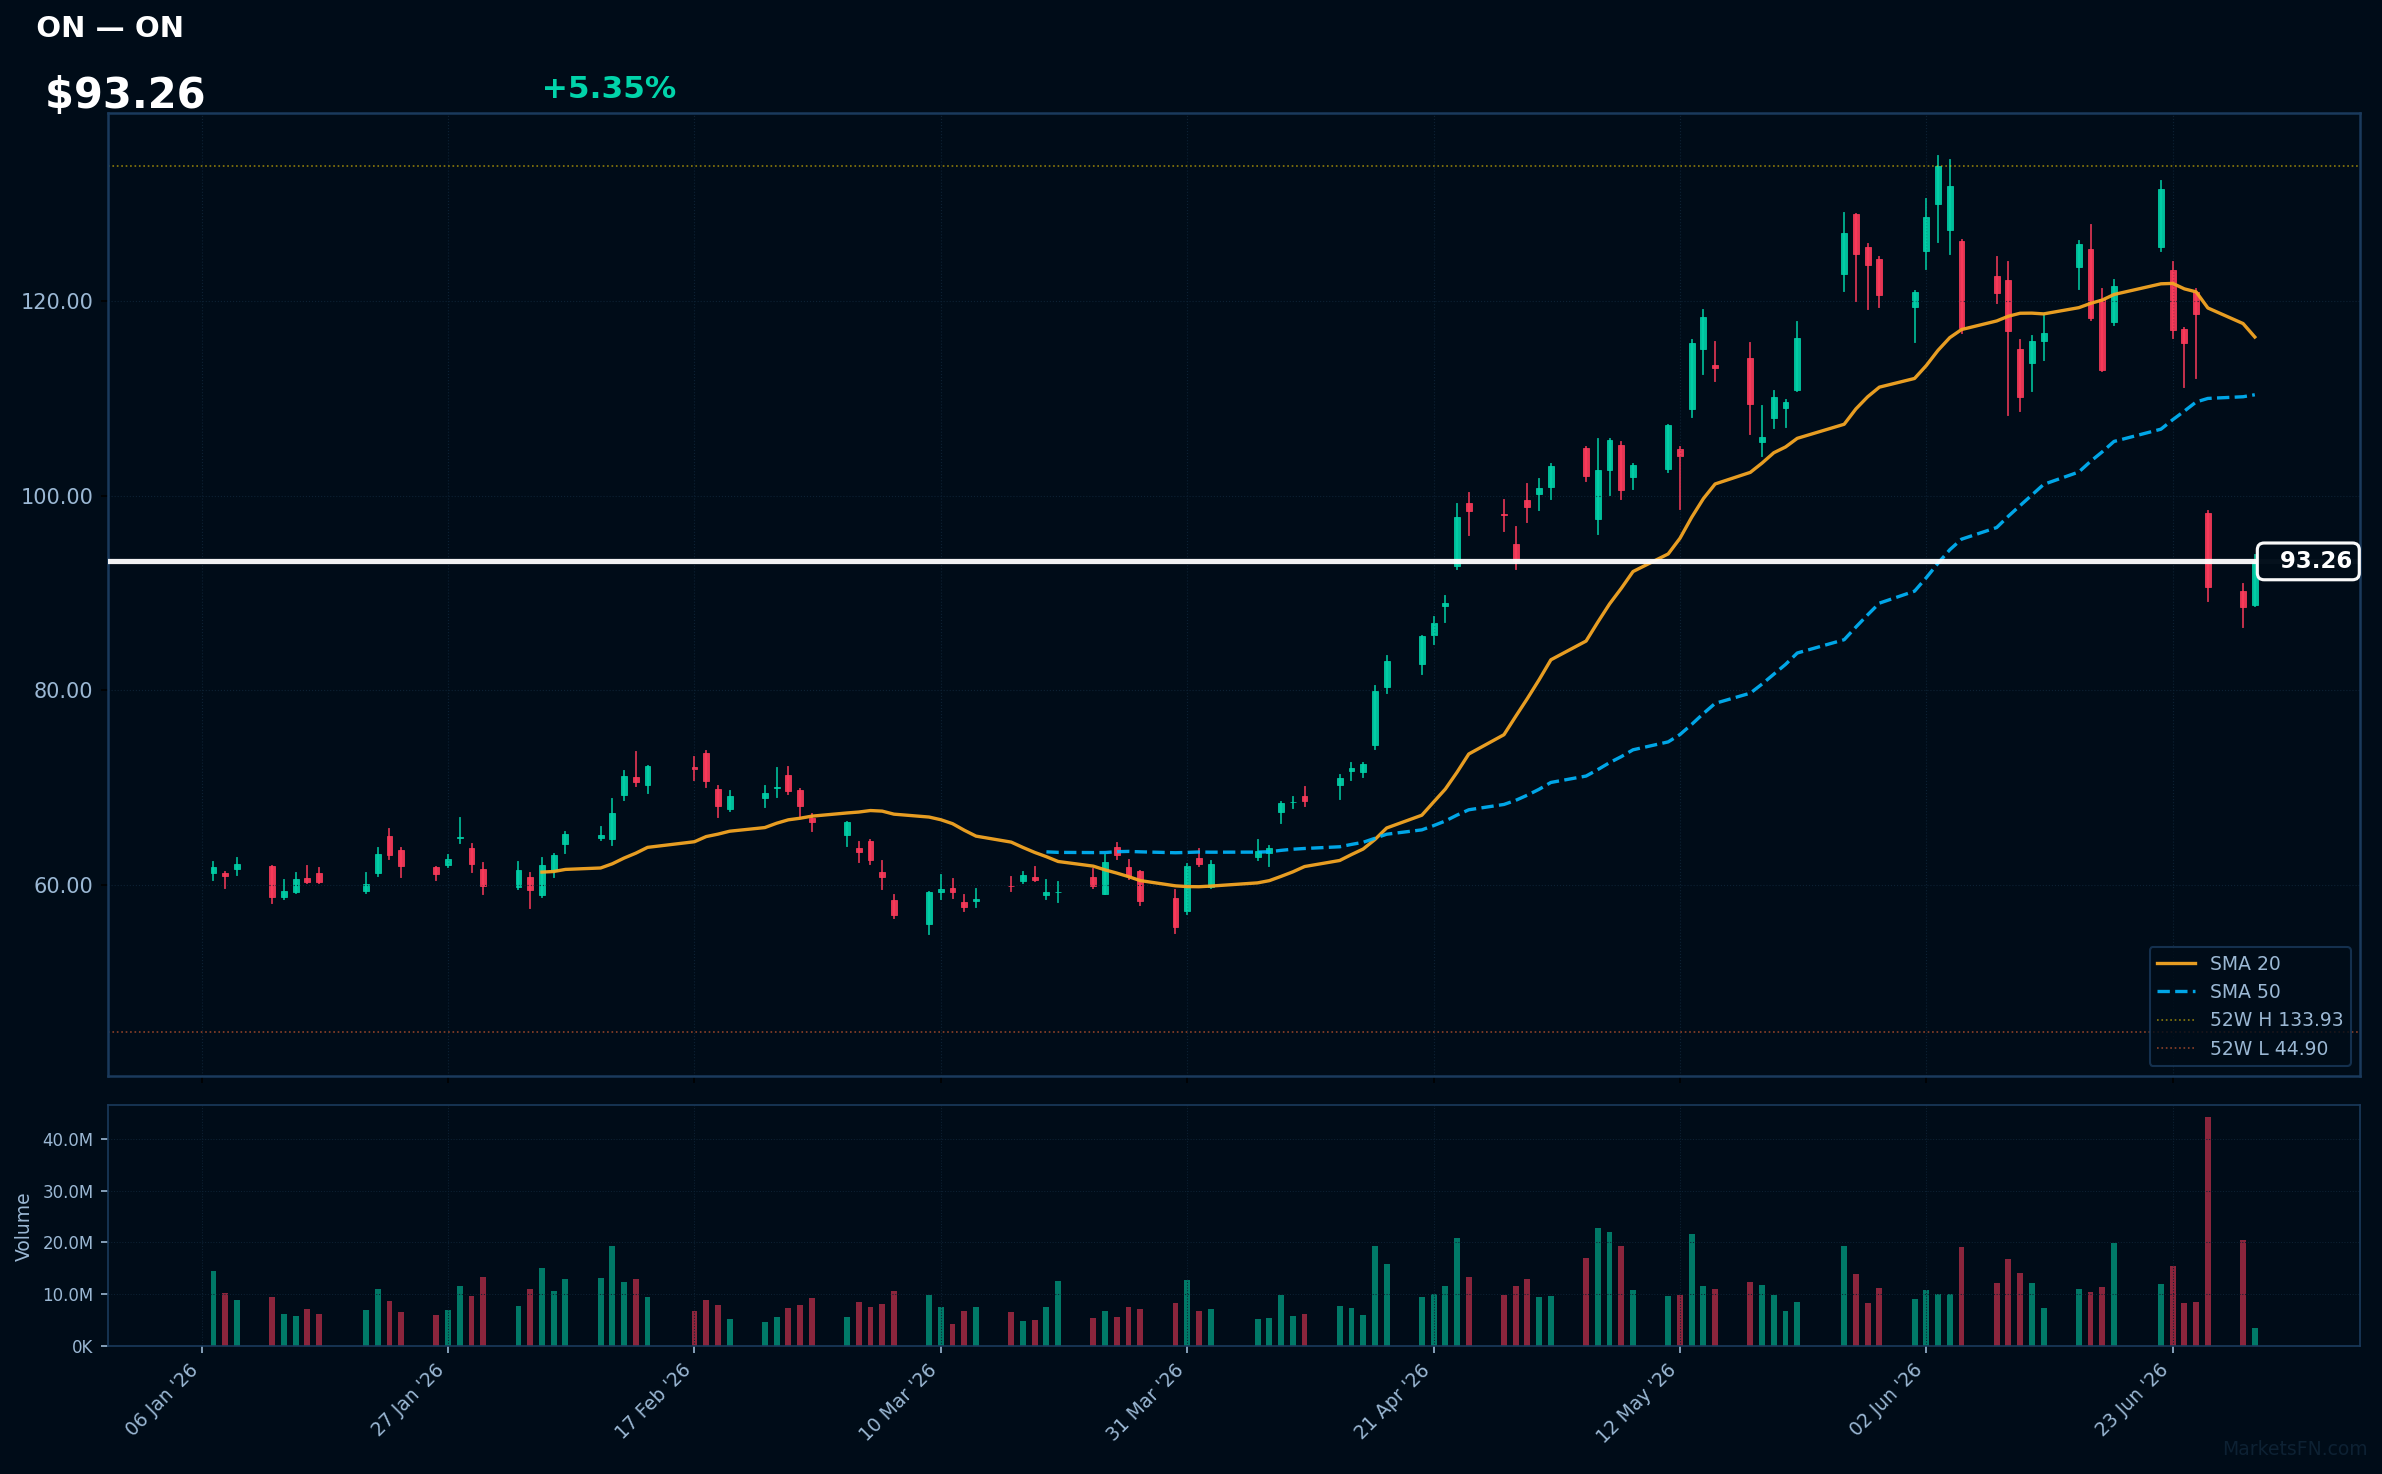
ON | ON Semiconductor Corp | Technology | Price: $93.31 | Day: +5.35% | 1W: -20.33% | 1M: -22.68% | RSI: 39.6 | vs MA200: +32.2% | Trend: Above MA200 · Below MA20, MA50
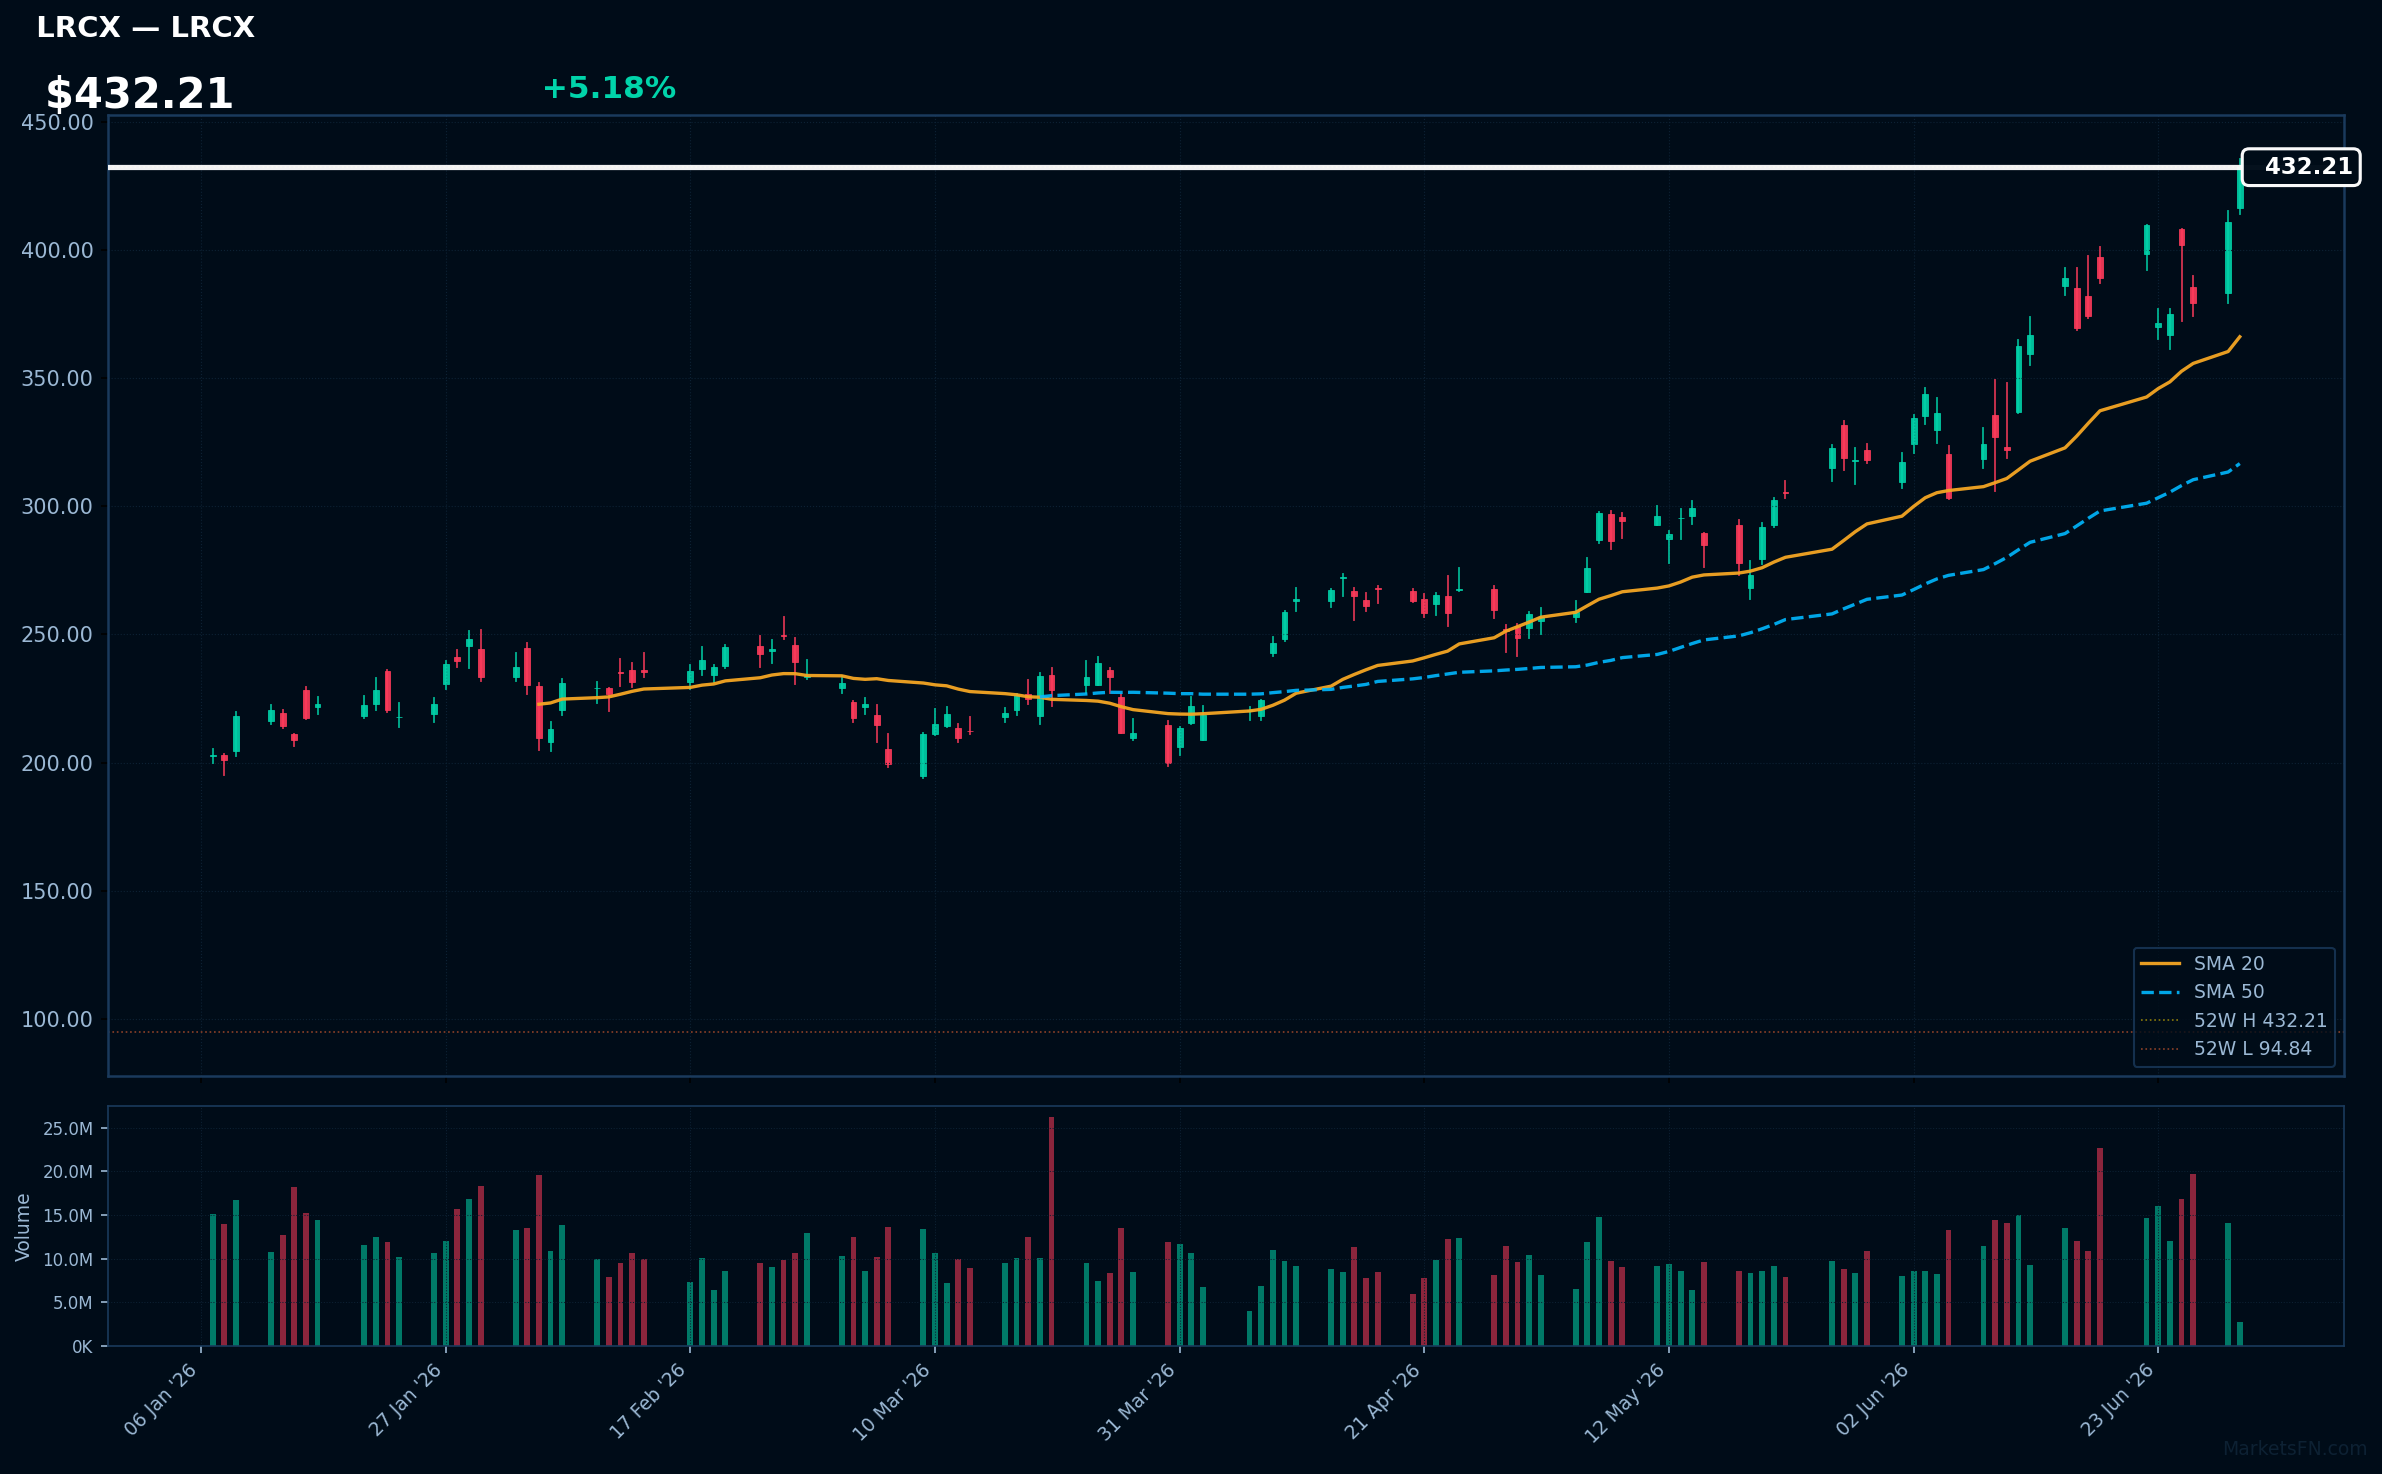
LRCX | Lam Research Corp | Technology | Price: $432.21 | Day: +5.18% | 1W: +16.40% | 1M: +35.84% | RSI: 67.0 | vs MA200: +96.2% | Trend: Above MA20, MA50, MA200
Recent headlines (last 12h)
- FTSE 100 Live: London blue-chips hit 10-week high as Sainsbury's and miners climb
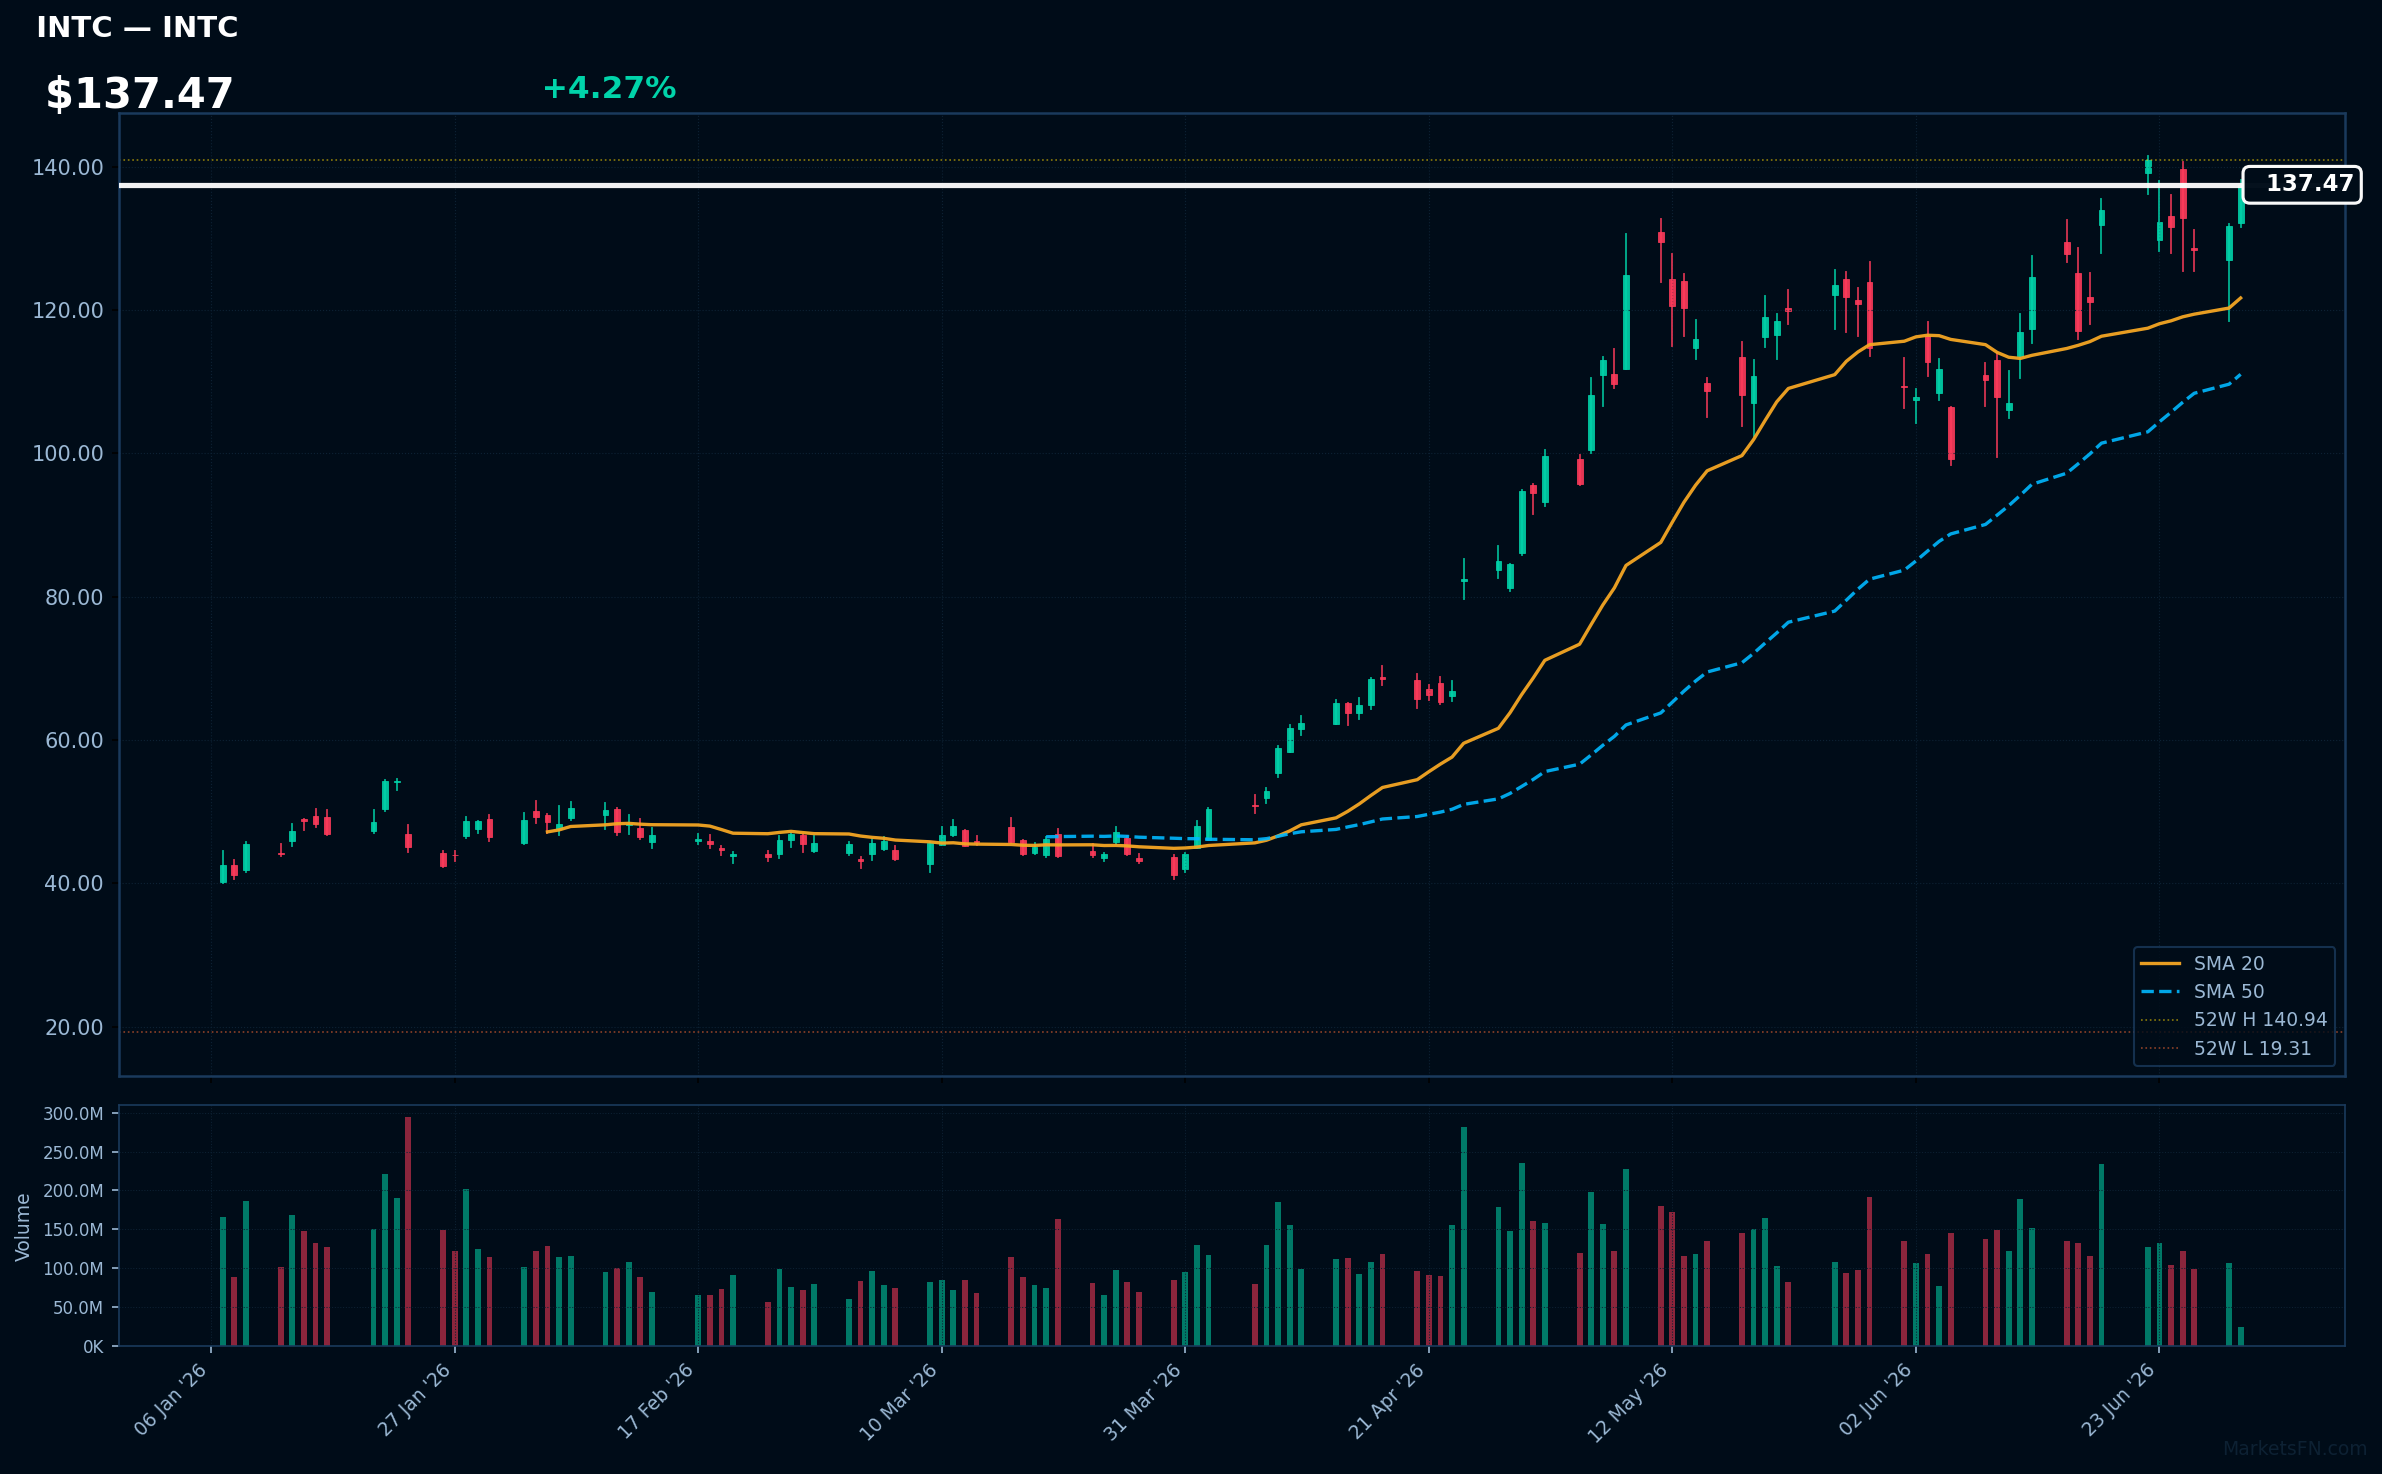
INTC | Intel Corp | Technology | Price: $137.34 | Day: +4.27% | 1W: +3.92% | 1M: +19.87% | RSI: 62.1 | vs MA200: +131.5% | Trend: Above MA20, MA50, MA200
Recent headlines (last 12h)
- Tech stocks on pace for best 6 months since 2023 even with much of the 'Magnificent 7' in the 'penalty box': Chart of the Day
- Chip Stocks Best Quarter Ever Is Ending With Some Wild Swings
- NVDA Stock Eyes Worst First Half Since 2022: Retail Patience Wears Thin As Board Member Trims Stake For Third Time This Year
- FTSE 100 Live: London blue-chips hit 10-week high as Sainsbury's and miners climb
ASML | ASML Holding NV | Technology | Price: $1962.79 | Day: +4.23% | 1W: +10.36% | 1M: +21.70% | RSI: 62.6 | vs MA200: +50.4% | Trend: Above MA20, MA50, MA200
Recent headlines (last 12h)
- Chip stocks hit record 19.7% of S&P 500, quadrupling since 2020
- Semiconductor stocks climb to record 19.7% of the S&P 500 as AI rally reshapes the index
- Europe's STOXX 600 heads for biggest quarterly gain in over five years on AI boost
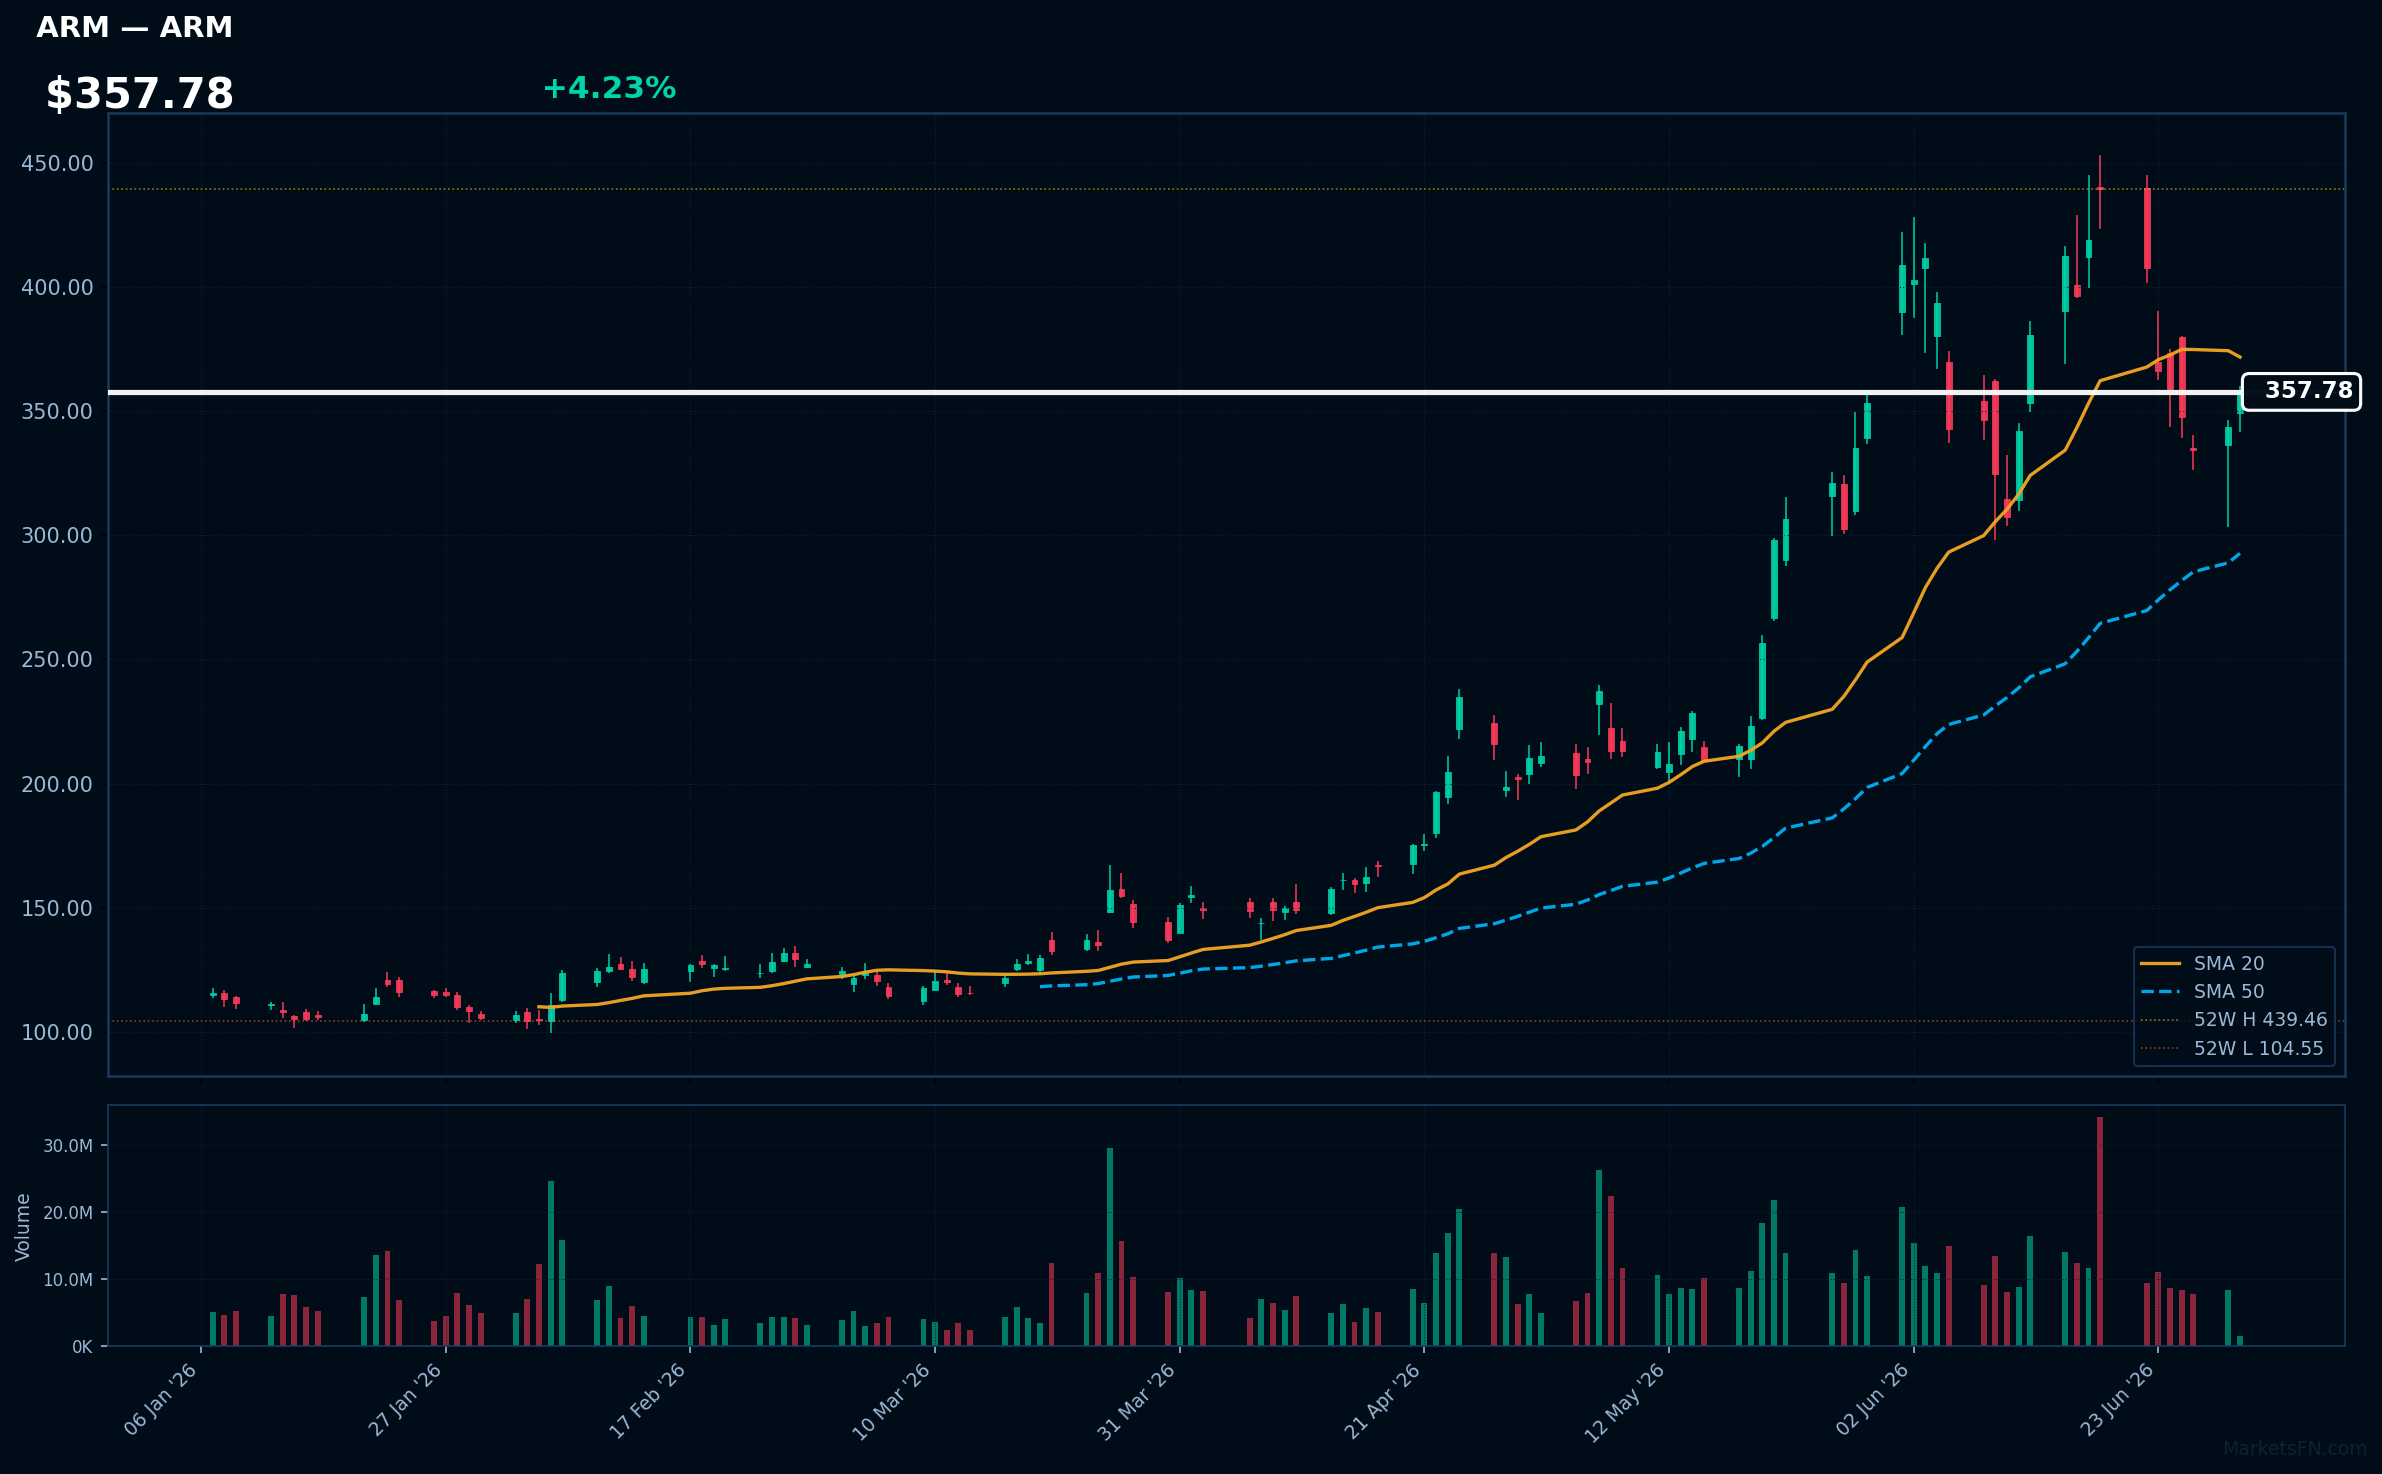
ARM | Arm Holdings plc. ADR | Technology | Price: $358.11 | Day: +4.23% | 1W: -2.35% | 1M: +1.27% | RSI: 52.7 | vs MA200: +104.1% | Trend: Above MA50, MA200 · Below MA20
Recent headlines (last 12h)
- Chip Stocks Best Quarter Ever Is Ending With Some Wild Swings
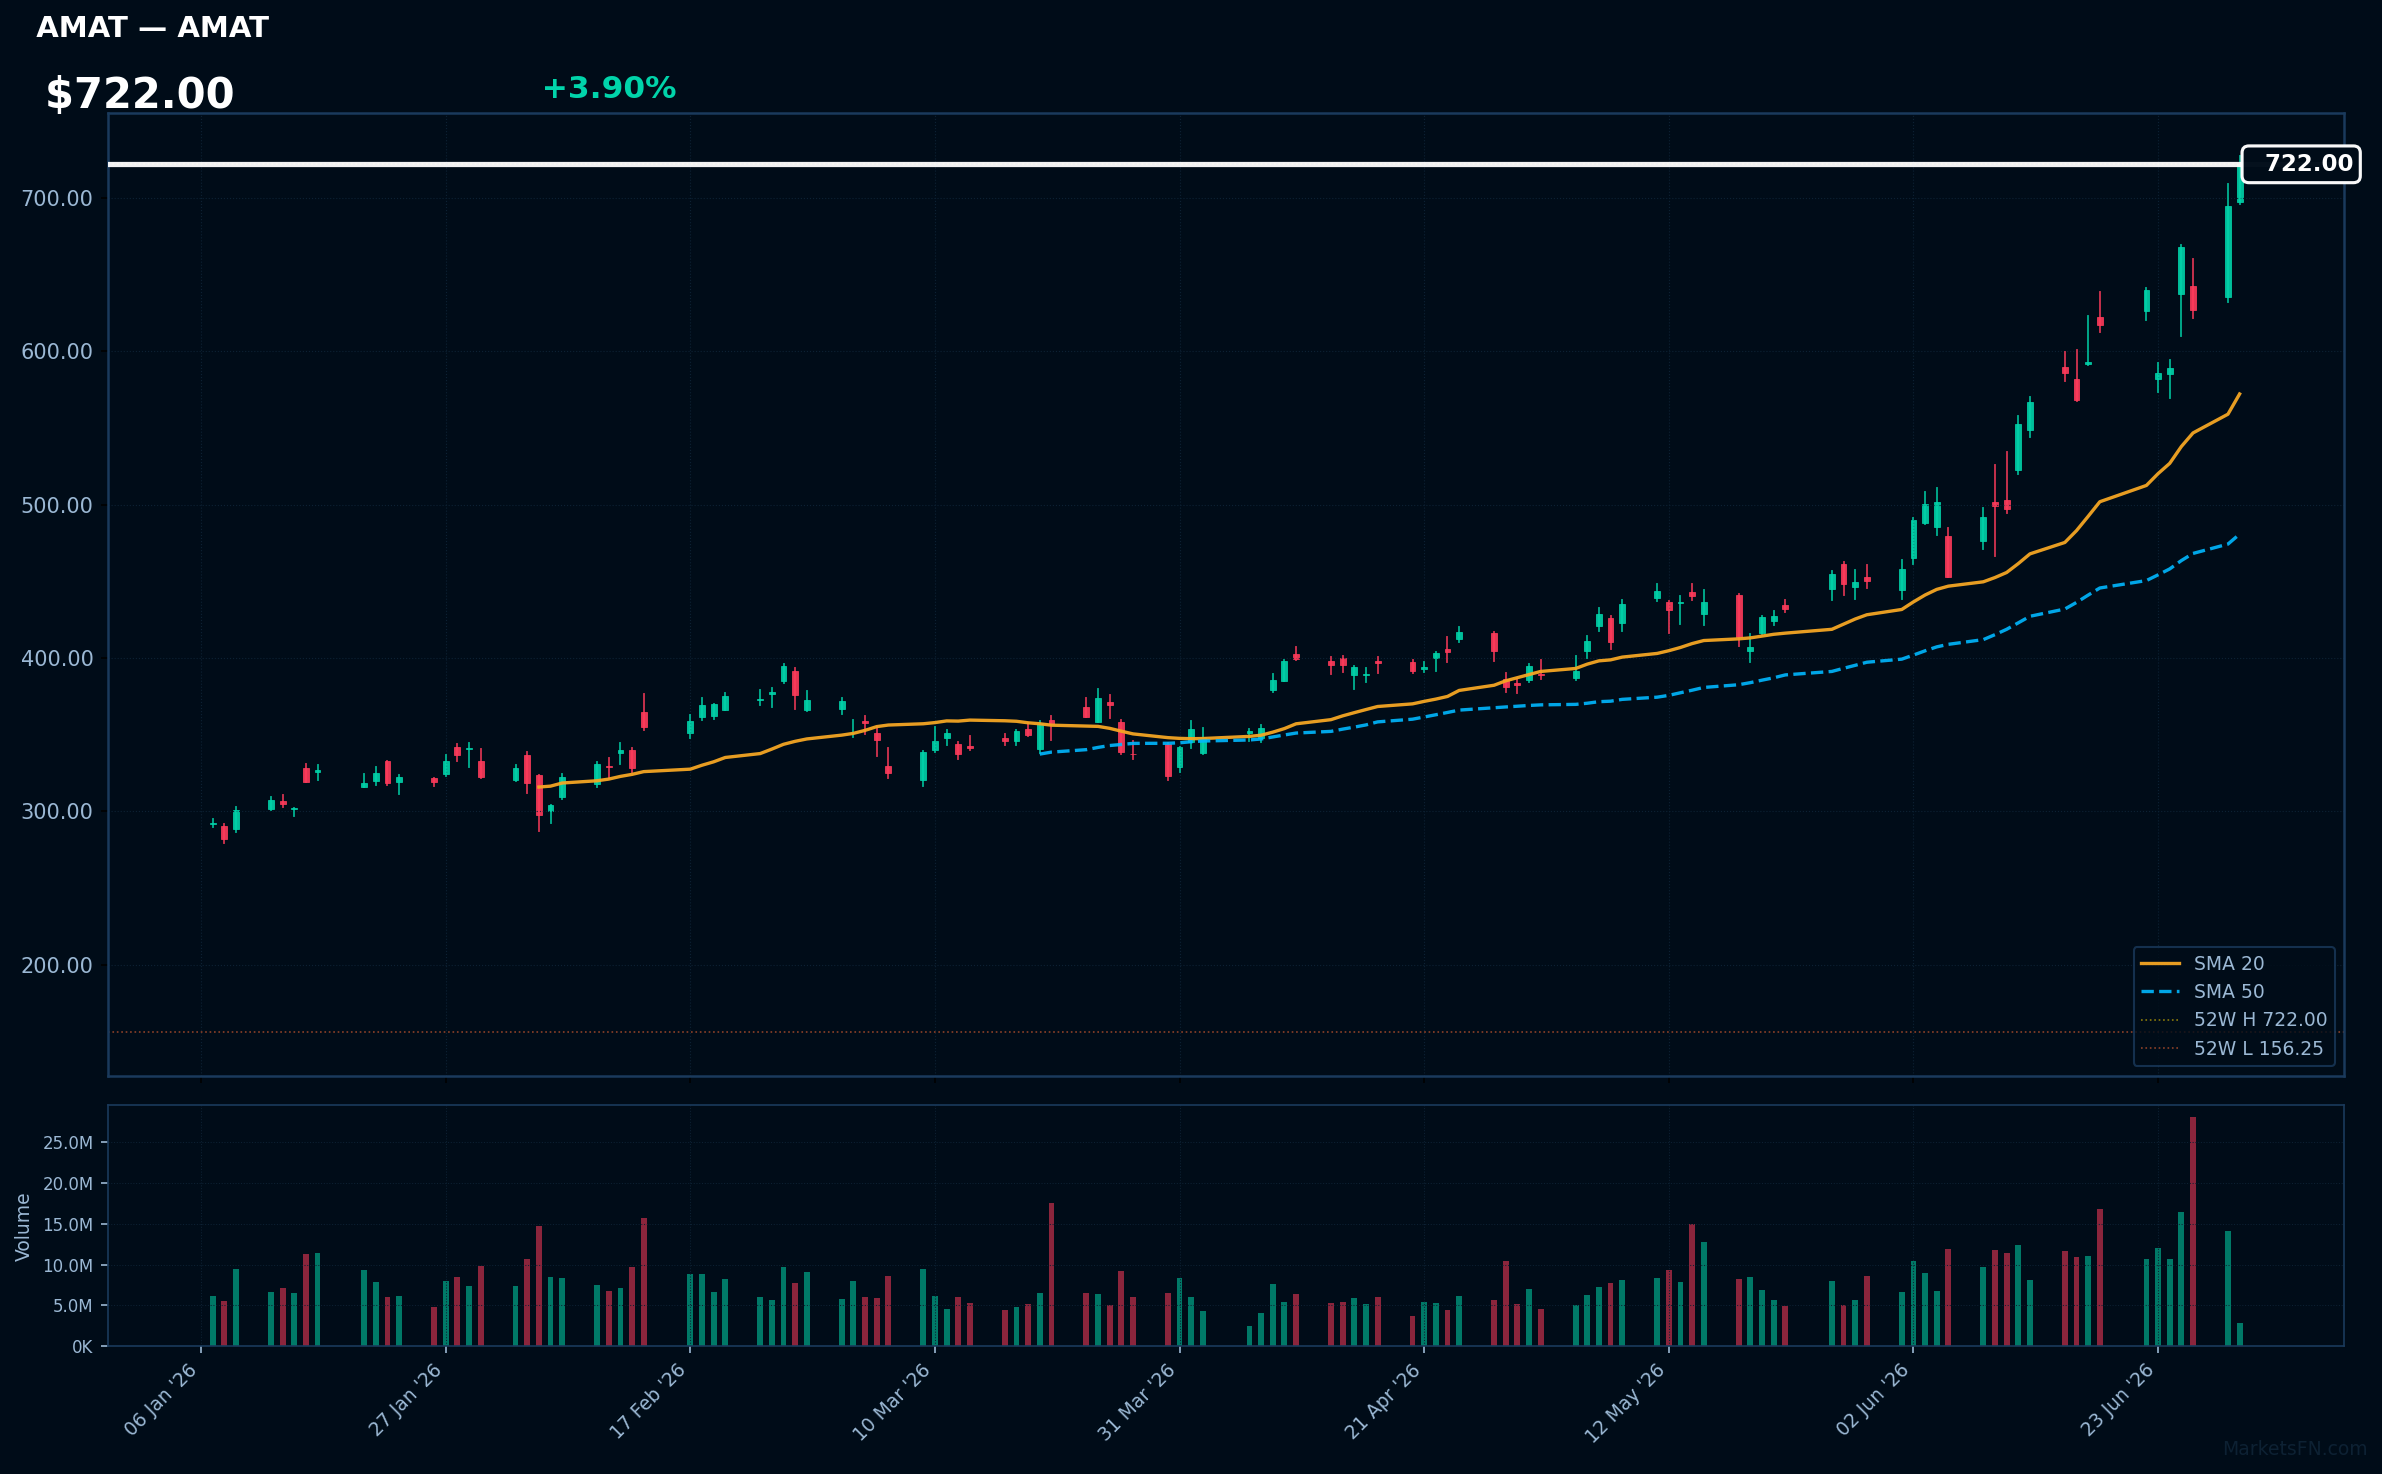
AMAT | Applied Materials Inc | Technology | Price: $721.75 | Day: +3.90% | 1W: +23.23% | 1M: +60.42% | RSI: 72.3 | vs MA200: +115.6% | Trend: Above MA20, MA50, MA200
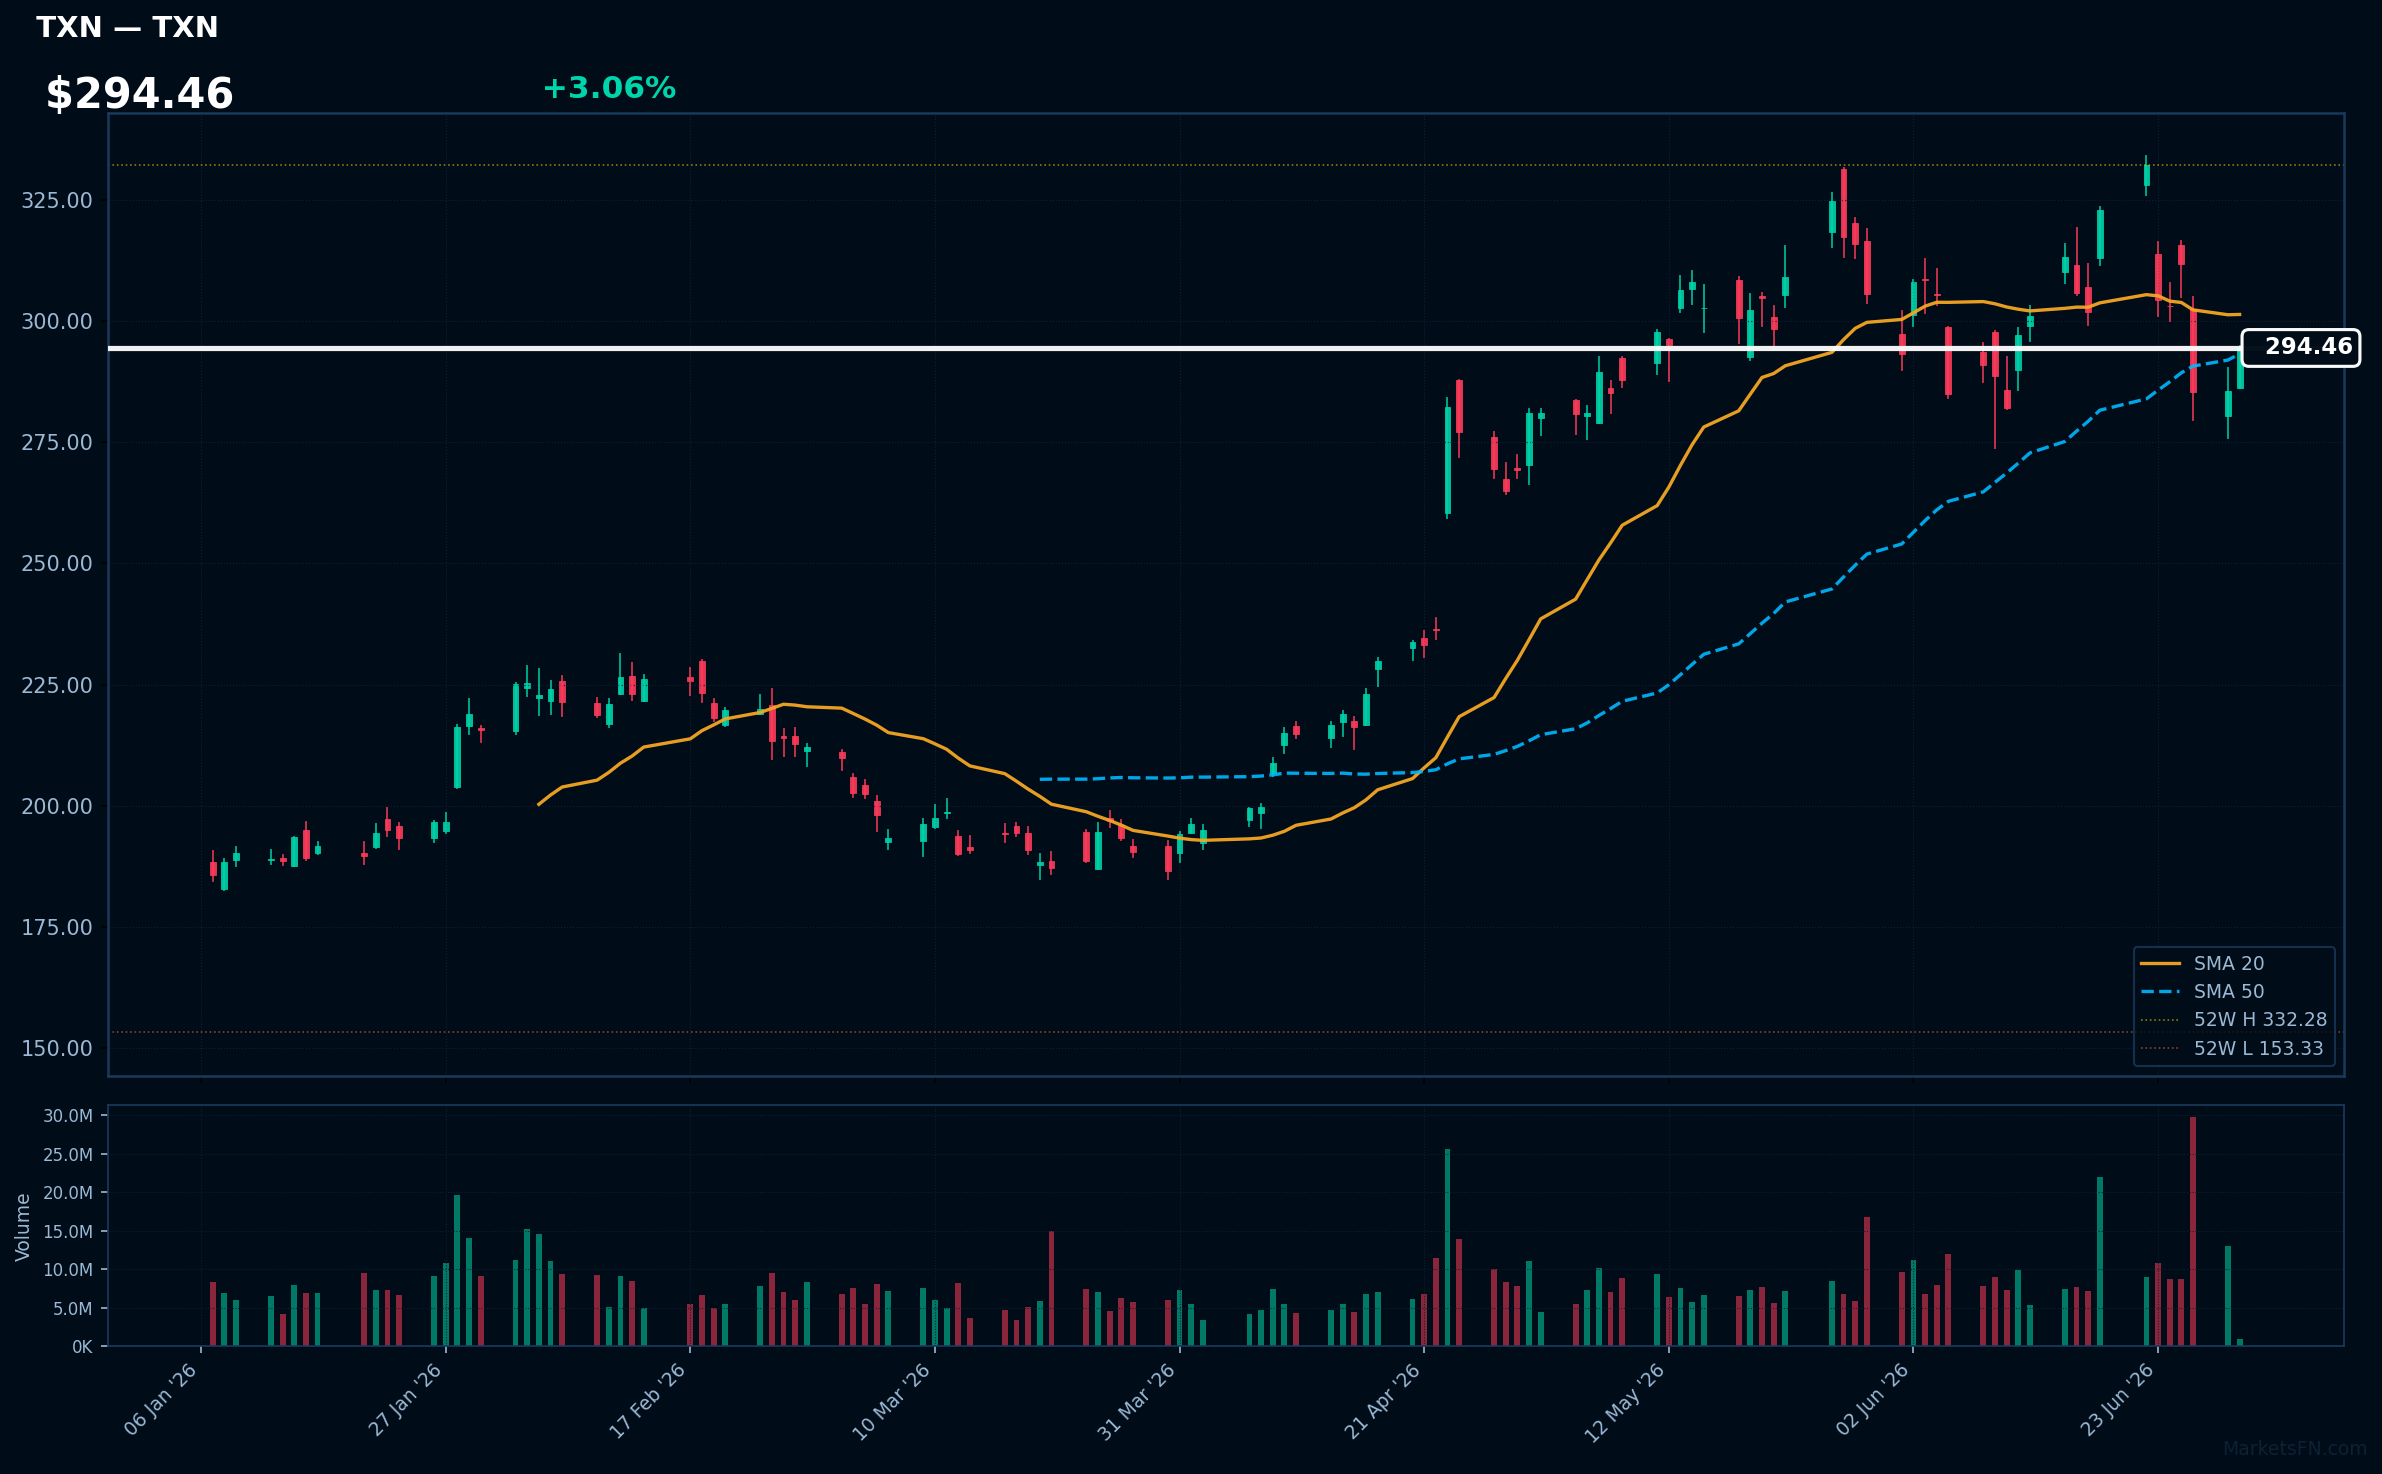
TXN | Texas Instruments Inc | Technology | Price: $294.21 | Day: +3.06% | 1W: -3.25% | 1M: -3.67% | RSI: 48.4 | vs MA200: +37.3% | Trend: Above MA50, MA200 · Below MA20
Top 10 Losers
Today's weakest Nasdaq 100 performers. Sector drag: Communication Services (3), Healthcare (2), Industrials (2), Financial (1), Consumer Defensive (1), Technology (1).
| Ticker | Company | Sector | Price | Day % | 1W % | 1M % | RSI | vs MA200 | Trend |
|---|---|---|---|---|---|---|---|---|---|
| PYPL | PayPal Holdings Inc | Financial | $43.47 | -2.05% | +4.24% | -2.86% | 50.7 | -19.5% | Above MA20 · Below MA50, MA200 |
| MDLZ | Mondelez International Inc | Consumer Defensive | $58.91 | -2.06% | -3.52% | -3.69% | 39.1 | +0.1% | Above MA200 · Below MA20, MA50 |
| GEHC | GE HealthCare Technologies Inc | Healthcare | $63.42 | -2.51% | -0.52% | +1.68% | 47.8 | -14.6% | Below MA20, MA50, MA200 |
| IDXX | Idexx Laboratories, Inc | Healthcare | $521.71 | -2.65% | -3.62% | -7.42% | 37.4 | -17.1% | Below MA20, MA50, MA200 |
| HON | Honeywell International Inc | Industrials | $225.83 | -2.75% | -1.00% | -3.08% | 51.1 | +5.4% | Above MA20, MA50, MA200 |
| ODFL | Old Dominion Freight Line, Inc | Industrials | $213.29 | -2.92% | -2.04% | -5.33% | 41.2 | +19.2% | Above MA200 · Below MA20, MA50 |
| CHTR | Charter Communications Inc | Communication Services | $141.64 | -3.10% | +7.51% | -1.67% | 50.4 | -31.6% | Above MA20 · Below MA50, MA200 |
| TMUS | T-Mobile US Inc | Communication Services | $167.66 | -3.63% | -9.16% | -10.60% | 30.3 | -18.1% | Below MA20, MA50, MA200 |
| TTD | Trade Desk Inc | Communication Services | $17.75 | -4.83% | -1.01% | -17.68% | 38.4 | -45.5% | Below MA20, MA50, MA200 |
| MSTR | Strategy Inc | Technology | $86.40 | -6.77% | -16.73% | -45.65% | 30.1 | -52.9% | Below MA20, MA50, MA200 |
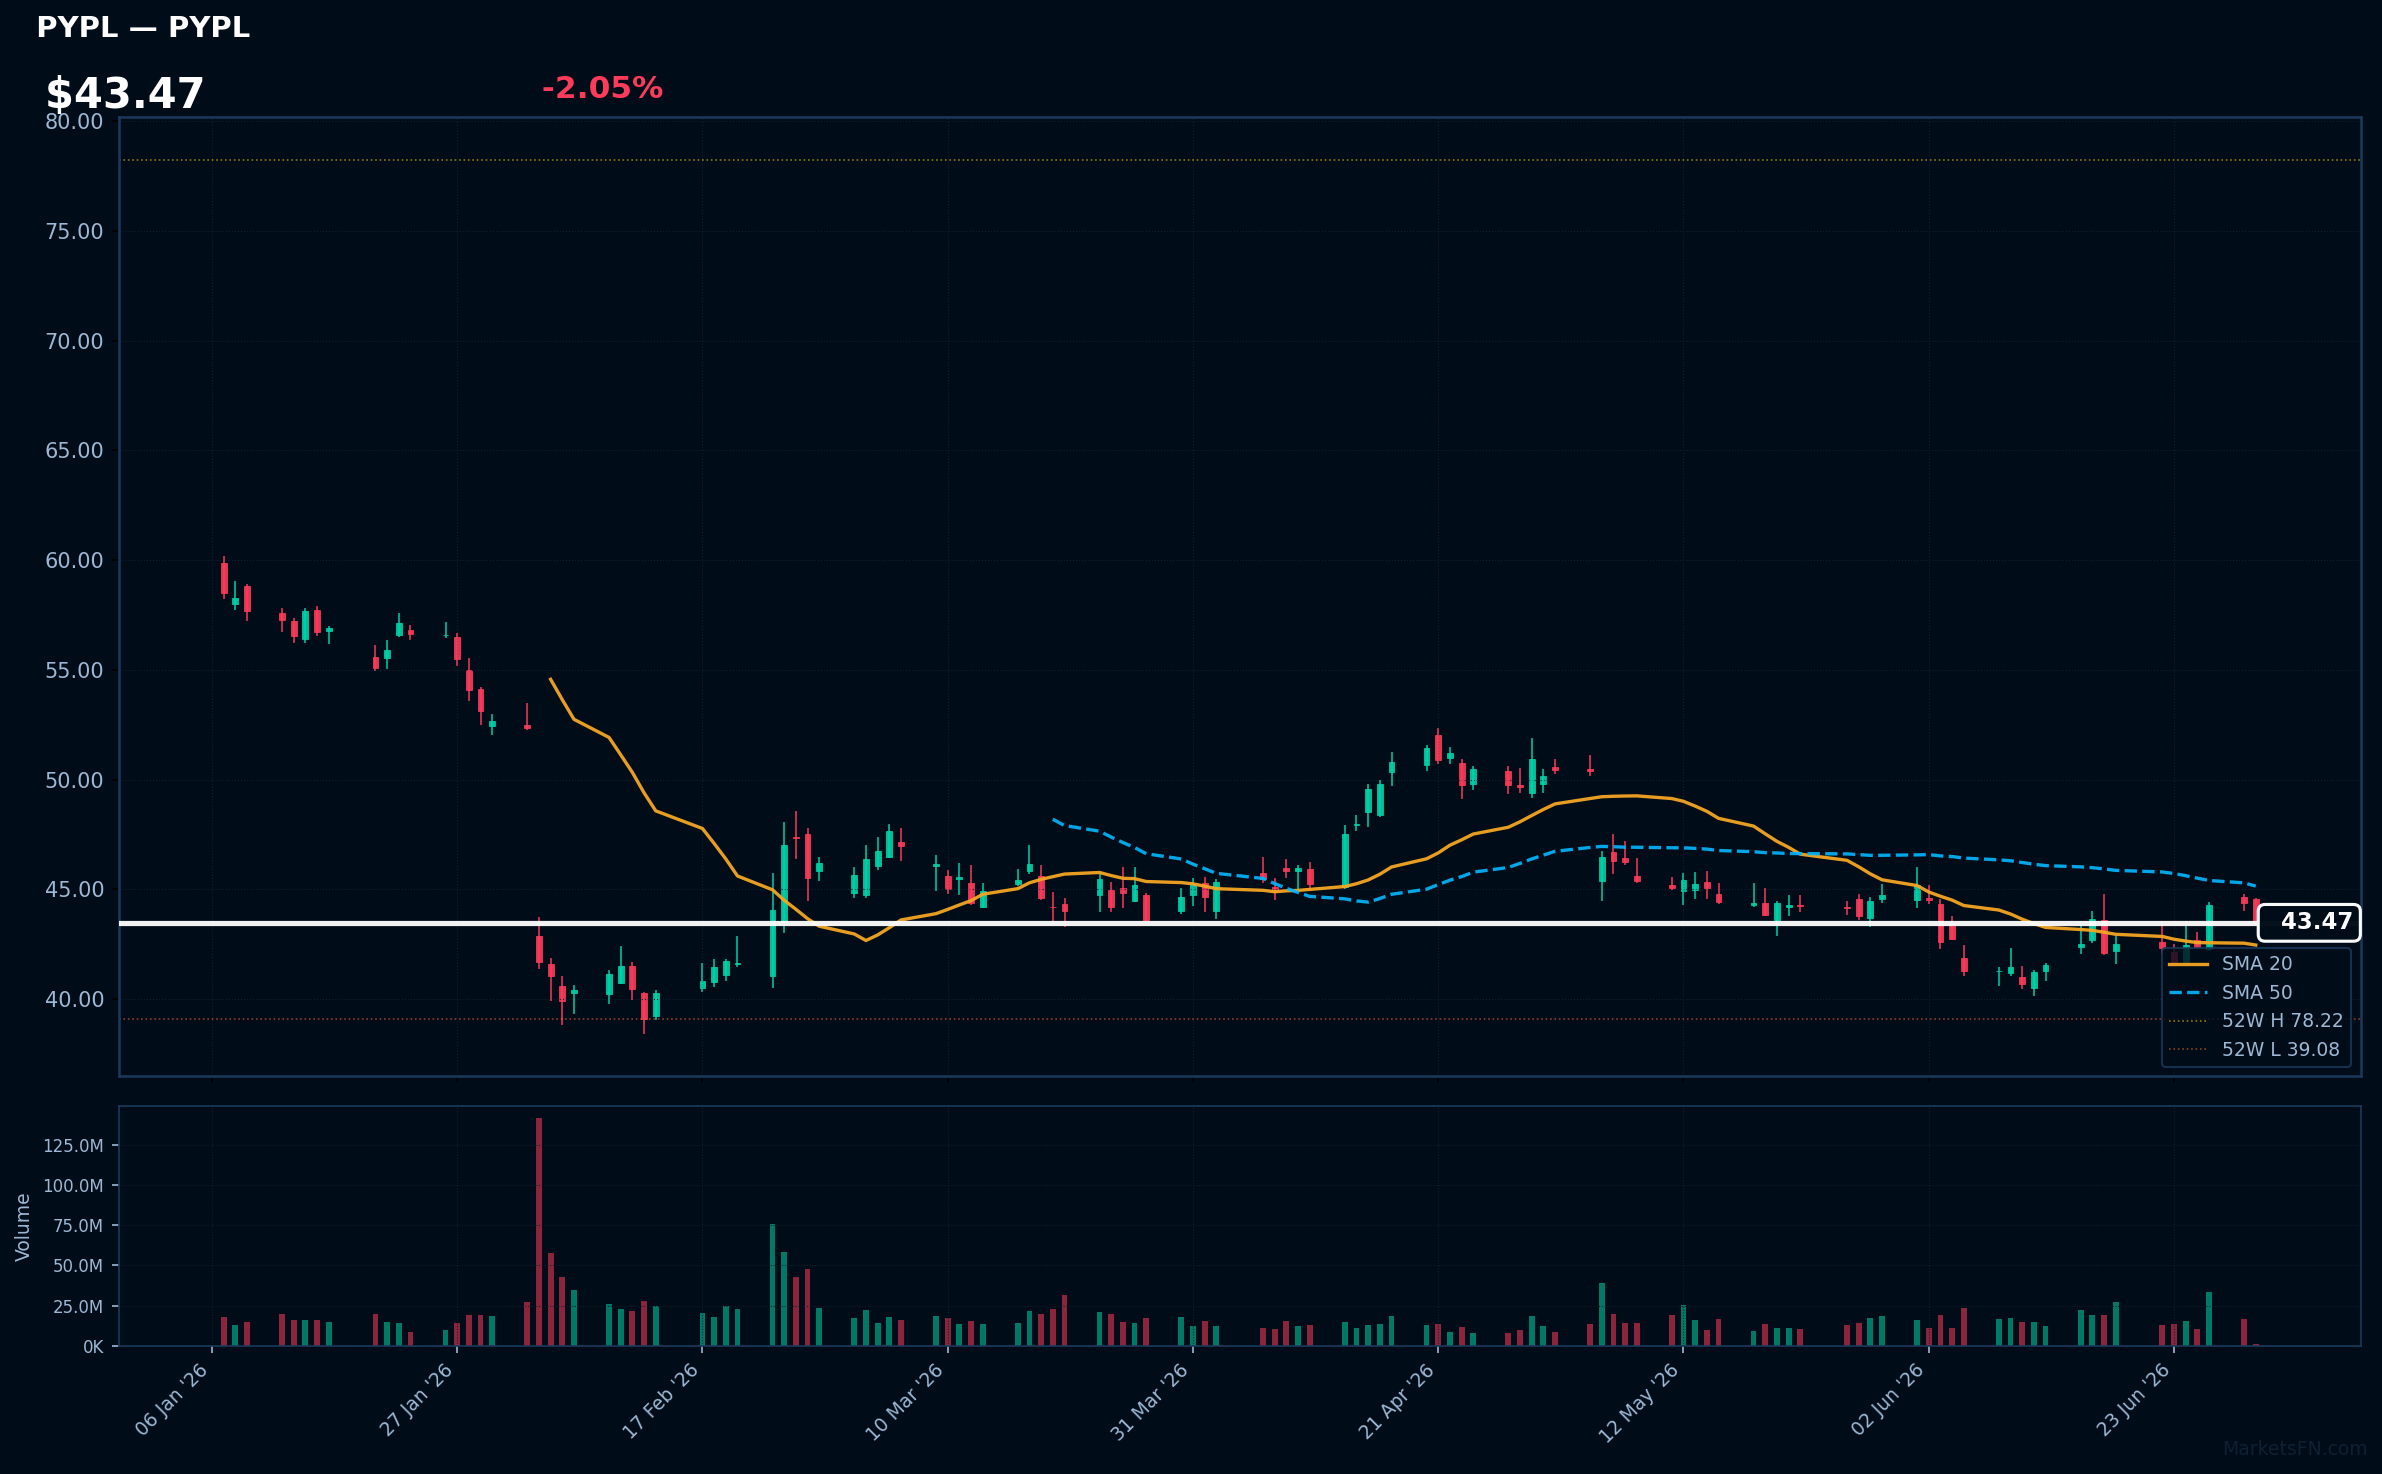
PYPL | PayPal Holdings Inc | Financial | Price: $43.47 | Day: -2.05% | 1W: +4.24% | 1M: -2.86% | RSI: 50.7 | vs MA200: -19.5% | Trend: Above MA20 · Below MA50, MA200
Recent headlines (last 12h)
- PYPL Stock Is Trading Near The Cheapest Valuation In Years So Why Is Wall Street Still On The Fence?
- Piper Sandler picks Payments and Consumer Finance winners as multiples reset
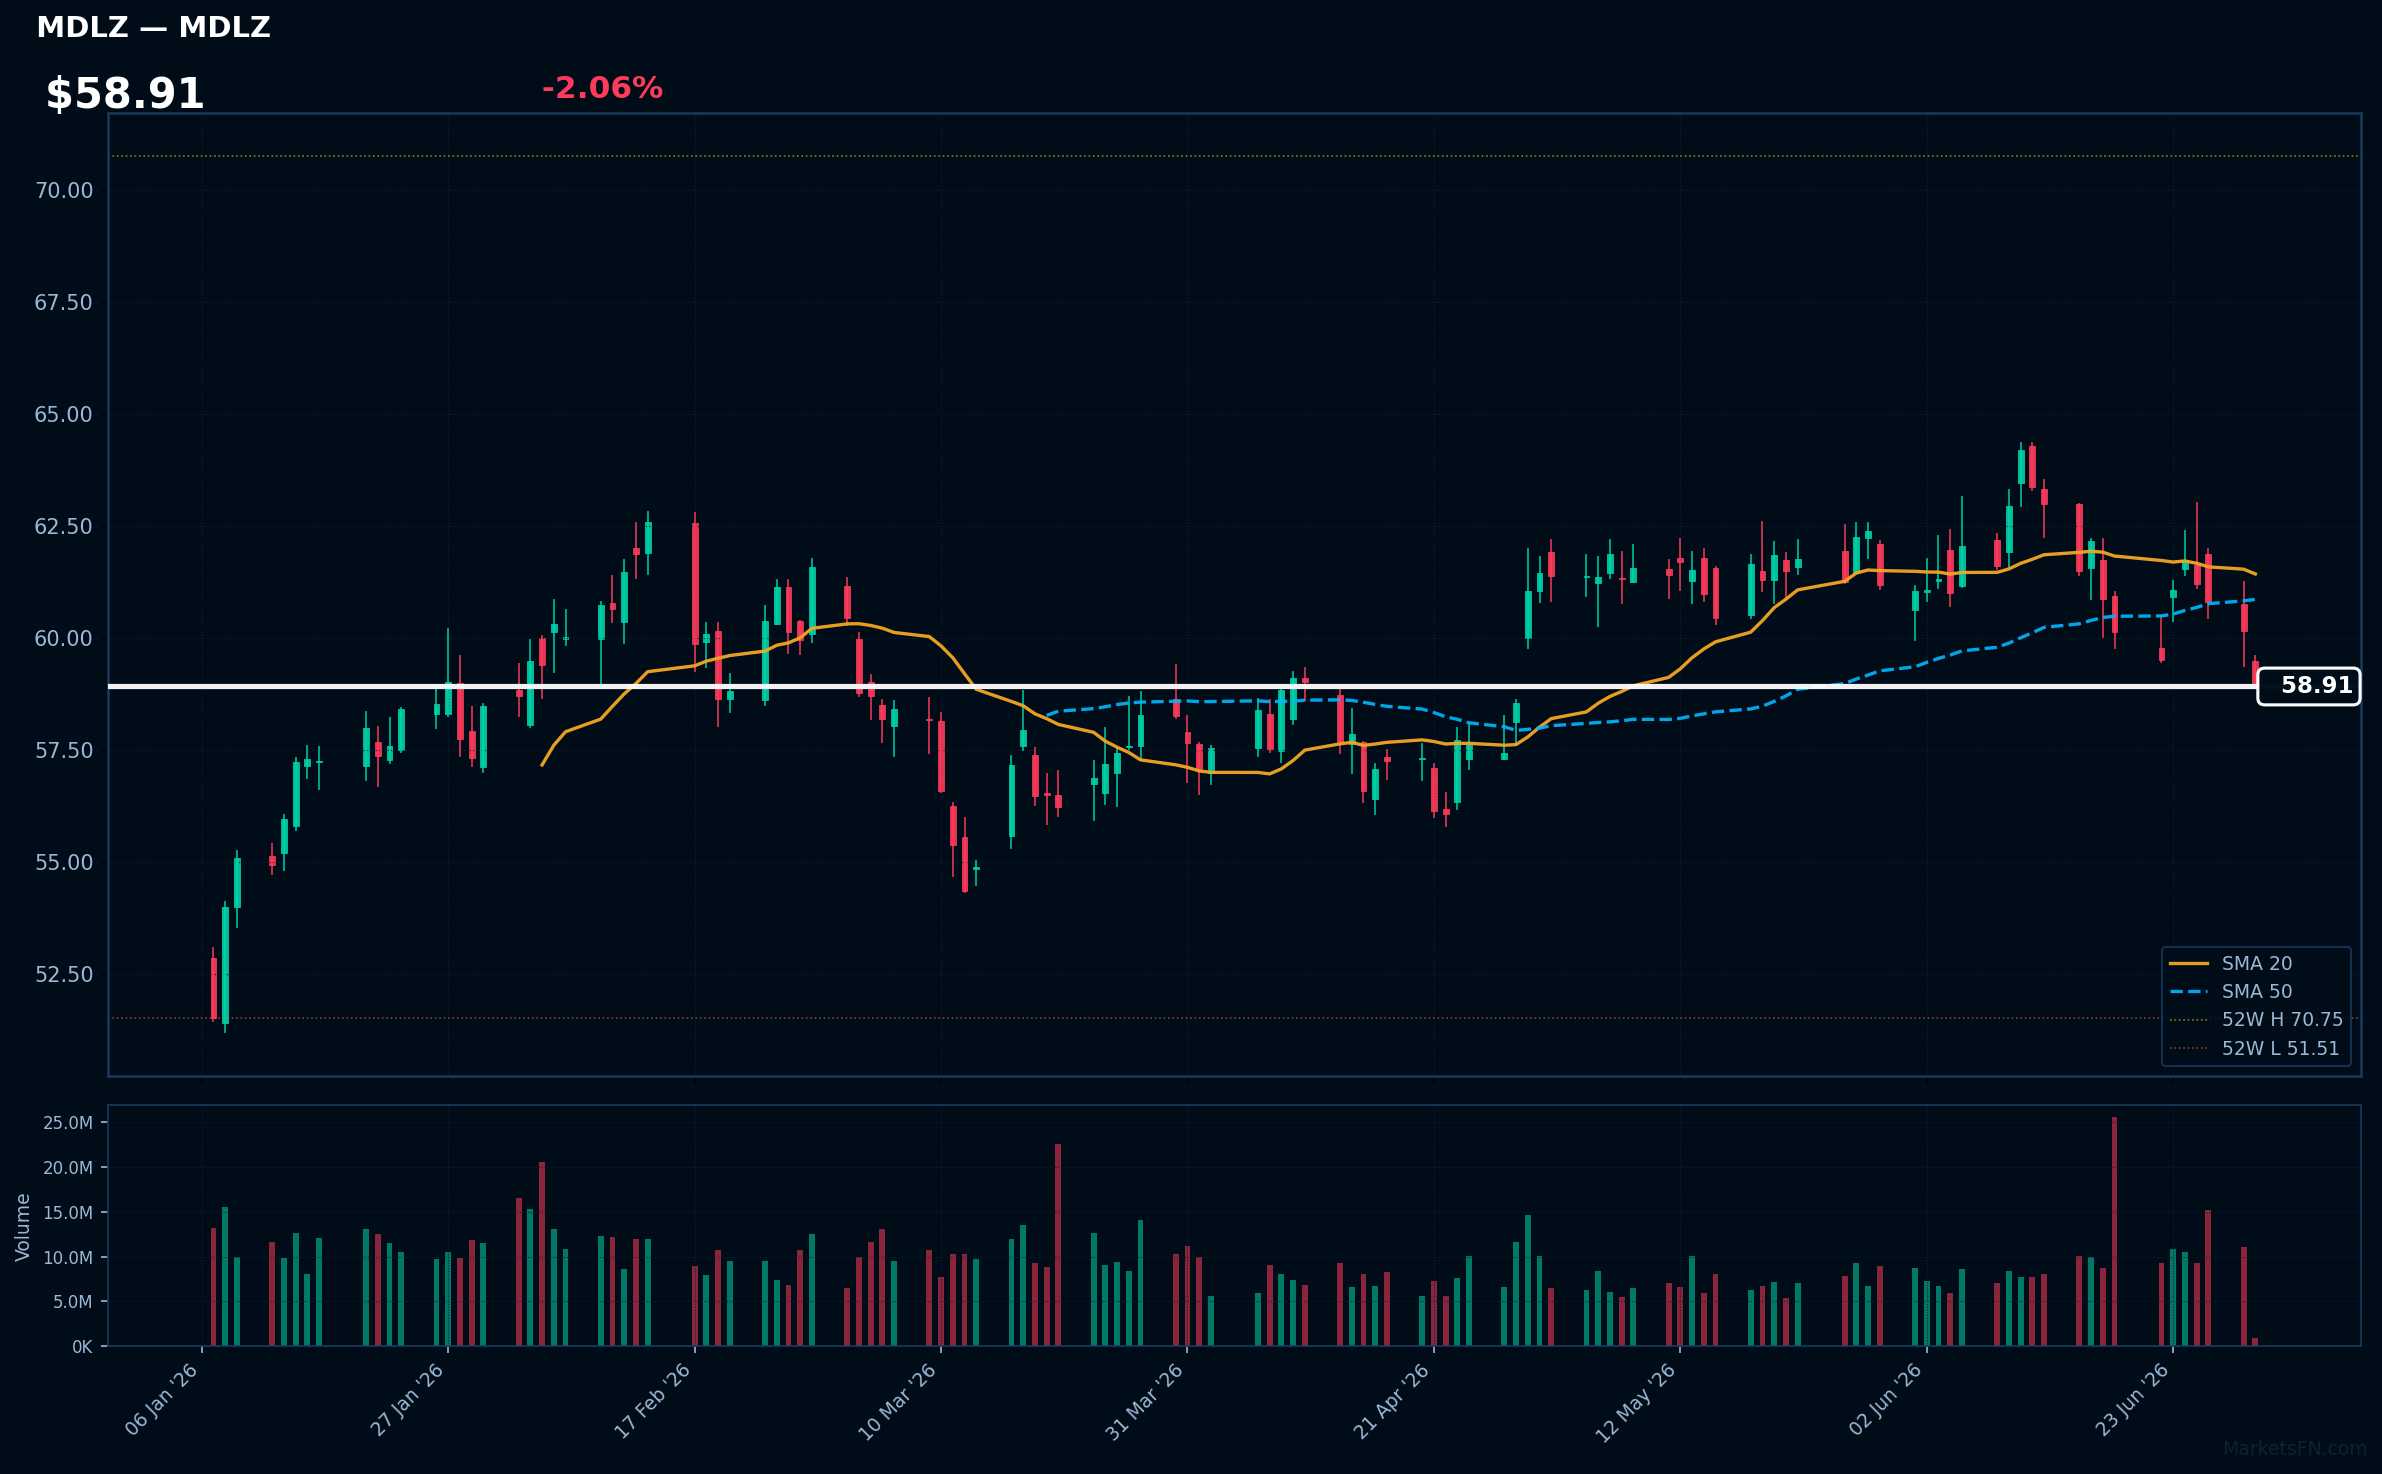
MDLZ | Mondelez International Inc | Consumer Defensive | Price: $58.91 | Day: -2.06% | 1W: -3.52% | 1M: -3.69% | RSI: 39.1 | vs MA200: +0.1% | Trend: Above MA200 · Below MA20, MA50
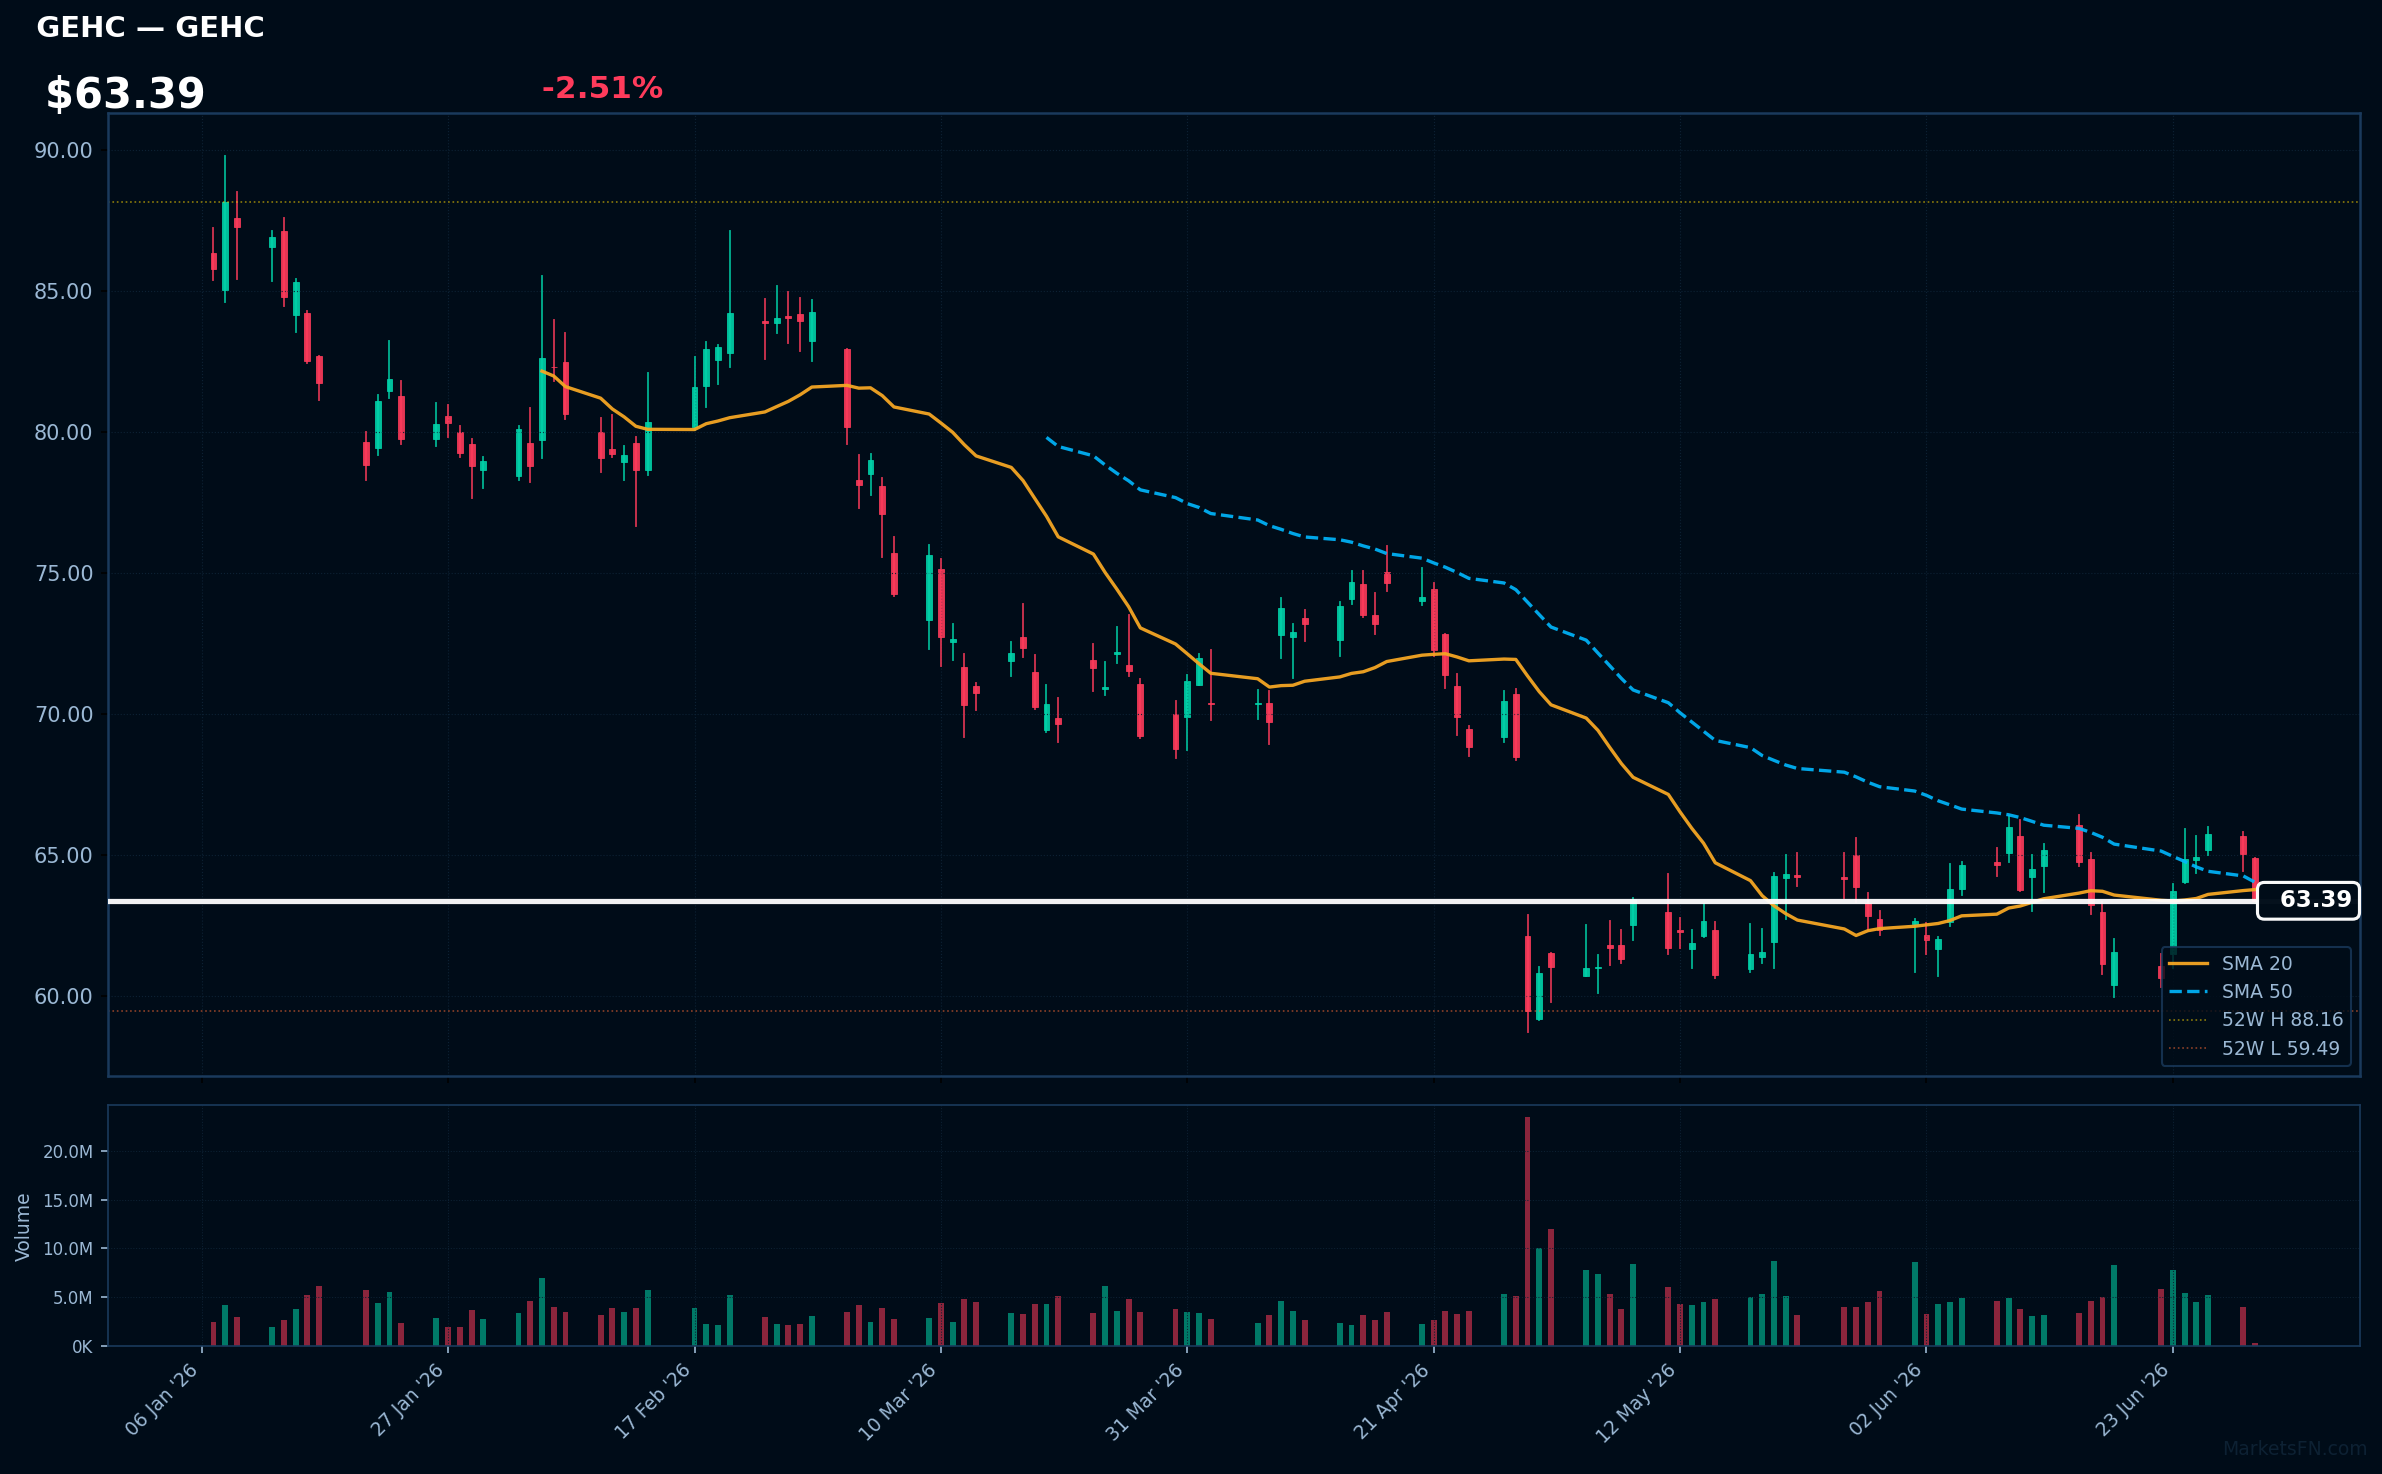
GEHC | GE HealthCare Technologies Inc | Healthcare | Price: $63.42 | Day: -2.51% | 1W: -0.52% | 1M: +1.68% | RSI: 47.8 | vs MA200: -14.6% | Trend: Below MA20, MA50, MA200
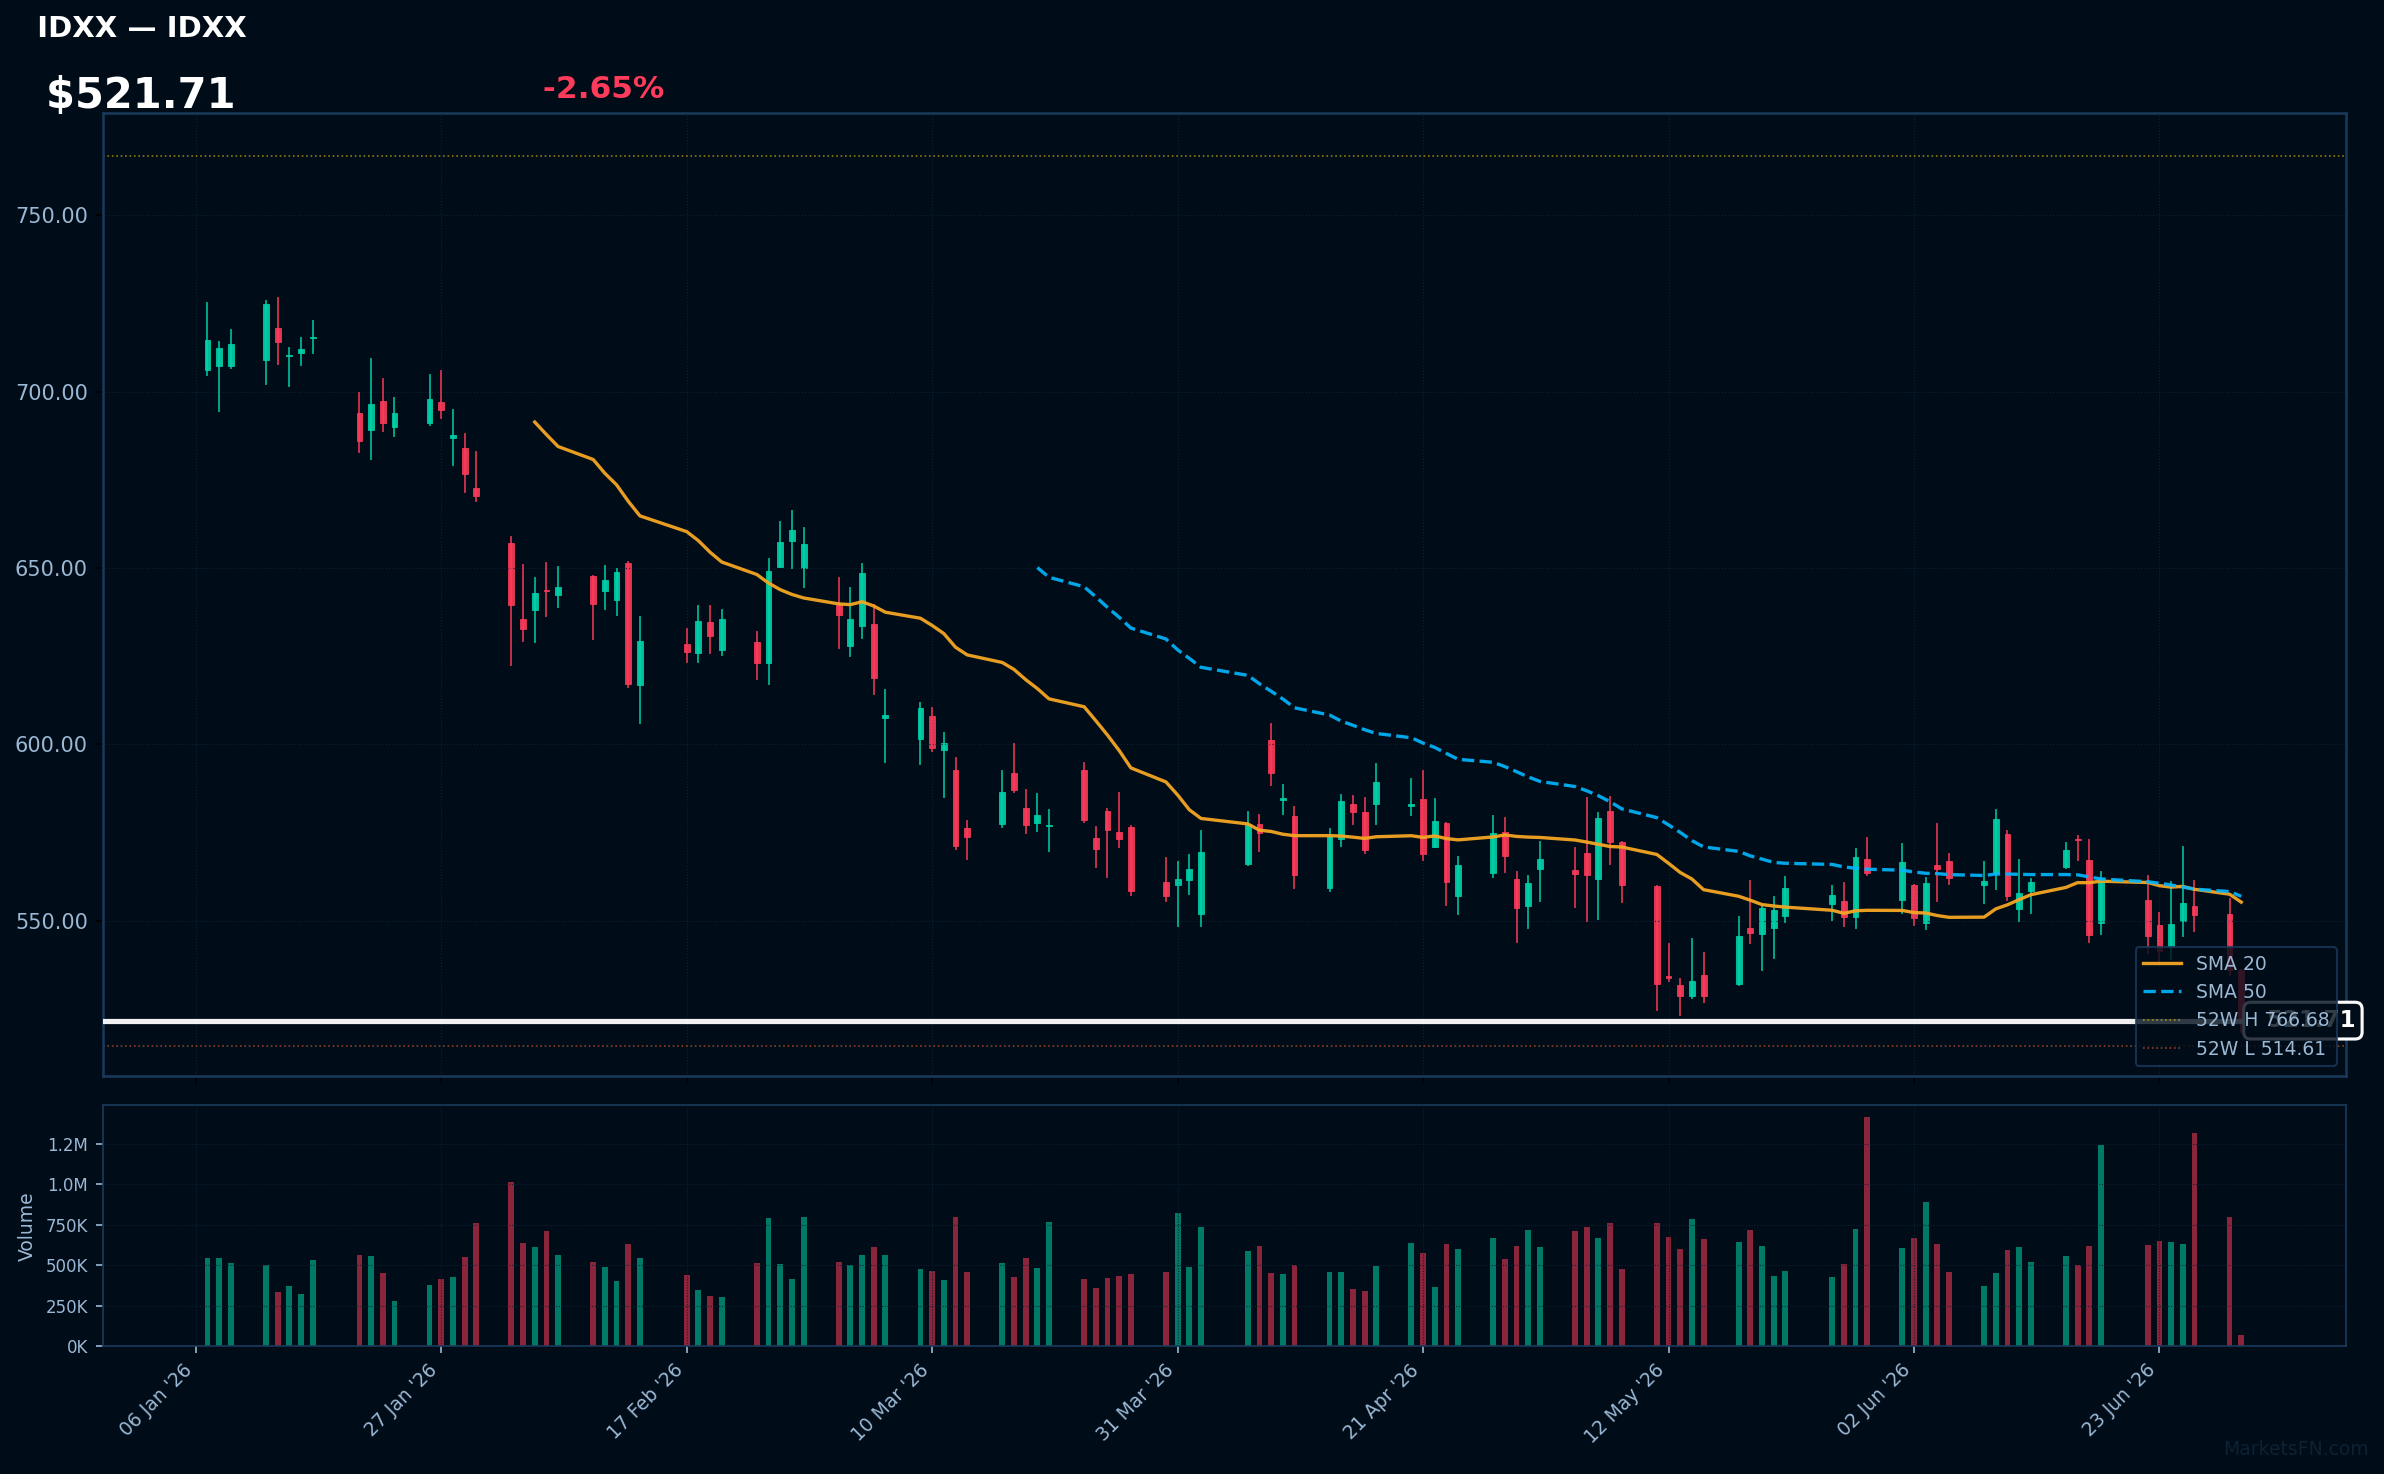
IDXX | Idexx Laboratories, Inc | Healthcare | Price: $521.71 | Day: -2.65% | 1W: -3.62% | 1M: -7.42% | RSI: 37.4 | vs MA200: -17.1% | Trend: Below MA20, MA50, MA200
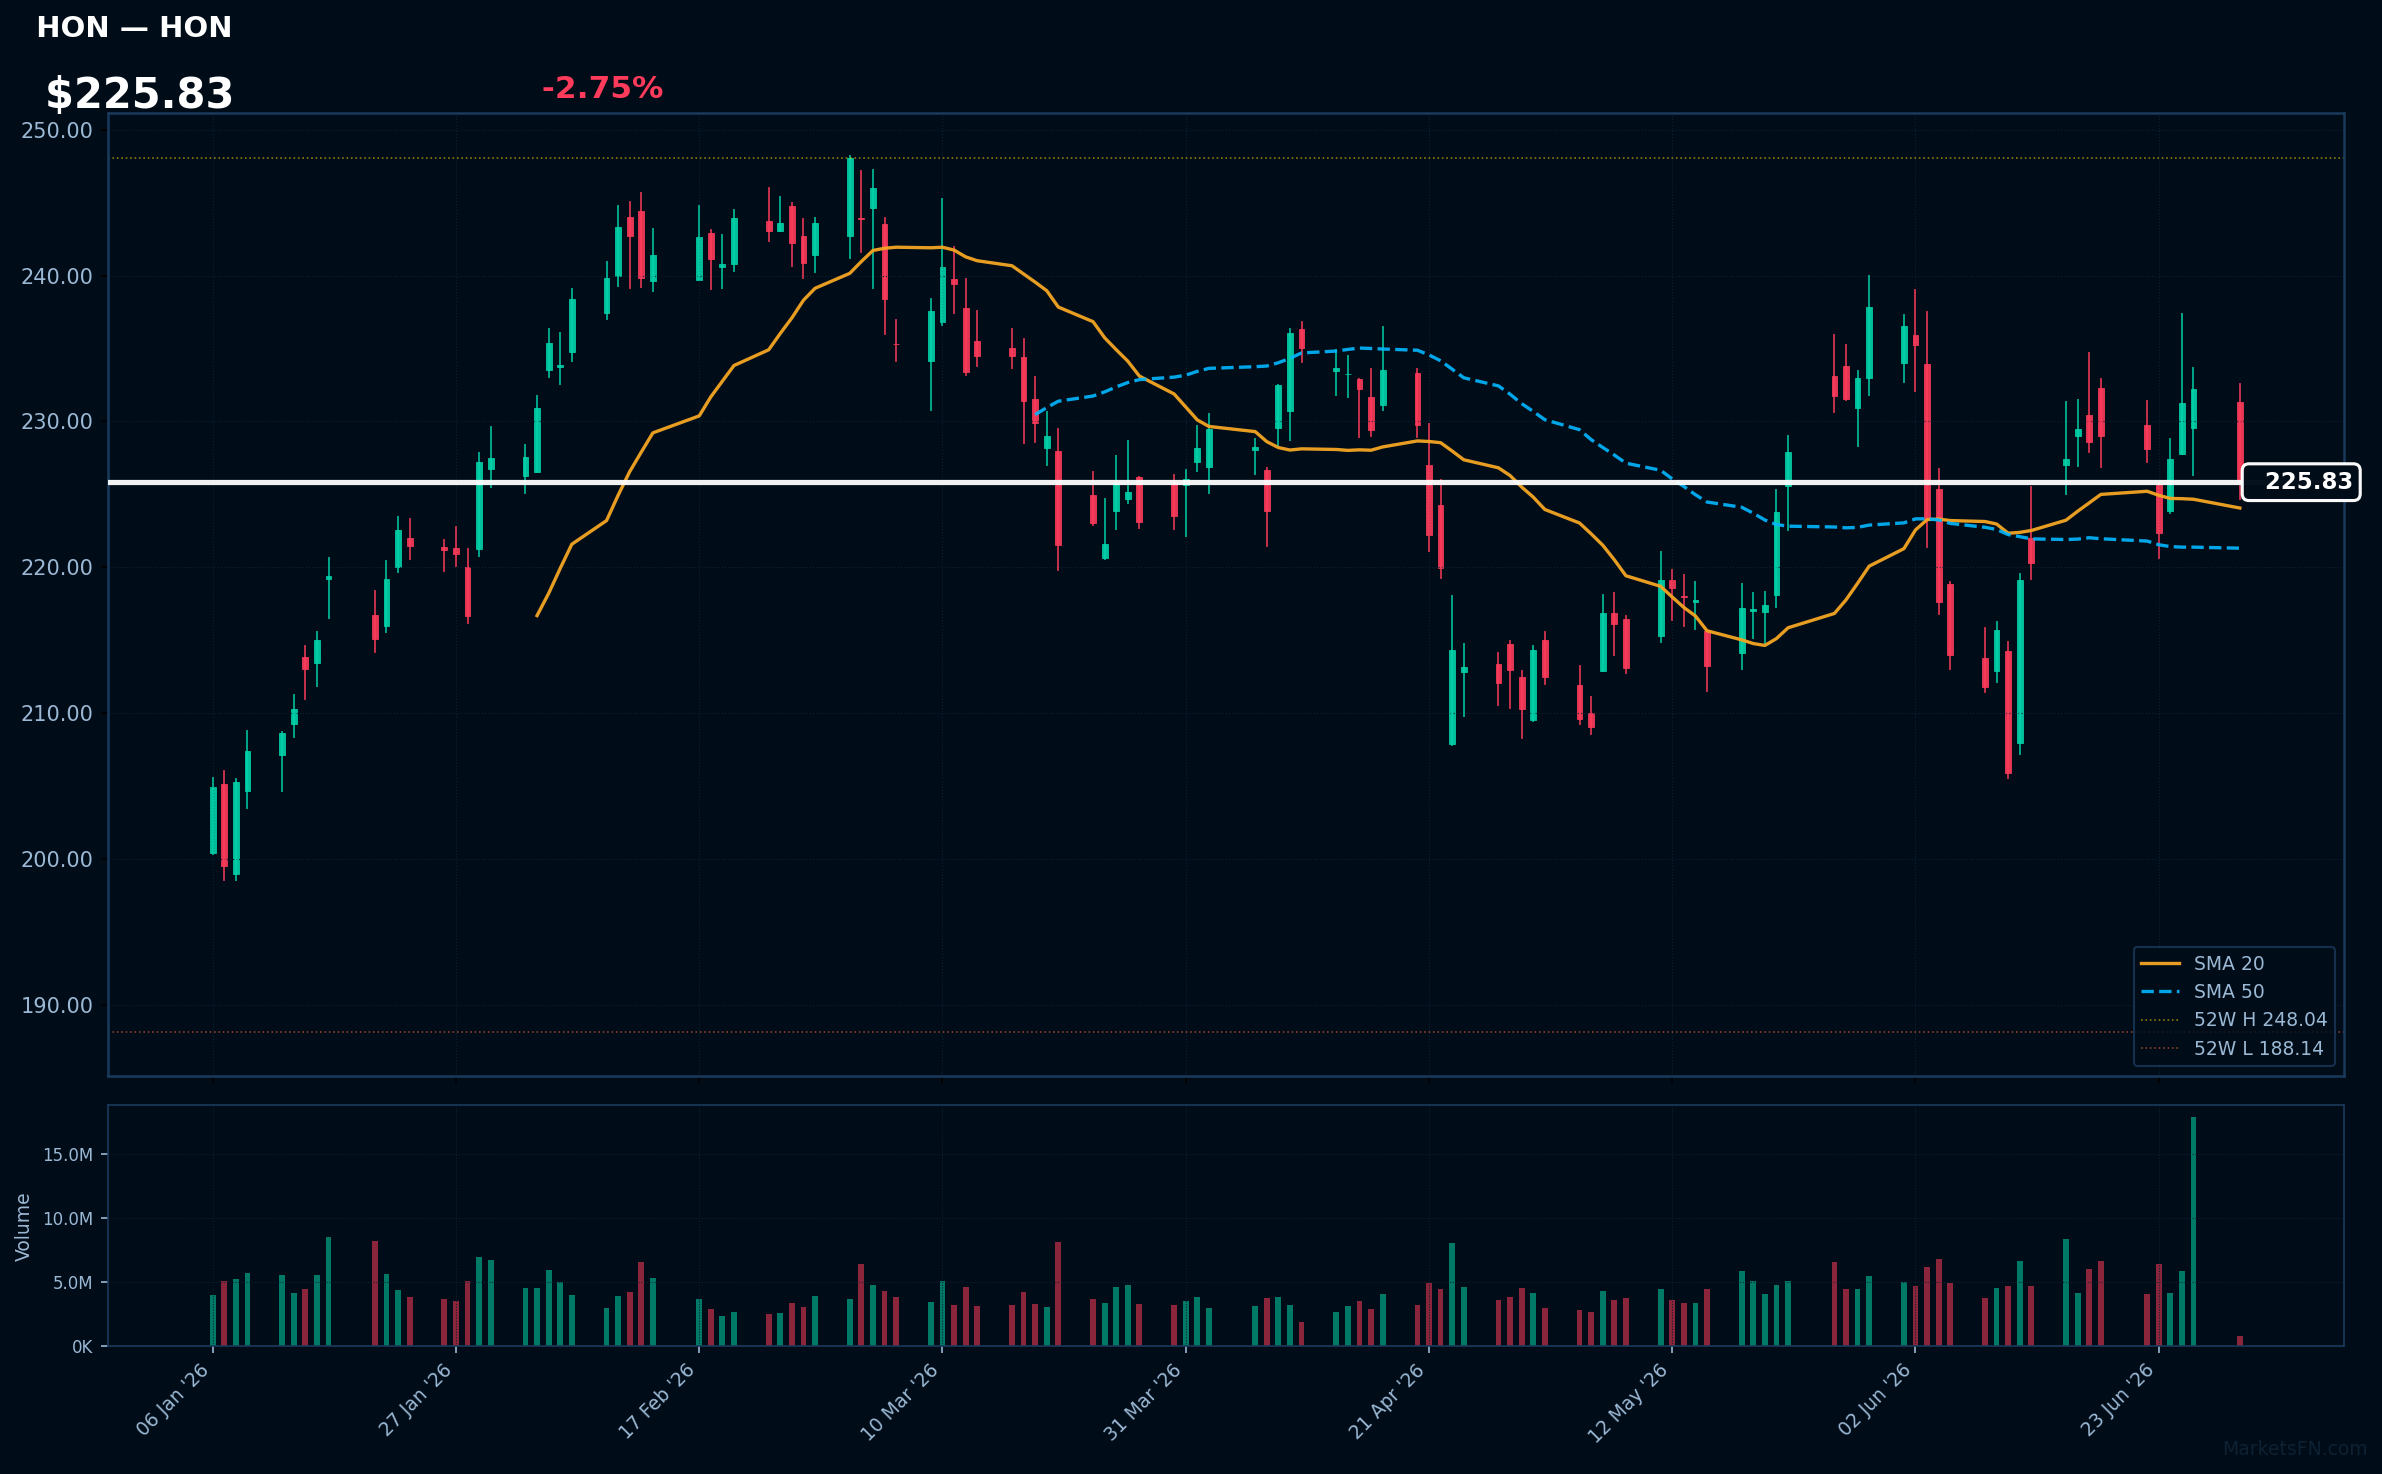
HON | Honeywell International Inc | Industrials | Price: $225.83 | Day: -2.75% | 1W: -1.00% | 1M: -3.08% | RSI: 51.1 | vs MA200: +5.4% | Trend: Above MA20, MA50, MA200
Recent headlines (last 12h)
- Goldman downgraded, Block upgraded: Wall Street's top analyst calls
- Should You Chase The Breakout In AeroVironment (AVAV) Stock?
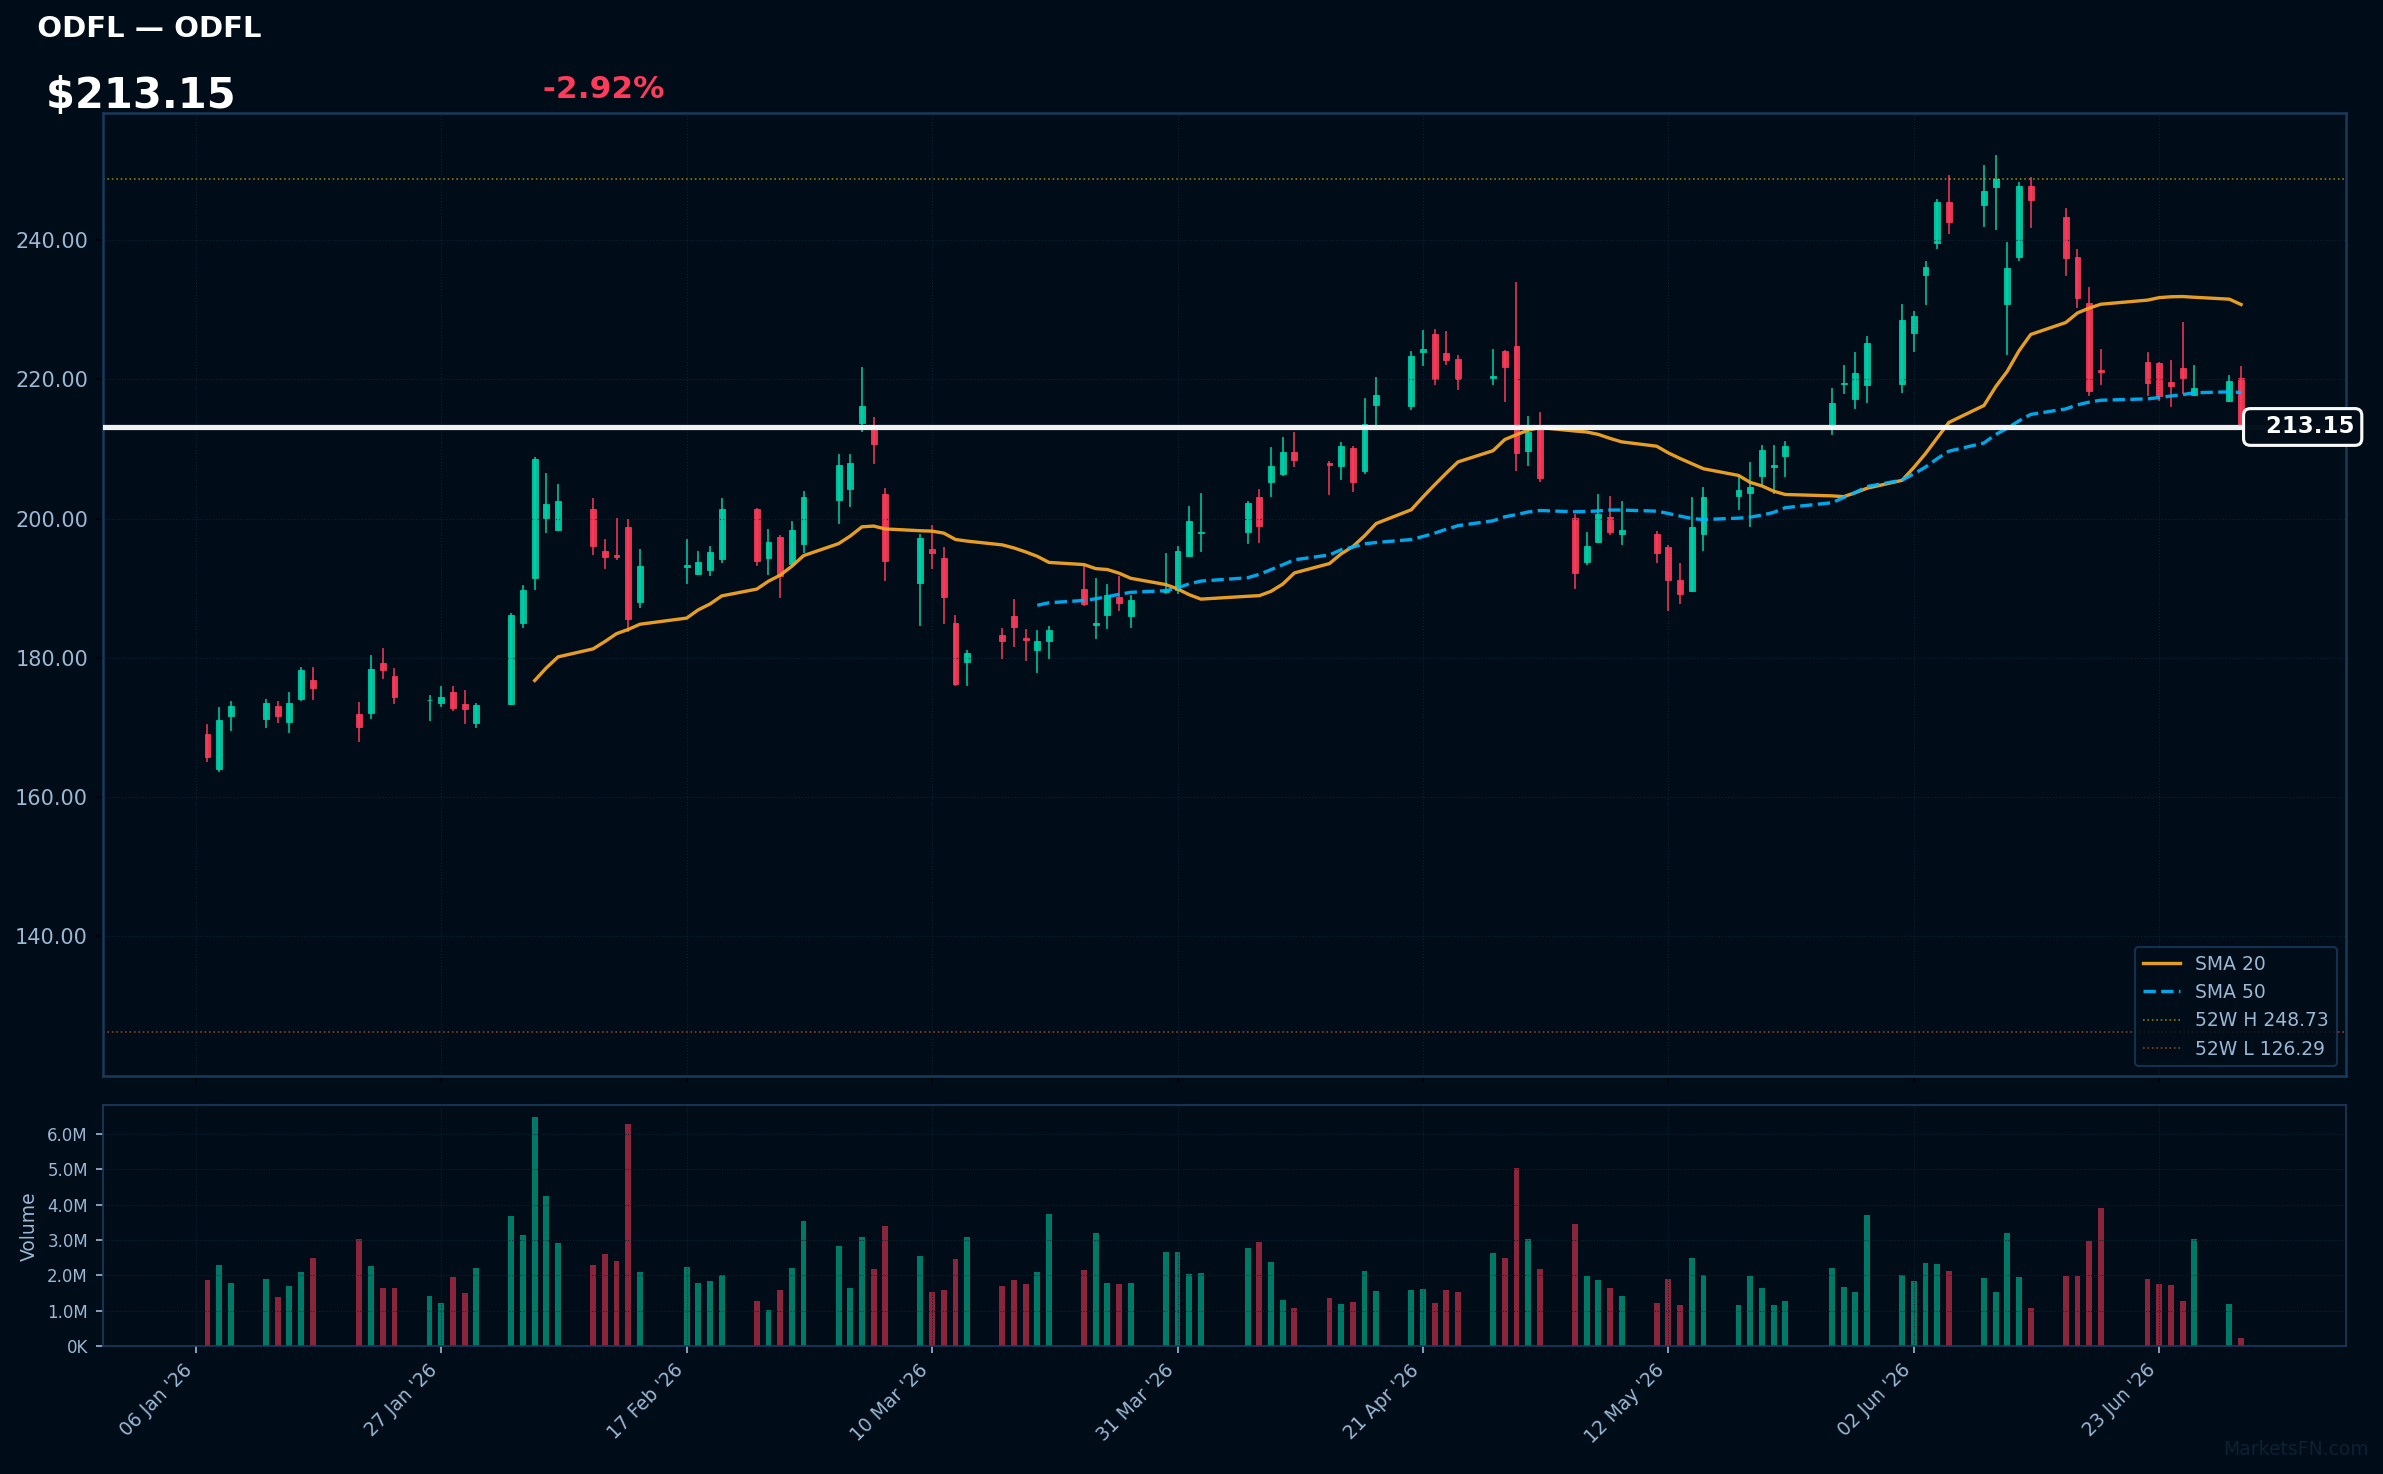
ODFL | Old Dominion Freight Line, Inc | Industrials | Price: $213.29 | Day: -2.92% | 1W: -2.04% | 1M: -5.33% | RSI: 41.2 | vs MA200: +19.2% | Trend: Above MA200 · Below MA20, MA50
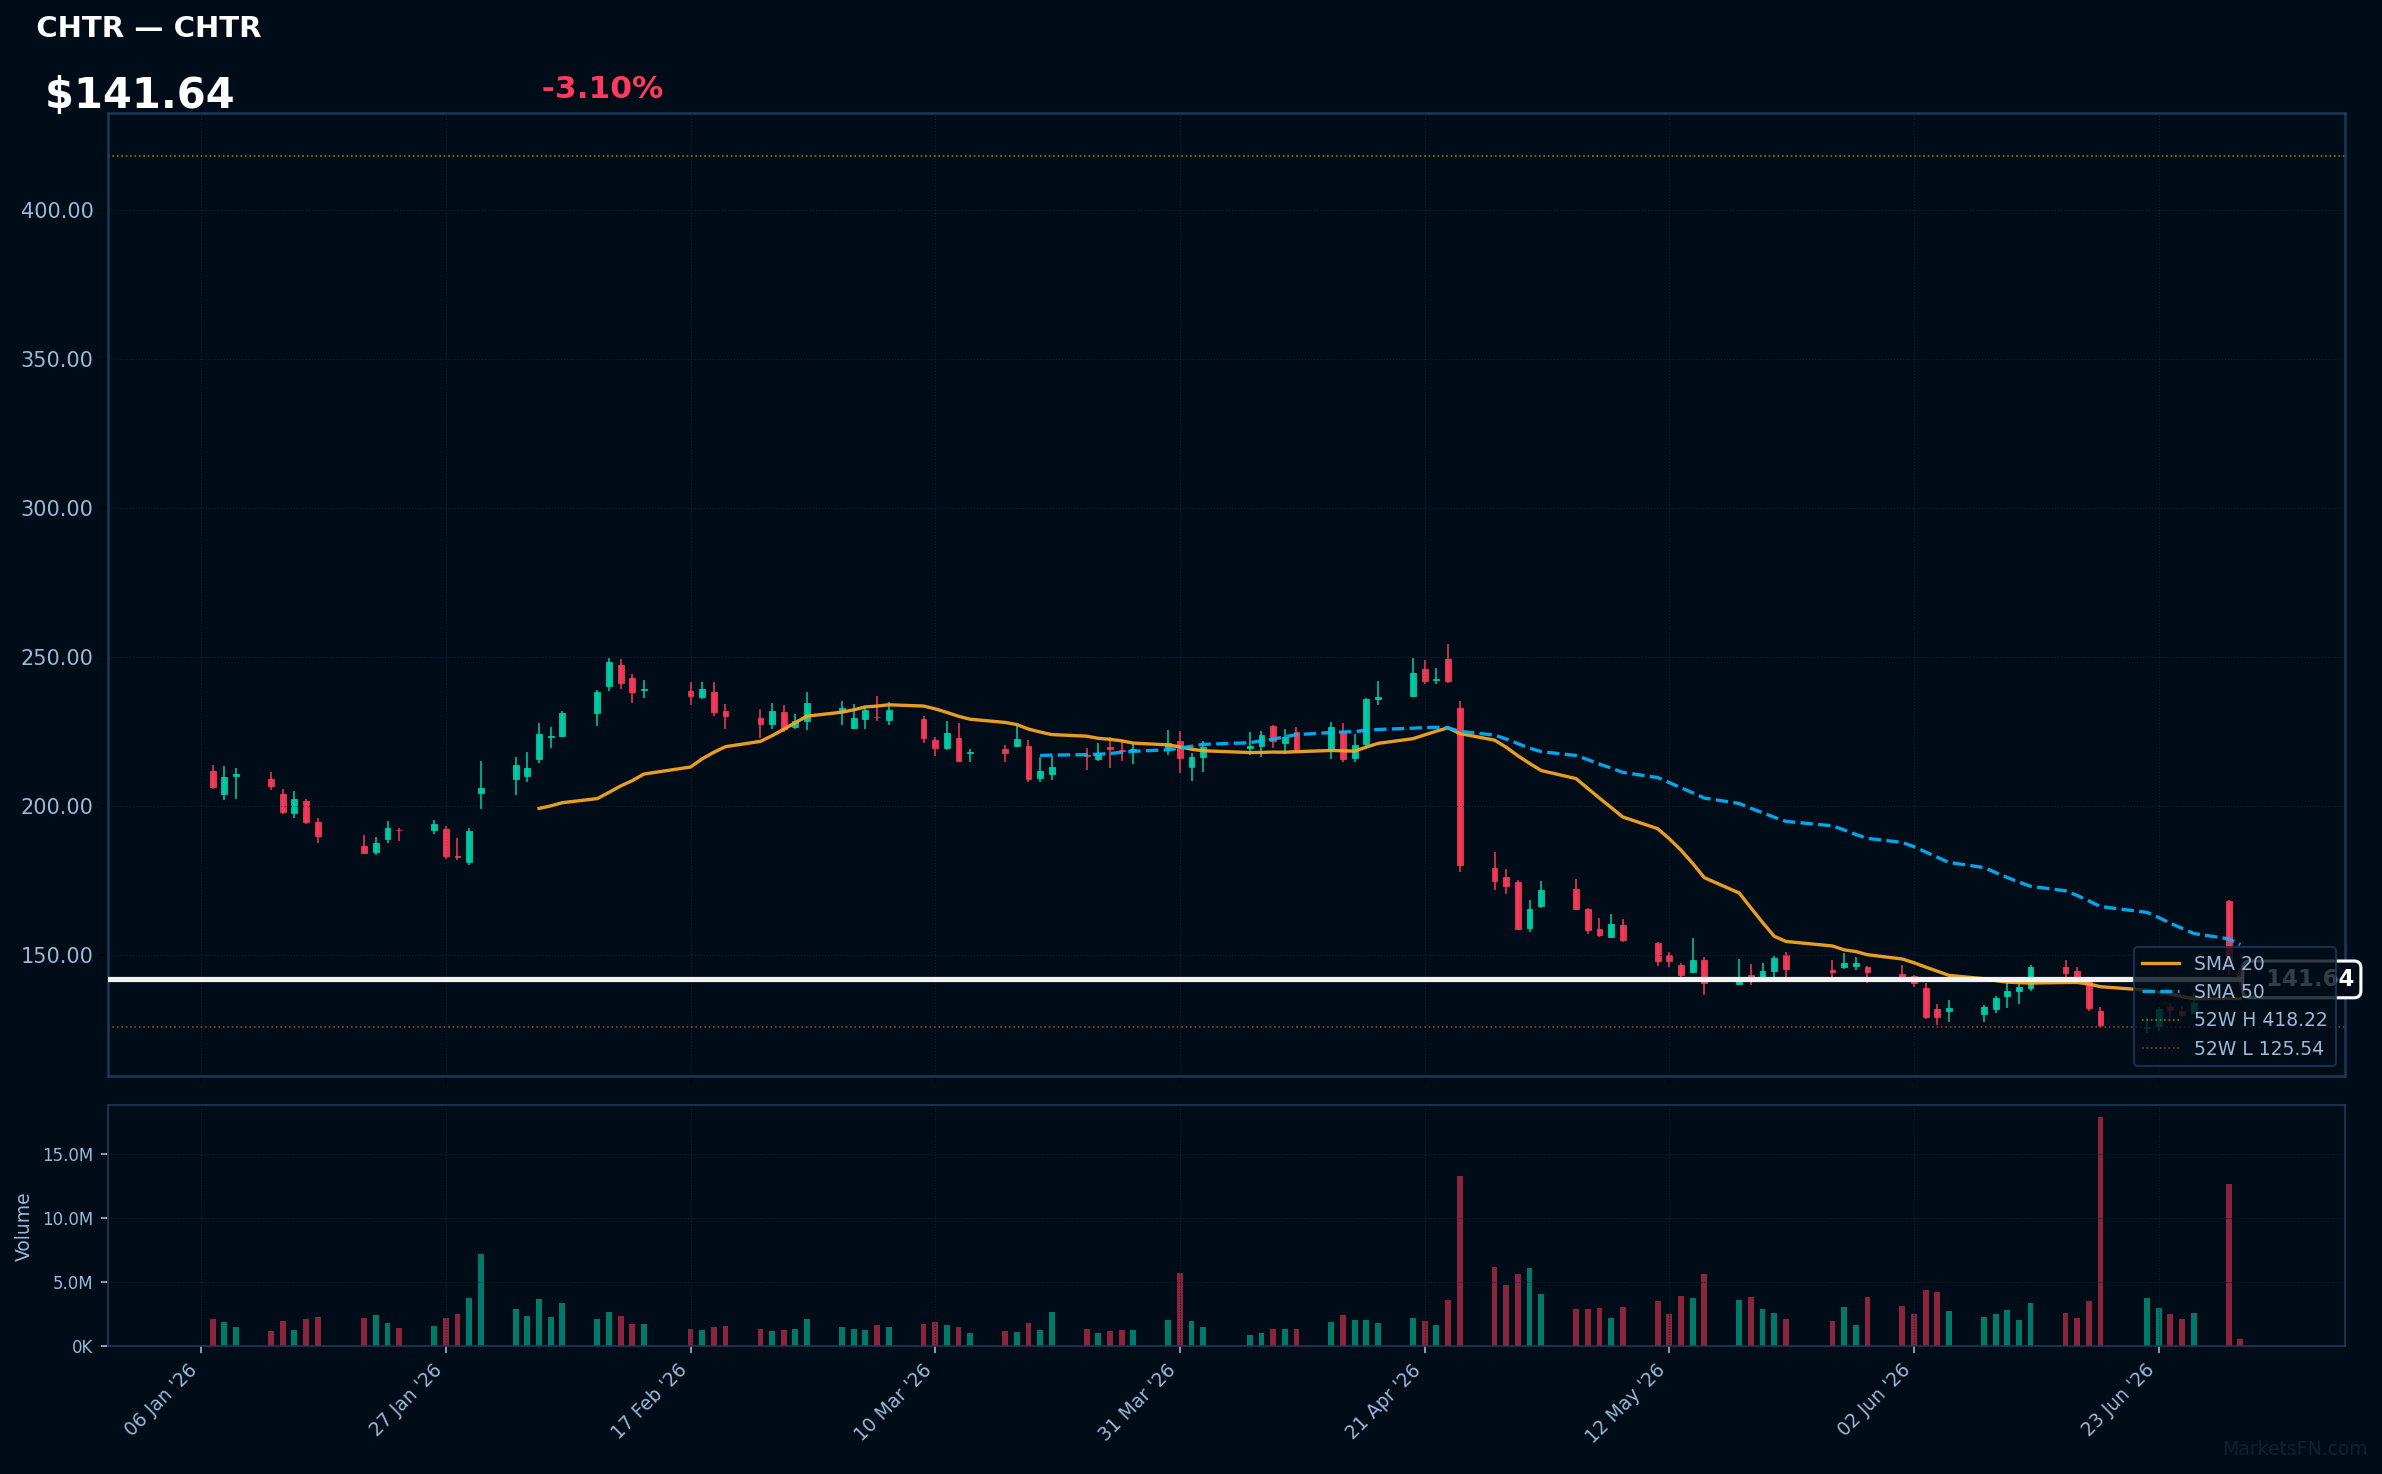
CHTR | Charter Communications Inc | Communication Services | Price: $141.64 | Day: -3.10% | 1W: +7.51% | 1M: -1.67% | RSI: 50.4 | vs MA200: -31.6% | Trend: Above MA20 · Below MA50, MA200
Recent headlines (last 12h)
- BNP Paribas Dismisses SpaceX Threat as Charter Stock Jumps
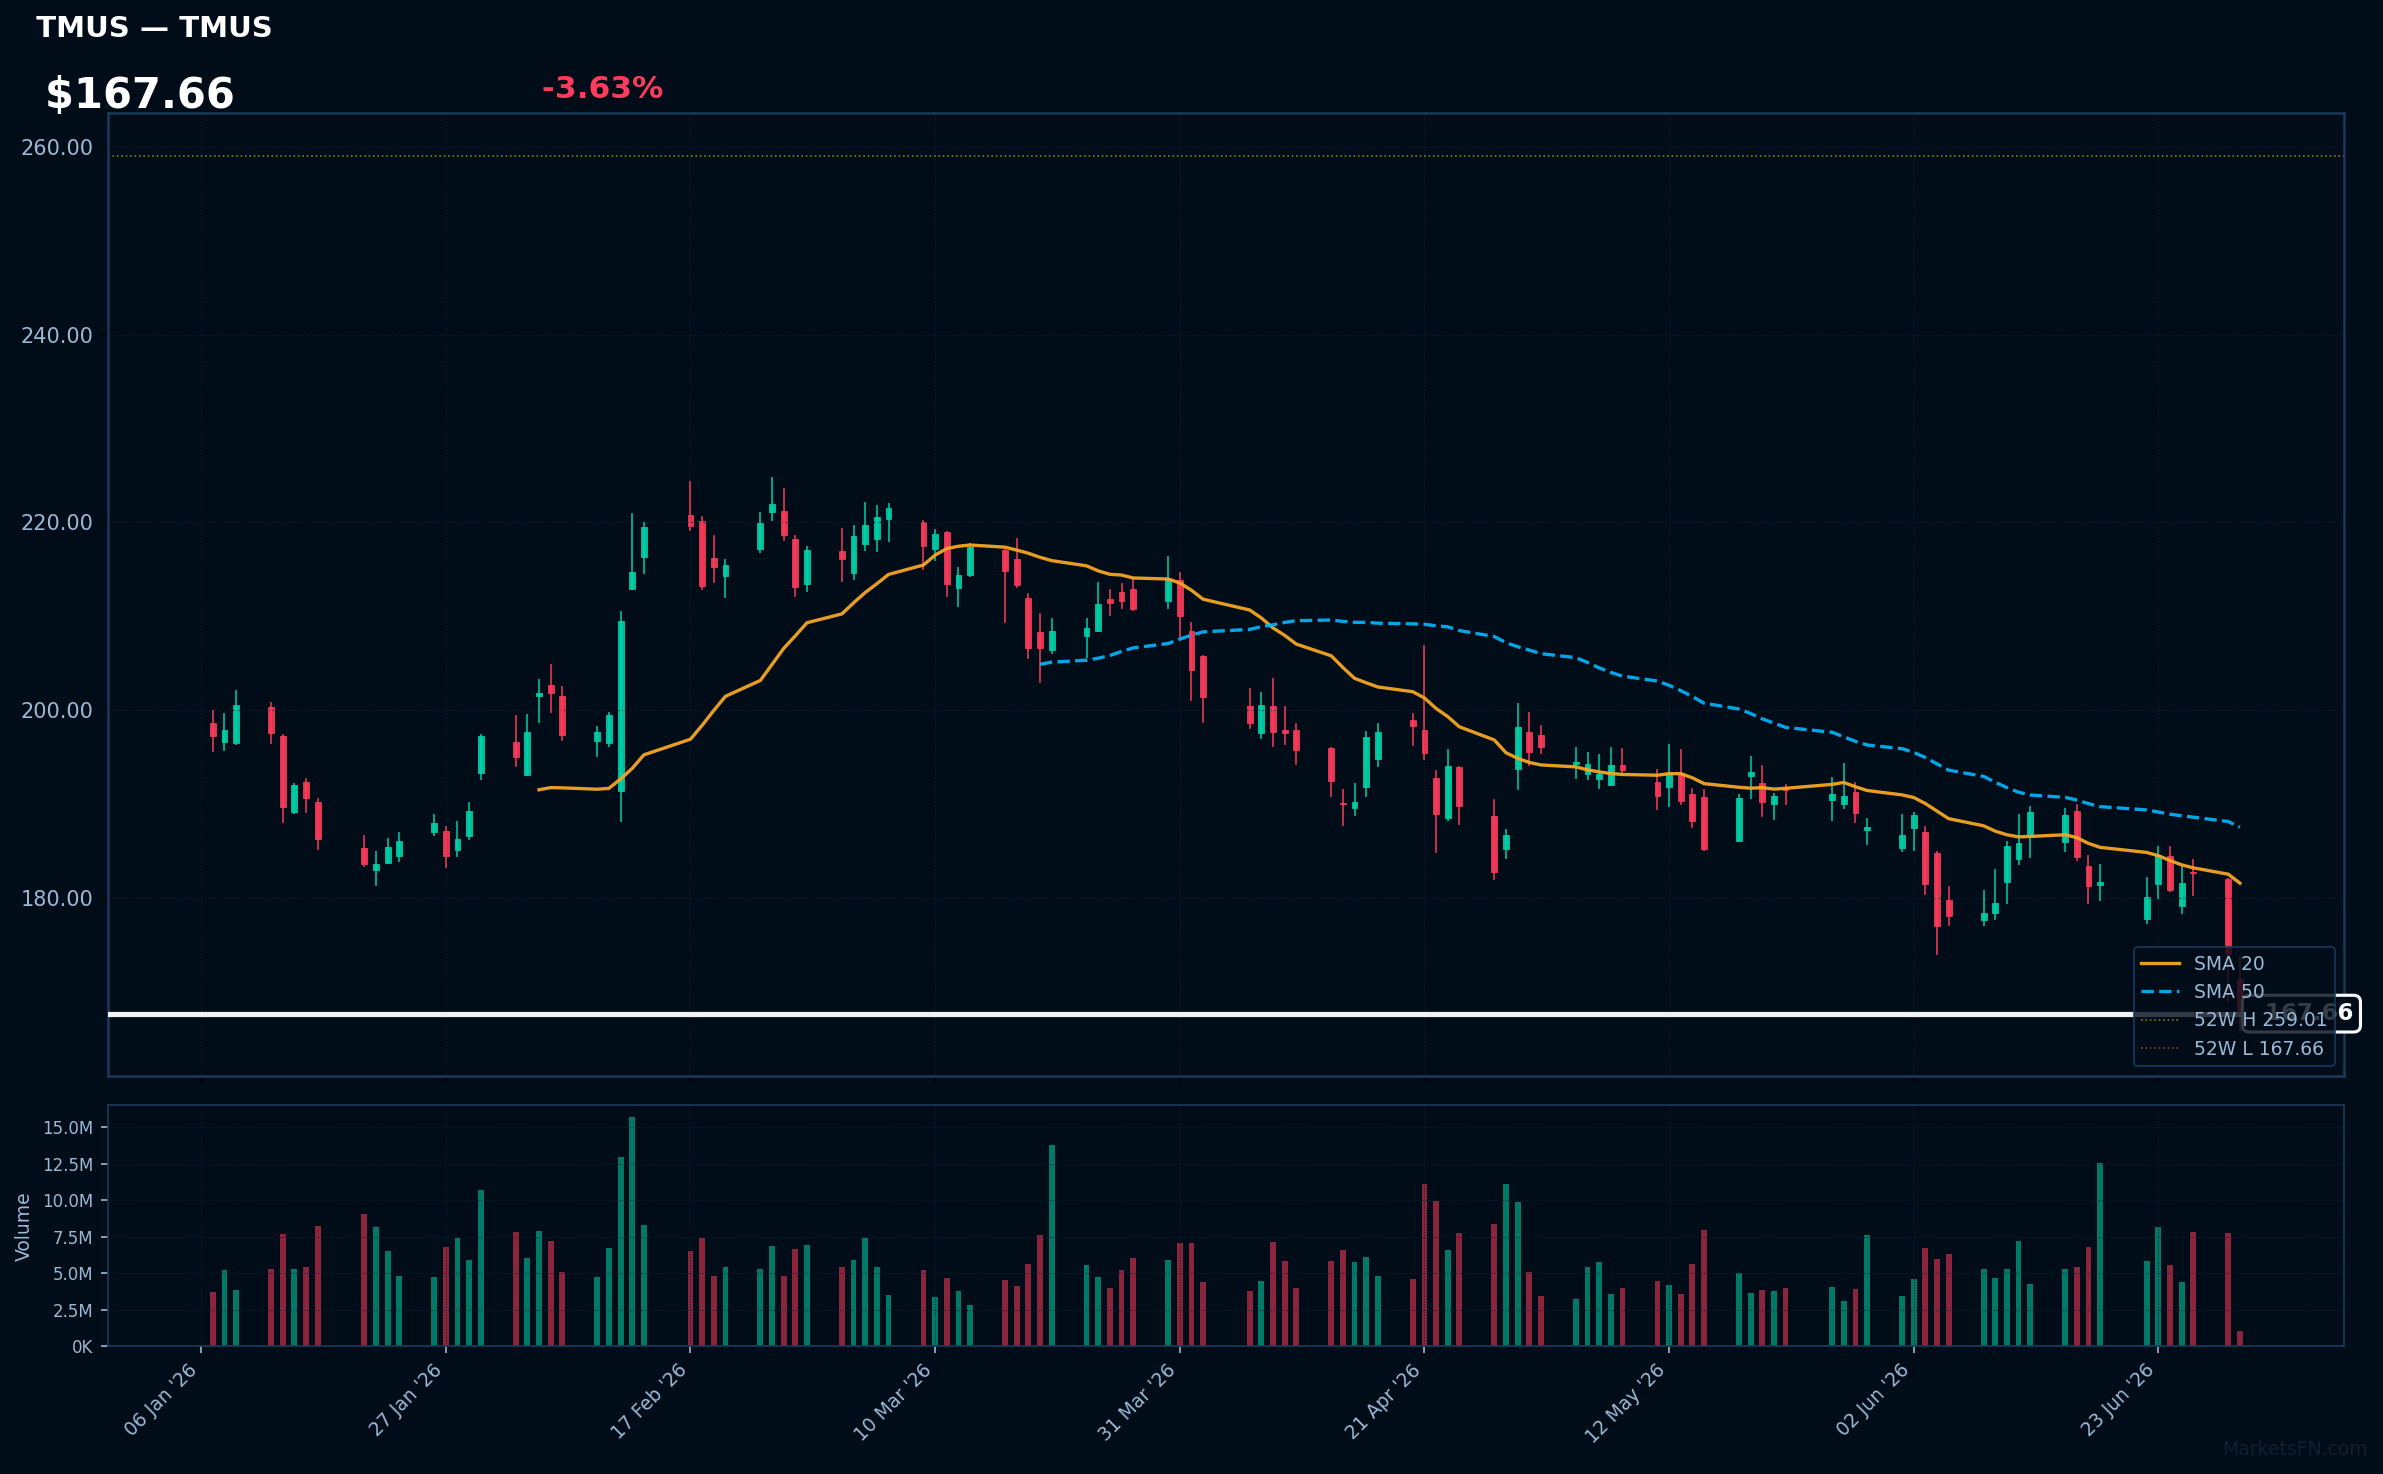
TMUS | T-Mobile US Inc | Communication Services | Price: $167.66 | Day: -3.63% | 1W: -9.16% | 1M: -10.60% | RSI: 30.3 | vs MA200: -18.1% | Trend: Below MA20, MA50, MA200
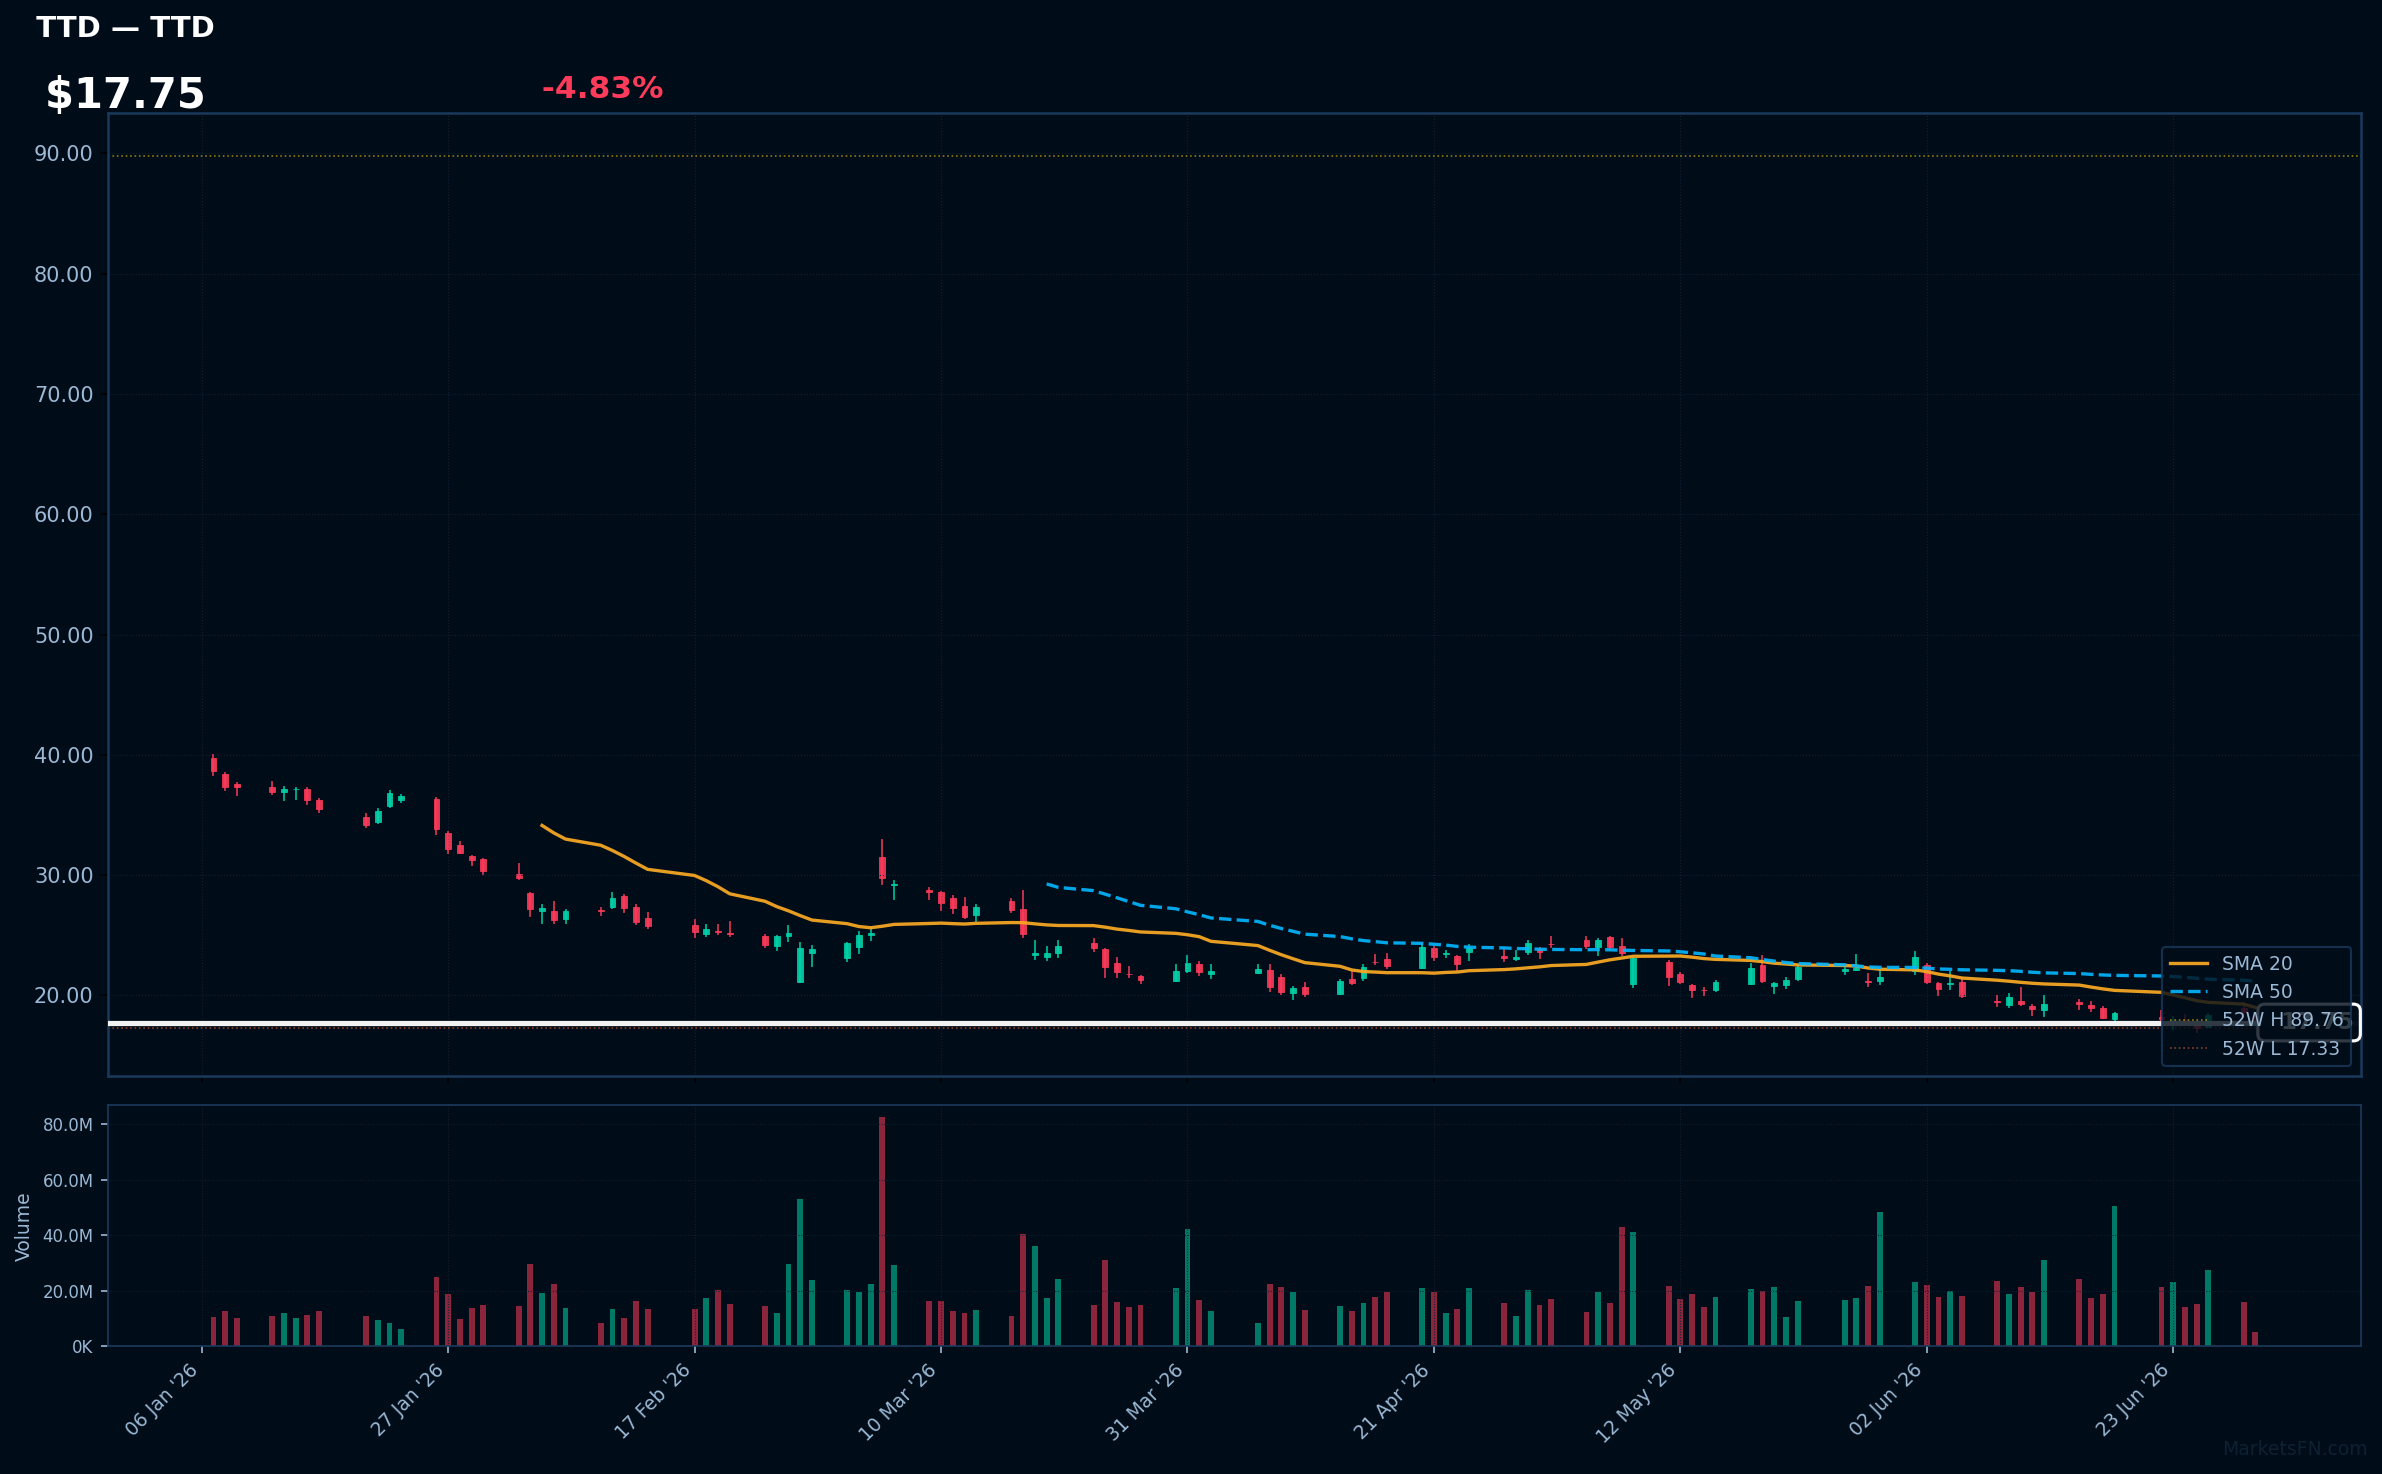
TTD | Trade Desk Inc | Communication Services | Price: $17.75 | Day: -4.83% | 1W: -1.01% | 1M: -17.68% | RSI: 38.4 | vs MA200: -45.5% | Trend: Below MA20, MA50, MA200
Recent headlines (last 12h)
- Goldman downgraded, Block upgraded: Wall Street's top analyst calls
- Trade Desk shares decline after Arete cuts rating to Sell (TTD)
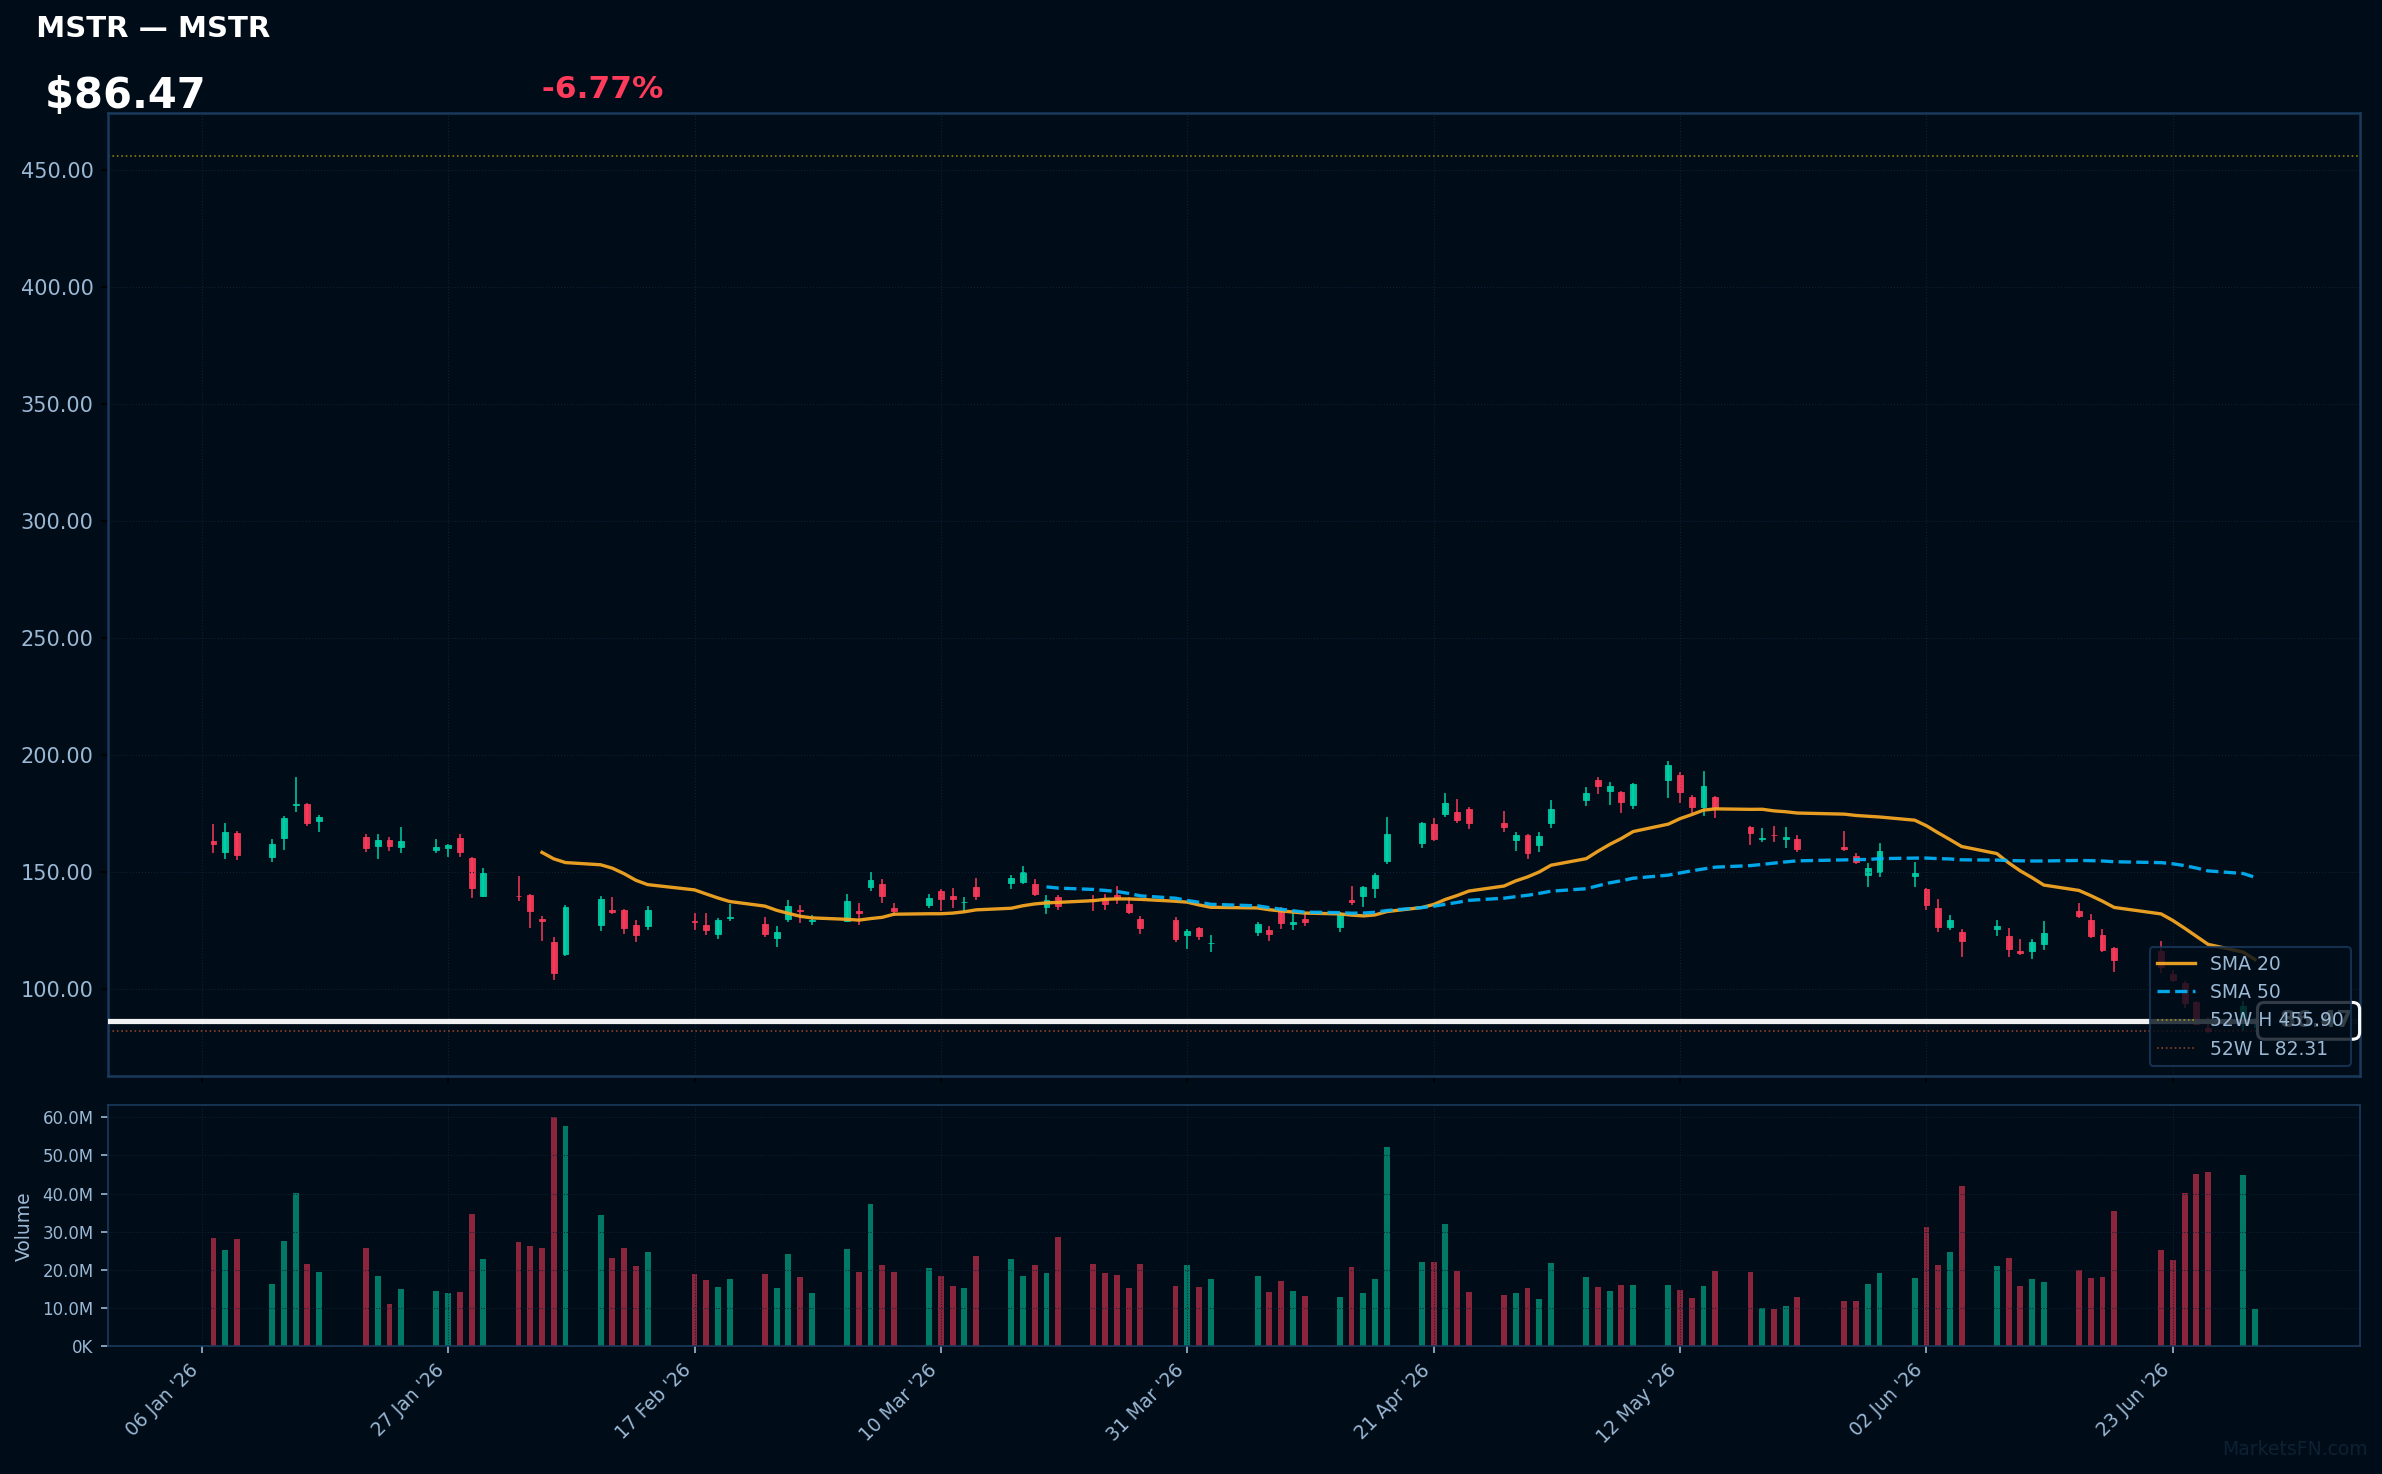
MSTR | Strategy Inc | Technology | Price: $86.40 | Day: -6.77% | 1W: -16.73% | 1M: -45.65% | RSI: 30.1 | vs MA200: -52.9% | Trend: Below MA20, MA50, MA200
Recent headlines (last 12h)
- Morning Minute: A Change of Strategy
- Will bitcoin still see big gains this July in spite of crypto winter?
- Concentrix shares slide after earnings, and other early market movers
- A Look Inside Saylors Bitcoin Monetization Program: Strategy Files to Sell $1.25B in BTC
Market Commentary
The Nasdaq 100 session on June 30, 2026, was characterized by negative breadth, with decliners outnumbering advancers 57 to 44, or 56.4% to 43.6%. The average daily change was still positive at +0.10%, indicating a muted overall gain despite the unfavorable advance-decline ratio.
Technology sector dynamics revealed a nuanced rotation, with top gainers including major tech names like ASML, ARM, AMAT, and TXN, while tech stocks like PYPL and MSTR were among the top losers. The presence of both tech leaders and laggards in the top movers suggests an active rotation within the sector. Industrials and Technology were the dominant sectors among gainers, while Healthcare, Consumer Defensive, and Communication Services featured prominently among losers.
With only 12.9% of stocks above their MA200, the index remains vulnerable to further downside. Traders should monitor the MA200 level closely, as a breach could trigger additional selling pressure. A key catalyst to watch is the upcoming earnings reports from major tech names, which could either validate or invalidate the current rotation and sector dynamics.
Methodology
Daily ranking uses the latest session close versus the prior close. RSI (14-day EWM), MA20, MA50, and MA200 are computed from 12 months of daily OHLCV data sourced from Yahoo Finance. Charts show the last 120 trading sessions with SMA 20/50, 52-week H/L markers, and volume. Recent news (last 12 h) is sourced from FinViz. Updated every trading day.
Disclaimer
The content on MarketsFN.com is provided for educational and informational purposes only. It does not constitute financial advice, investment recommendations, or trading guidance. All investments involve risks, and past performance does not guarantee future results. You are solely responsible for your investment decisions and should conduct independent research and consult a qualified financial advisor before acting. MarketsFN.com and its authors are not liable for any losses or damages arising from your use of this information.
Related Articles
- S&P 500 Bull & Bear Radar — June 30, 2026 — S&P 500 Bull & Bear Radar — June 30, 2026 A daily technical sweep of 496 S&P 500 constituents ranked by session…
- Nasdaq 100 52-Week Highs & Lows Radar: ASML Holding NV (ASML), T-Mobile US (TMUS) and more — Nasdaq 100 stocks nearest to their 52-week high and low. Bloomberg-style charts, RSI/MA analysis and Grok commentary.
- S&P 500 52-Week Highs & Lows Radar: GE Aerospace (GE), T-Mobile US (TMUS) and more — S&P 500 stocks nearest to their 52-week high and low. Bloomberg-style charts, RSI/MA analysis and Grok commentary.
- Nasdaq 100 2026 YTD Highs & Lows Radar: Palo Alto Networks (PANW), T-Mobile US (TMUS) and more — Nasdaq 100 stocks nearest to their 2026 year-to-date high and low. Bloomberg-style charts, RSI/MA analysis and Grok…
- S&P 500 2026 YTD Highs & Lows Radar: Lilly(Eli) & (LLY), T-Mobile US (TMUS) and more — S&P 500 stocks nearest to their 2026 year-to-date high and low. Bloomberg-style charts, RSI/MA analysis and Grok…