S&P 500 Bull & Bear Radar — June 30, 2026
· Stocks · QuoteReporter
S&P 500 Bull & Bear Radar — June 30, 2026
A daily technical sweep of 496 S&P 500 constituents ranked by session performance, enriched with RSI, MA20/MA50/MA200 trend signals, Bloomberg-style charts, and recent news.
Index-Wide Breadth
| Constituents tracked | 496 |
| Advancing | 164 (33.1%) |
| Declining | 332 (66.9%) |
| Average daily change | 0.34% |
| Above MA200 | 12 (2.4%) |
Top 10 Gainers
Today's strongest S&P 500 performers. Sector leadership: Technology (7), Basic Materials (2), Industrials (1).
| Ticker | Company | Sector | Price | Day % | 1W % | 1M % | RSI | vs MA200 | Trend |
|---|---|---|---|---|---|---|---|---|---|
| APD | Air Products & Chemicals Inc | Basic Materials | $296.26 | +9.18% | +4.81% | +6.25% | 61.2 | +8.3% | Above MA20, MA50, MA200 |
| KLAC | KLA Corp | Technology | $295.82 | +6.26% | +20.57% | +53.40% | 69.7 | +96.7% | Above MA20, MA50, MA200 |
| AXON | Axon Enterprise Inc | Industrials | $542.27 | +6.20% | +25.32% | +20.94% | 71.2 | +1.4% | Above MA20, MA50, MA200 |
| ON | ON Semiconductor Corp | Technology | $93.71 | +5.80% | -20.13% | -22.48% | 39.8 | +32.8% | Above MA200 · Below MA20, MA50 |
| GLW | Corning, Inc | Technology | $270.45 | +5.77% | +39.14% | +49.06% | 71.8 | +114.7% | Above MA20, MA50, MA200 |
| LRCX | Lam Research Corp | Technology | $430.21 | +4.70% | +15.69% | +35.01% | 66.6 | +95.3% | Above MA20, MA50, MA200 |
| INTC | Intel Corp | Technology | $137.80 | +4.62% | +3.94% | +19.89% | 62.1 | +132.3% | Above MA20, MA50, MA200 |
| APH | Amphenol Corp | Technology | $172.76 | +3.81% | +8.84% | +16.11% | 69.3 | +24.9% | Above MA20, MA50, MA200 |
| ALB | Albemarle Corp | Basic Materials | $134.57 | +3.74% | -10.27% | -23.72% | 31.6 | -9.3% | Below MA20, MA50, MA200 |
| AKAM | Akamai Technologies Inc | Technology | $118.05 | +3.73% | -1.49% | -21.04% | 38.0 | +17.5% | Above MA200 · Below MA20, MA50 |
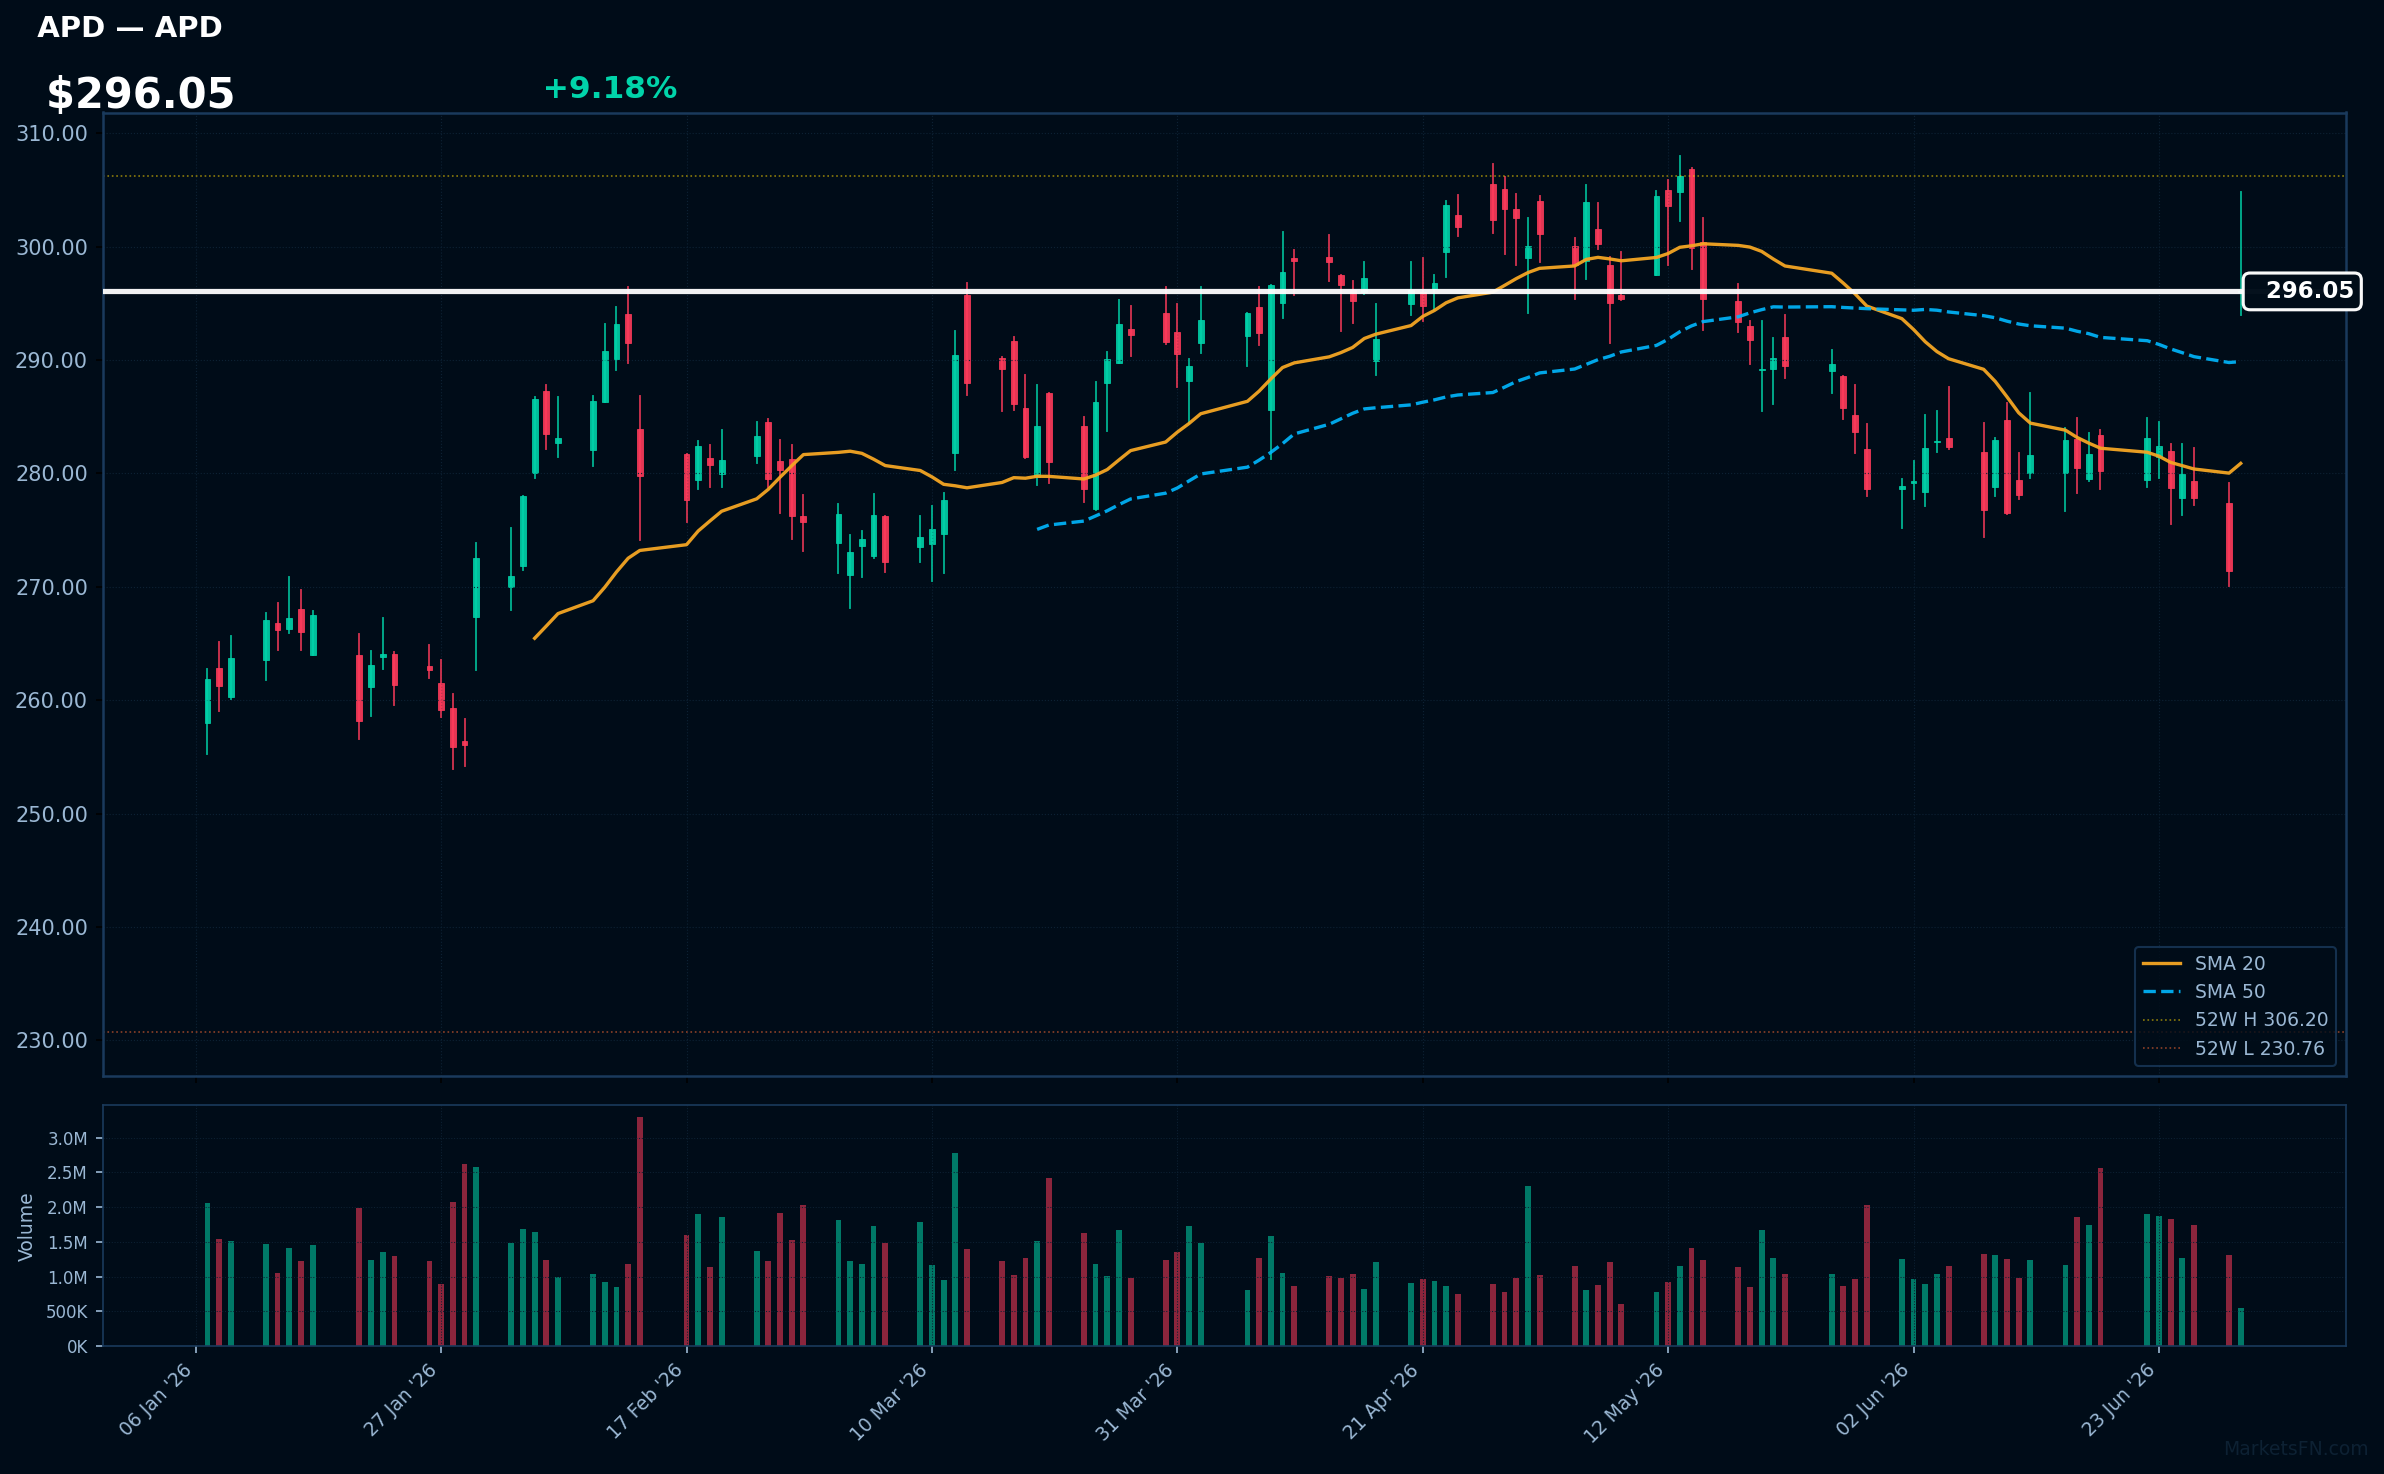
APD | Air Products & Chemicals Inc | Basic Materials | Price: $296.26 | Day: +9.18% | 1W: +4.81% | 1M: +6.25% | RSI: 61.2 | vs MA200: +8.3% | Trend: Above MA20, MA50, MA200
Recent headlines (last 12h)
- Air Products Will Not Proceed with Louisiana Clean Energy (LCEC) Project; Company Will Record Pre-Tax Charge in Fiscal Third Quarter; Finalizing Agreement with Yara for Renewable Ammonia from NEOM Green Hydrogen Project in Saudi Arabia
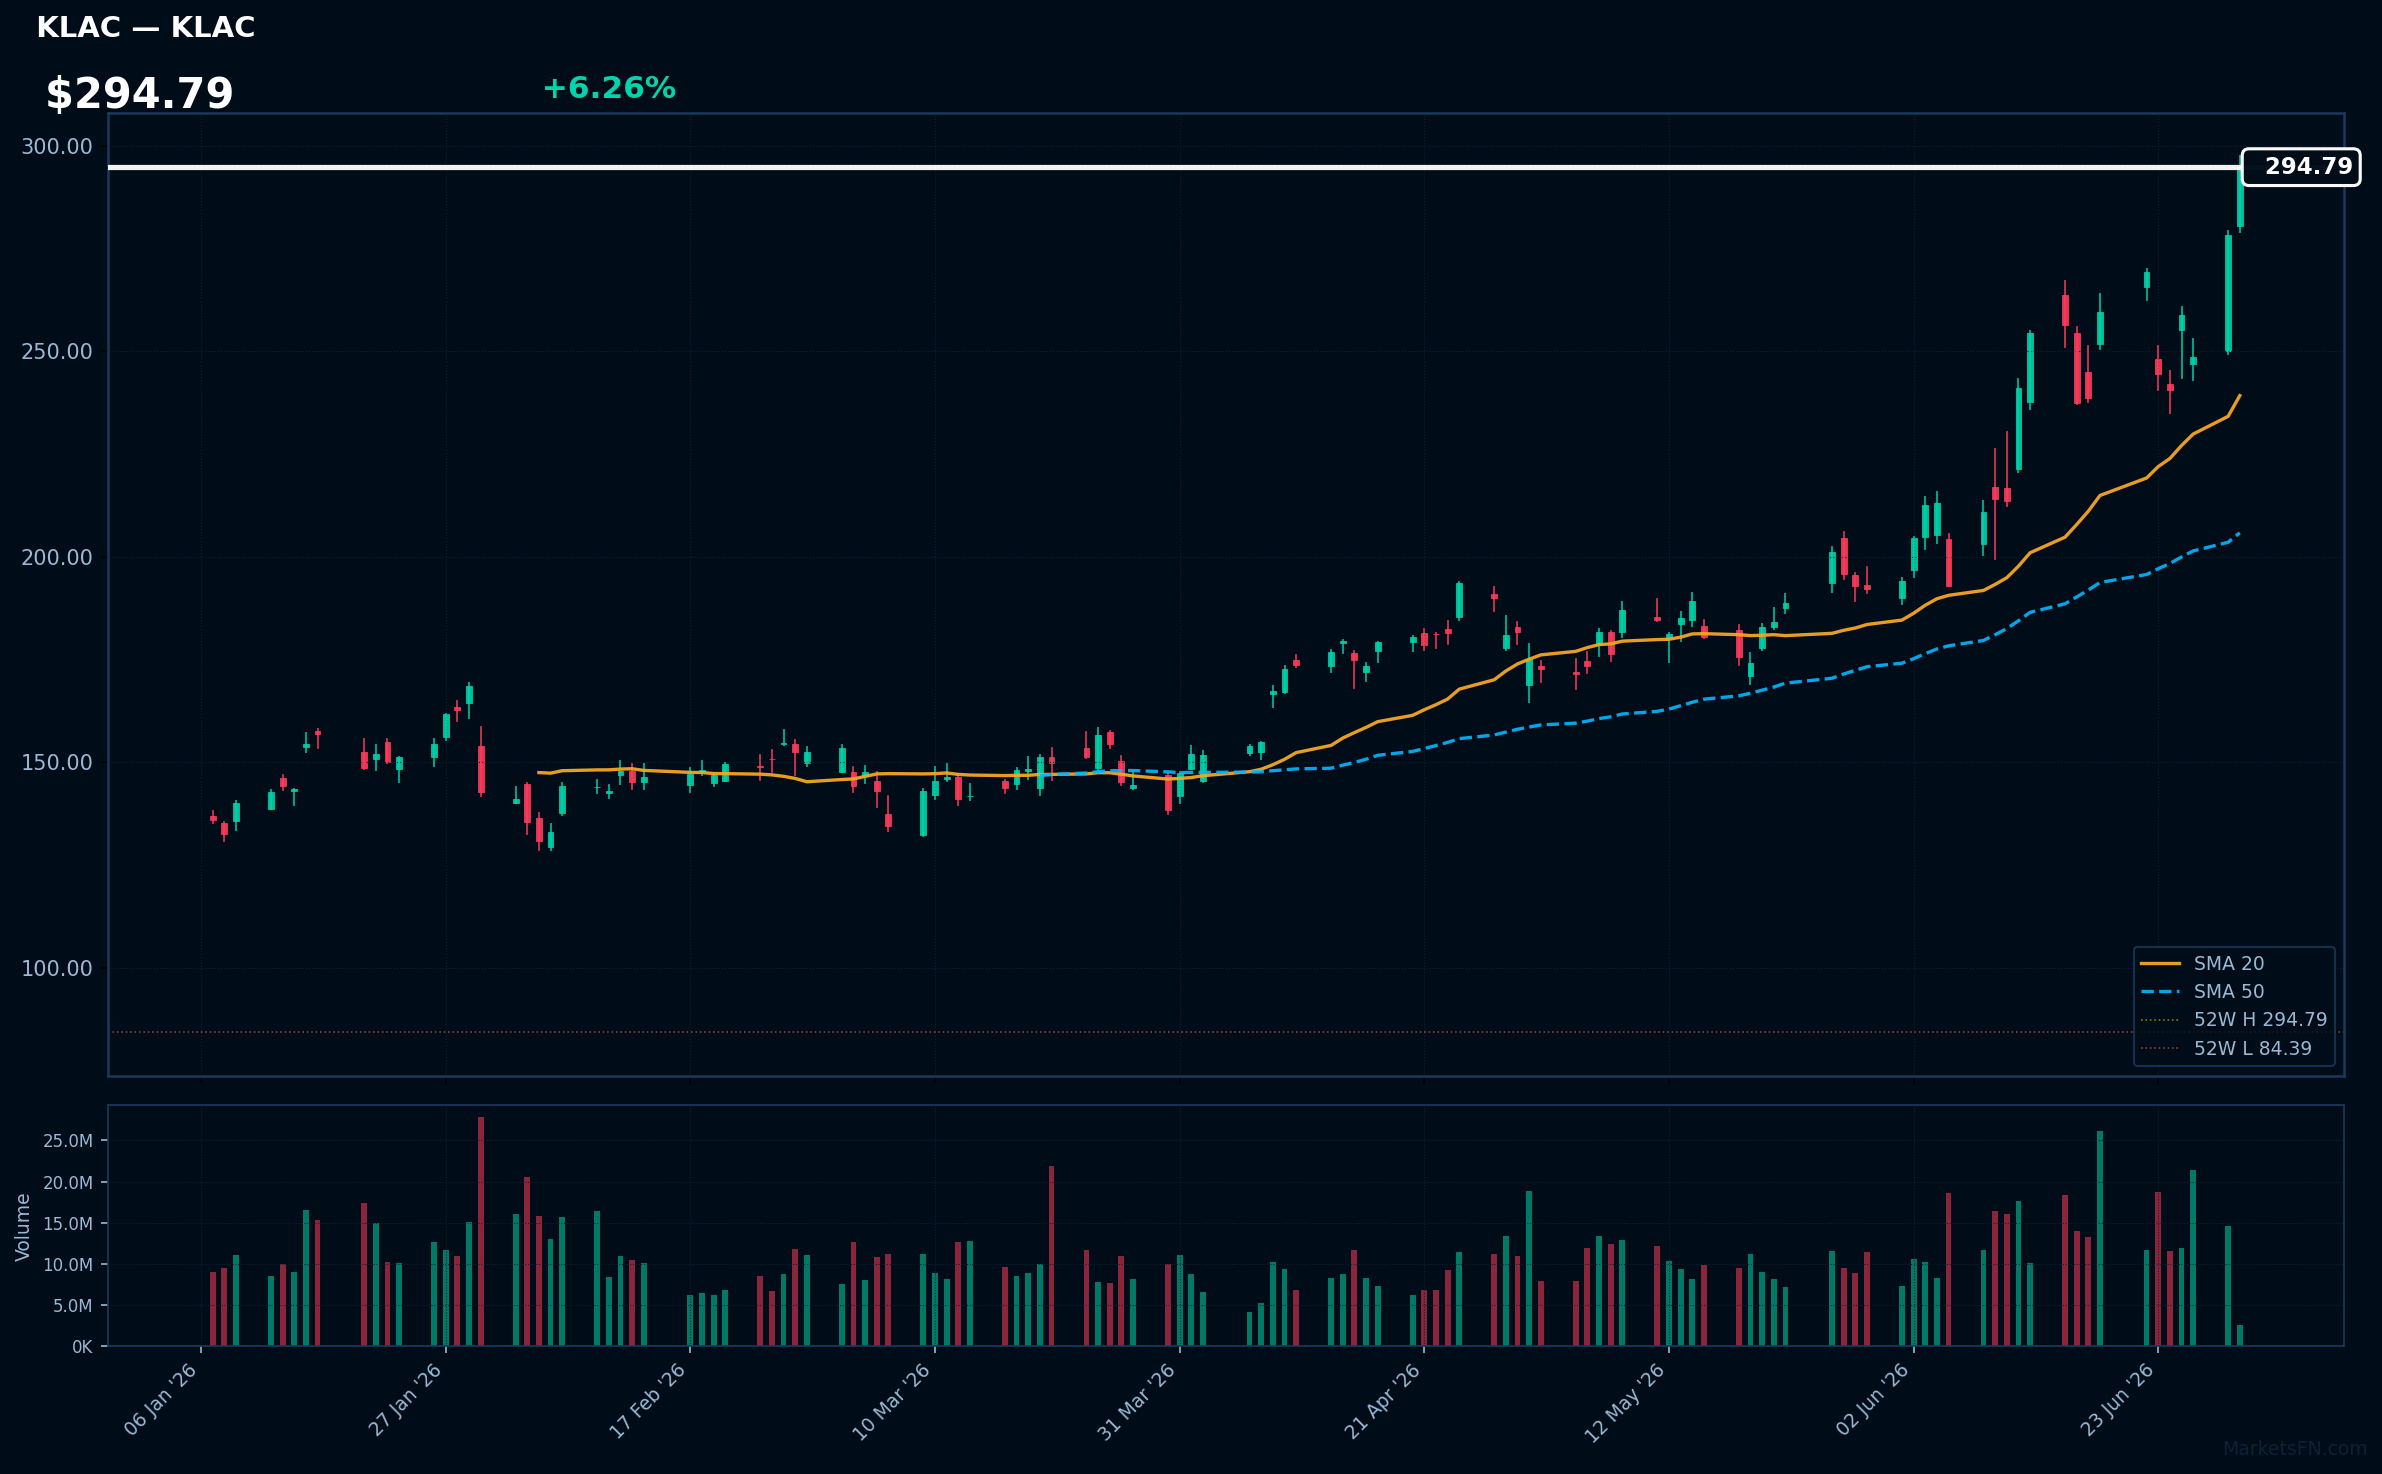
KLAC | KLA Corp | Technology | Price: $295.82 | Day: +6.26% | 1W: +20.57% | 1M: +53.40% | RSI: 69.7 | vs MA200: +96.7% | Trend: Above MA20, MA50, MA200
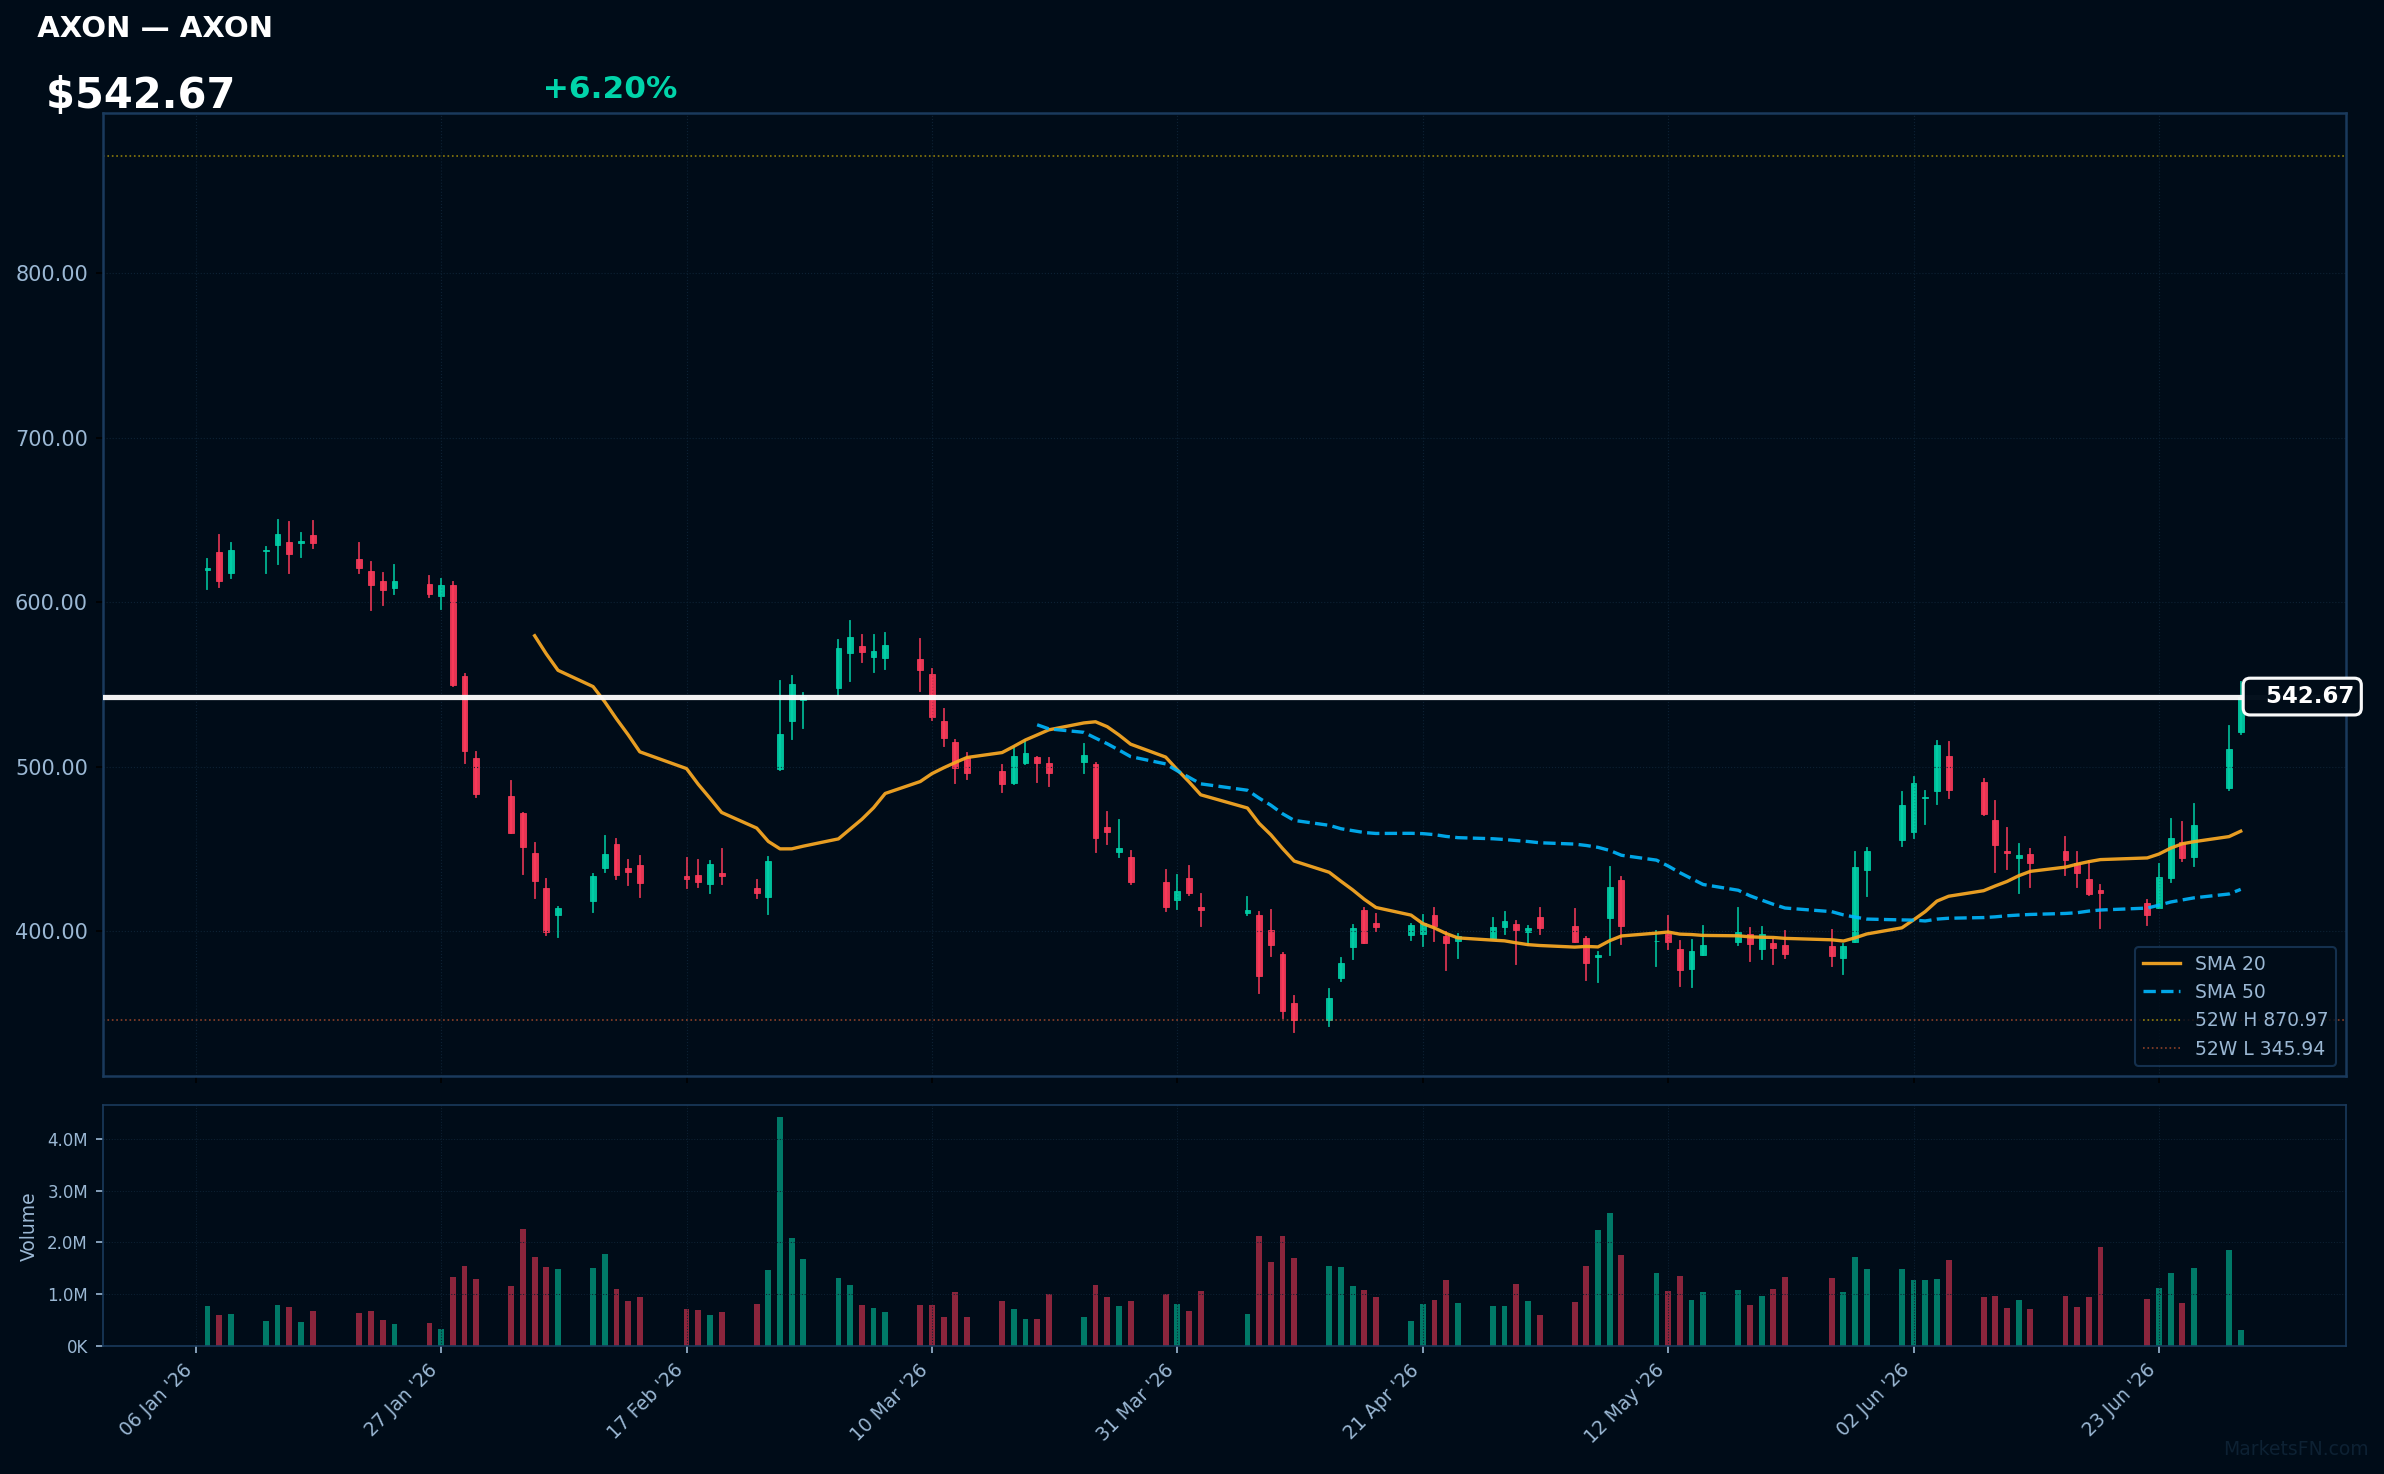
AXON | Axon Enterprise Inc | Industrials | Price: $542.27 | Day: +6.20% | 1W: +25.32% | 1M: +20.94% | RSI: 71.2 | vs MA200: +1.4% | Trend: Above MA20, MA50, MA200
Recent headlines (last 12h)
- CEO of Taser maker Axon: We are moving closer to making bullets extinct
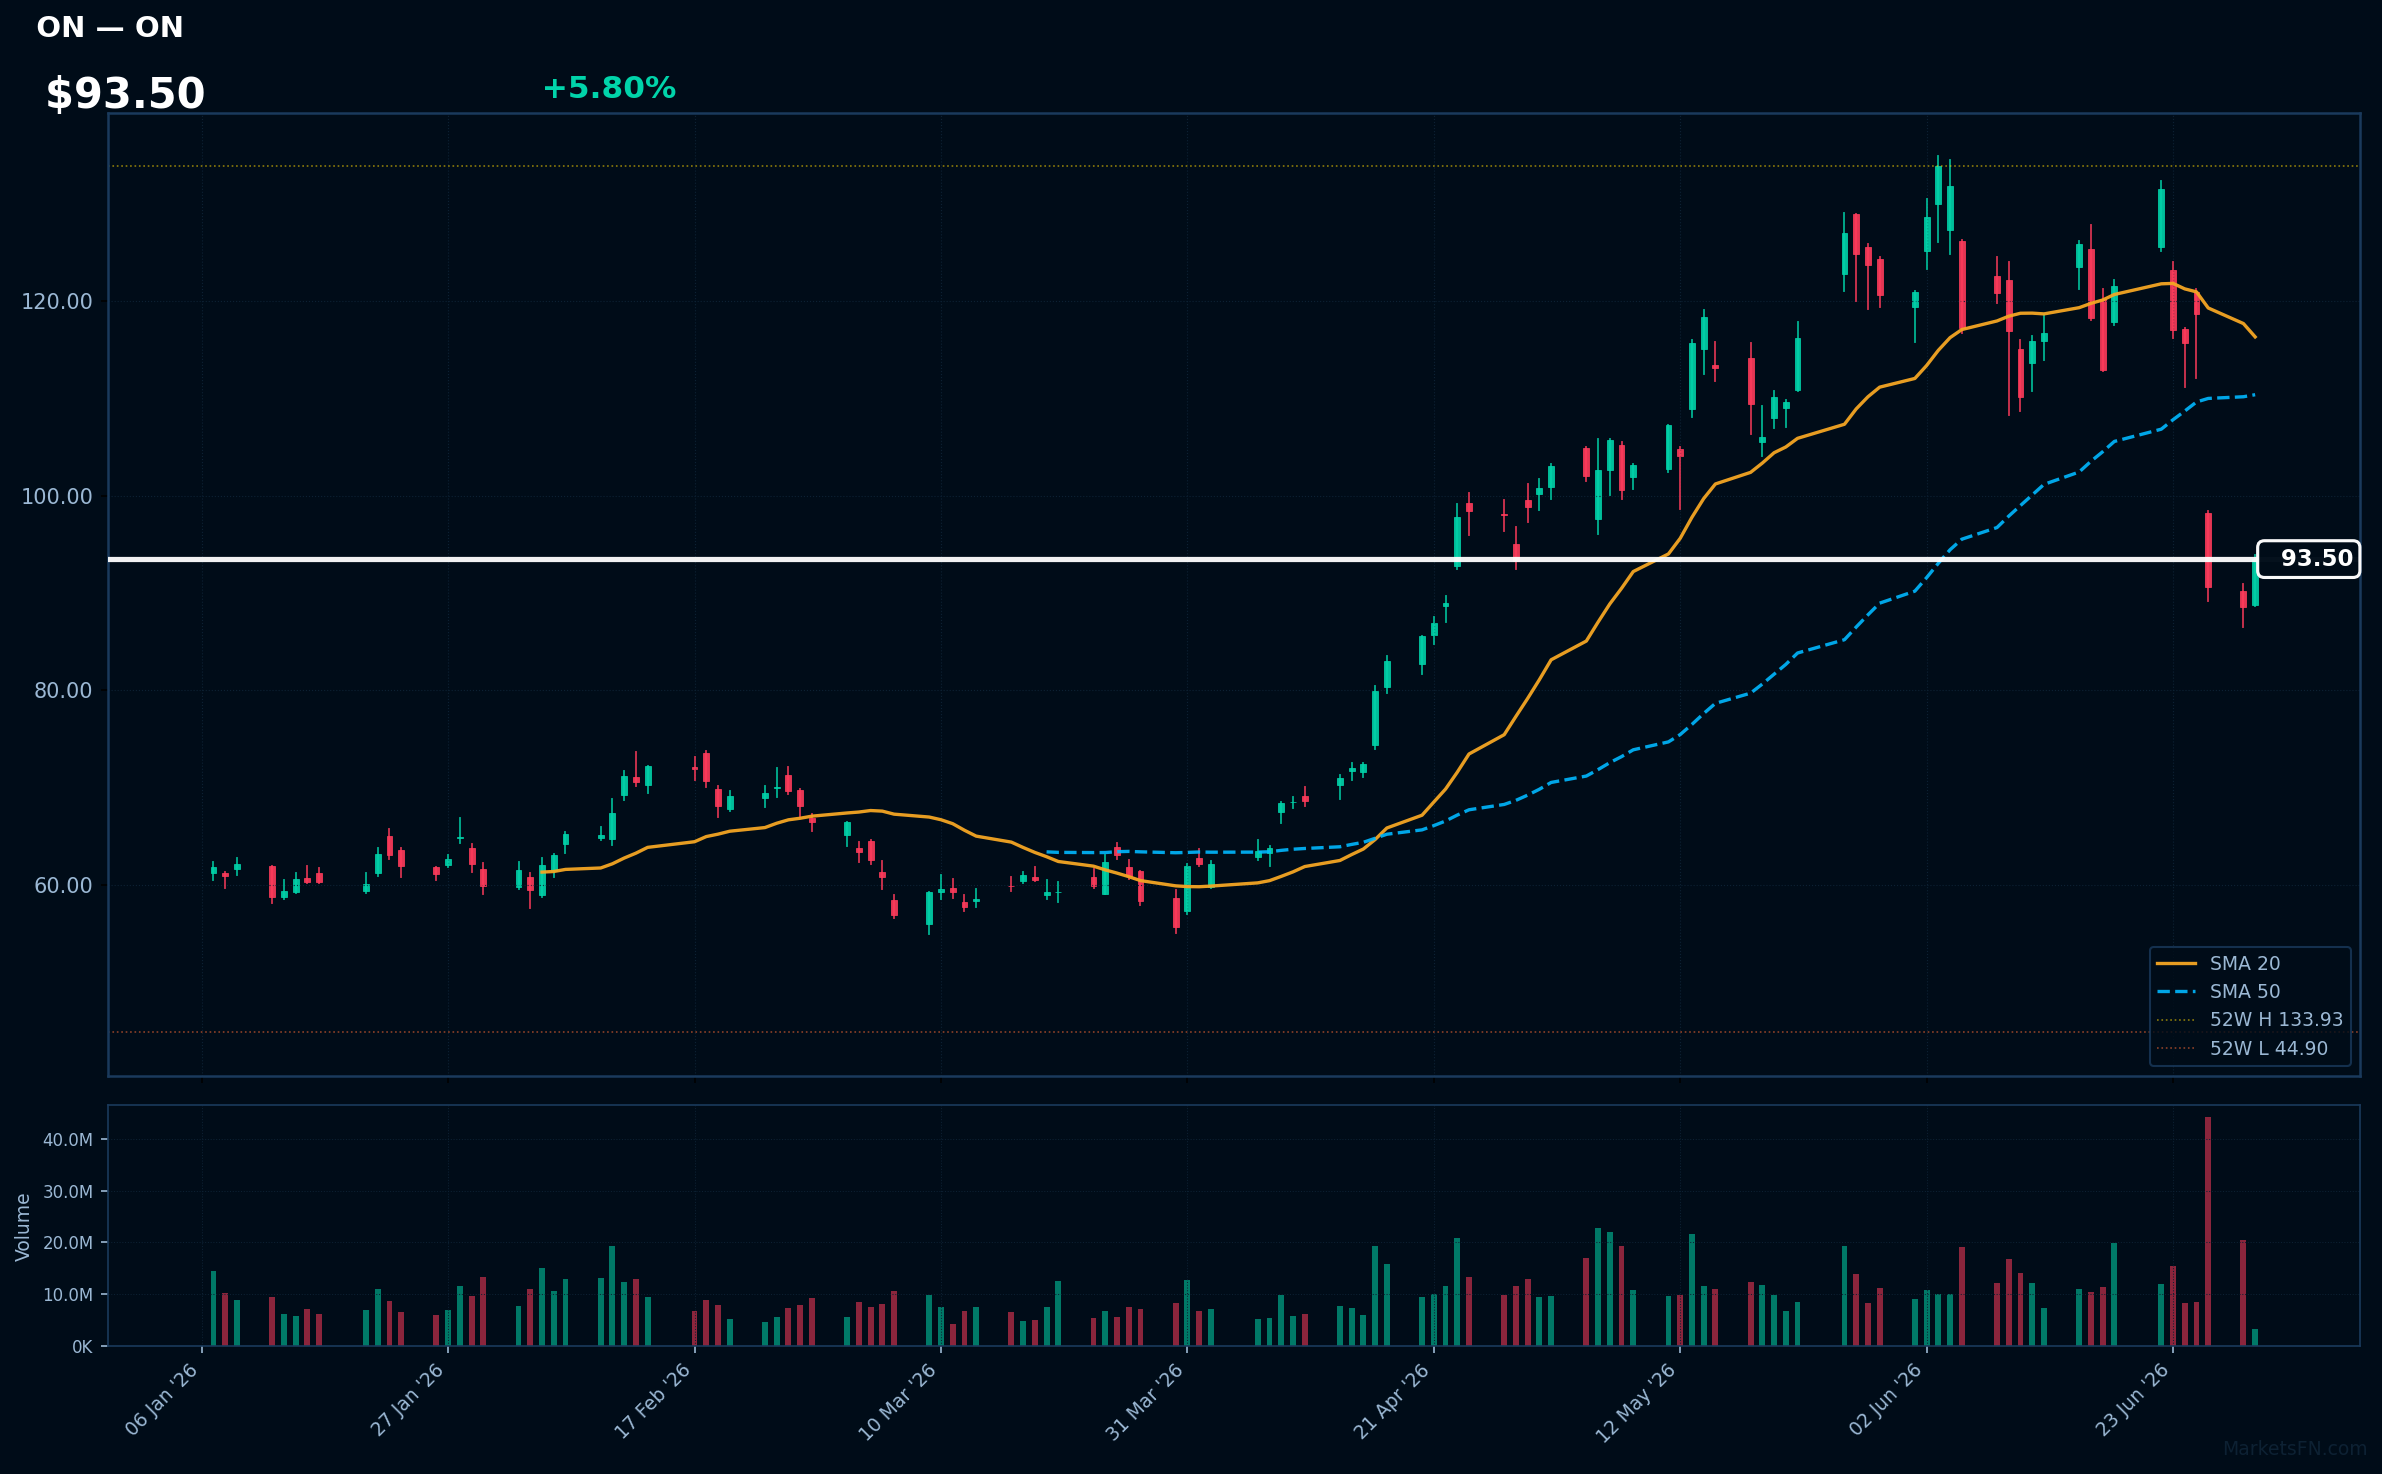
ON | ON Semiconductor Corp | Technology | Price: $93.71 | Day: +5.80% | 1W: -20.13% | 1M: -22.48% | RSI: 39.8 | vs MA200: +32.8% | Trend: Above MA200 · Below MA20, MA50
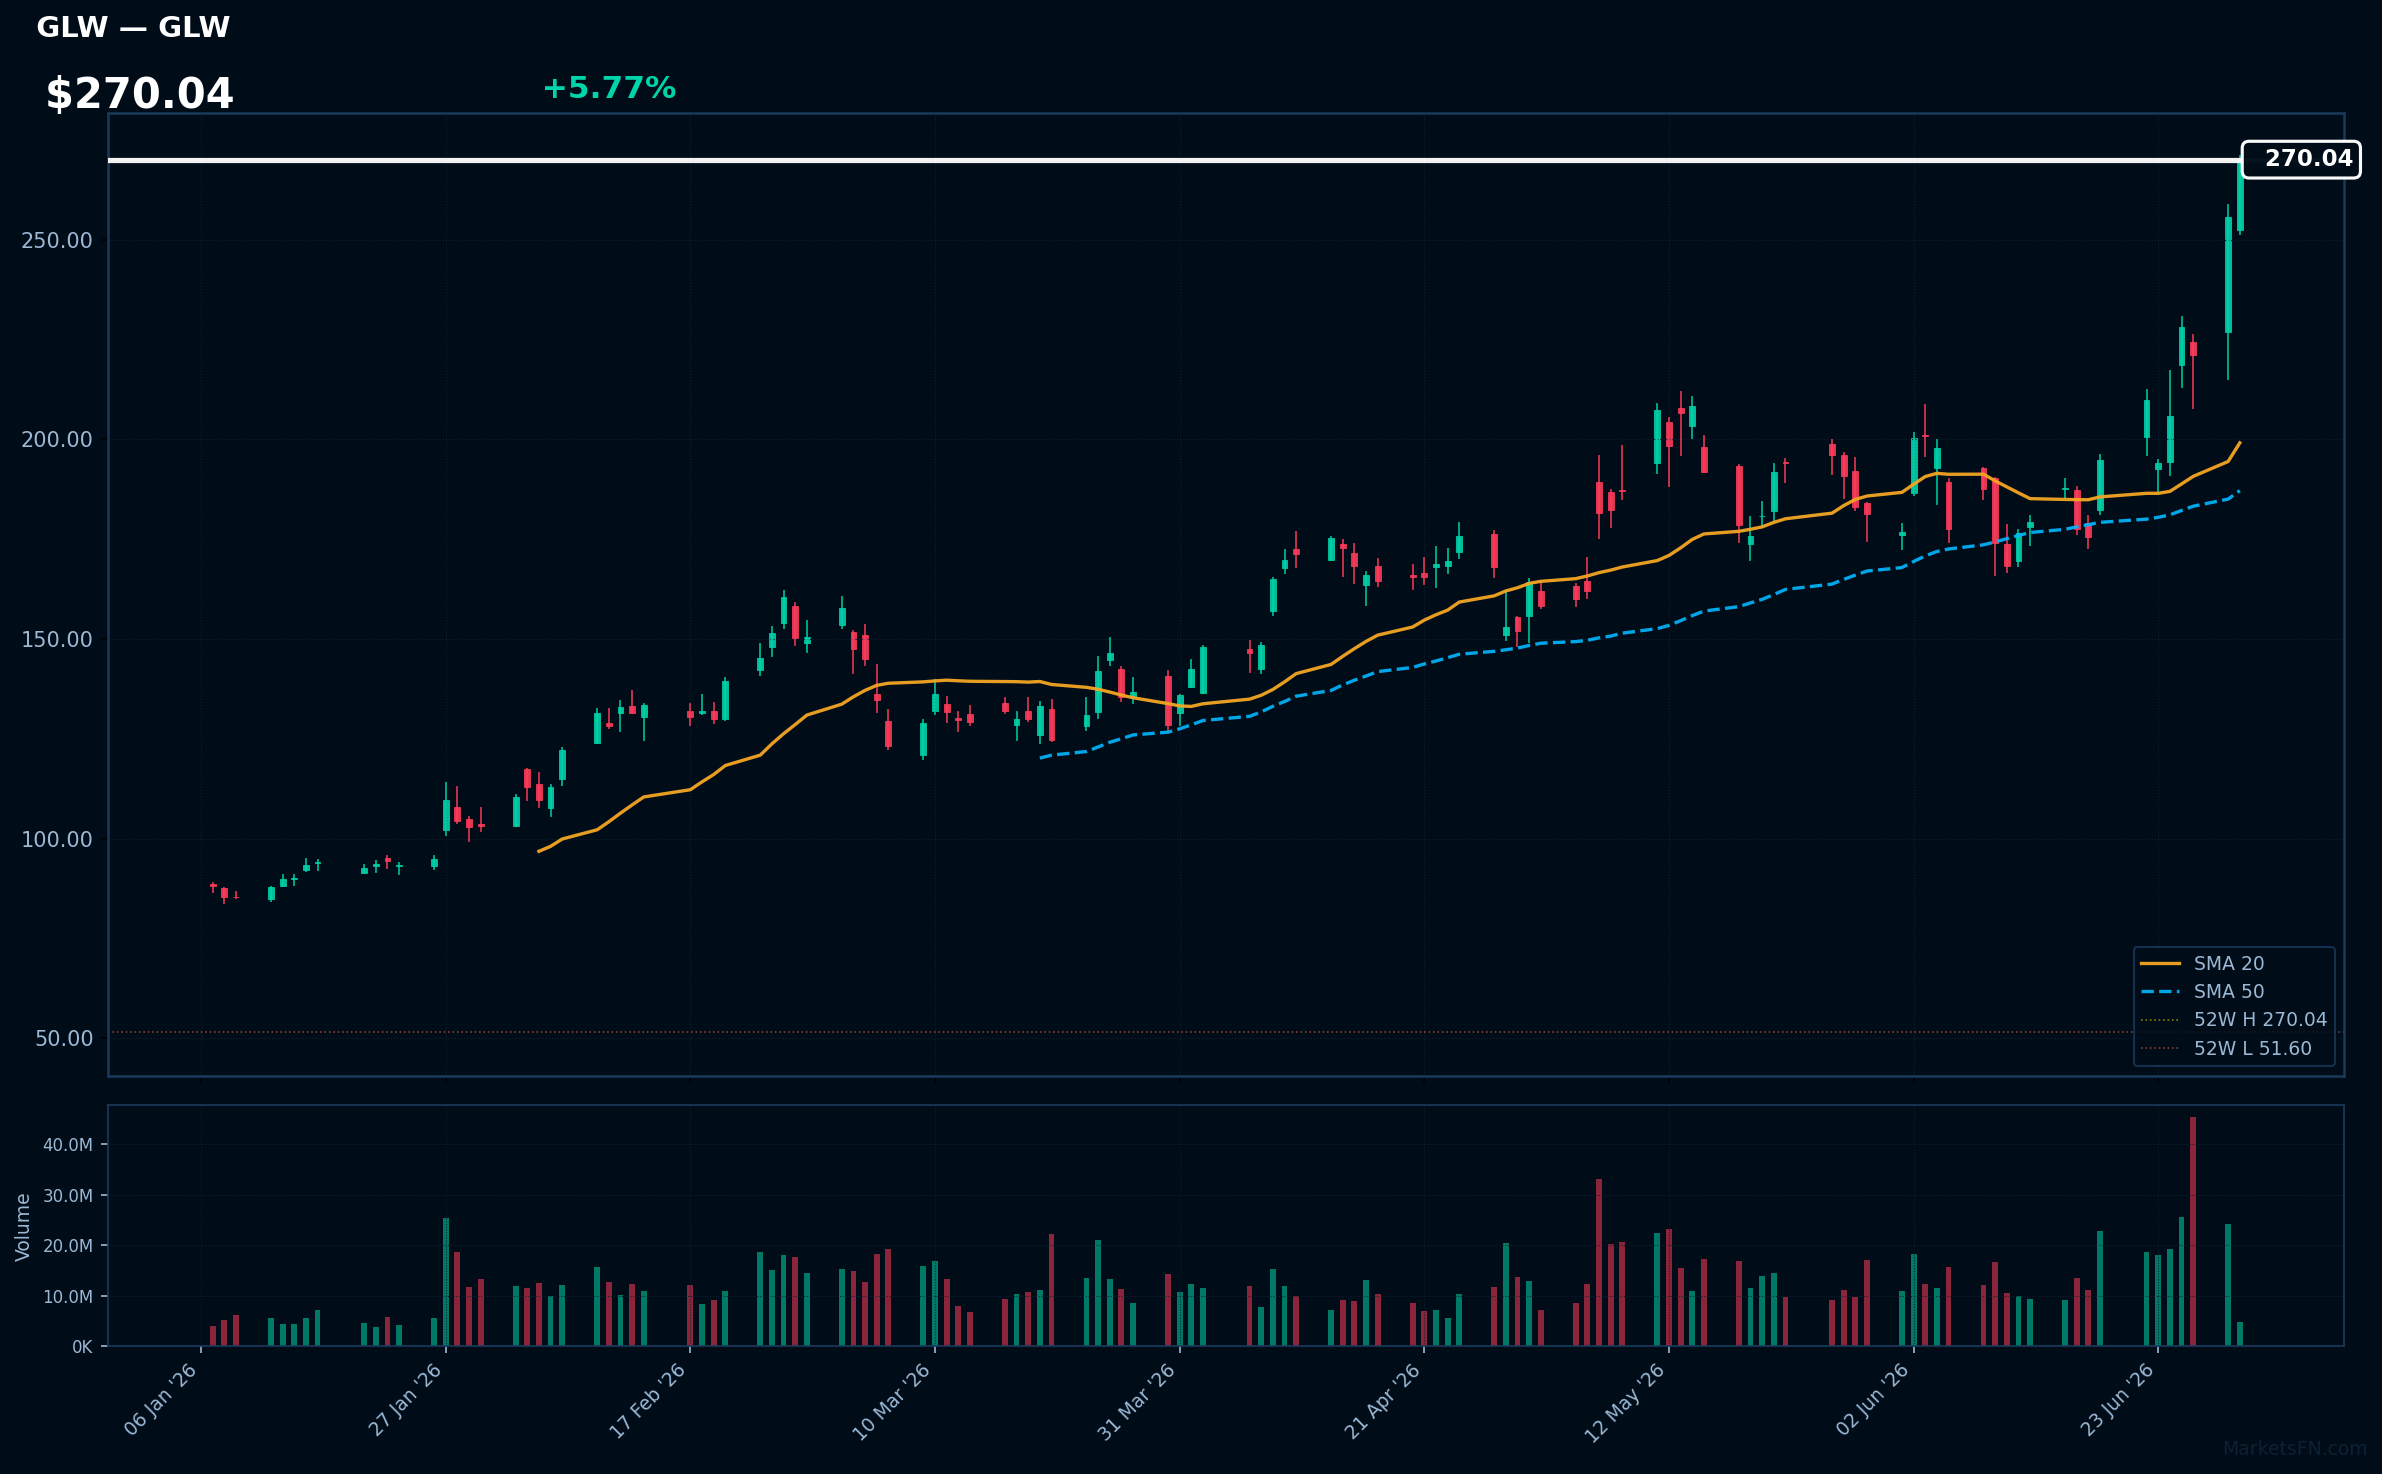
GLW | Corning, Inc | Technology | Price: $270.45 | Day: +5.77% | 1W: +39.14% | 1M: +49.06% | RSI: 71.8 | vs MA200: +114.7% | Trend: Above MA20, MA50, MA200
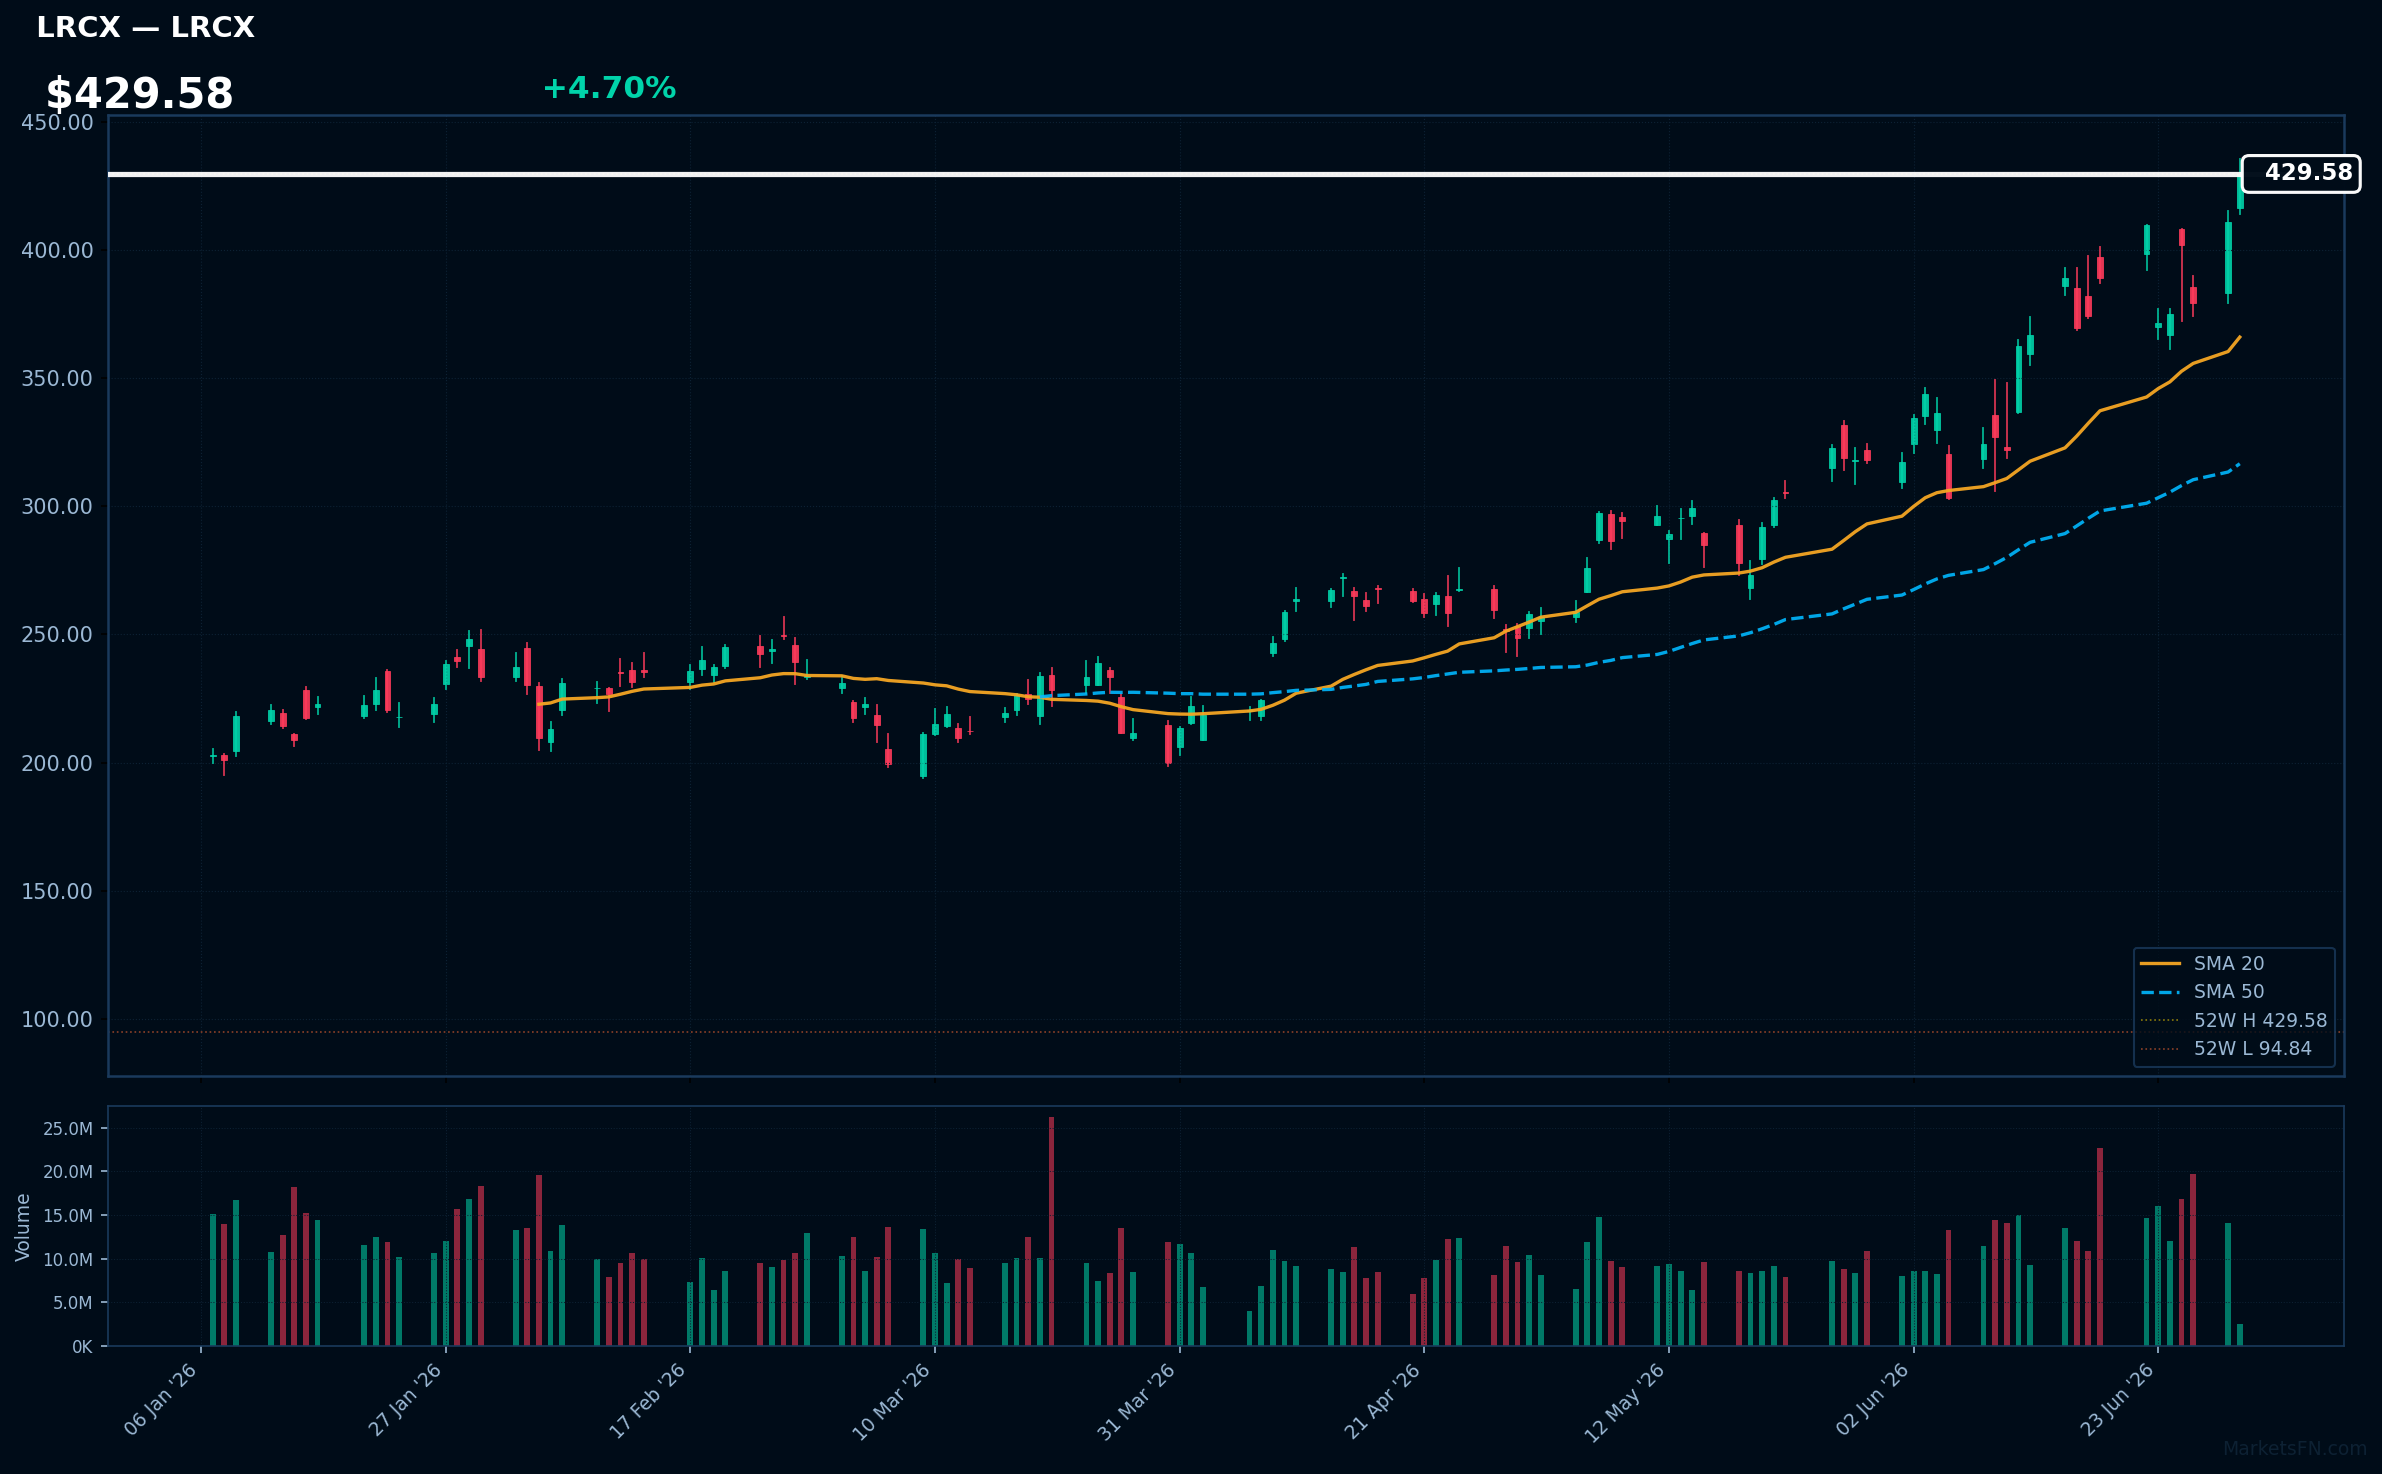
LRCX | Lam Research Corp | Technology | Price: $430.21 | Day: +4.70% | 1W: +15.69% | 1M: +35.01% | RSI: 66.6 | vs MA200: +95.3% | Trend: Above MA20, MA50, MA200
Recent headlines (last 12h)
- FTSE 100 Live: London blue-chips hit 10-week high as Sainsbury's and miners climb
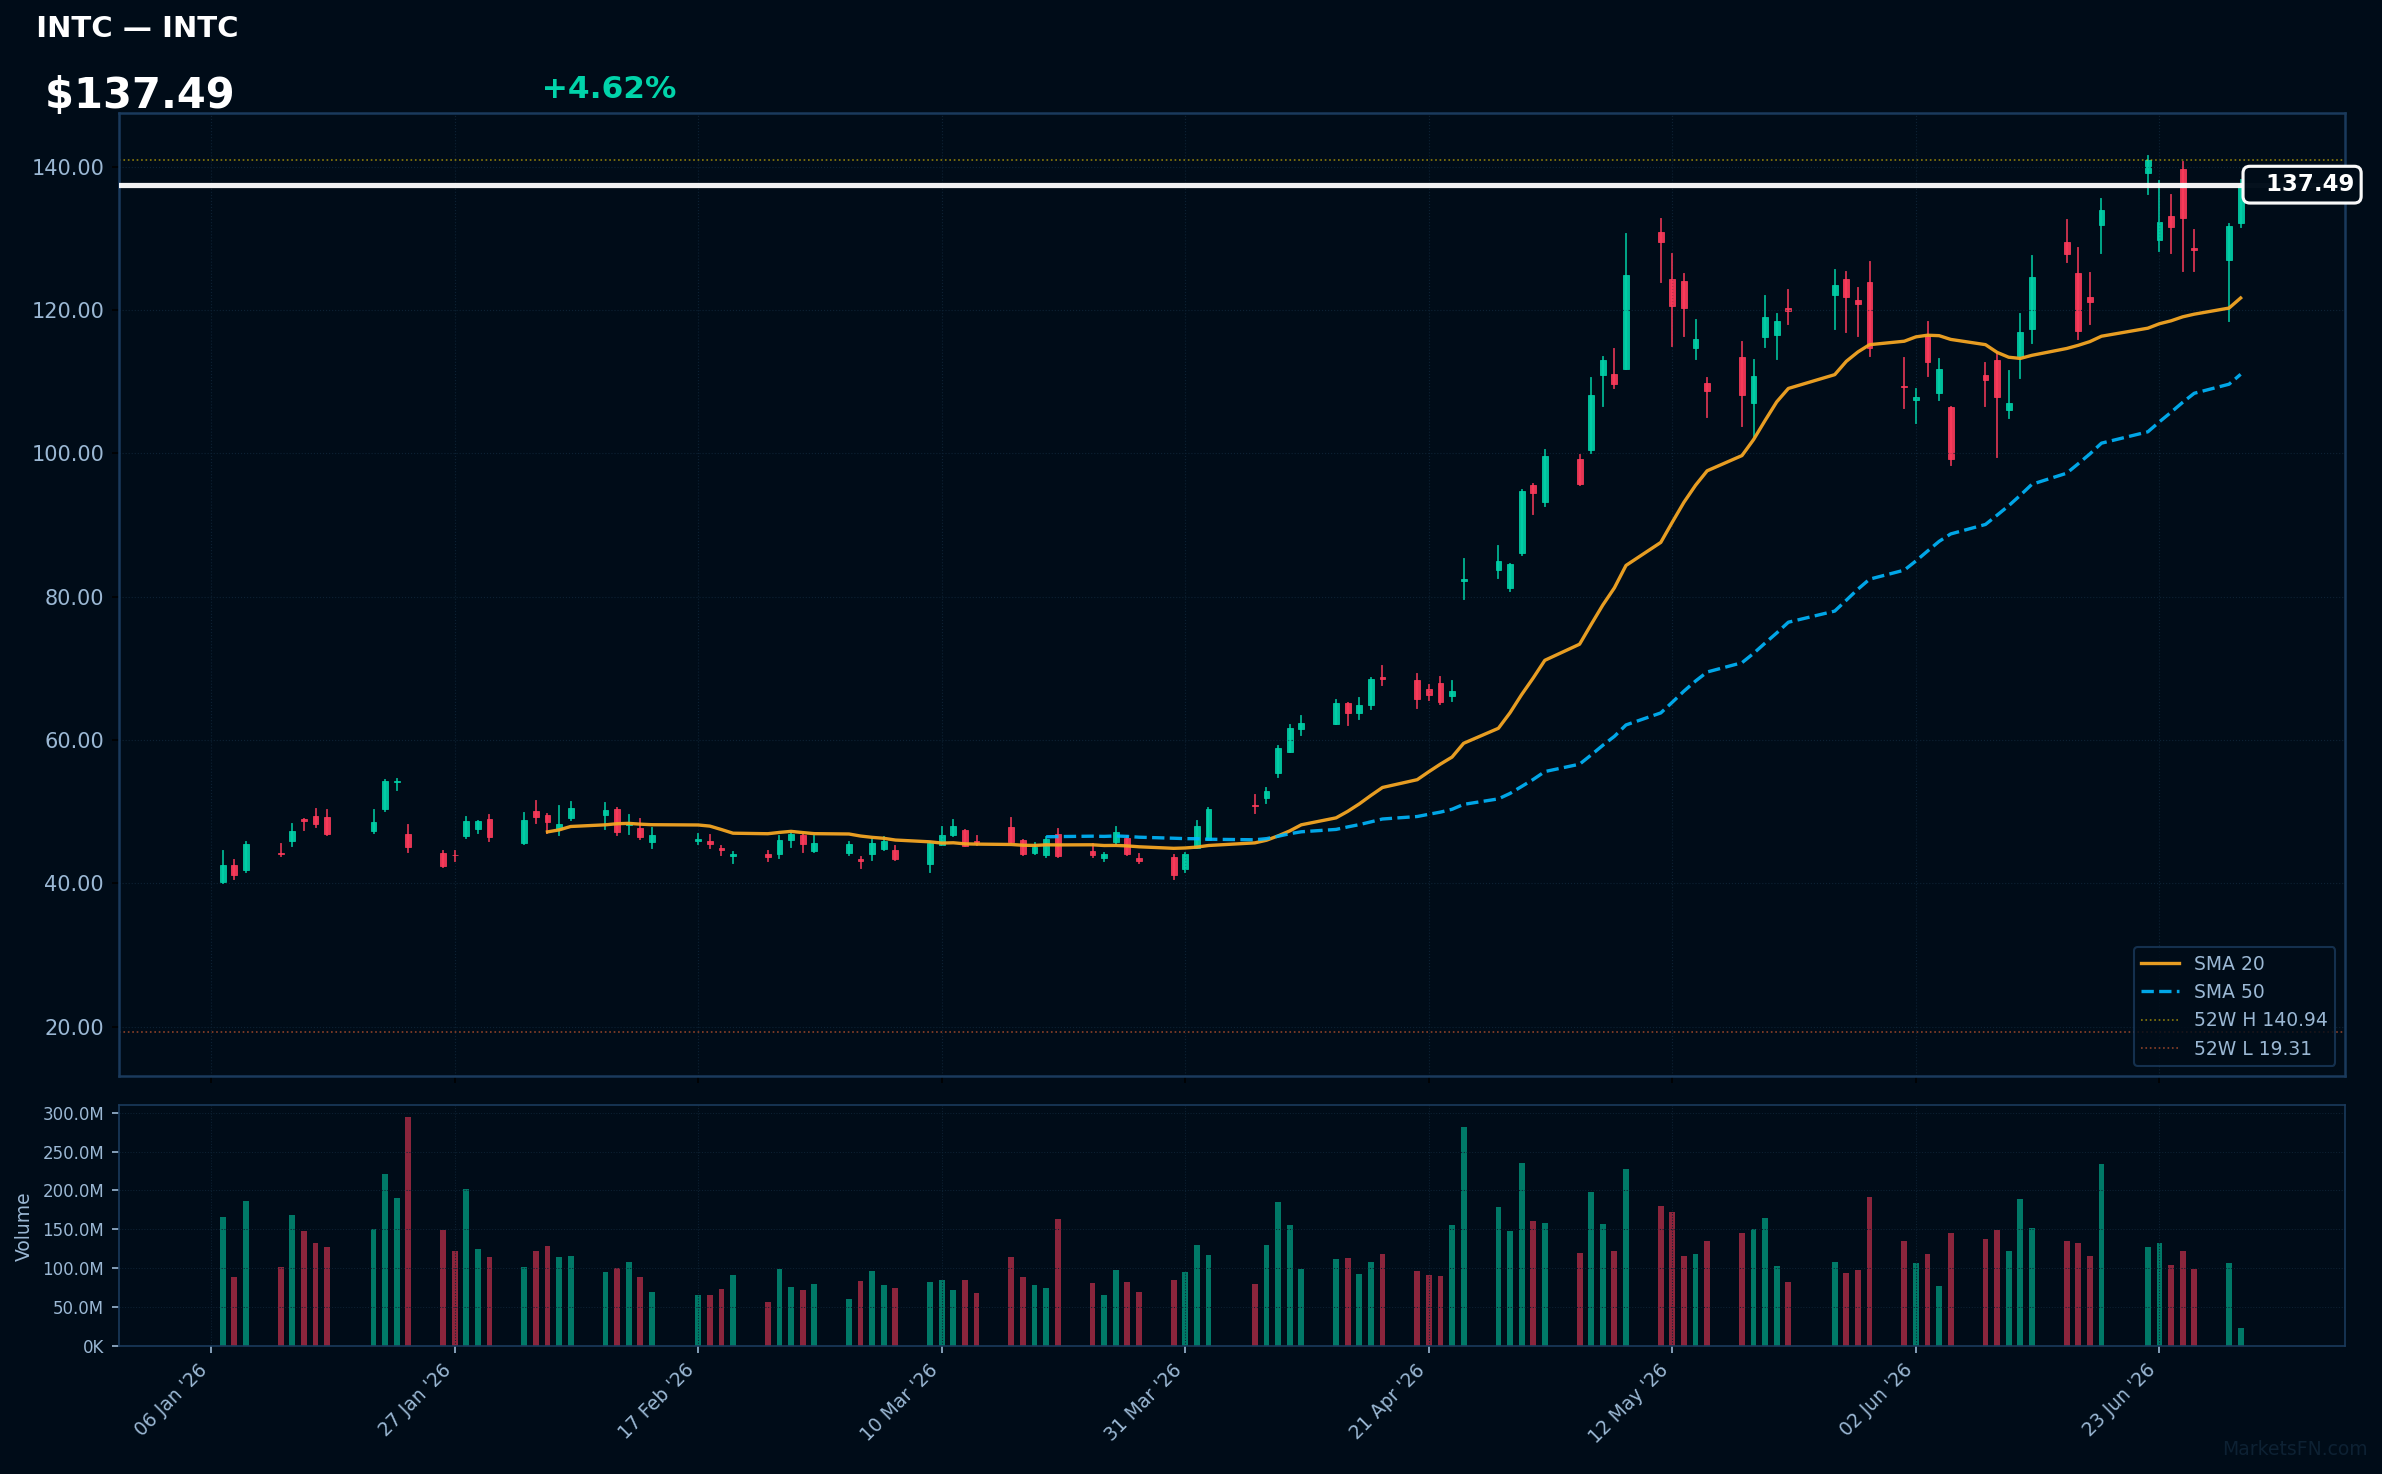
INTC | Intel Corp | Technology | Price: $137.80 | Day: +4.62% | 1W: +3.94% | 1M: +19.89% | RSI: 62.1 | vs MA200: +132.3% | Trend: Above MA20, MA50, MA200
Recent headlines (last 12h)
- Tech stocks on pace for best 6 months since 2023 even with much of the 'Magnificent 7' in the 'penalty box': Chart of the Day
- Chip Stocks Best Quarter Ever Is Ending With Some Wild Swings
- NVDA Stock Eyes Worst First Half Since 2022: Retail Patience Wears Thin As Board Member Trims Stake For Third Time This Year
- FTSE 100 Live: London blue-chips hit 10-week high as Sainsbury's and miners climb
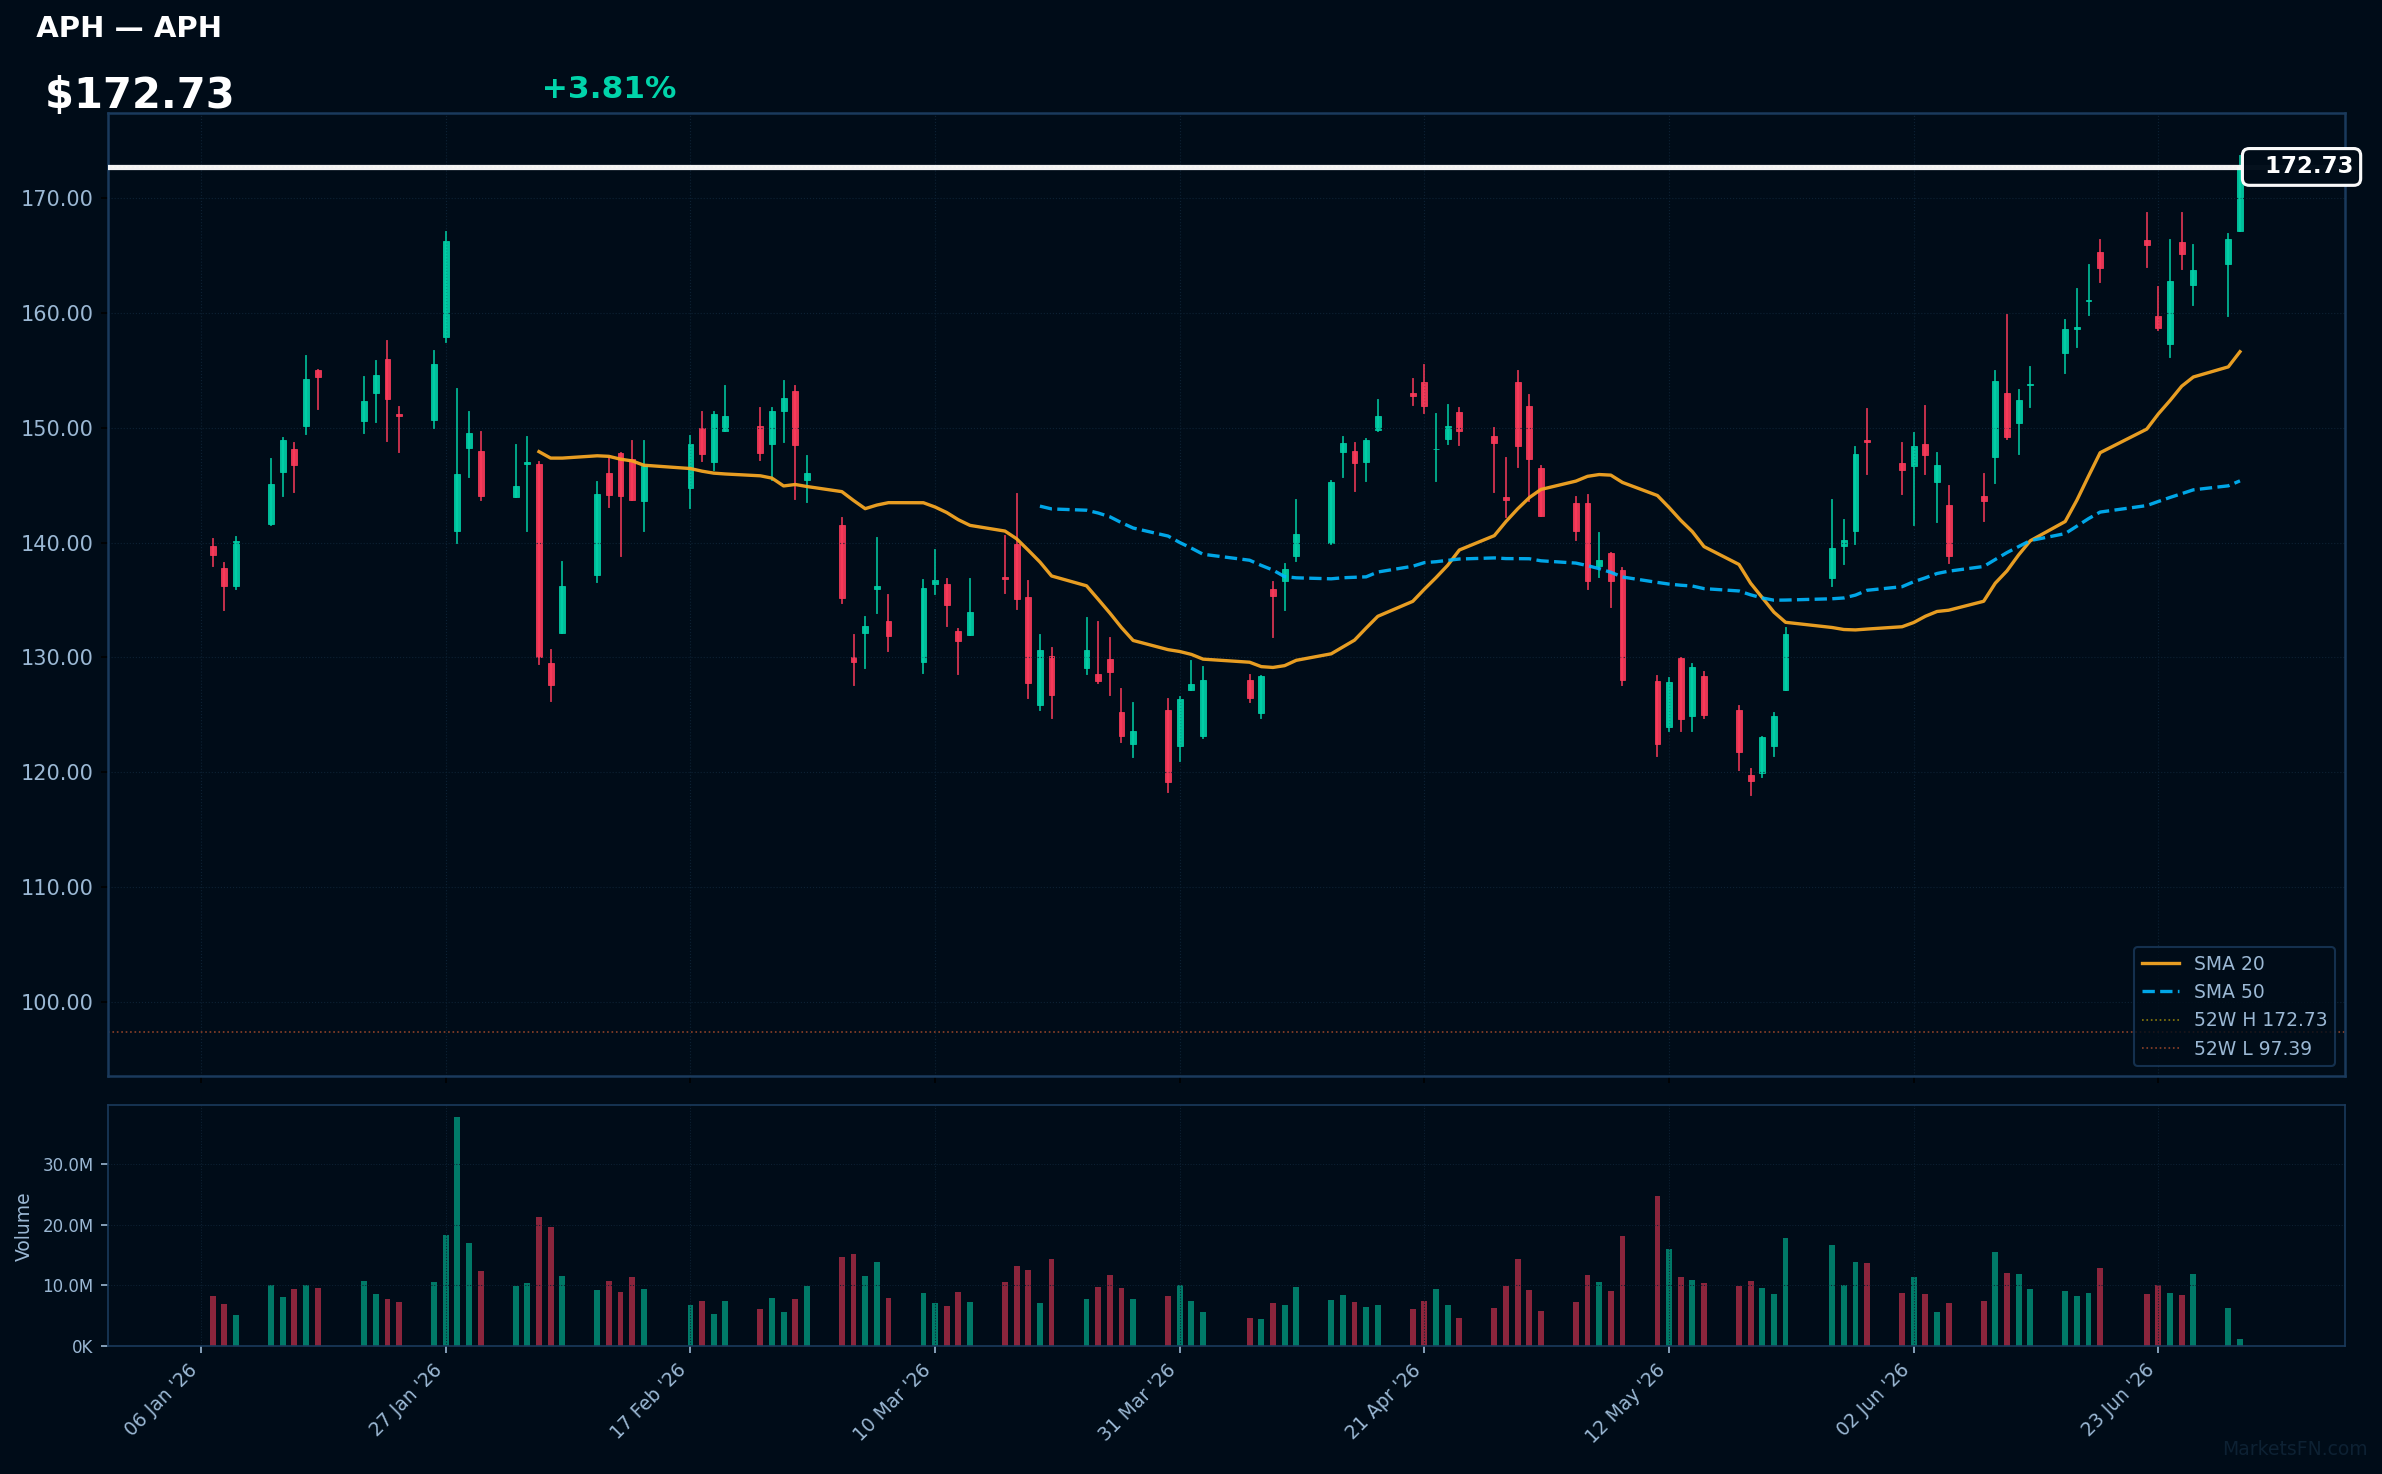
APH | Amphenol Corp | Technology | Price: $172.76 | Day: +3.81% | 1W: +8.84% | 1M: +16.11% | RSI: 69.3 | vs MA200: +24.9% | Trend: Above MA20, MA50, MA200
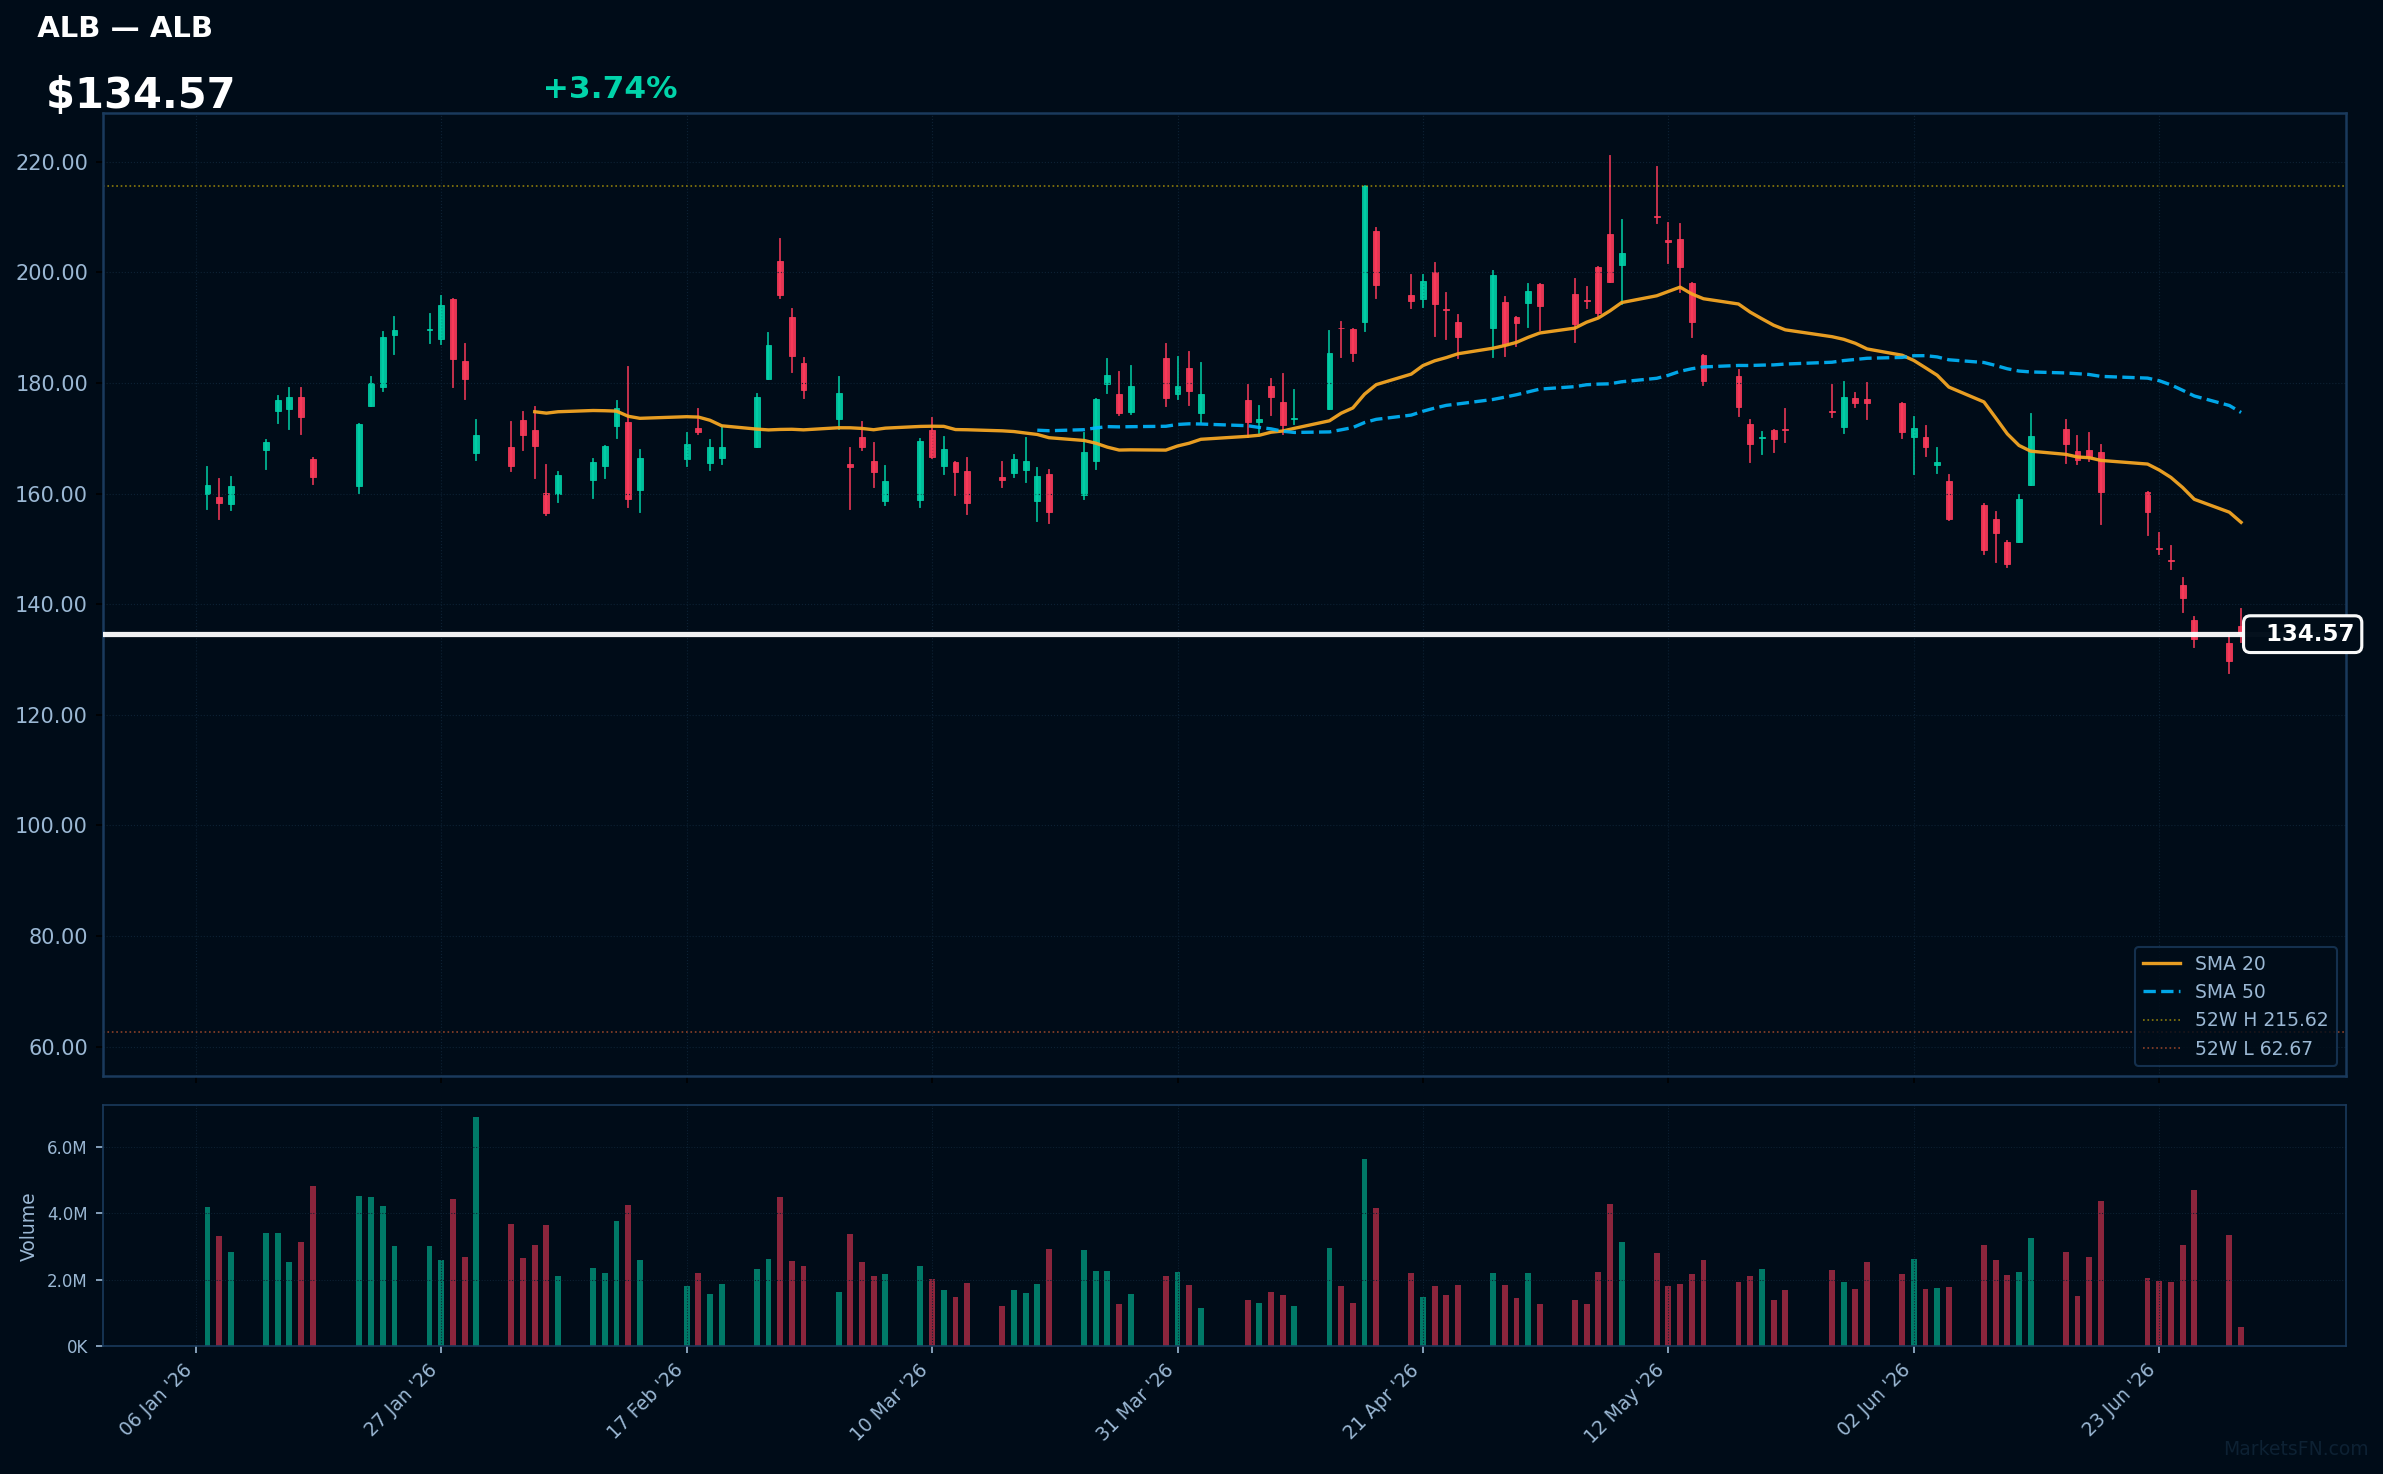
ALB | Albemarle Corp | Basic Materials | Price: $134.57 | Day: +3.74% | 1W: -10.27% | 1M: -23.72% | RSI: 31.6 | vs MA200: -9.3% | Trend: Below MA20, MA50, MA200
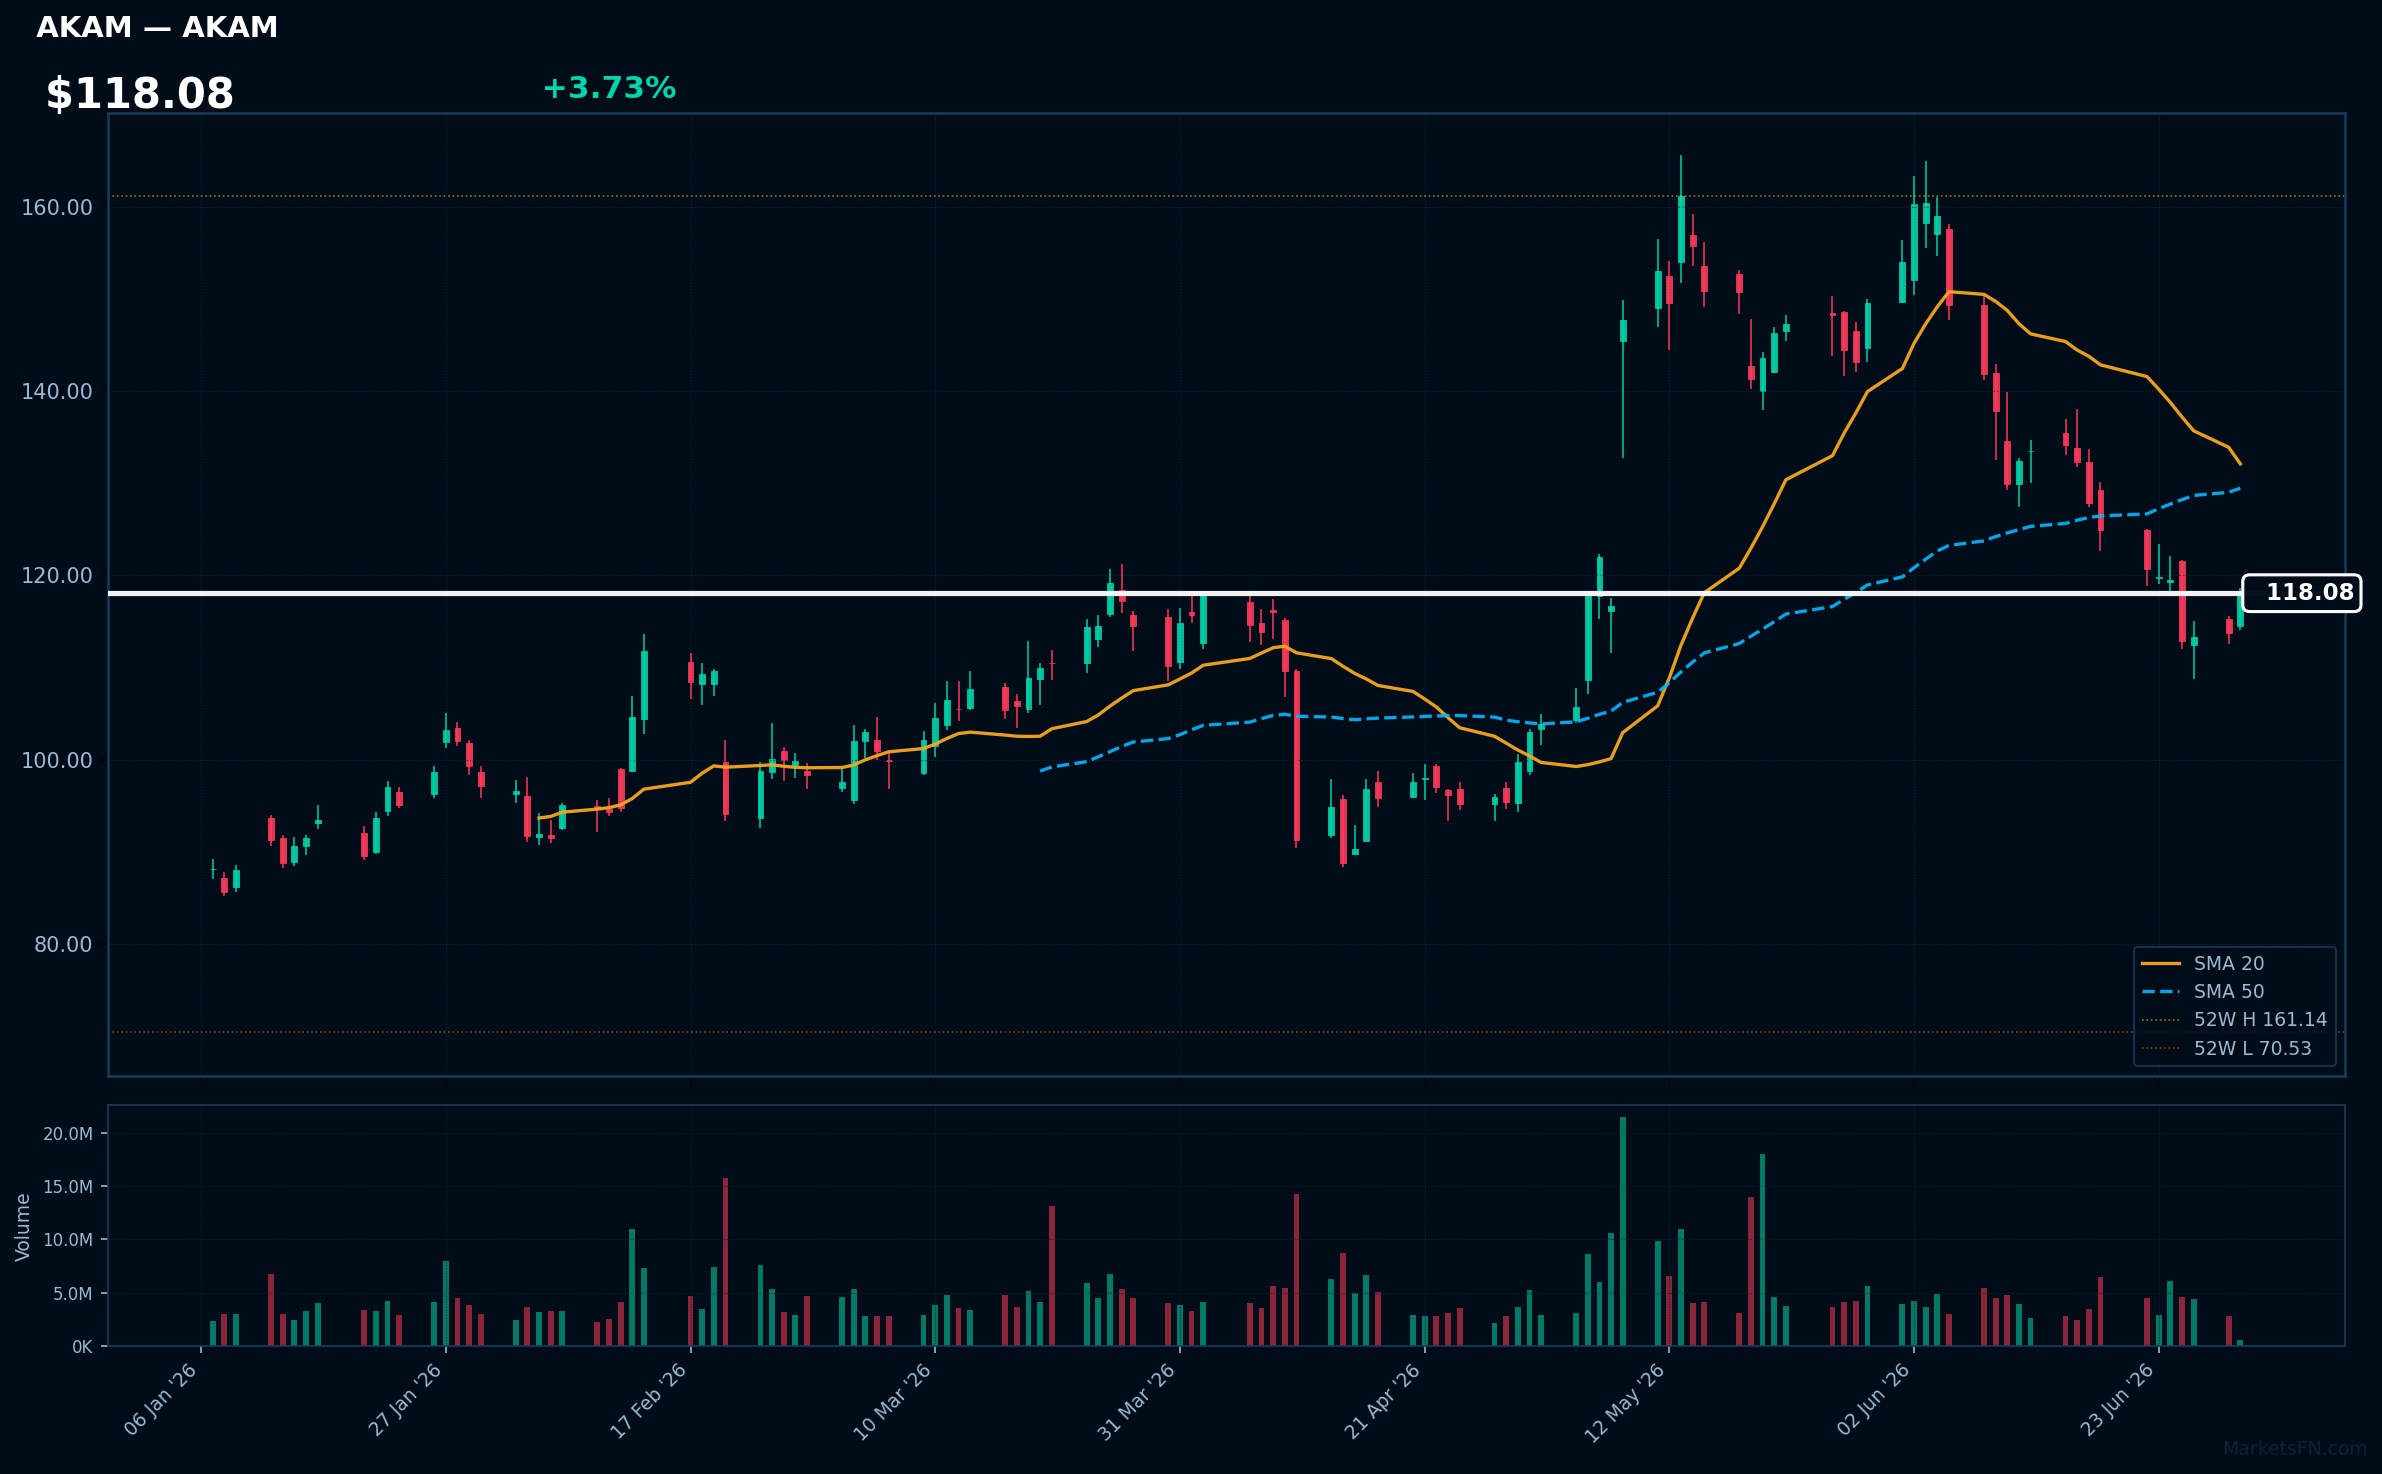
AKAM | Akamai Technologies Inc | Technology | Price: $118.05 | Day: +3.73% | 1W: -1.49% | 1M: -21.04% | RSI: 38.0 | vs MA200: +17.5% | Trend: Above MA200 · Below MA20, MA50
Top 10 Losers
Today's weakest S&P 500 performers. Sector drag: Communication Services (4), Real Estate (3), Healthcare (2), Basic Materials (1).
| Ticker | Company | Sector | Price | Day % | 1W % | 1M % | RSI | vs MA200 | Trend |
|---|---|---|---|---|---|---|---|---|---|
| TMUS | T-Mobile US Inc | Communication Services | $167.79 | -3.56% | -9.00% | -10.43% | 30.5 | -18.0% | Below MA20, MA50, MA200 |
| EQIX | Equinix Inc | Real Estate | $1046.44 | -3.57% | -6.23% | -2.02% | 40.4 | +15.6% | Above MA200 · Below MA20, MA50 |
| T | AT&T, Inc | Communication Services | $21.01 | -3.71% | -7.96% | -15.34% | 29.8 | -18.6% | Below MA20, MA50, MA200 |
| MOS | Mosaic Company | Basic Materials | $21.59 | -3.77% | +1.60% | -9.67% | 46.0 | -18.2% | Below MA20, MA50, MA200 |
| CHTR | Charter Communications Inc | Communication Services | $140.00 | -4.22% | +6.33% | -2.75% | 49.2 | -32.4% | Above MA20 · Below MA50, MA200 |
| SYK | Stryker Corp | Healthcare | $316.00 | -4.39% | +1.95% | +3.59% | 52.4 | -9.2% | Above MA20, MA50 · Below MA200 |
| HST | Host Hotels & Resorts Inc | Real Estate | $23.69 | -4.94% | -4.51% | +3.13% | 46.2 | +22.1% | Above MA50, MA200 · Below MA20 |
| DLR | Digital Realty Trust Inc | Real Estate | $181.01 | -5.02% | -7.15% | -4.71% | 39.3 | +3.3% | Above MA200 · Below MA20, MA50 |
| TTD | Trade Desk Inc | Communication Services | $17.70 | -5.07% | -1.14% | -17.79% | 38.3 | -45.7% | Below MA20, MA50, MA200 |
| ZBH | Zimmer Biomet Holdings Inc | Healthcare | $85.18 | -6.64% | -2.75% | +3.44% | 43.8 | -7.4% | Below MA20, MA50, MA200 |
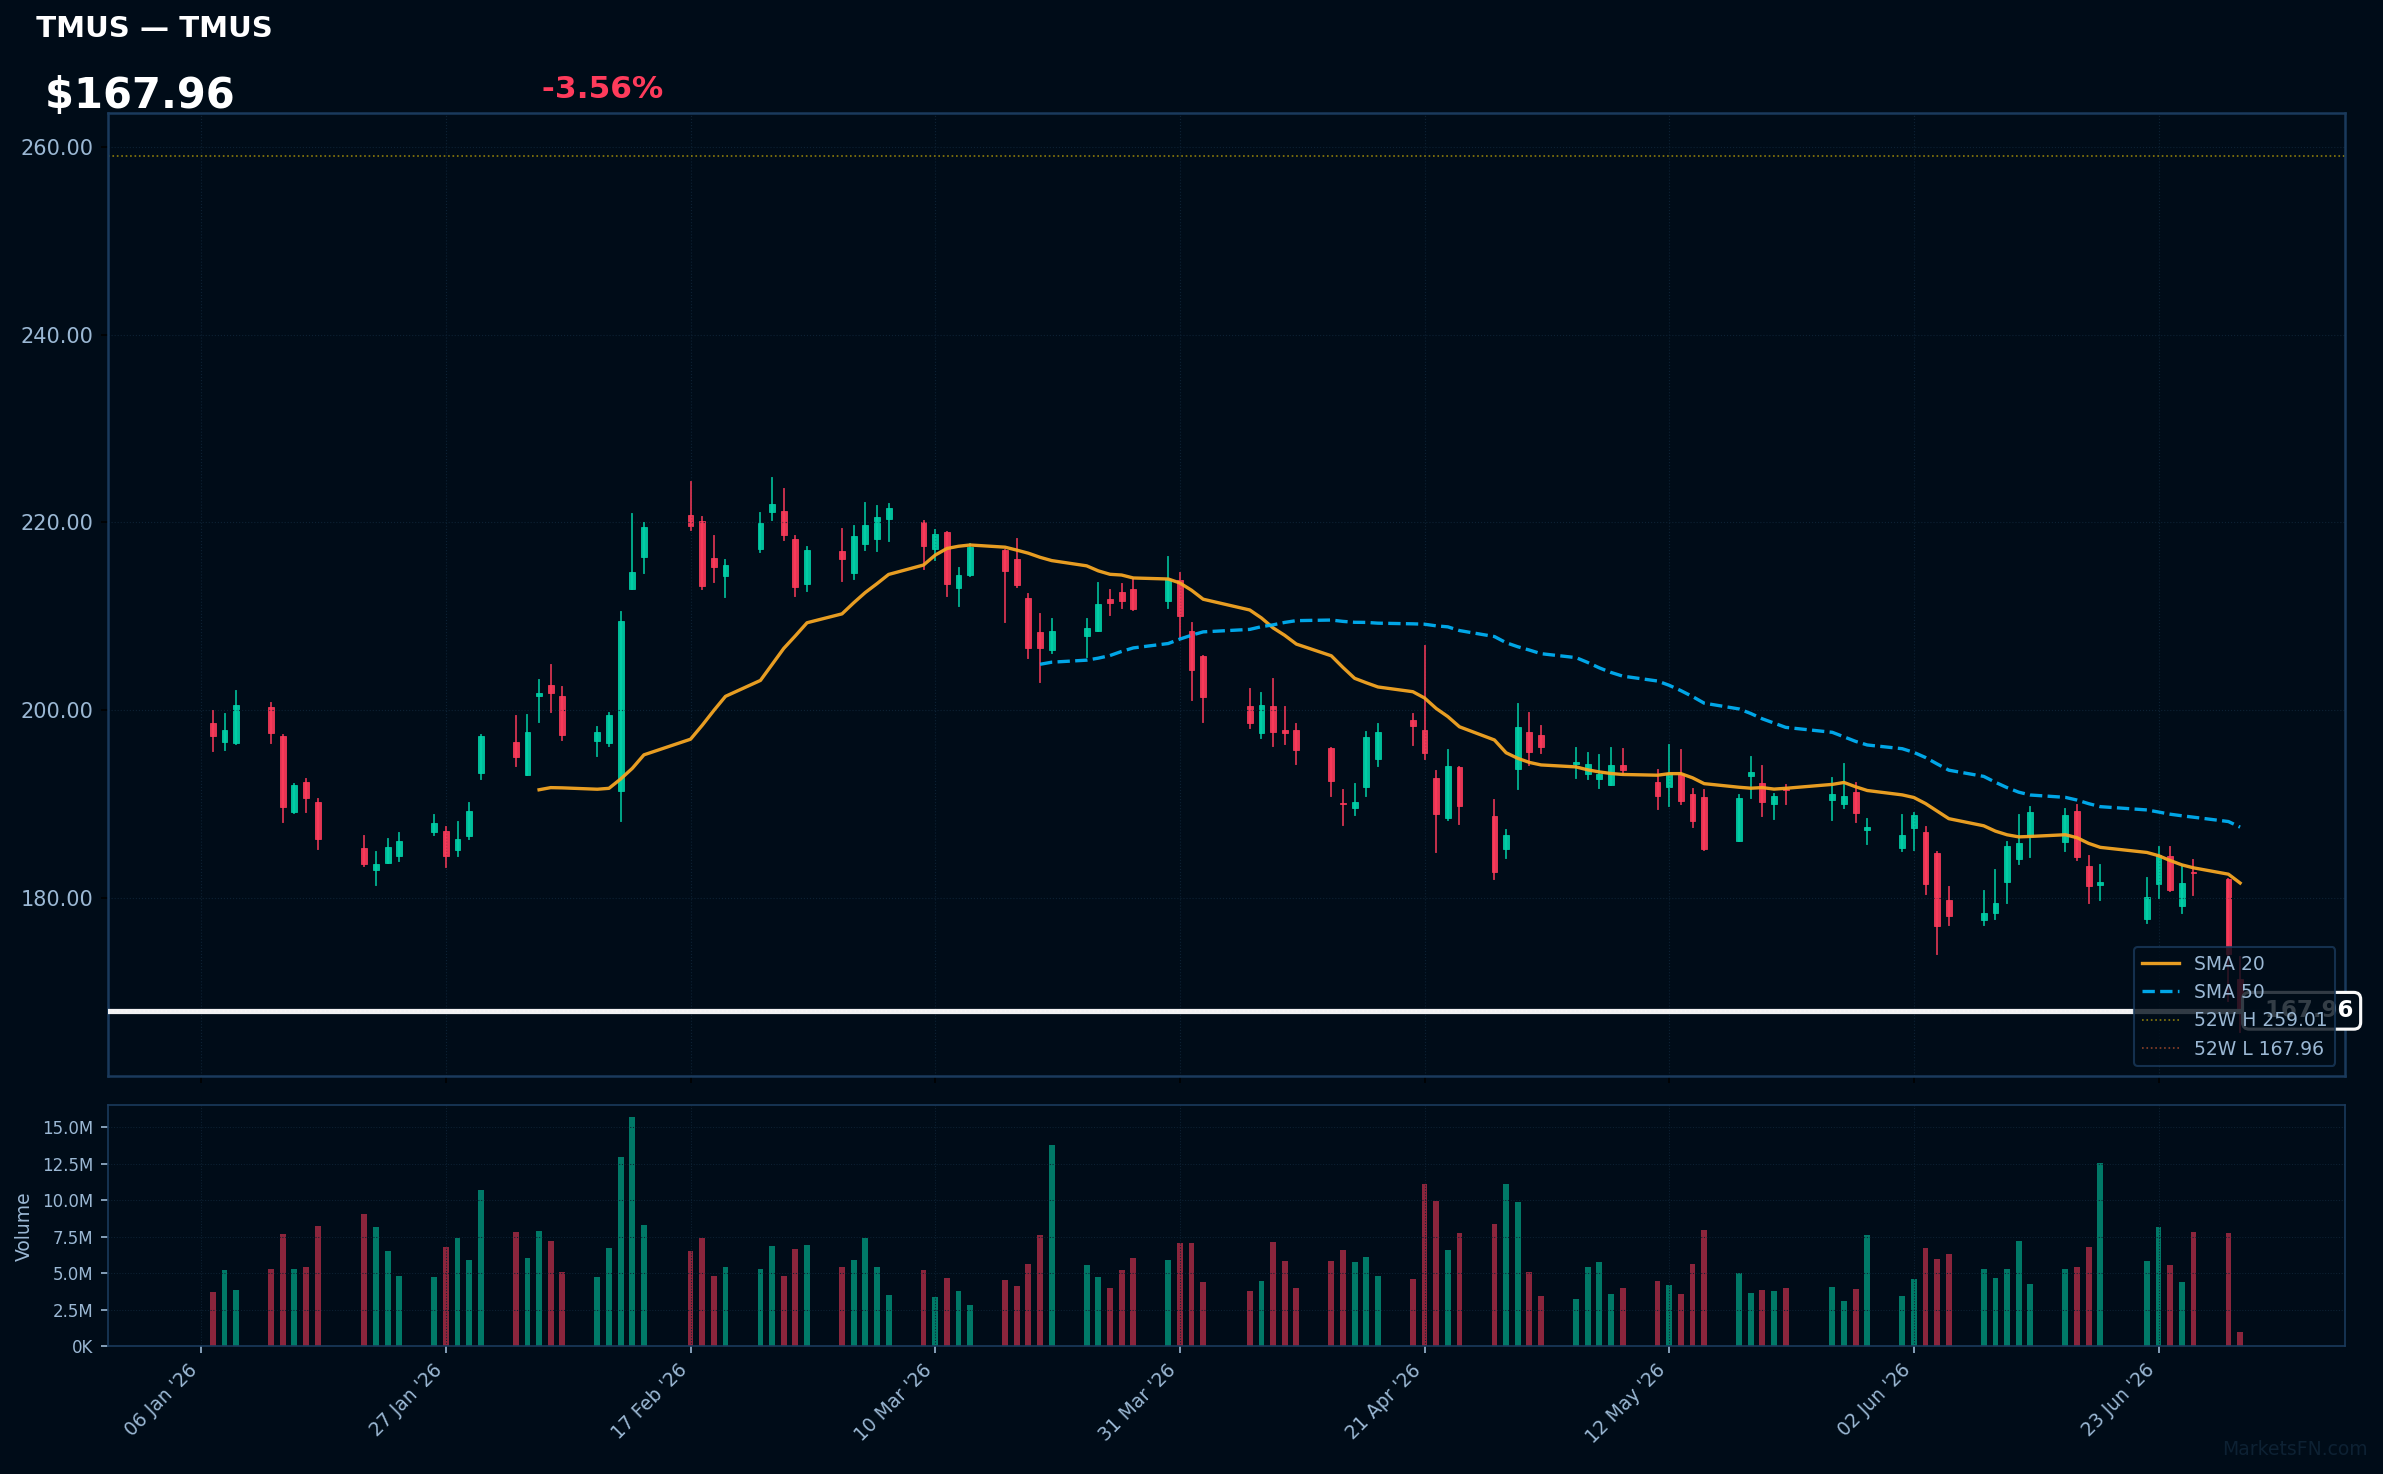
TMUS | T-Mobile US Inc | Communication Services | Price: $167.79 | Day: -3.56% | 1W: -9.00% | 1M: -10.43% | RSI: 30.5 | vs MA200: -18.0% | Trend: Below MA20, MA50, MA200
EQIX | Equinix Inc | Real Estate | Price: $1046.44 | Day: -3.57% | 1W: -6.23% | 1M: -2.02% | RSI: 40.4 | vs MA200: +15.6% | Trend: Above MA200 · Below MA20, MA50
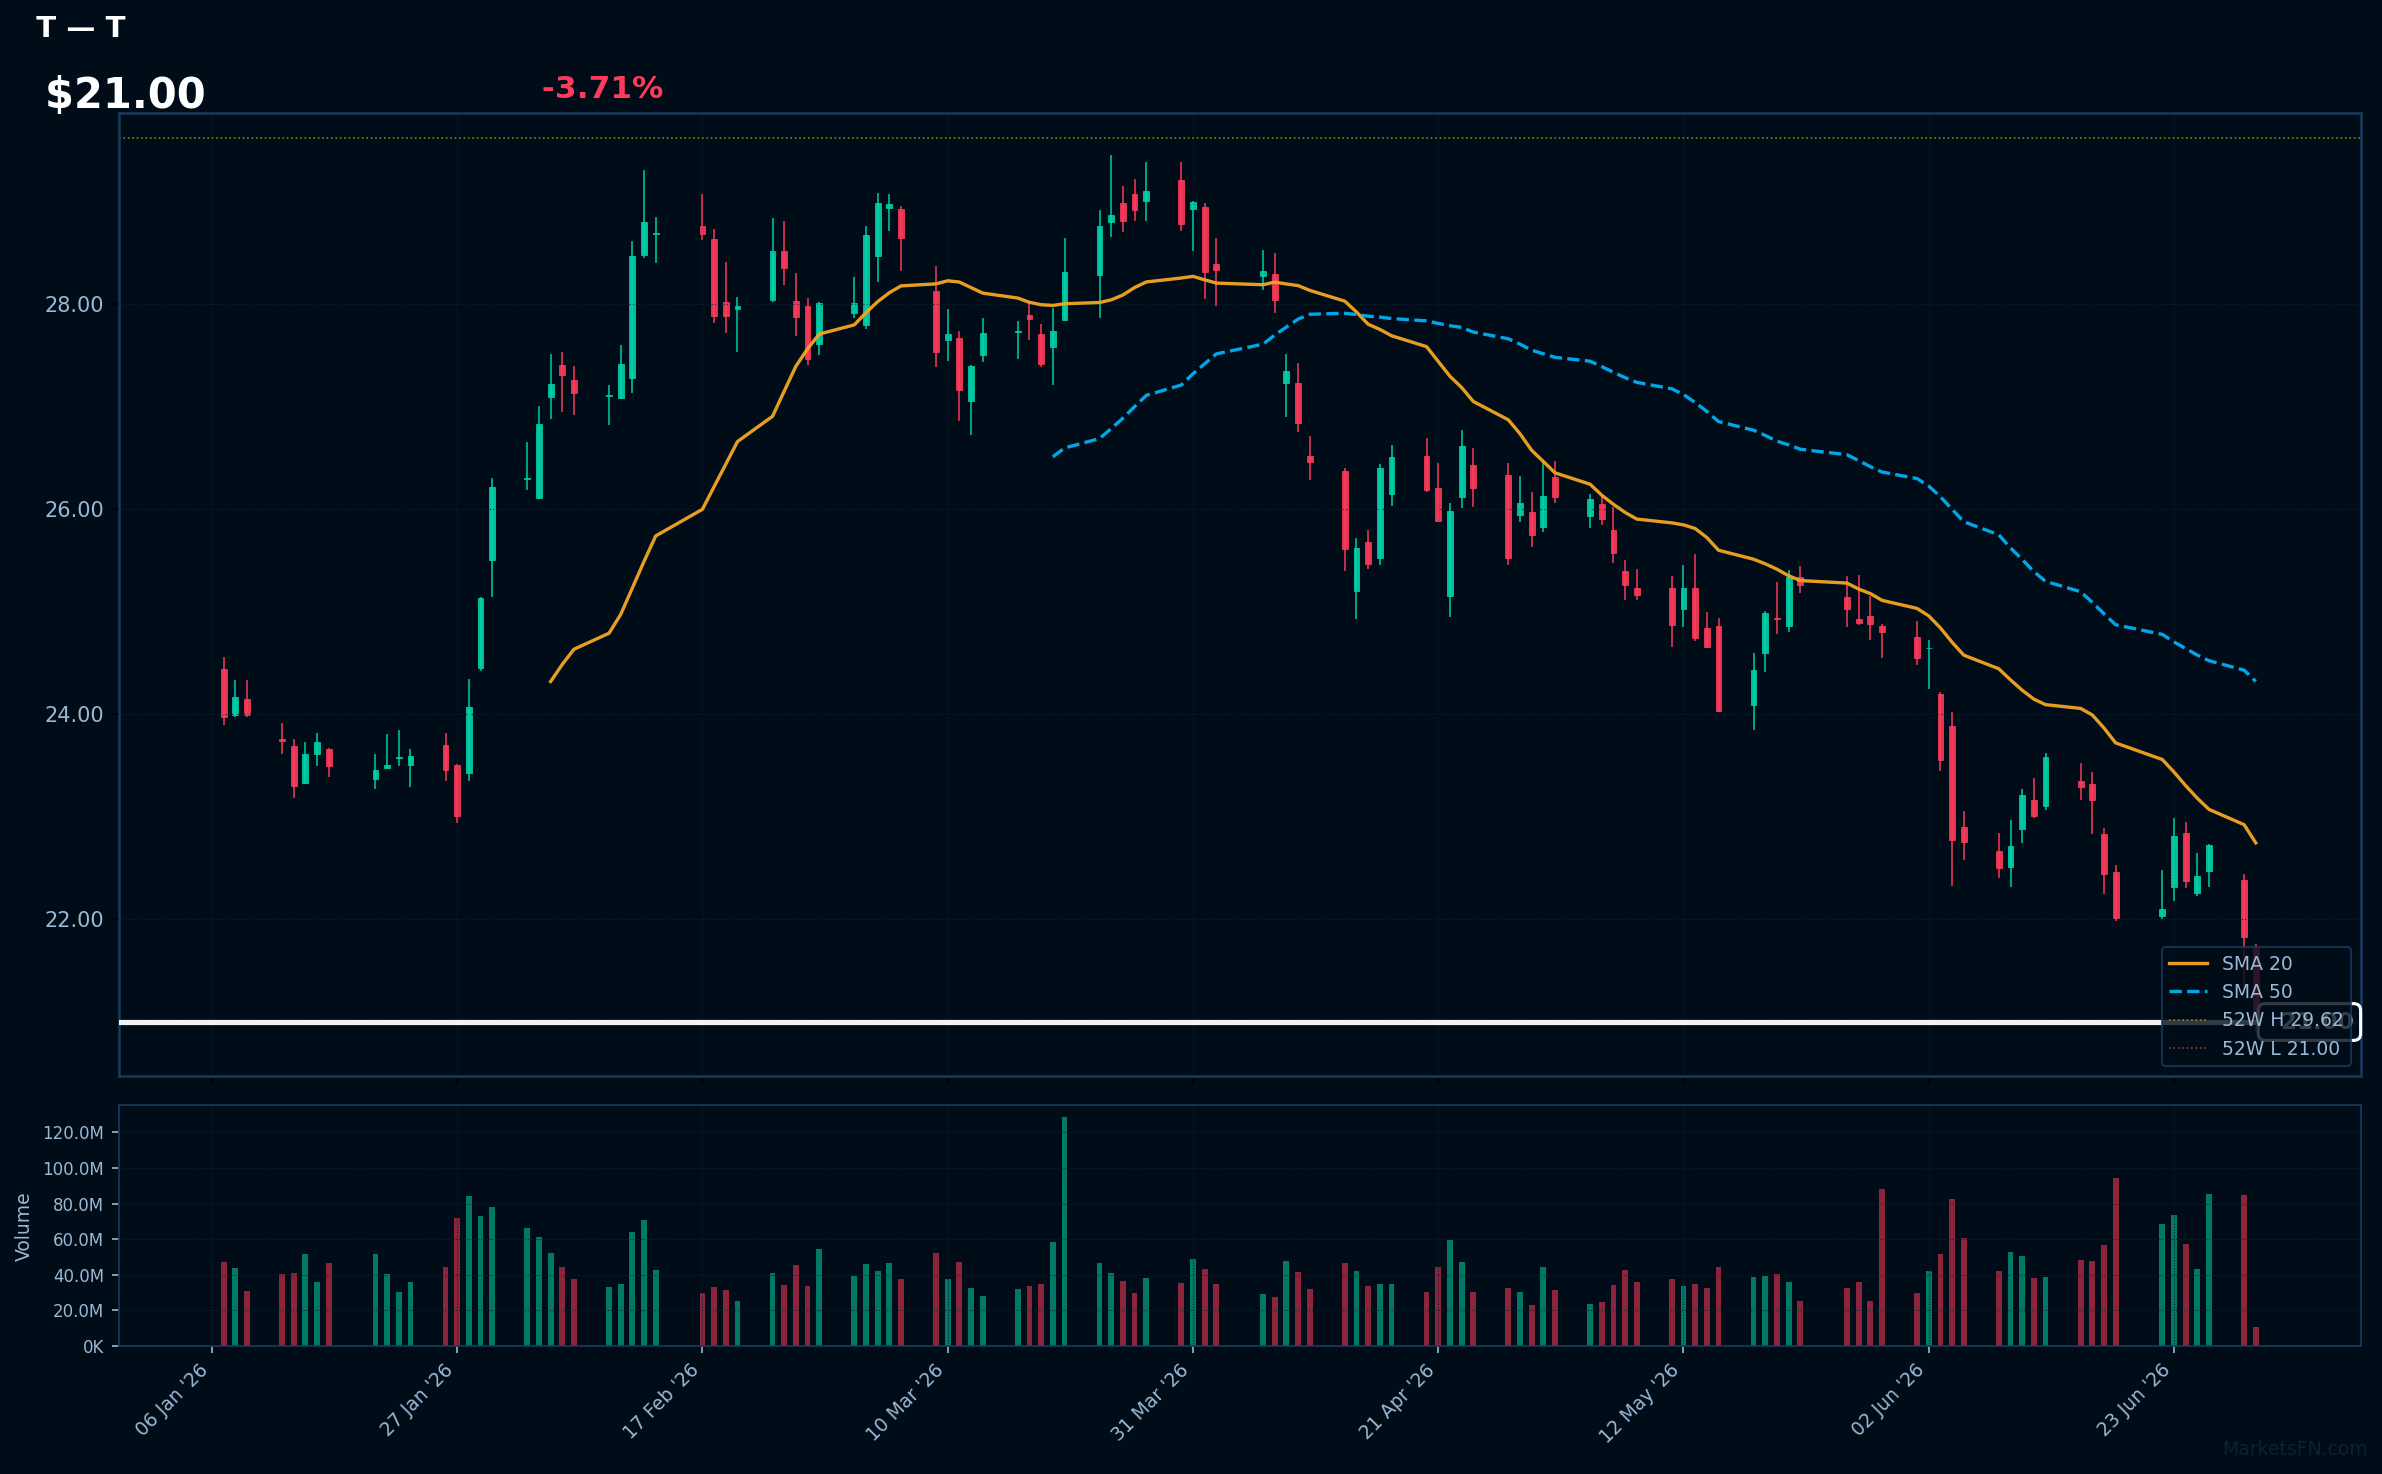
T | AT&T, Inc | Communication Services | Price: $21.01 | Day: -3.71% | 1W: -7.96% | 1M: -15.34% | RSI: 29.8 | vs MA200: -18.6% | Trend: Below MA20, MA50, MA200
Recent headlines (last 12h)
- AT&T Expands Build-A-Plan: Flexible Custom Wireless Plan Now Includes the Ability to Easily Add America's Best and Fastest Home Internet
- Why Did T, HTZ, GAP Stocks Plunge To 52-Week Lows Today?
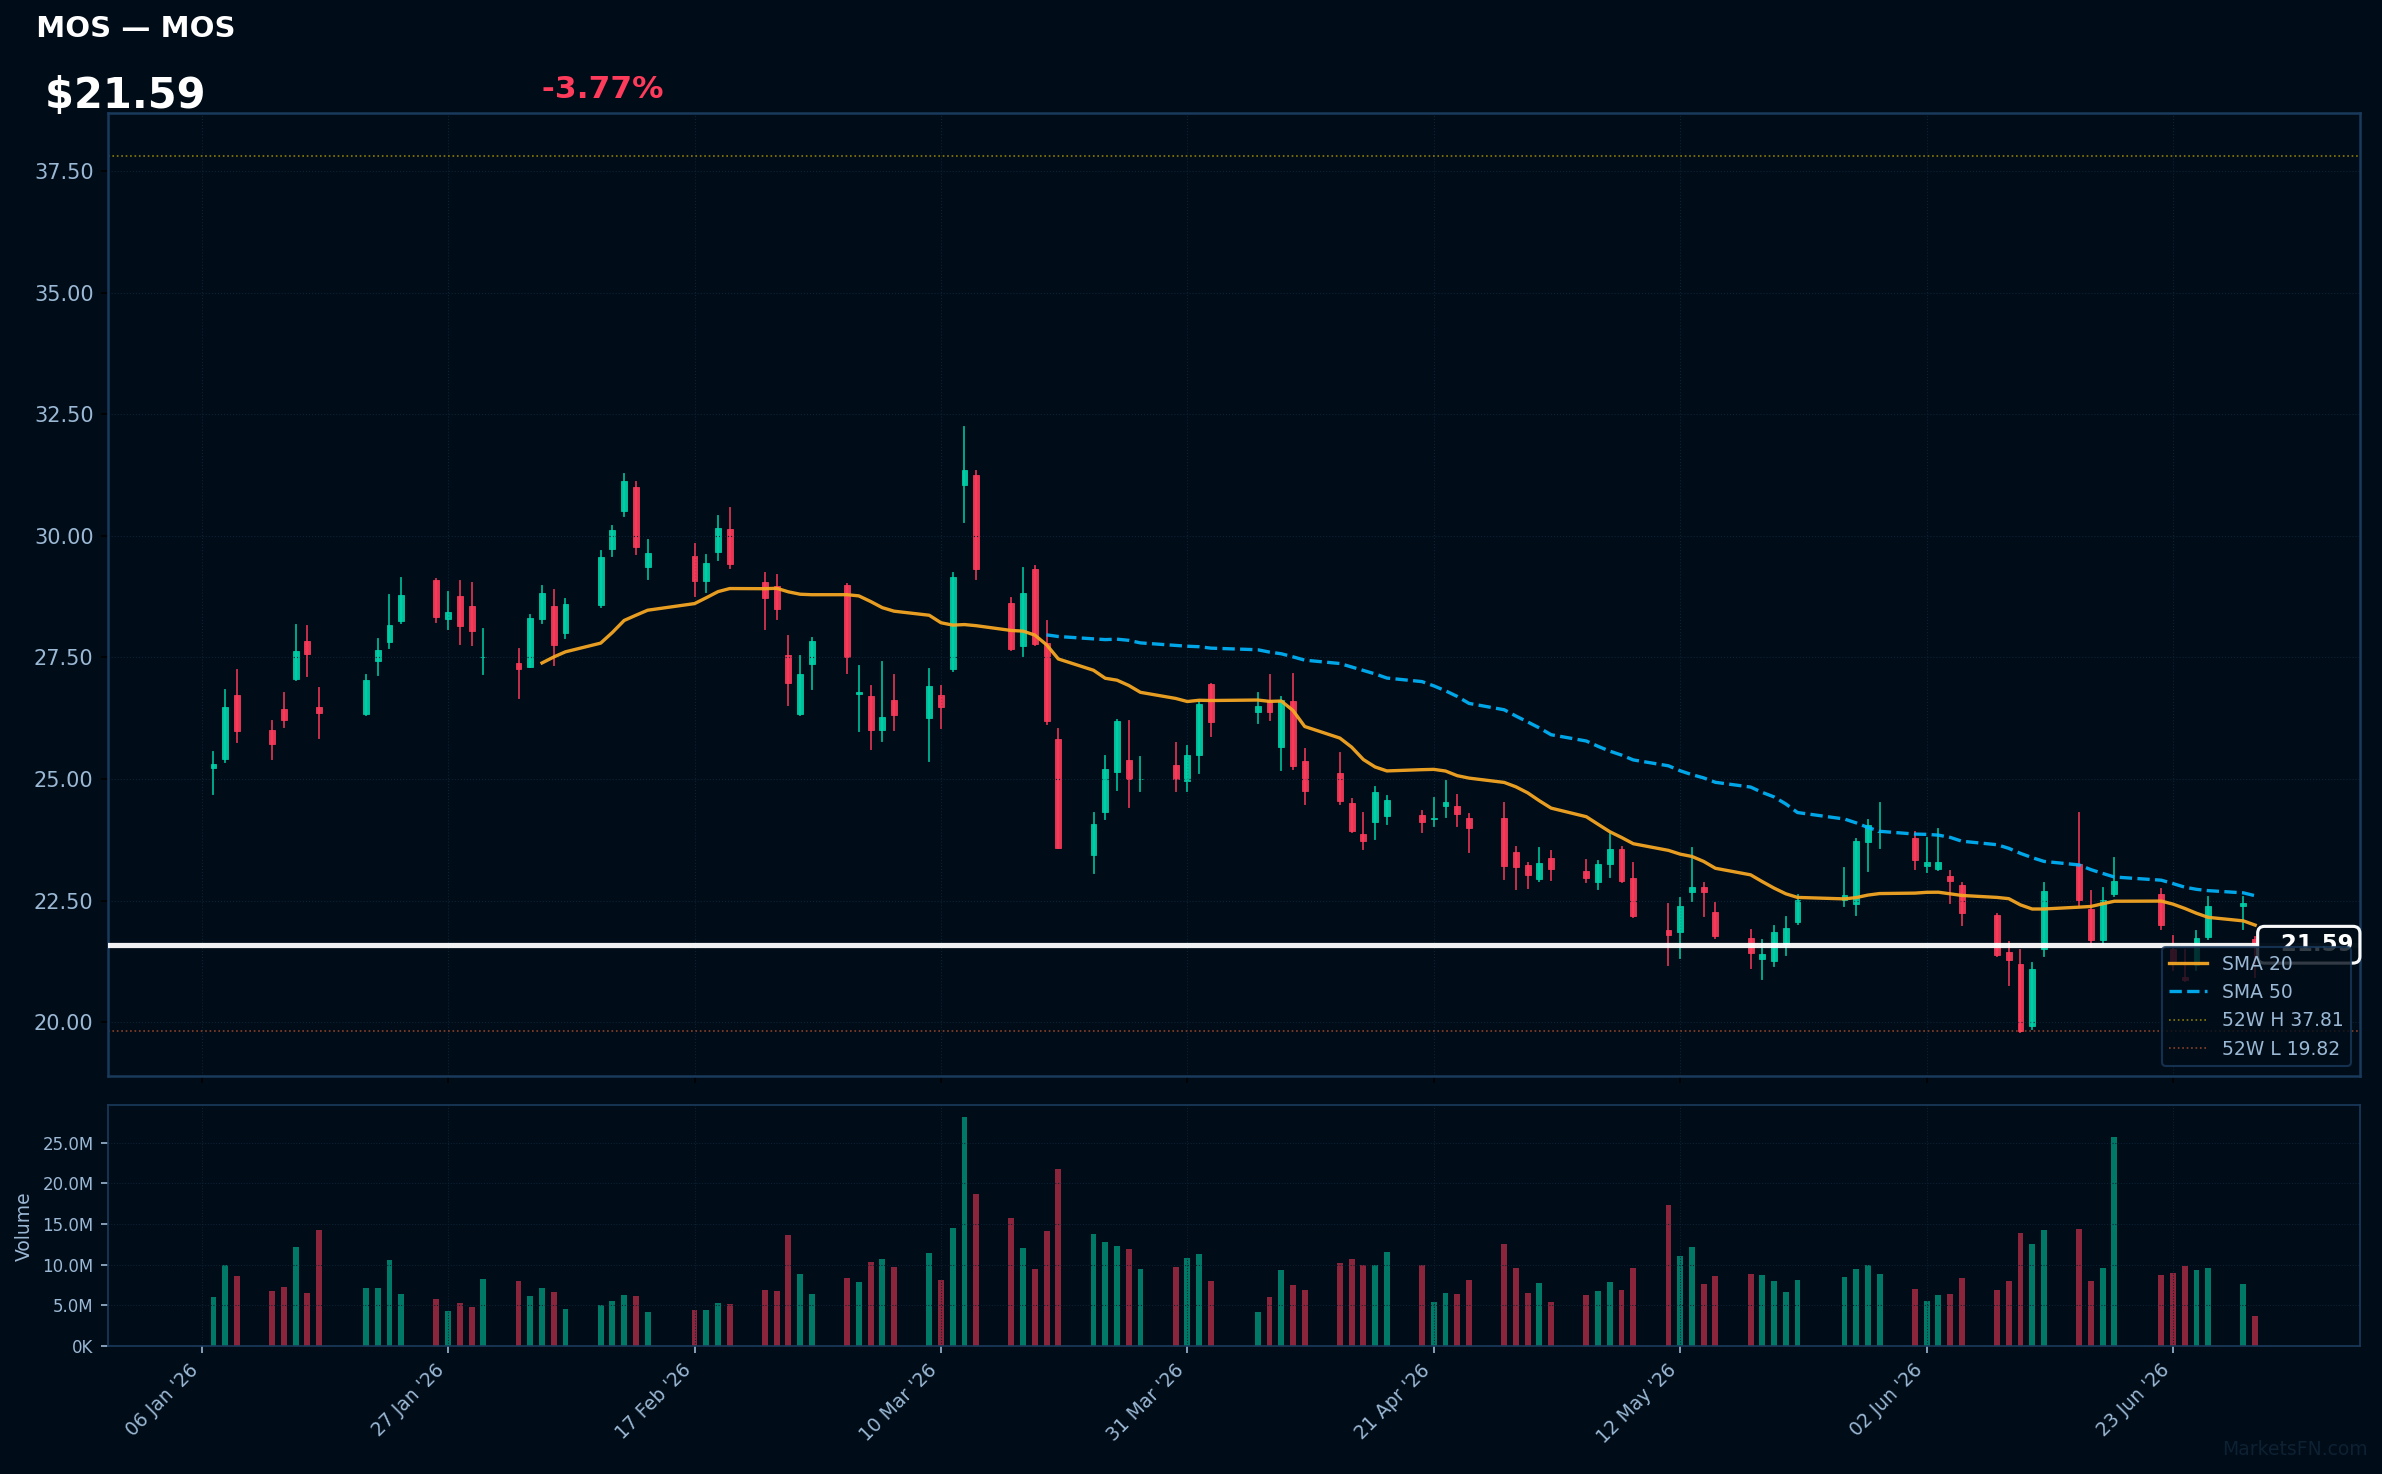
MOS | Mosaic Company | Basic Materials | Price: $21.59 | Day: -3.77% | 1W: +1.60% | 1M: -9.67% | RSI: 46.0 | vs MA200: -18.2% | Trend: Below MA20, MA50, MA200
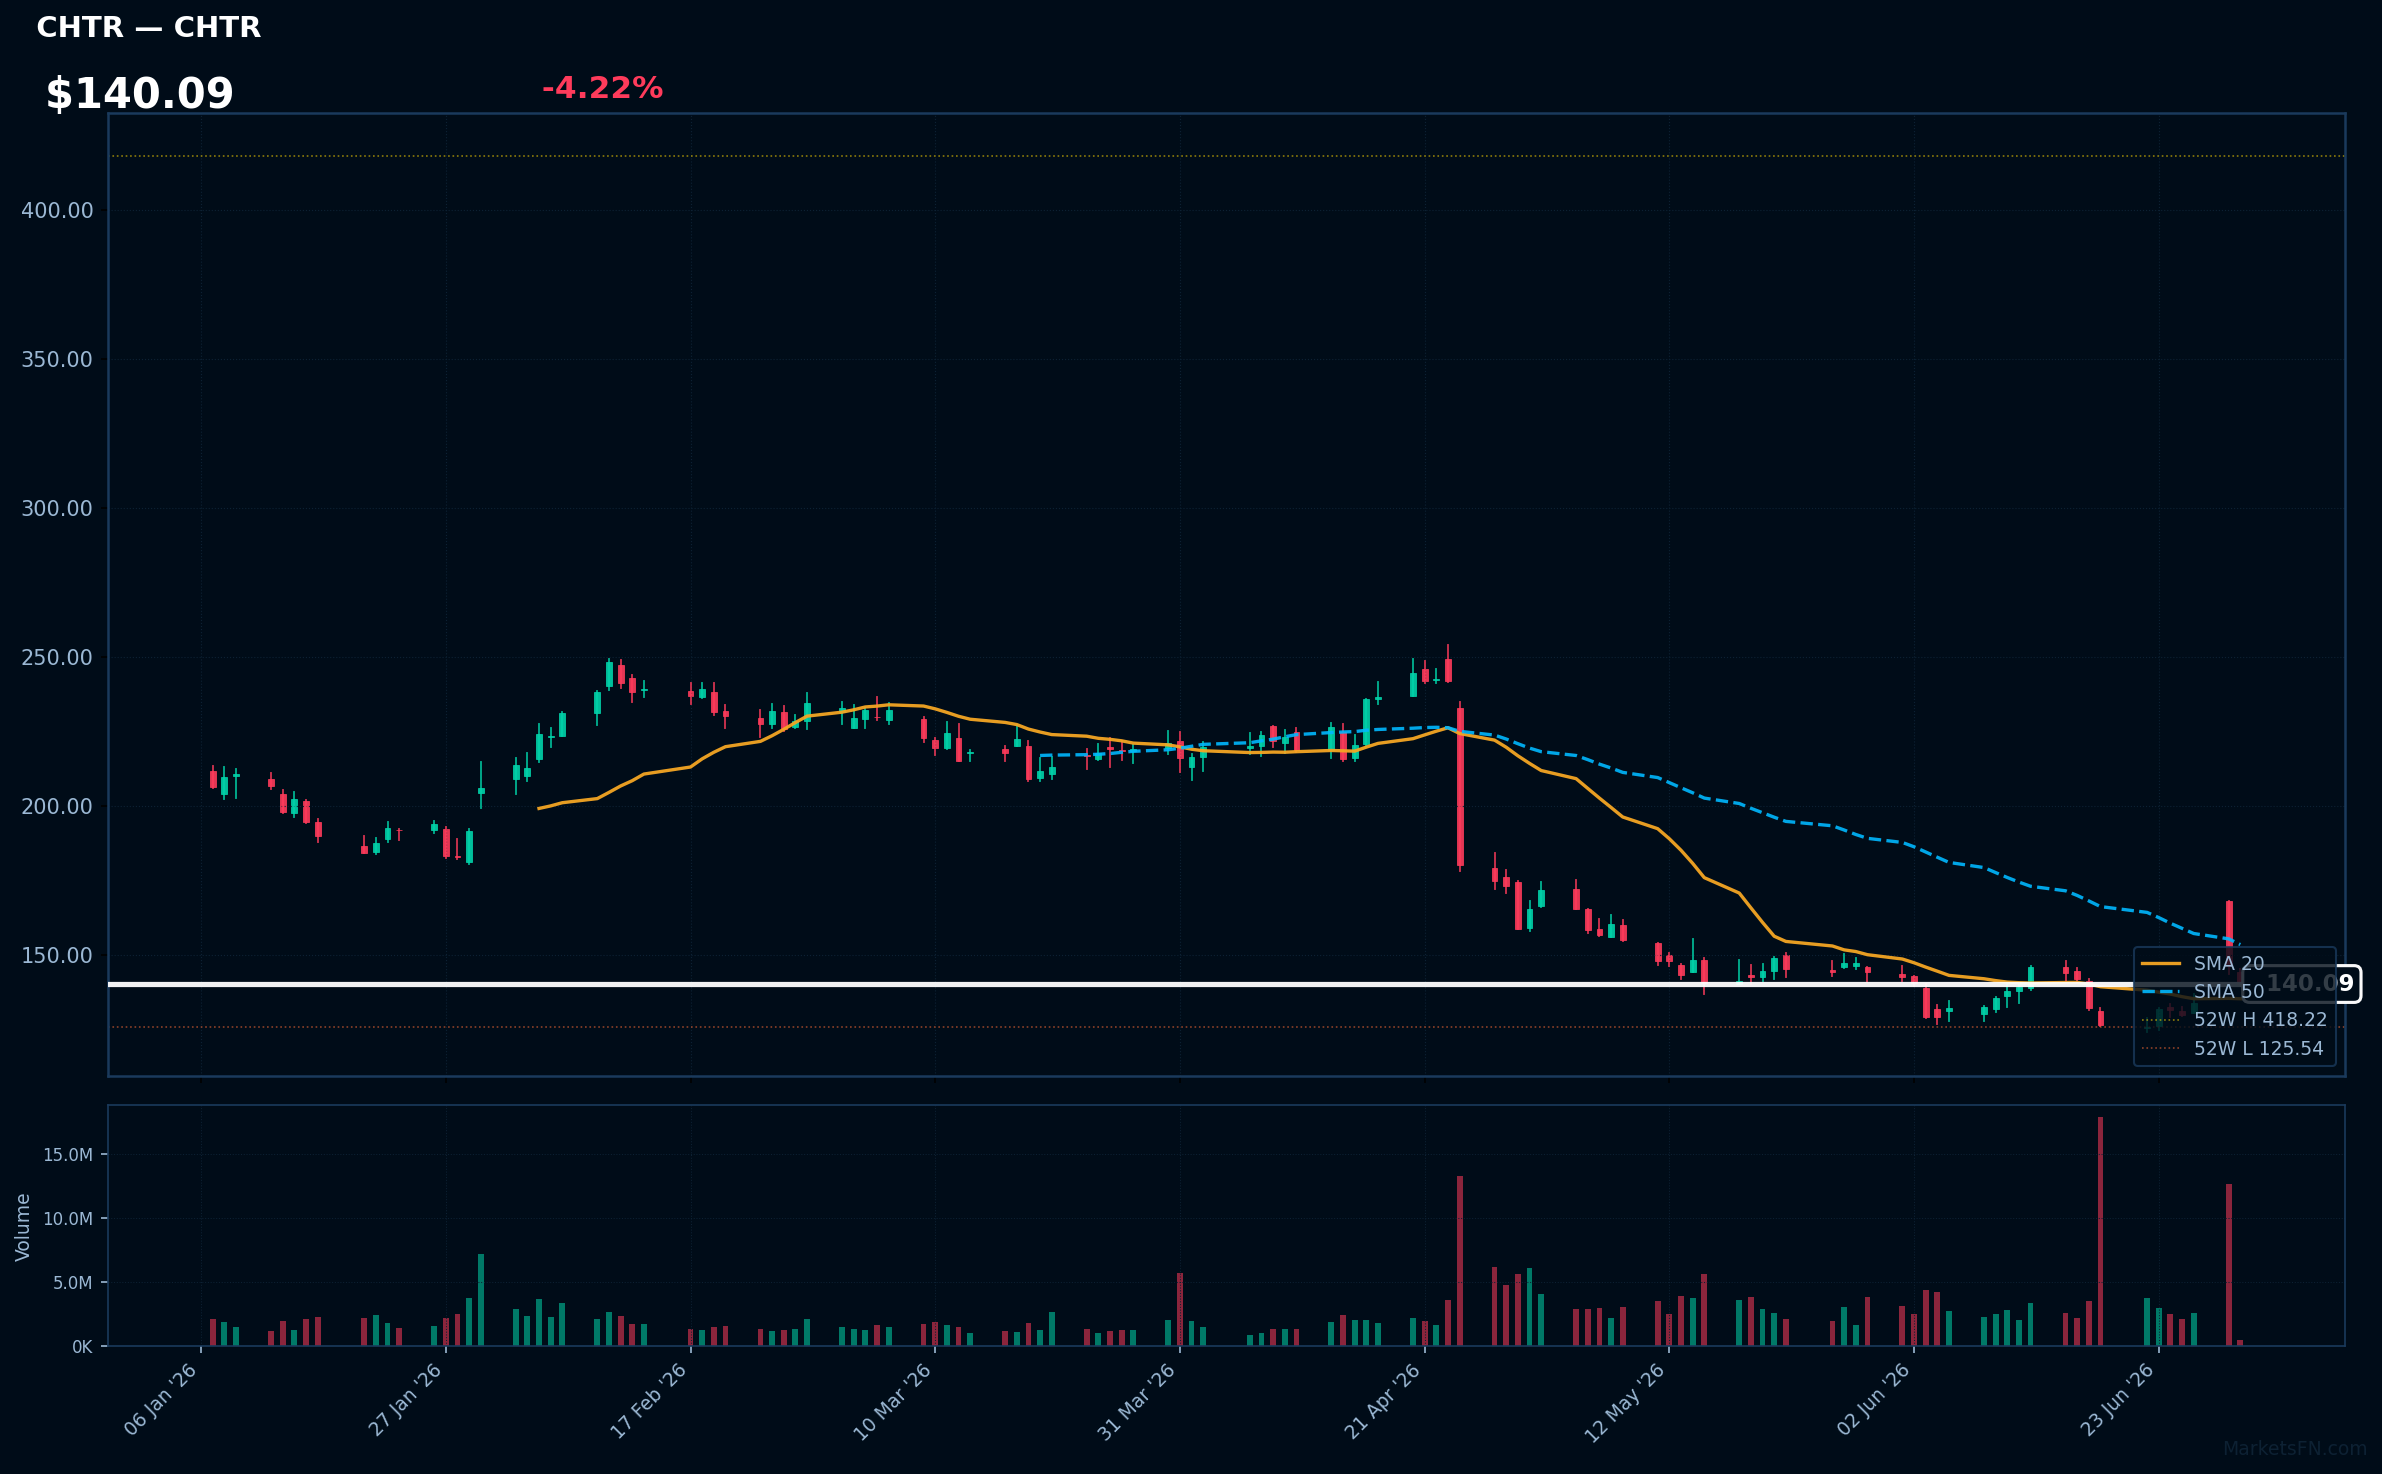
CHTR | Charter Communications Inc | Communication Services | Price: $140.00 | Day: -4.22% | 1W: +6.33% | 1M: -2.75% | RSI: 49.2 | vs MA200: -32.4% | Trend: Above MA20 · Below MA50, MA200
Recent headlines (last 12h)
- BNP Paribas Dismisses SpaceX Threat as Charter Stock Jumps
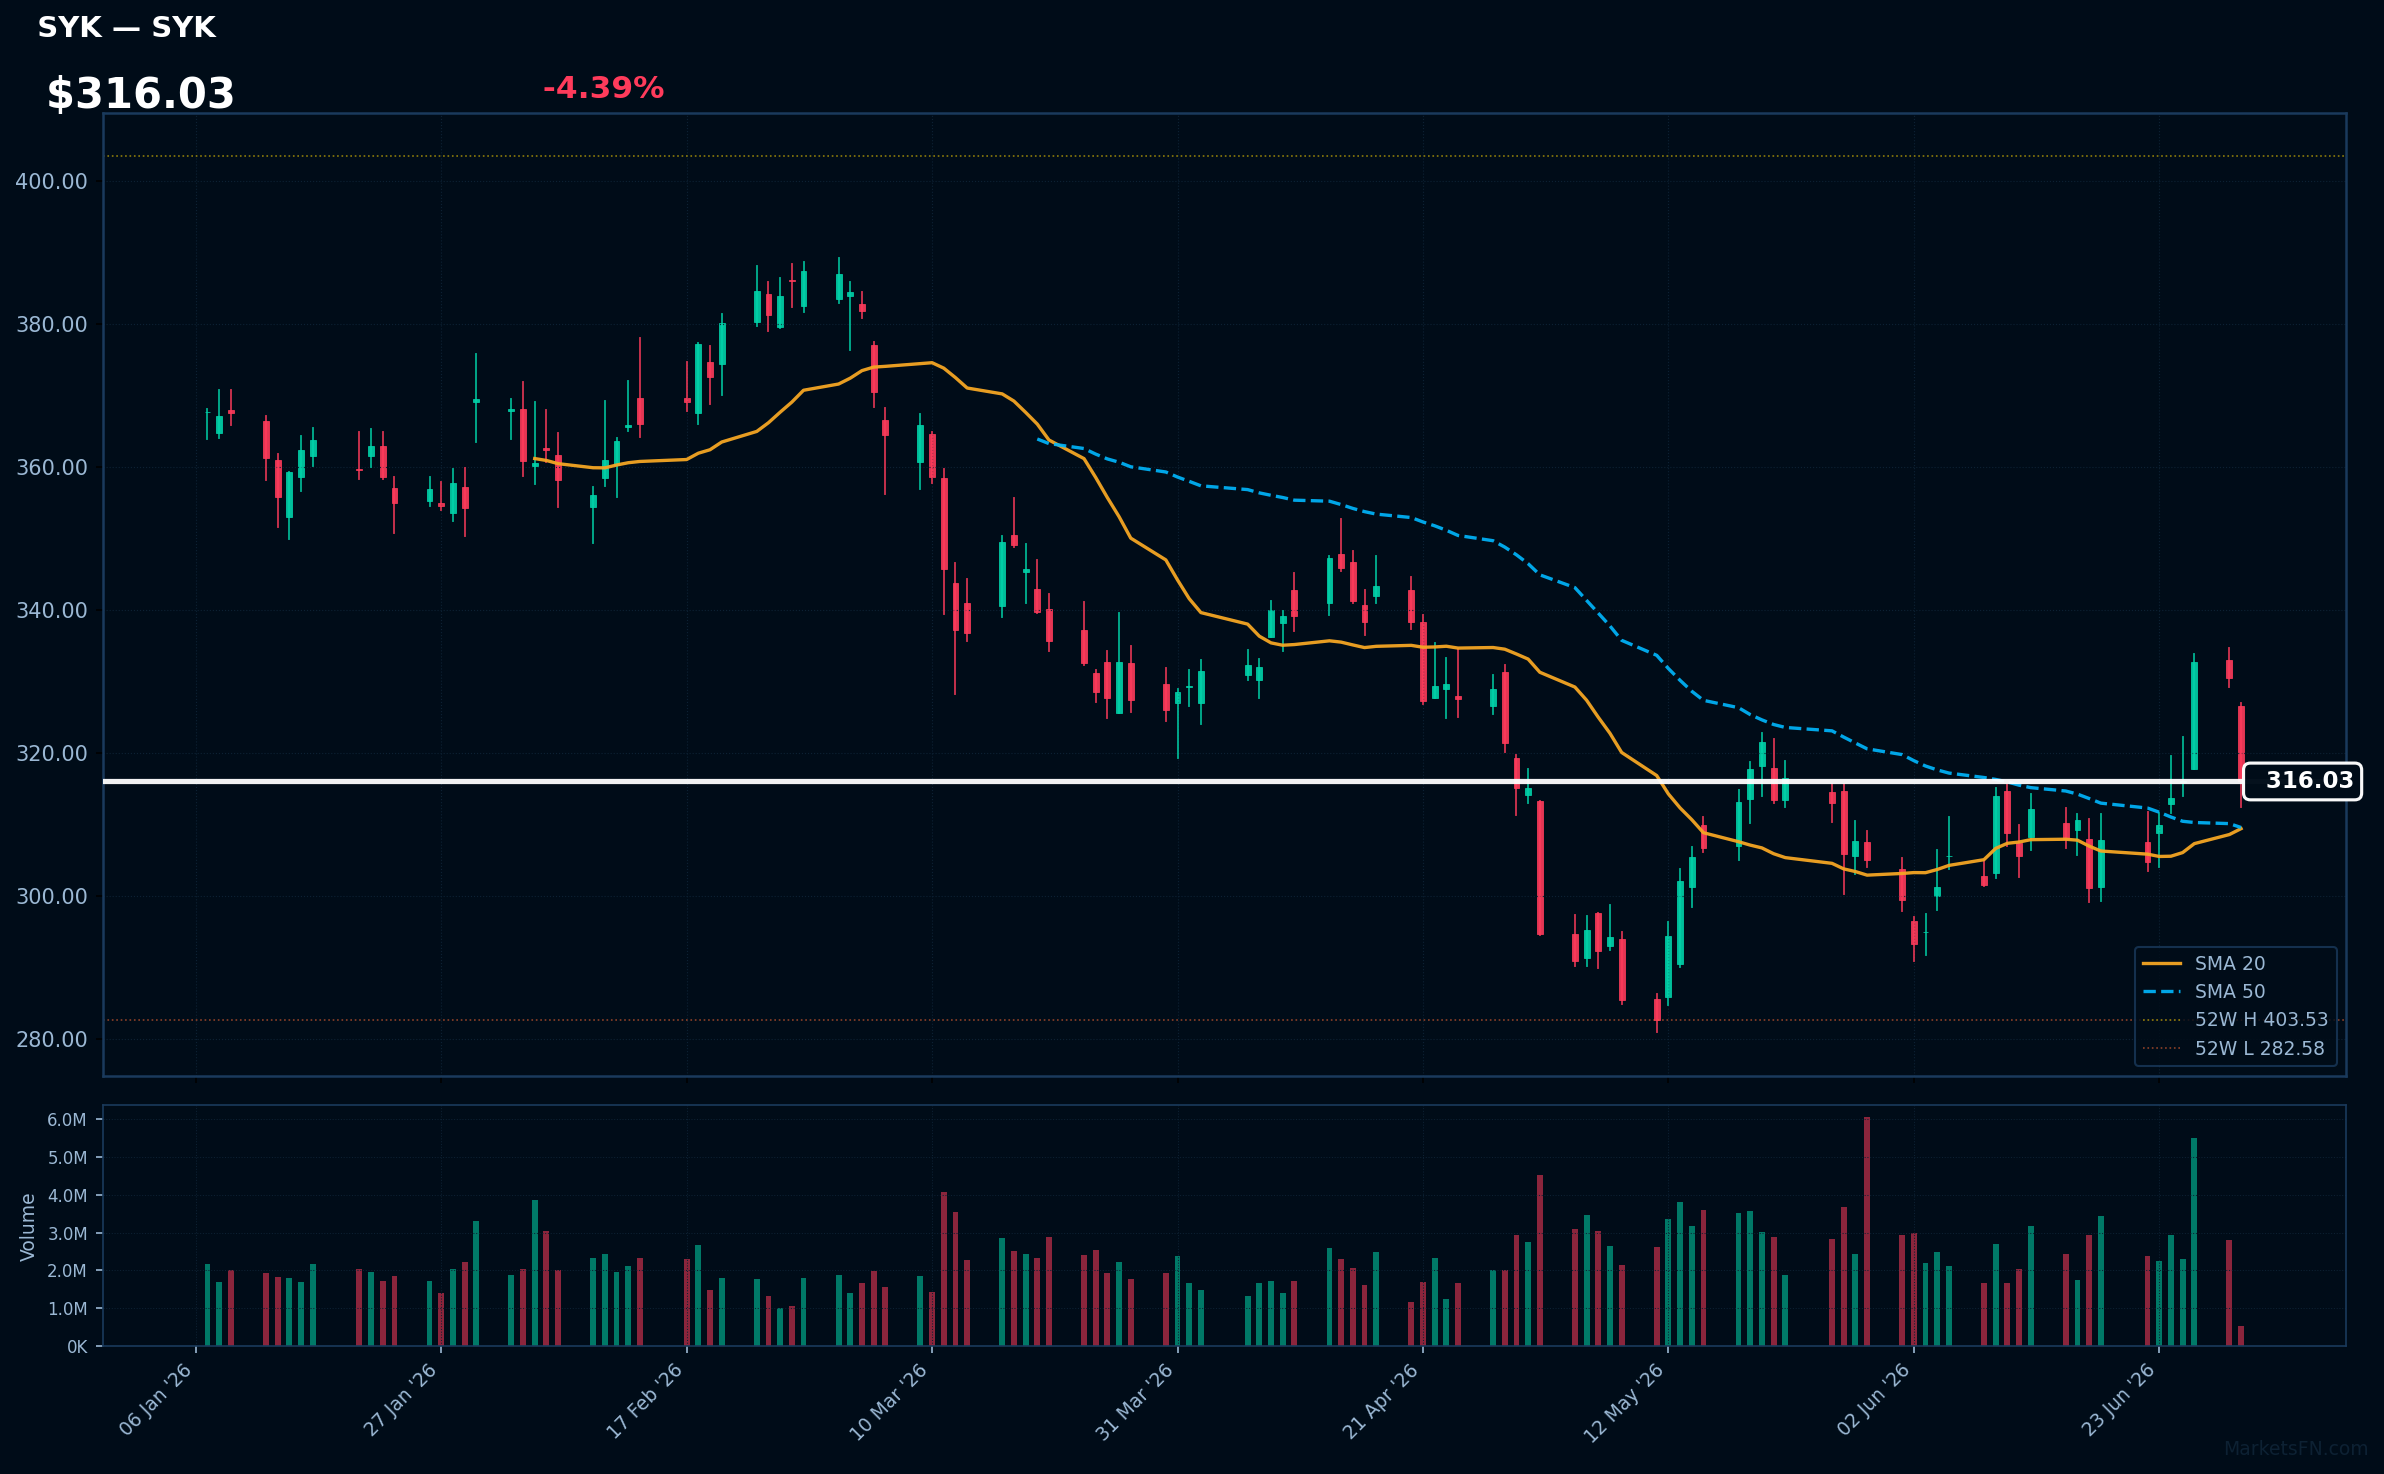
SYK | Stryker Corp | Healthcare | Price: $316.00 | Day: -4.39% | 1W: +1.95% | 1M: +3.59% | RSI: 52.4 | vs MA200: -9.2% | Trend: Above MA20, MA50 · Below MA200
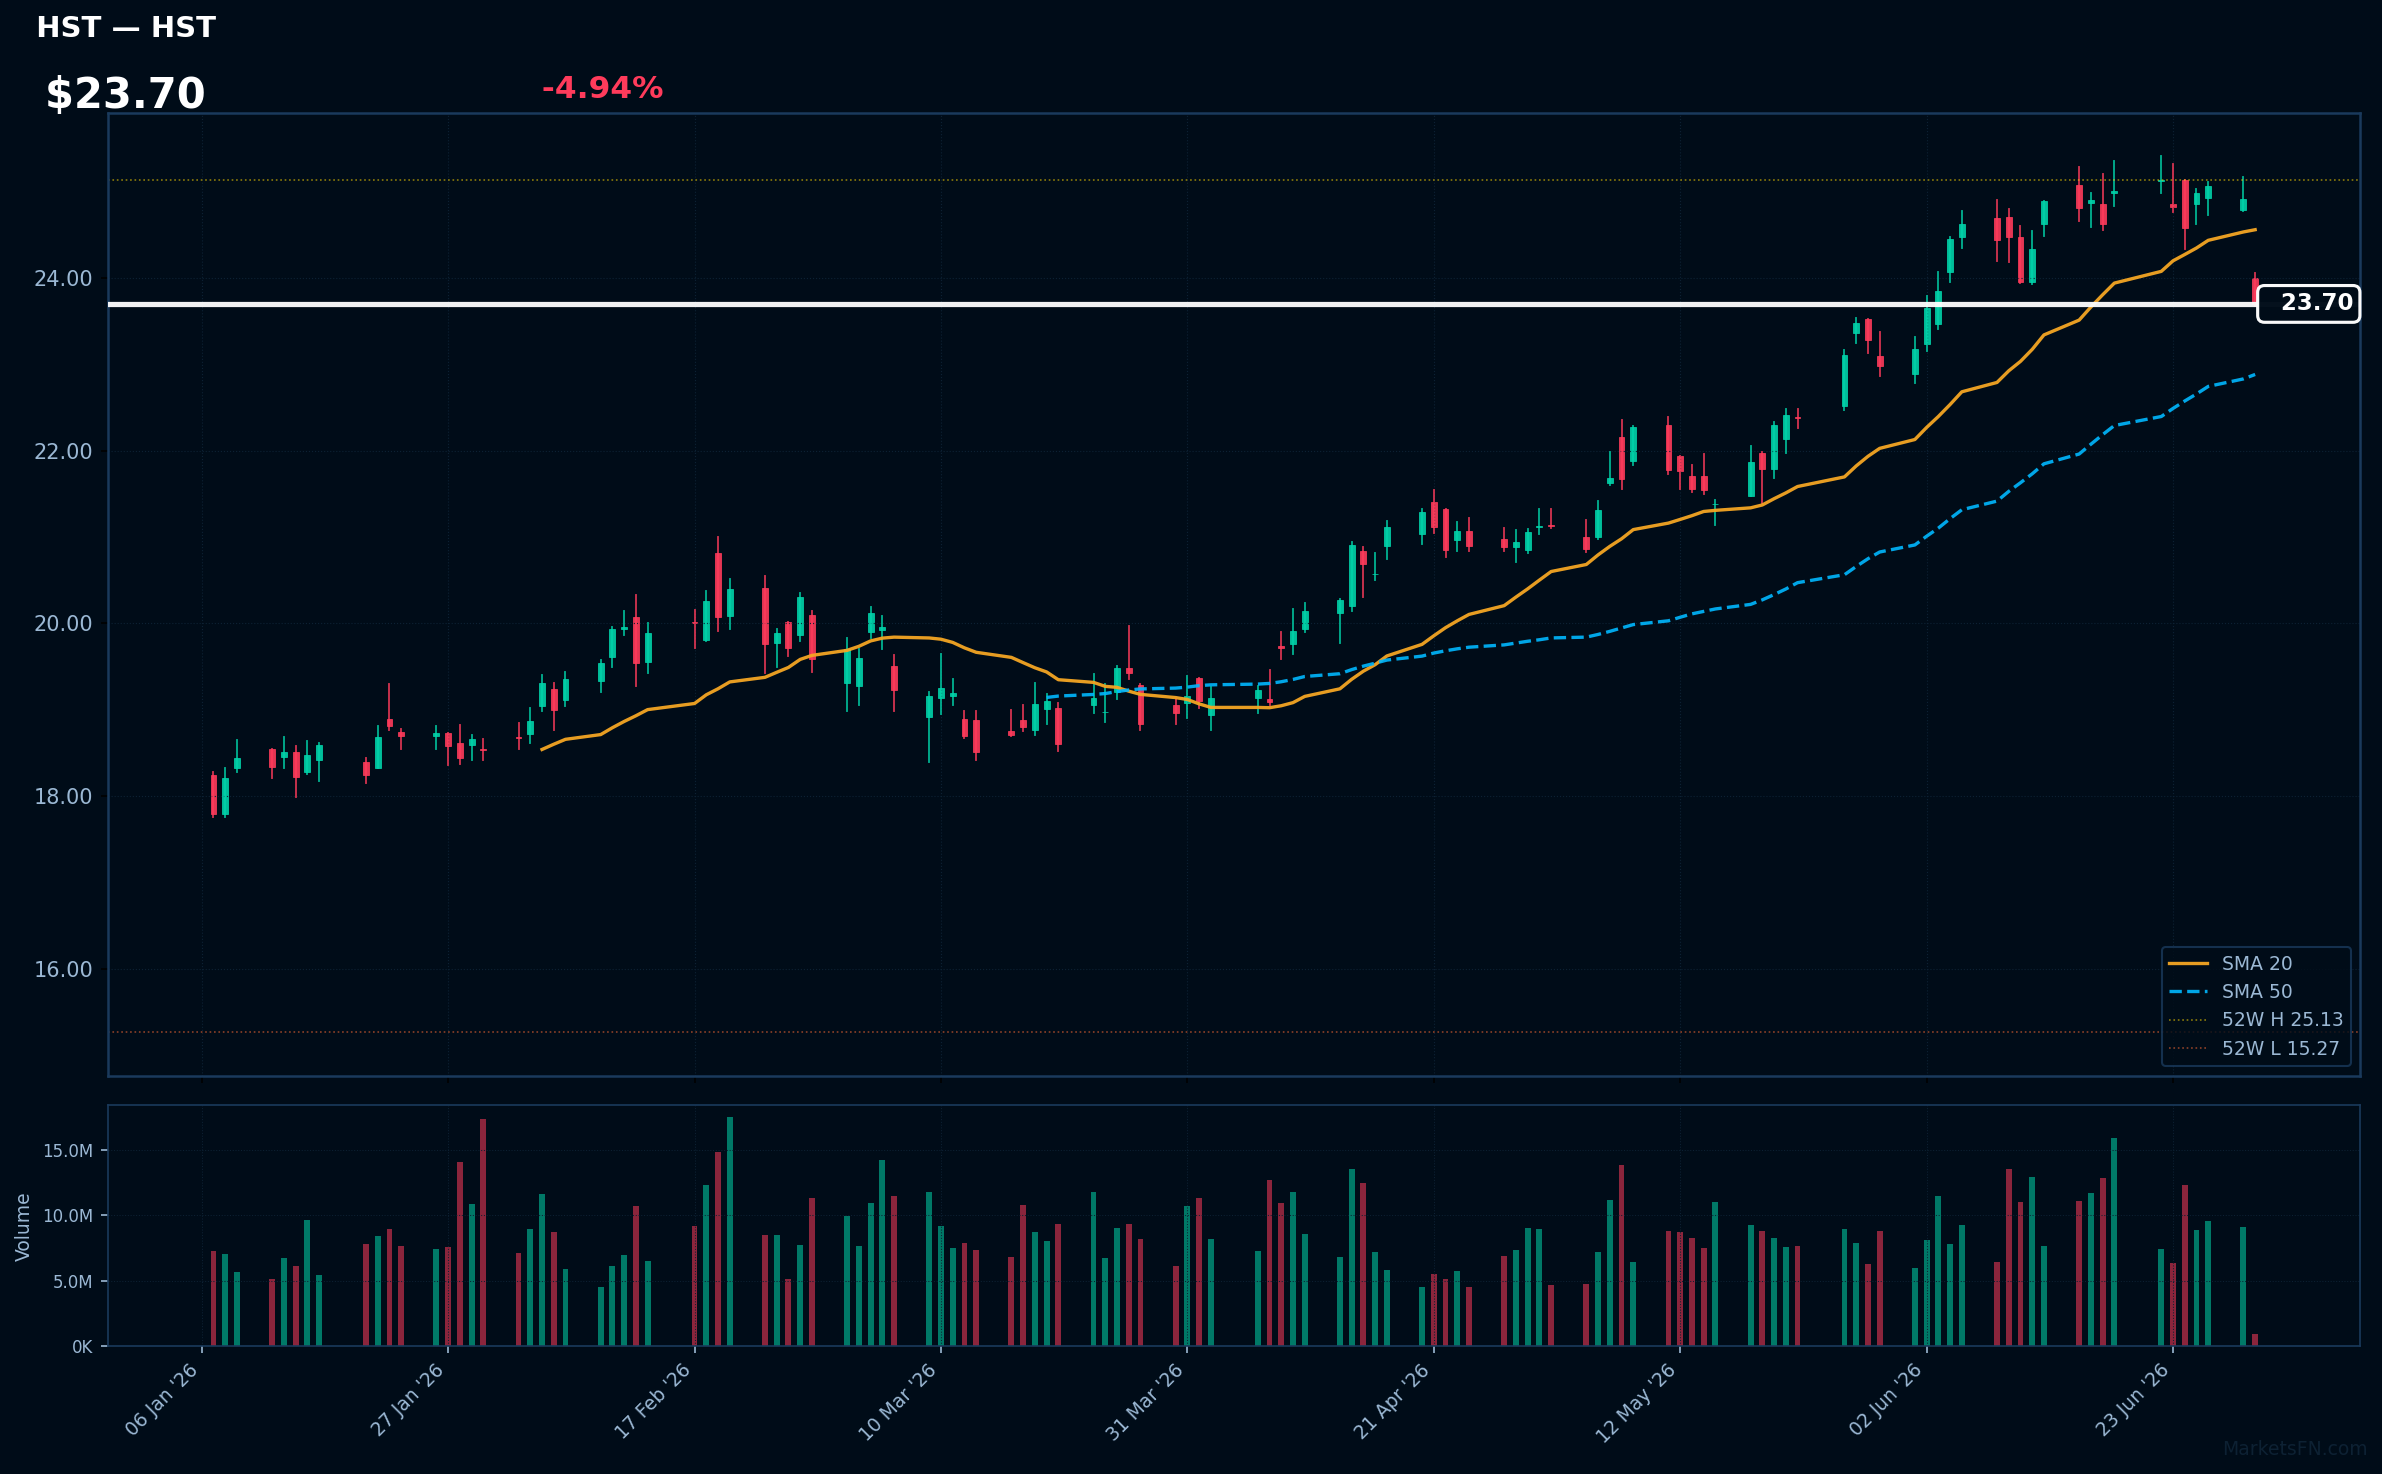
HST | Host Hotels & Resorts Inc | Real Estate | Price: $23.69 | Day: -4.94% | 1W: -4.51% | 1M: +3.13% | RSI: 46.2 | vs MA200: +22.1% | Trend: Above MA50, MA200 · Below MA20
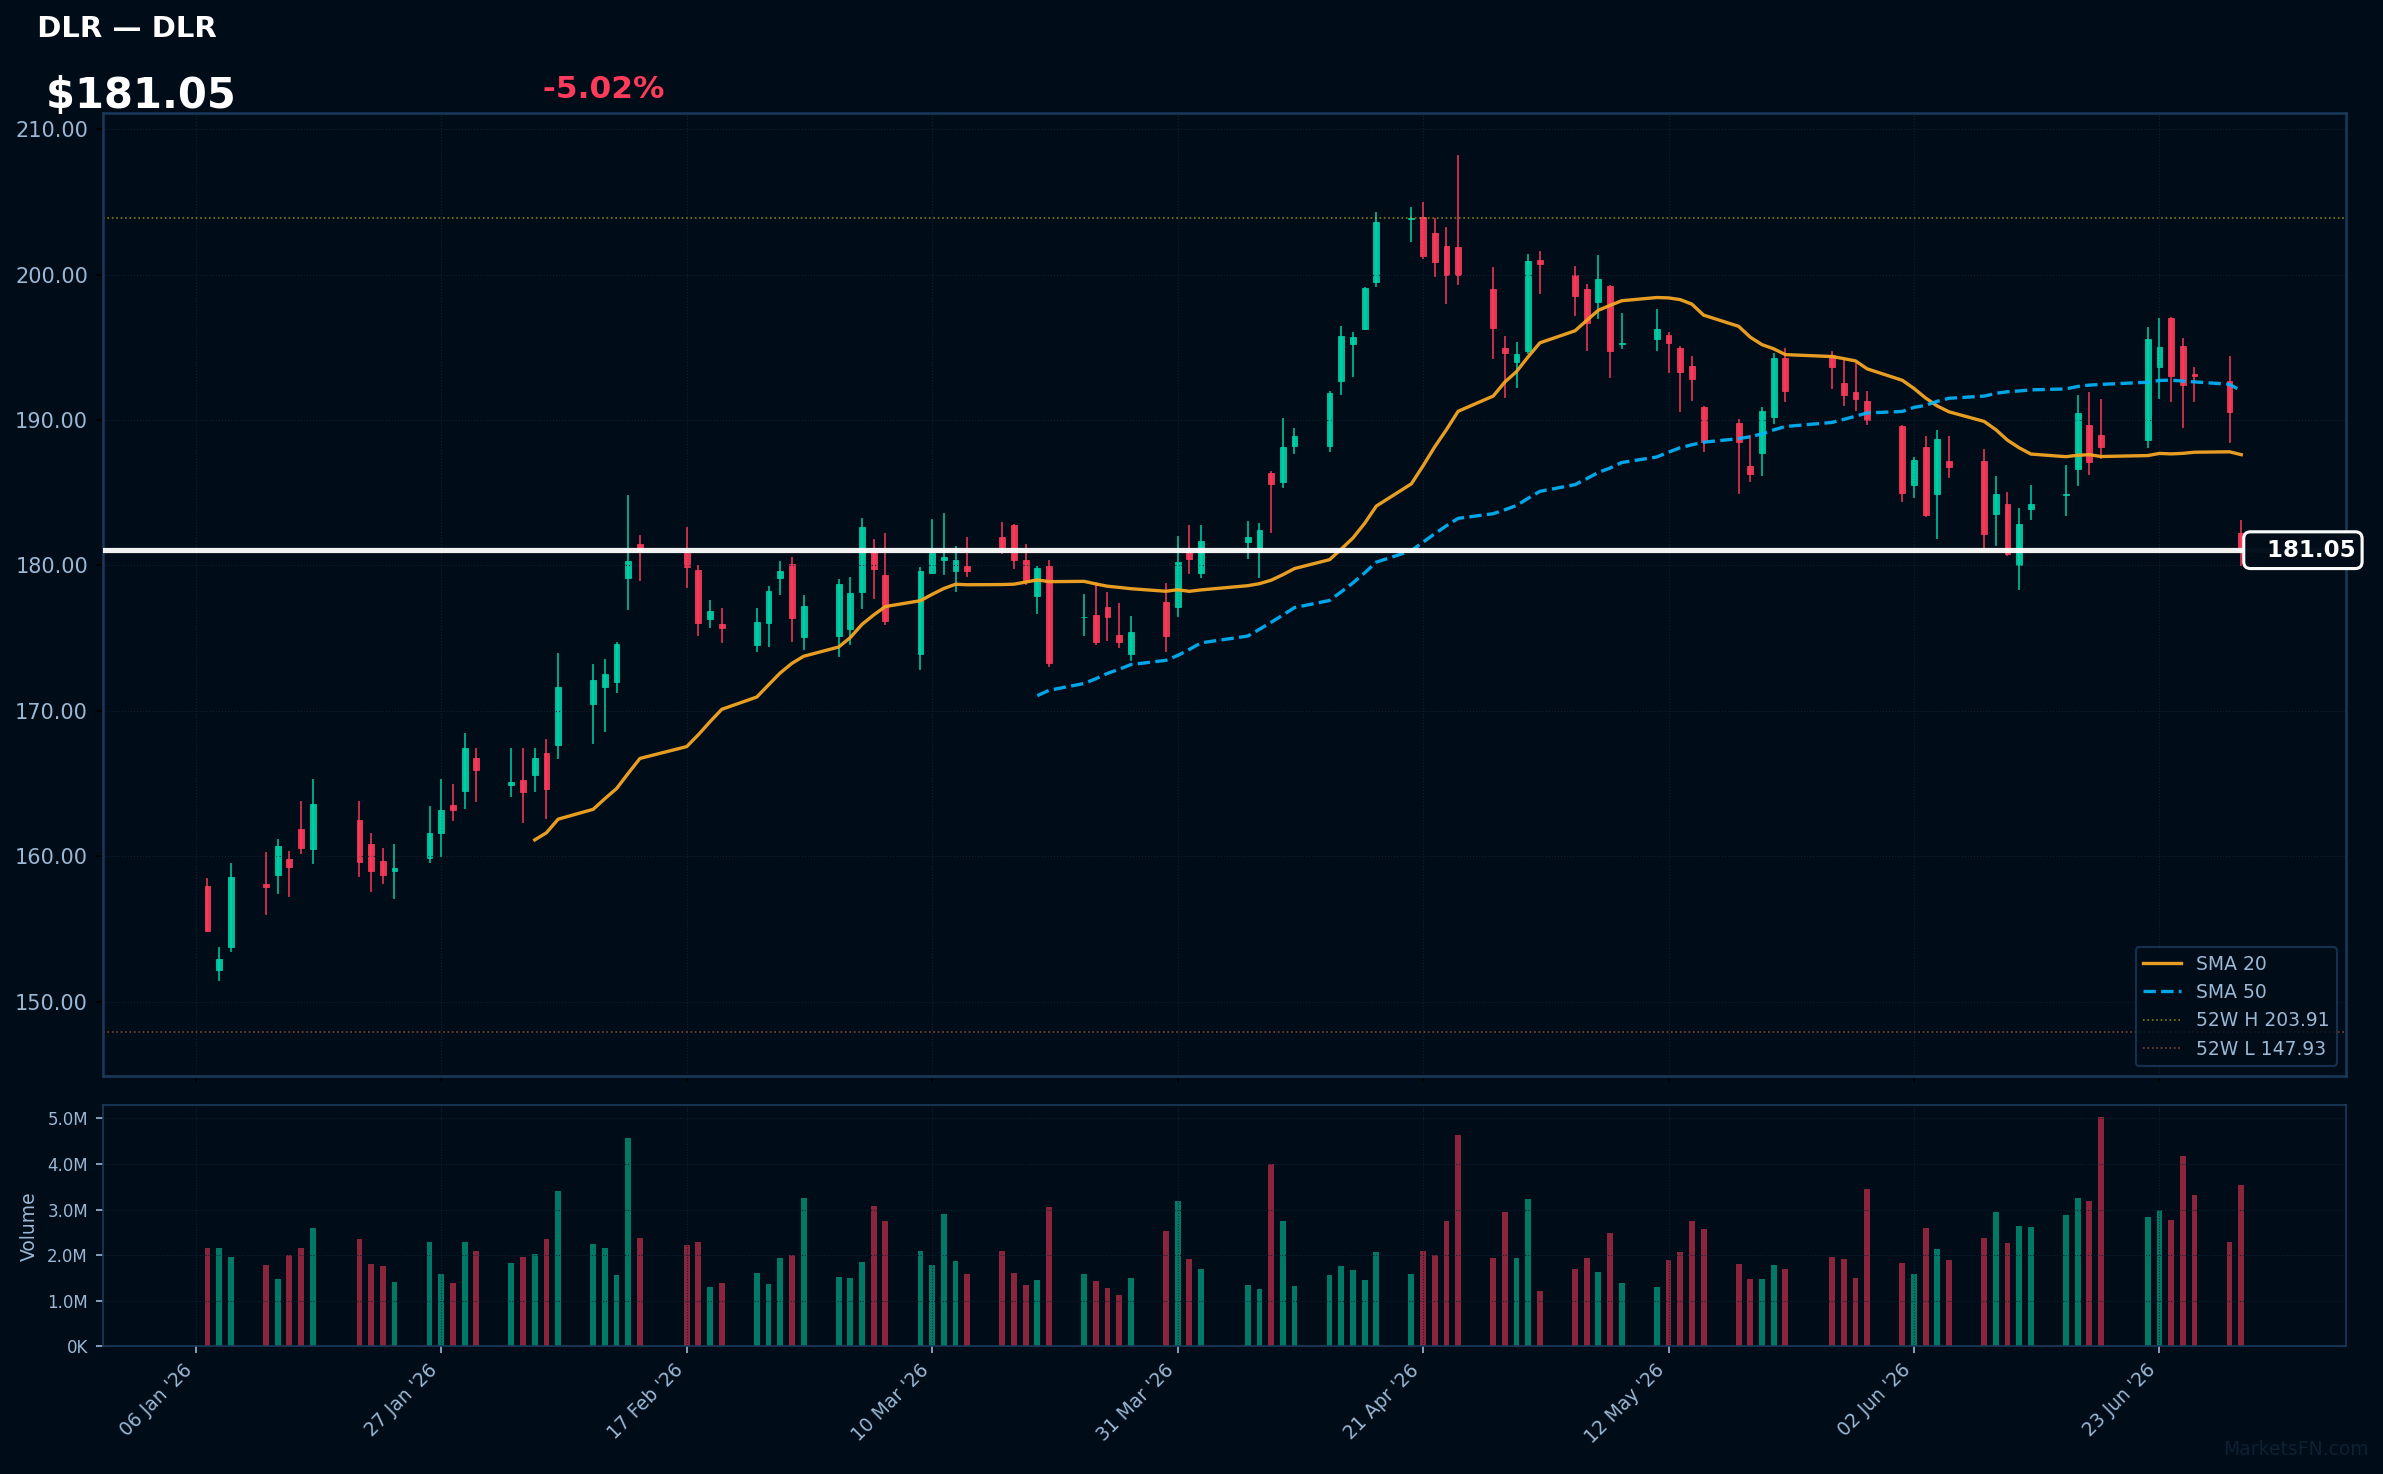
DLR | Digital Realty Trust Inc | Real Estate | Price: $181.01 | Day: -5.02% | 1W: -7.15% | 1M: -4.71% | RSI: 39.3 | vs MA200: +3.3% | Trend: Above MA200 · Below MA20, MA50
Recent headlines (last 12h)
- Digital Realty Prices Secondary Offering of Common Stock by Blackstone
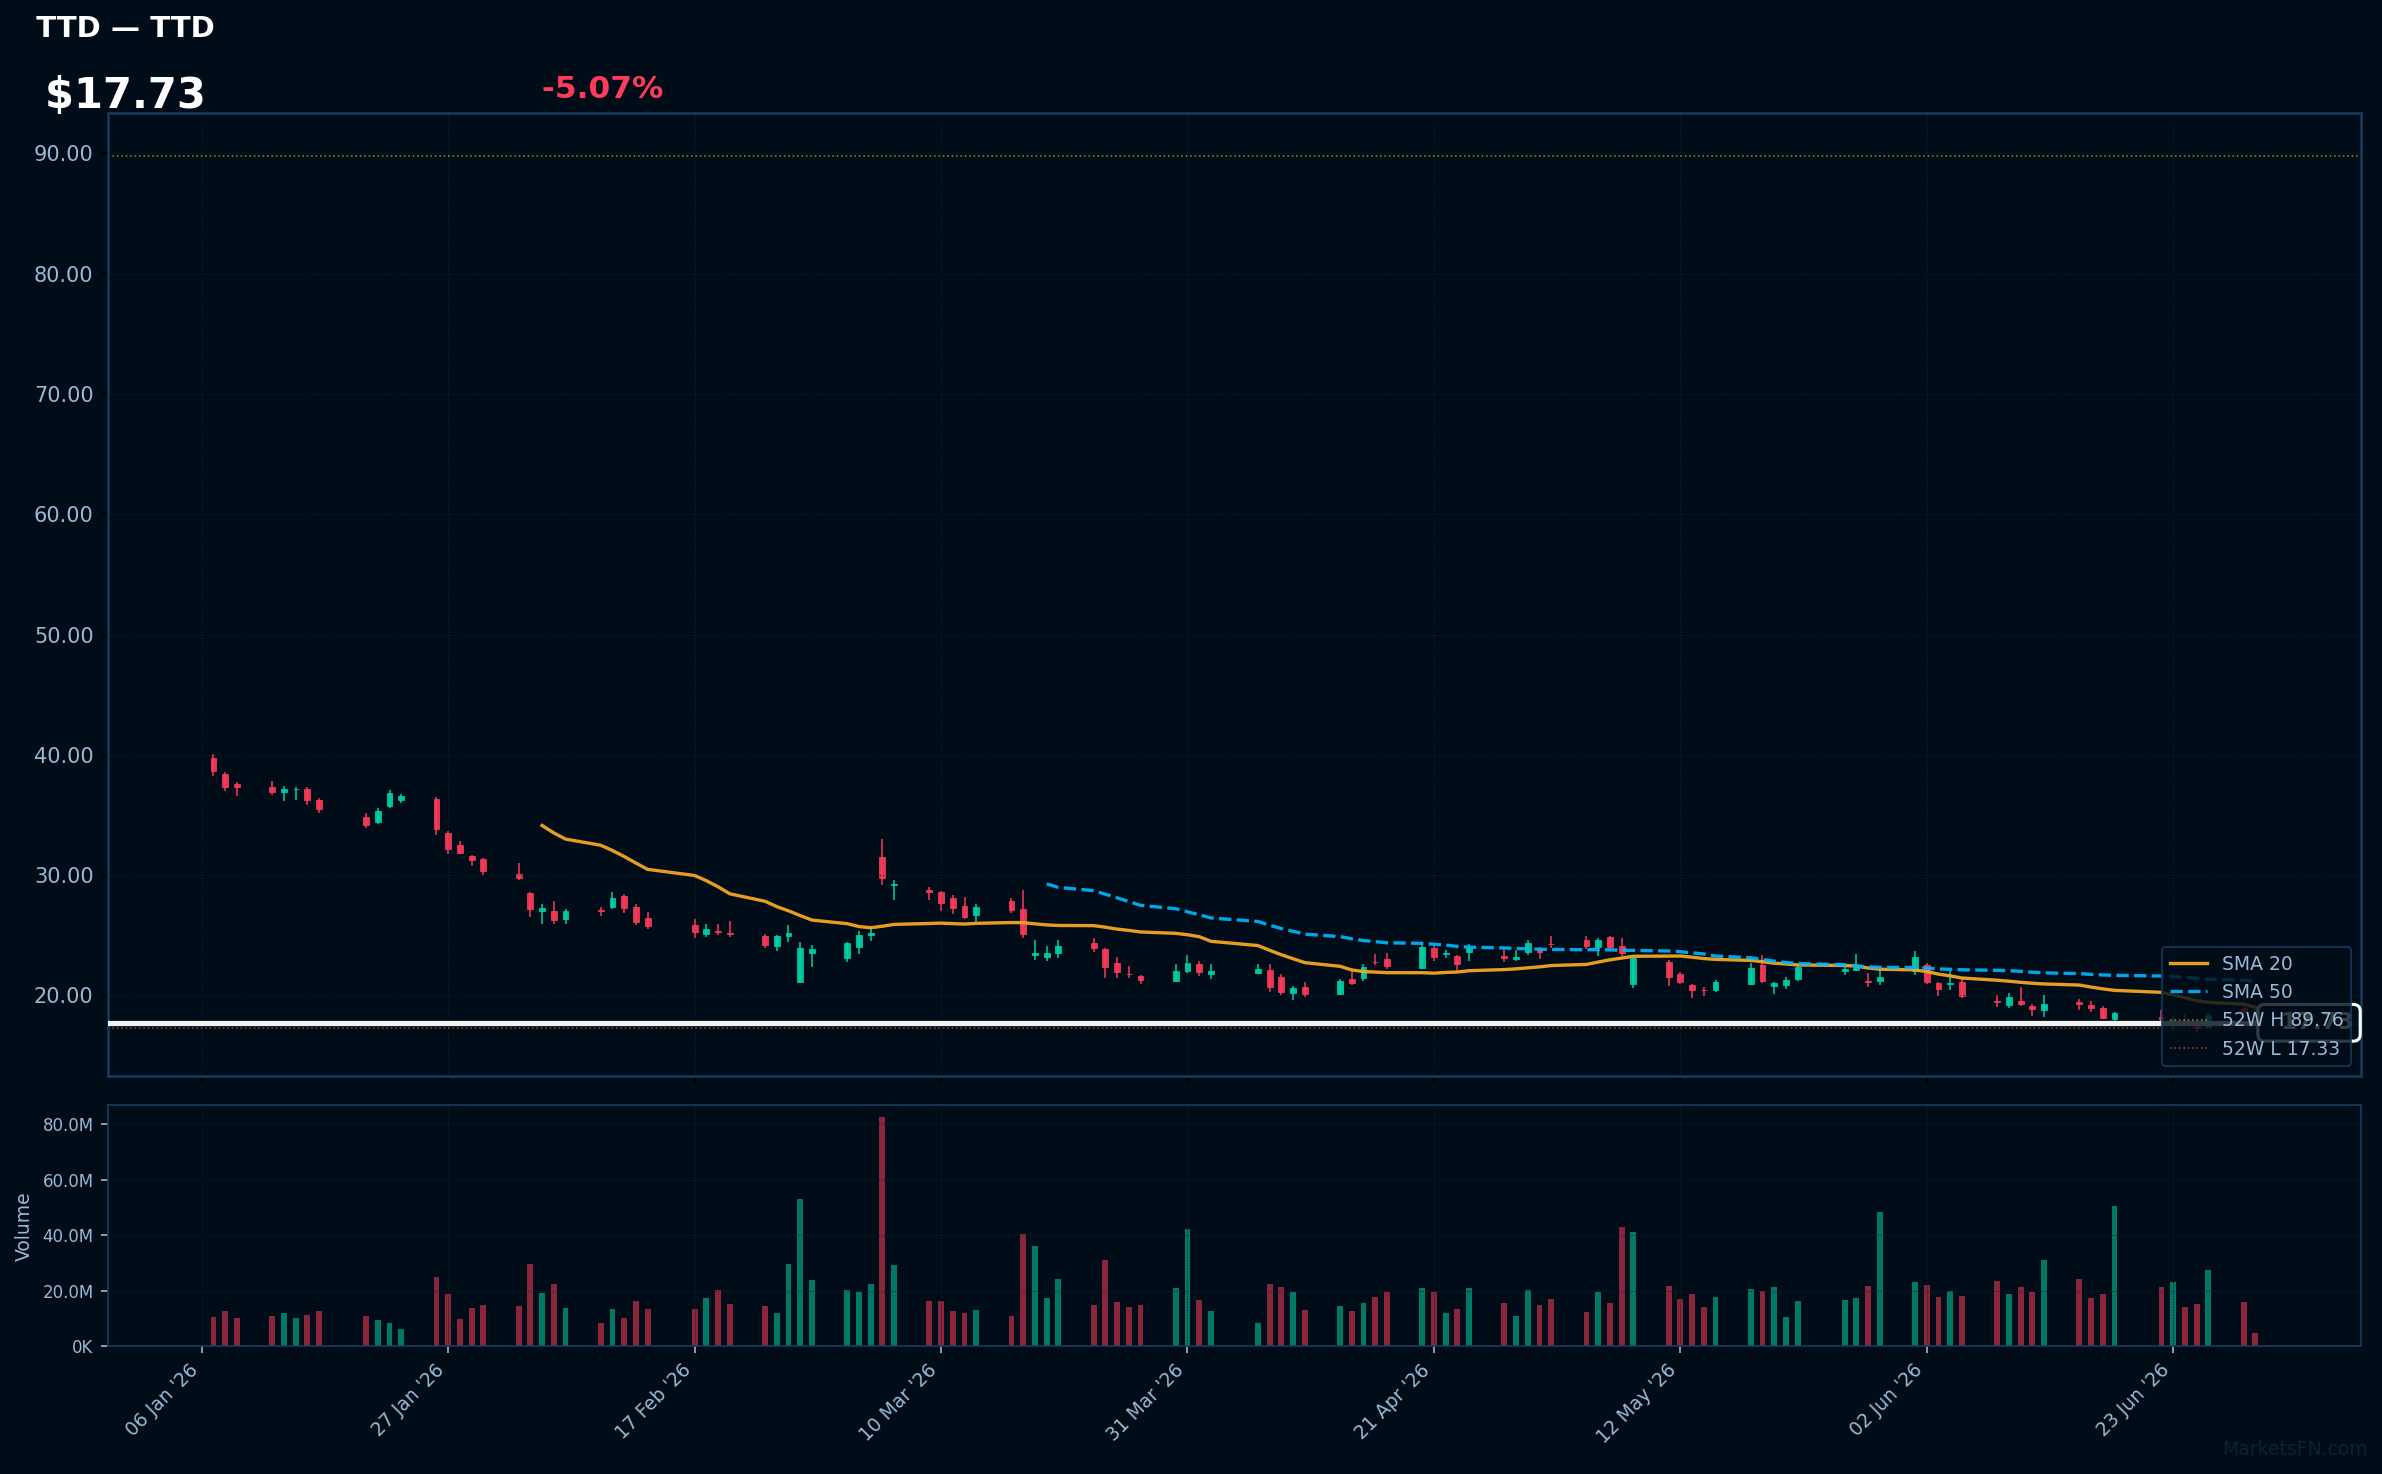
TTD | Trade Desk Inc | Communication Services | Price: $17.70 | Day: -5.07% | 1W: -1.14% | 1M: -17.79% | RSI: 38.3 | vs MA200: -45.7% | Trend: Below MA20, MA50, MA200
Recent headlines (last 12h)
- Goldman downgraded, Block upgraded: Wall Street's top analyst calls
- Trade Desk shares decline after Arete cuts rating to Sell (TTD)
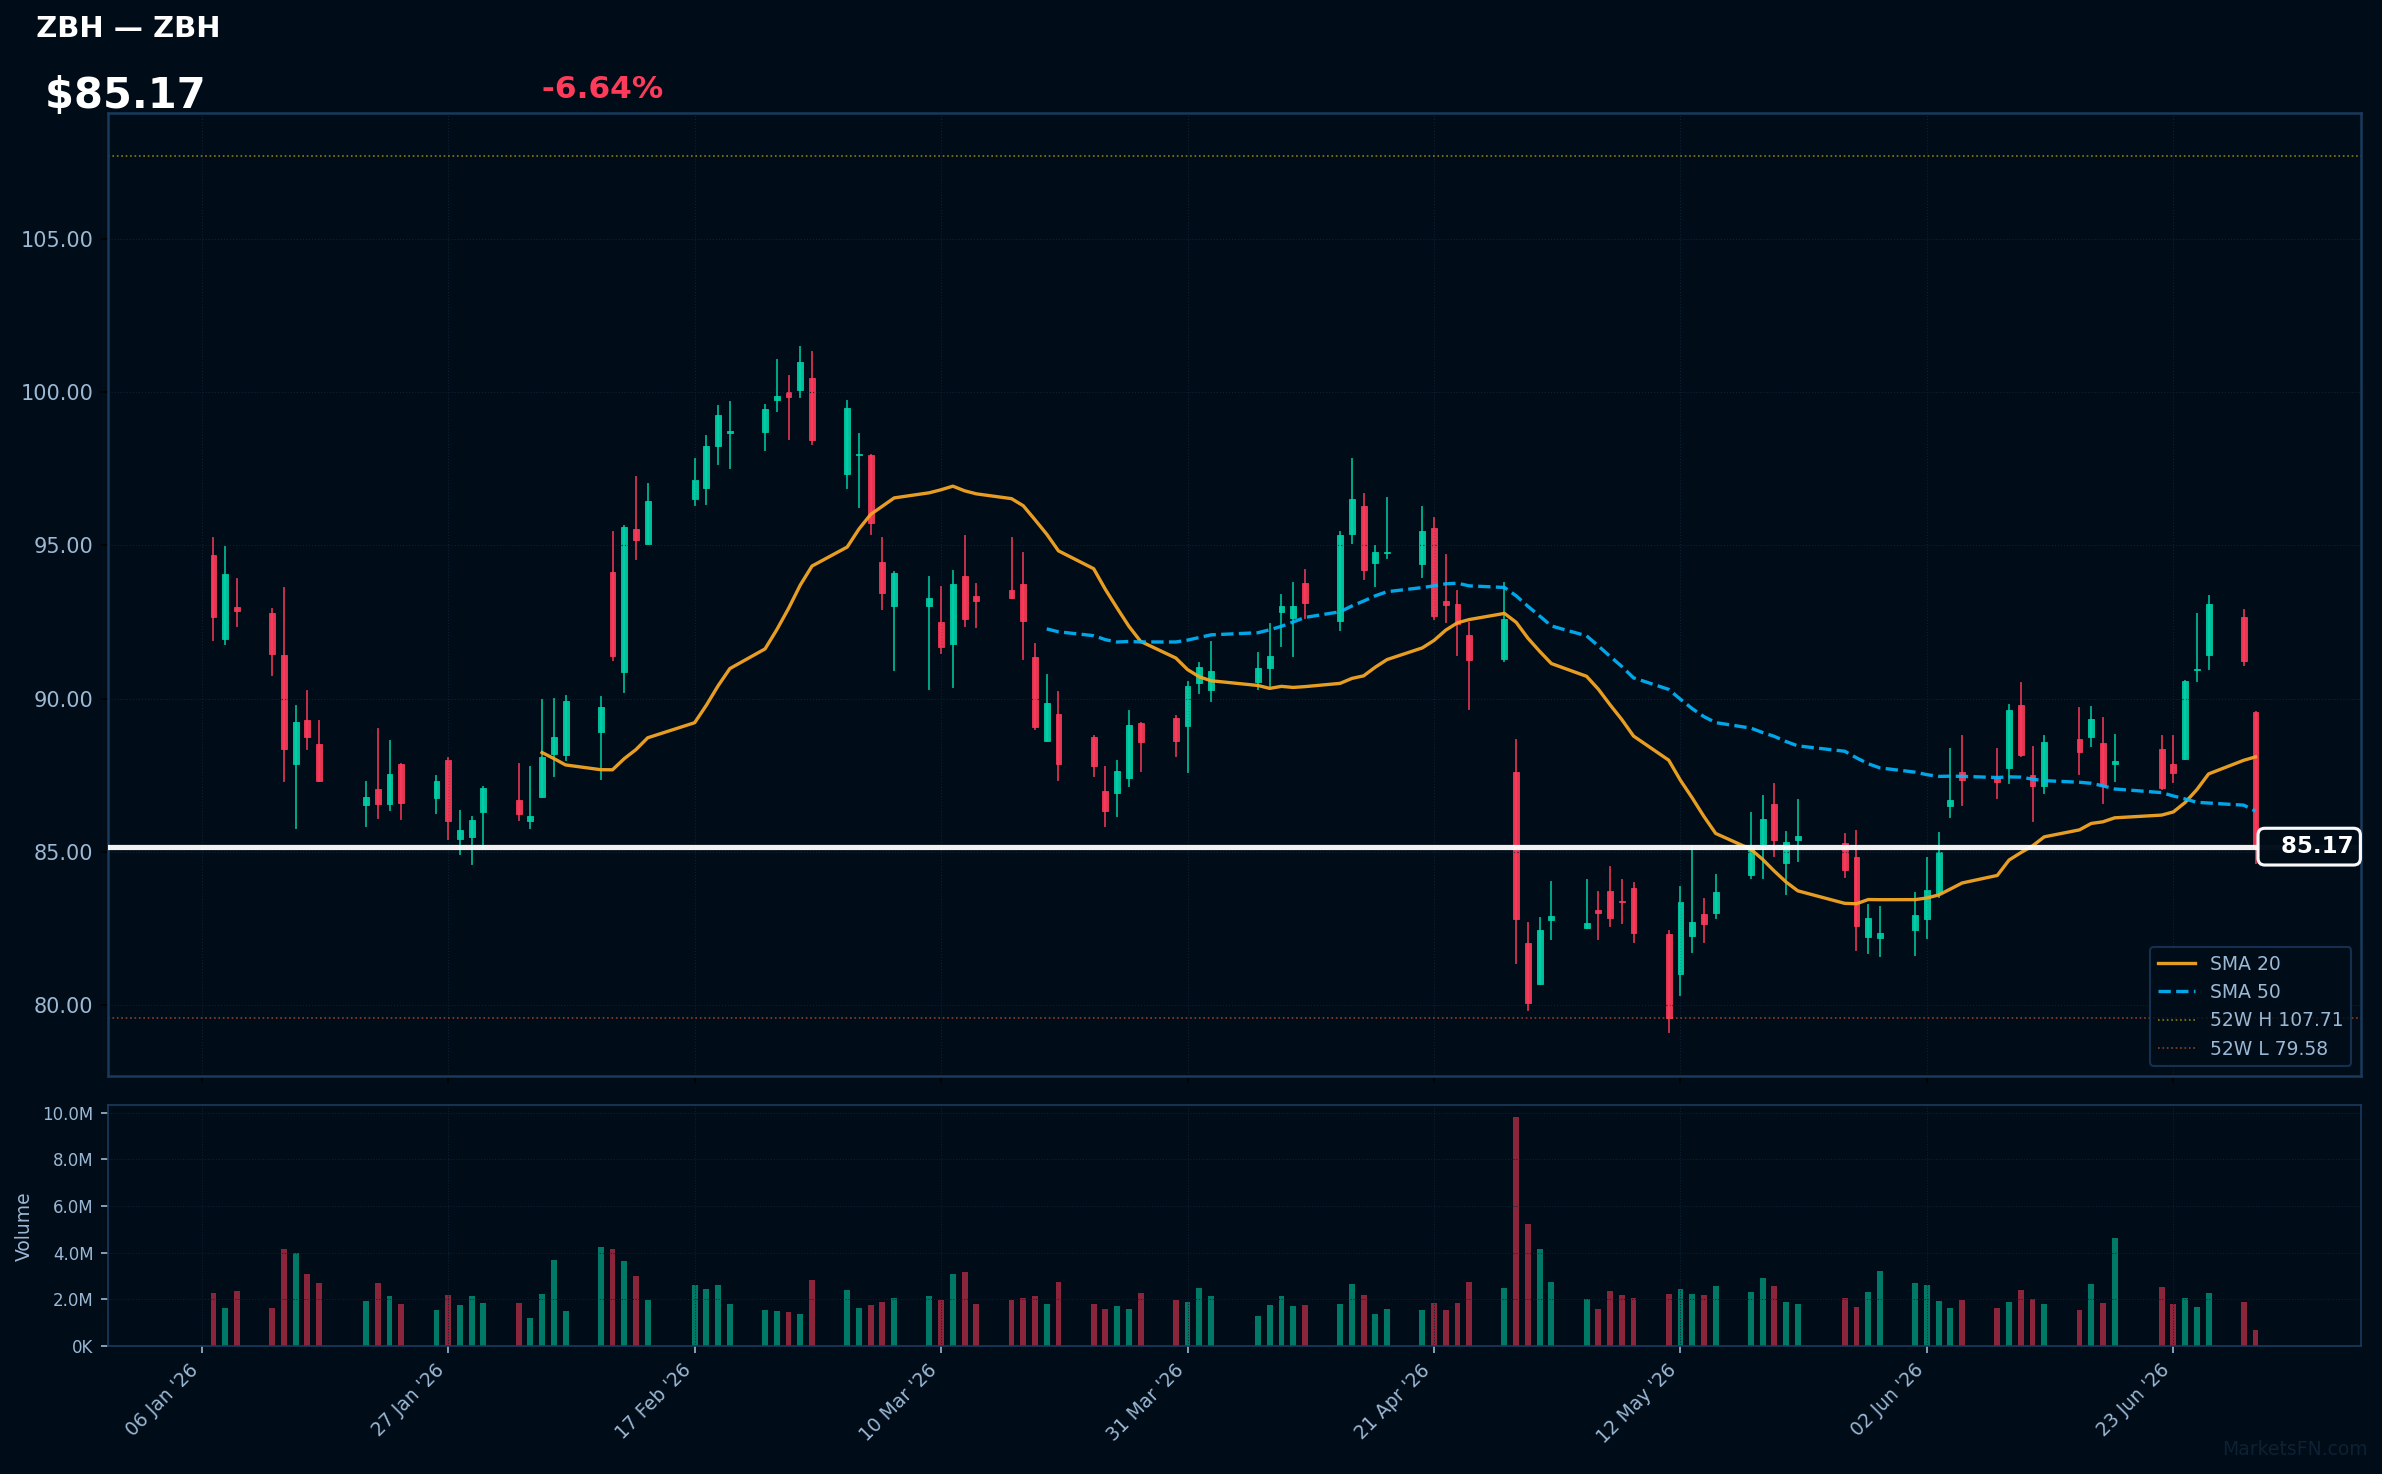
ZBH | Zimmer Biomet Holdings Inc | Healthcare | Price: $85.18 | Day: -6.64% | 1W: -2.75% | 1M: +3.44% | RSI: 43.8 | vs MA200: -7.4% | Trend: Below MA20, MA50, MA200
Market Commentary
The S&P 500's June 30, 2026 session saw a decidedly negative tone, with decliners outnumbering advancers 2:1, as 332 stocks (66.9%) fell versus 164 (33.1%) that rose. The average daily change was still positive at 0.34%, indicating a divergence between index performance and underlying breadth.
Sector rotation is evident in today's movers, with Technology and Industrials leading gains, while Healthcare, Communication Services, and Real Estate were among the worst performers. Top gainers like KLAC, AXON, and LRCX drove the Technology sector higher, while losers like TMUS, CHTR, and DLR weighed on Communication Services and Real Estate.
Traders should monitor the 2.4% of stocks trading above their MA200, a historically low level, as a potential risk indicator. A break higher could signal a broader market recovery, while continued weakness may pressure the index further. The next session's open will be critical in determining whether today's losers continue to underperform or if there's a rotation into these names.
Methodology
Daily ranking uses the latest session close versus the prior close. RSI (14-day EWM), MA20, MA50, and MA200 are computed from 12 months of daily OHLCV data sourced from Yahoo Finance. Charts show the last 120 trading sessions with SMA 20/50, 52-week H/L markers, and volume. Recent news (last 12 h) is sourced from FinViz. Updated every trading day.
Disclaimer
The content on MarketsFN.com is provided for educational and informational purposes only. It does not constitute financial advice, investment recommendations, or trading guidance. All investments involve risks, and past performance does not guarantee future results. You are solely responsible for your investment decisions and should conduct independent research and consult a qualified financial advisor before acting. MarketsFN.com and its authors are not liable for any losses or damages arising from your use of this information.
Related Articles
- Nasdaq 100 52-Week Highs & Lows Radar: ASML Holding NV (ASML), T-Mobile US (TMUS) and more — Nasdaq 100 stocks nearest to their 52-week high and low. Bloomberg-style charts, RSI/MA analysis and Grok commentary.
- S&P 500 52-Week Highs & Lows Radar: GE Aerospace (GE), T-Mobile US (TMUS) and more — S&P 500 stocks nearest to their 52-week high and low. Bloomberg-style charts, RSI/MA analysis and Grok commentary.
- Nasdaq 100 2026 YTD Highs & Lows Radar: Palo Alto Networks (PANW), T-Mobile US (TMUS) and more — Nasdaq 100 stocks nearest to their 2026 year-to-date high and low. Bloomberg-style charts, RSI/MA analysis and Grok…
- S&P 500 2026 YTD Highs & Lows Radar: Lilly(Eli) & (LLY), T-Mobile US (TMUS) and more — S&P 500 stocks nearest to their 2026 year-to-date high and low. Bloomberg-style charts, RSI/MA analysis and Grok…
- Constellation Brands (STZ) 2026 Financial Results Summary — Constellation Brands (STZ) Q1 2026: Board Refresh with New Director — Positive Strategic Move Constellation Brands,…