Nasdaq 100 2026 YTD Highs & Lows Radar: PayPal (PYPL), Electronic Arts, (EA) and more
MarketsFN Team

Nasdaq 100 2026 YTD Highs & Lows Radar: PayPal (PYPL), Electronic Arts, (EA) and more
Screening all 101 Nasdaq 100 constituents for stocks nearest to their 2026 year-to-date high and their 2026 YTD low. Data as of August 17, 2026. % Realized = total return since Jan 1 2026.
Legend: RSI > 70 = overbought · RSI < 30 = oversold · Green % Realized = positive YTD return · Red = negative.
📈 Nearest to 2026 High
Sectors represented: Consumer Cyclical (2), Financial (1), Communication Services (1), Healthcare (1)
| Ticker | Company | Sector | Price Last | % Realized | 2026 YTD High Date | RSI | % above MA200 | Trend |
|---|---|---|---|---|---|---|---|---|
| PYPL | PayPal Holdings Inc | Financial | $61.66 | +6.05% | 2026-08-14 | 70.1 | +19.5% | Above MA20, MA50, MA200 |
| EA | Electronic Arts, Inc | Communication Services | $209.70 | +0.38% | 2026-08-04 | — | — | — |
| ABNB | Airbnb Inc | Consumer Cyclical | $184.06 | +38.38% | 2026-08-13 | 72.7 | +36.3% | Above MA20, MA50, MA200 |
| AMGN | AMGEN Inc | Healthcare | $415.21 | +26.73% | 2026-08-13 | 69.8 | +18.6% | Above MA20, MA50, MA200 |
| SBUX | Starbucks Corp | Consumer Cyclical | $107.69 | +28.25% | 2026-08-13 | 57.3 | +12.1% | Above MA20, MA50, MA200 |
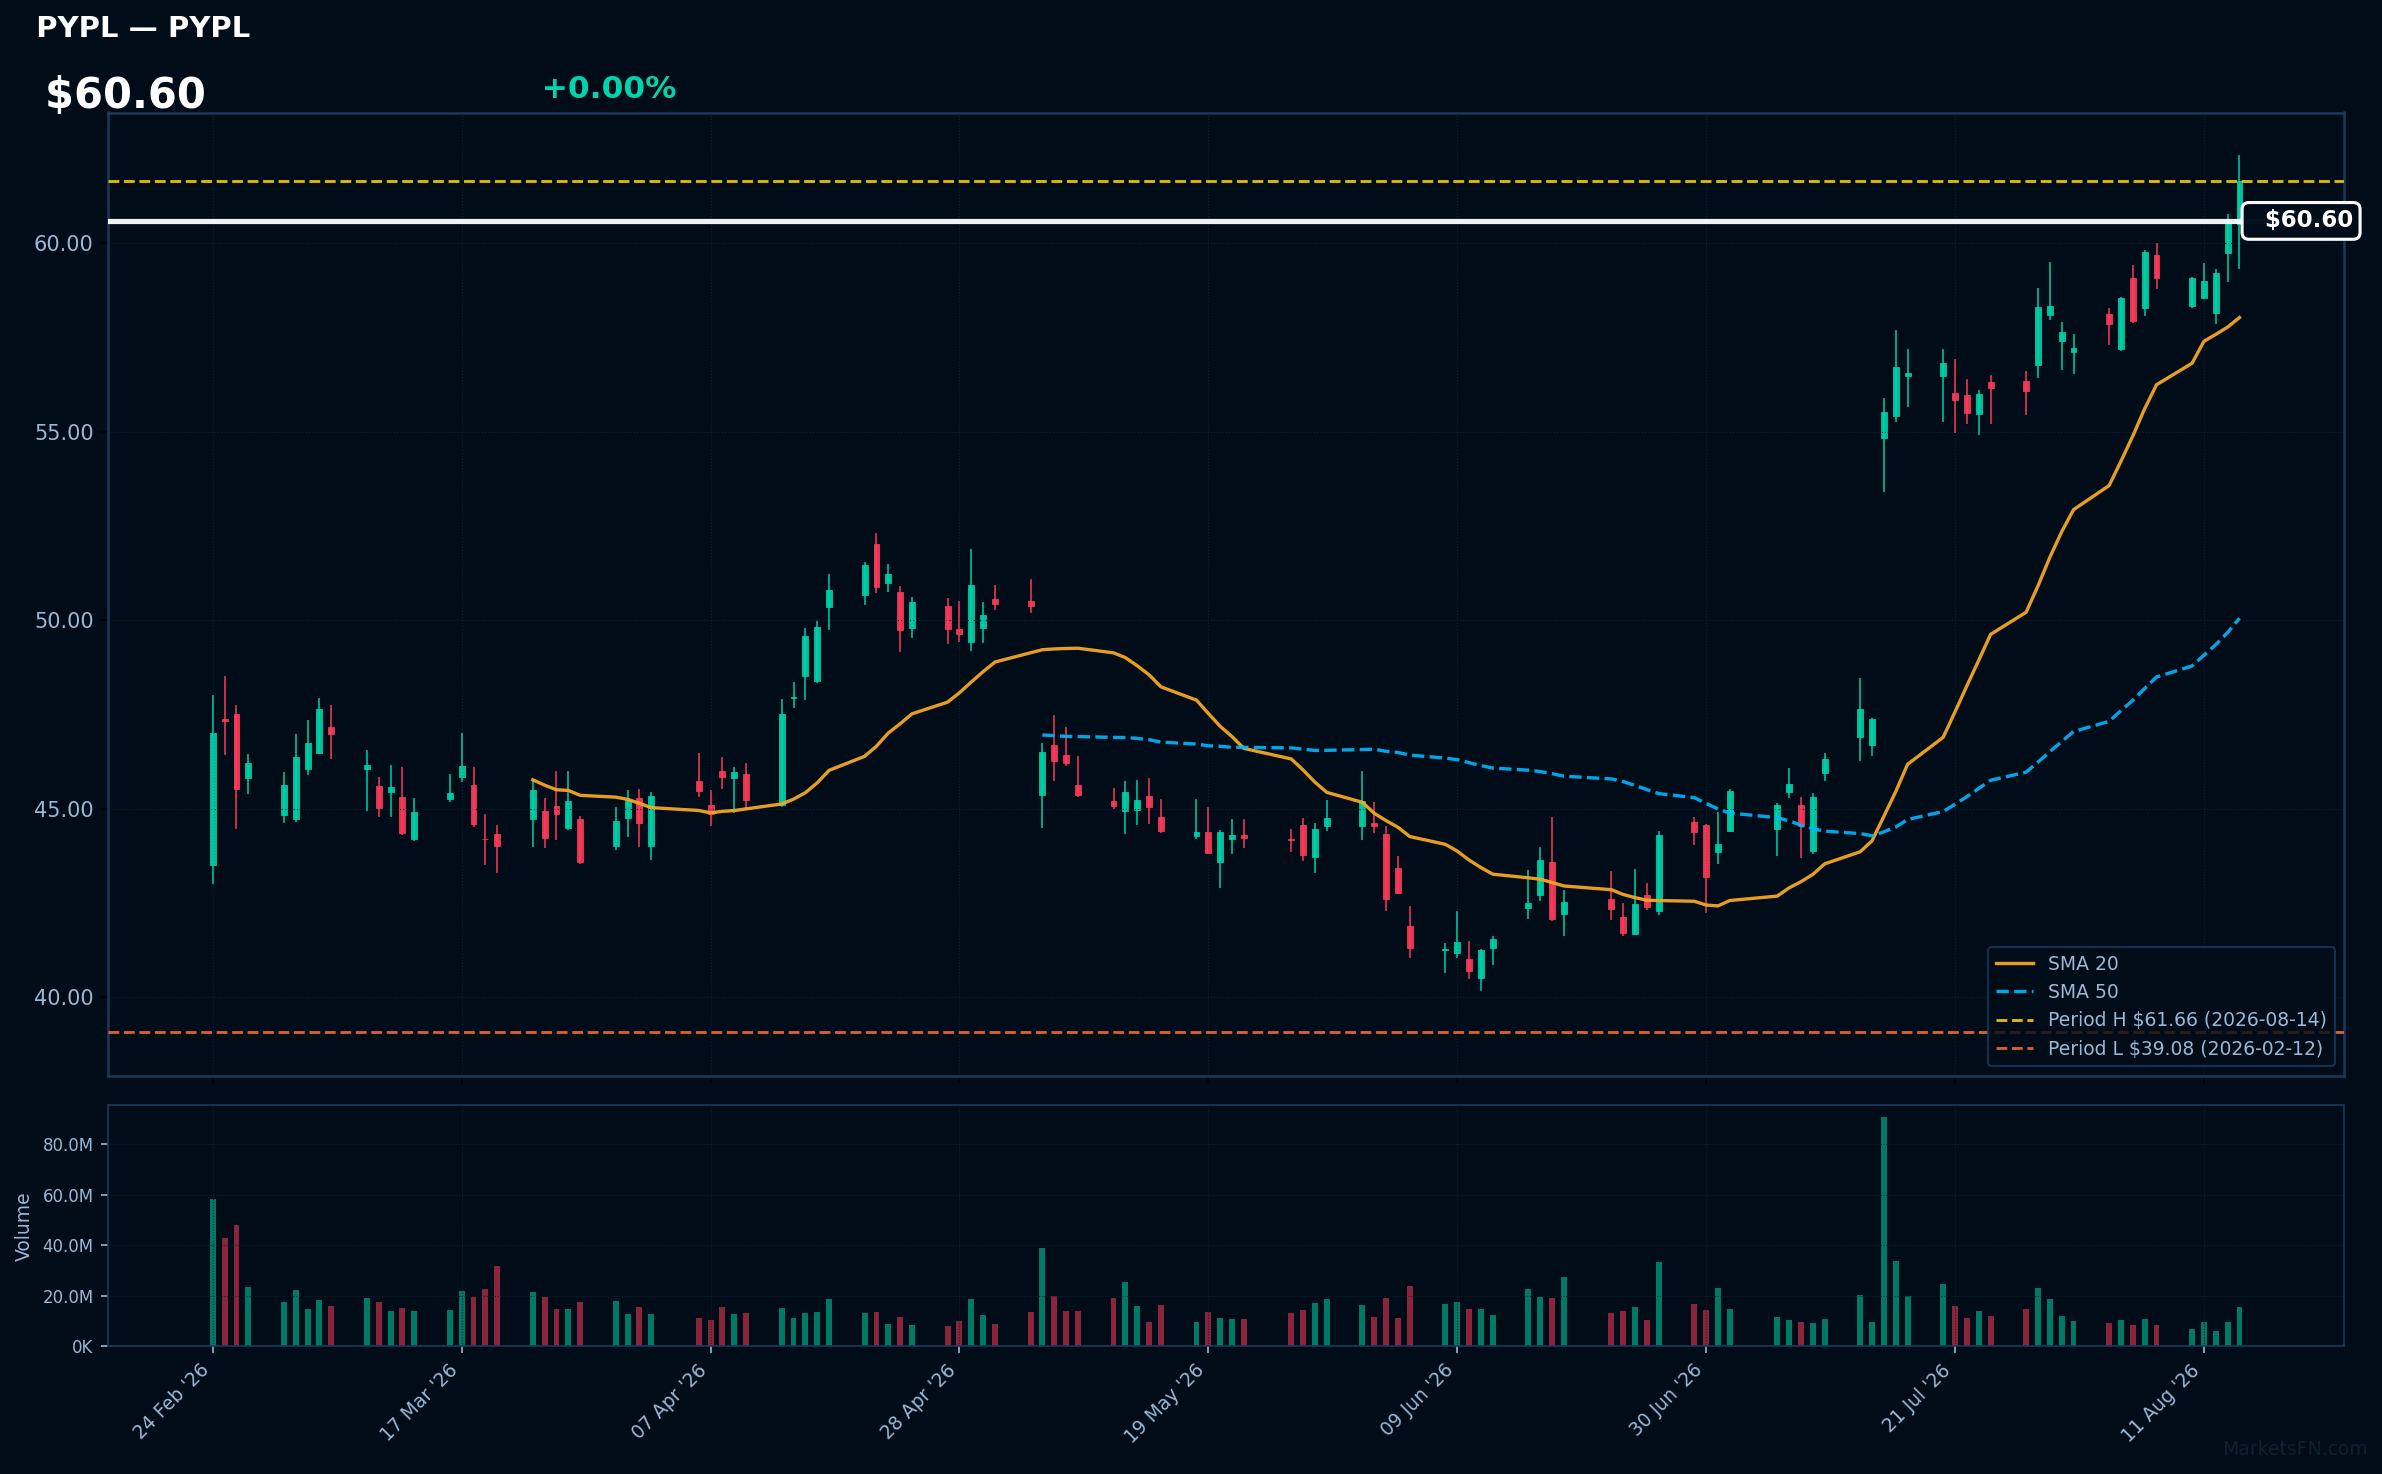
PYPL | PayPal Holdings Inc | Financial | Price Last: $61.66 | % Realized: +6.05% | RSI: 70.1 | % above MA200: +19.5% | Trend: Above MA20, MA50, MA200
PayPal Holdings Inc provides digital payment solutions, enabling consumers and merchants to transact online securely. Investors should care due to its significant market presence and ongoing innovations in fintech, which can drive future growth and profitability.
Currently, PayPal's RSI(14) is 70.1, indicating overbought conditions. The mixed signals from MA alignment—price above MA20/MA50/MA200—suggest potential volatility ahead, despite a 6.1% return over 2026 YTD.
Related headlines
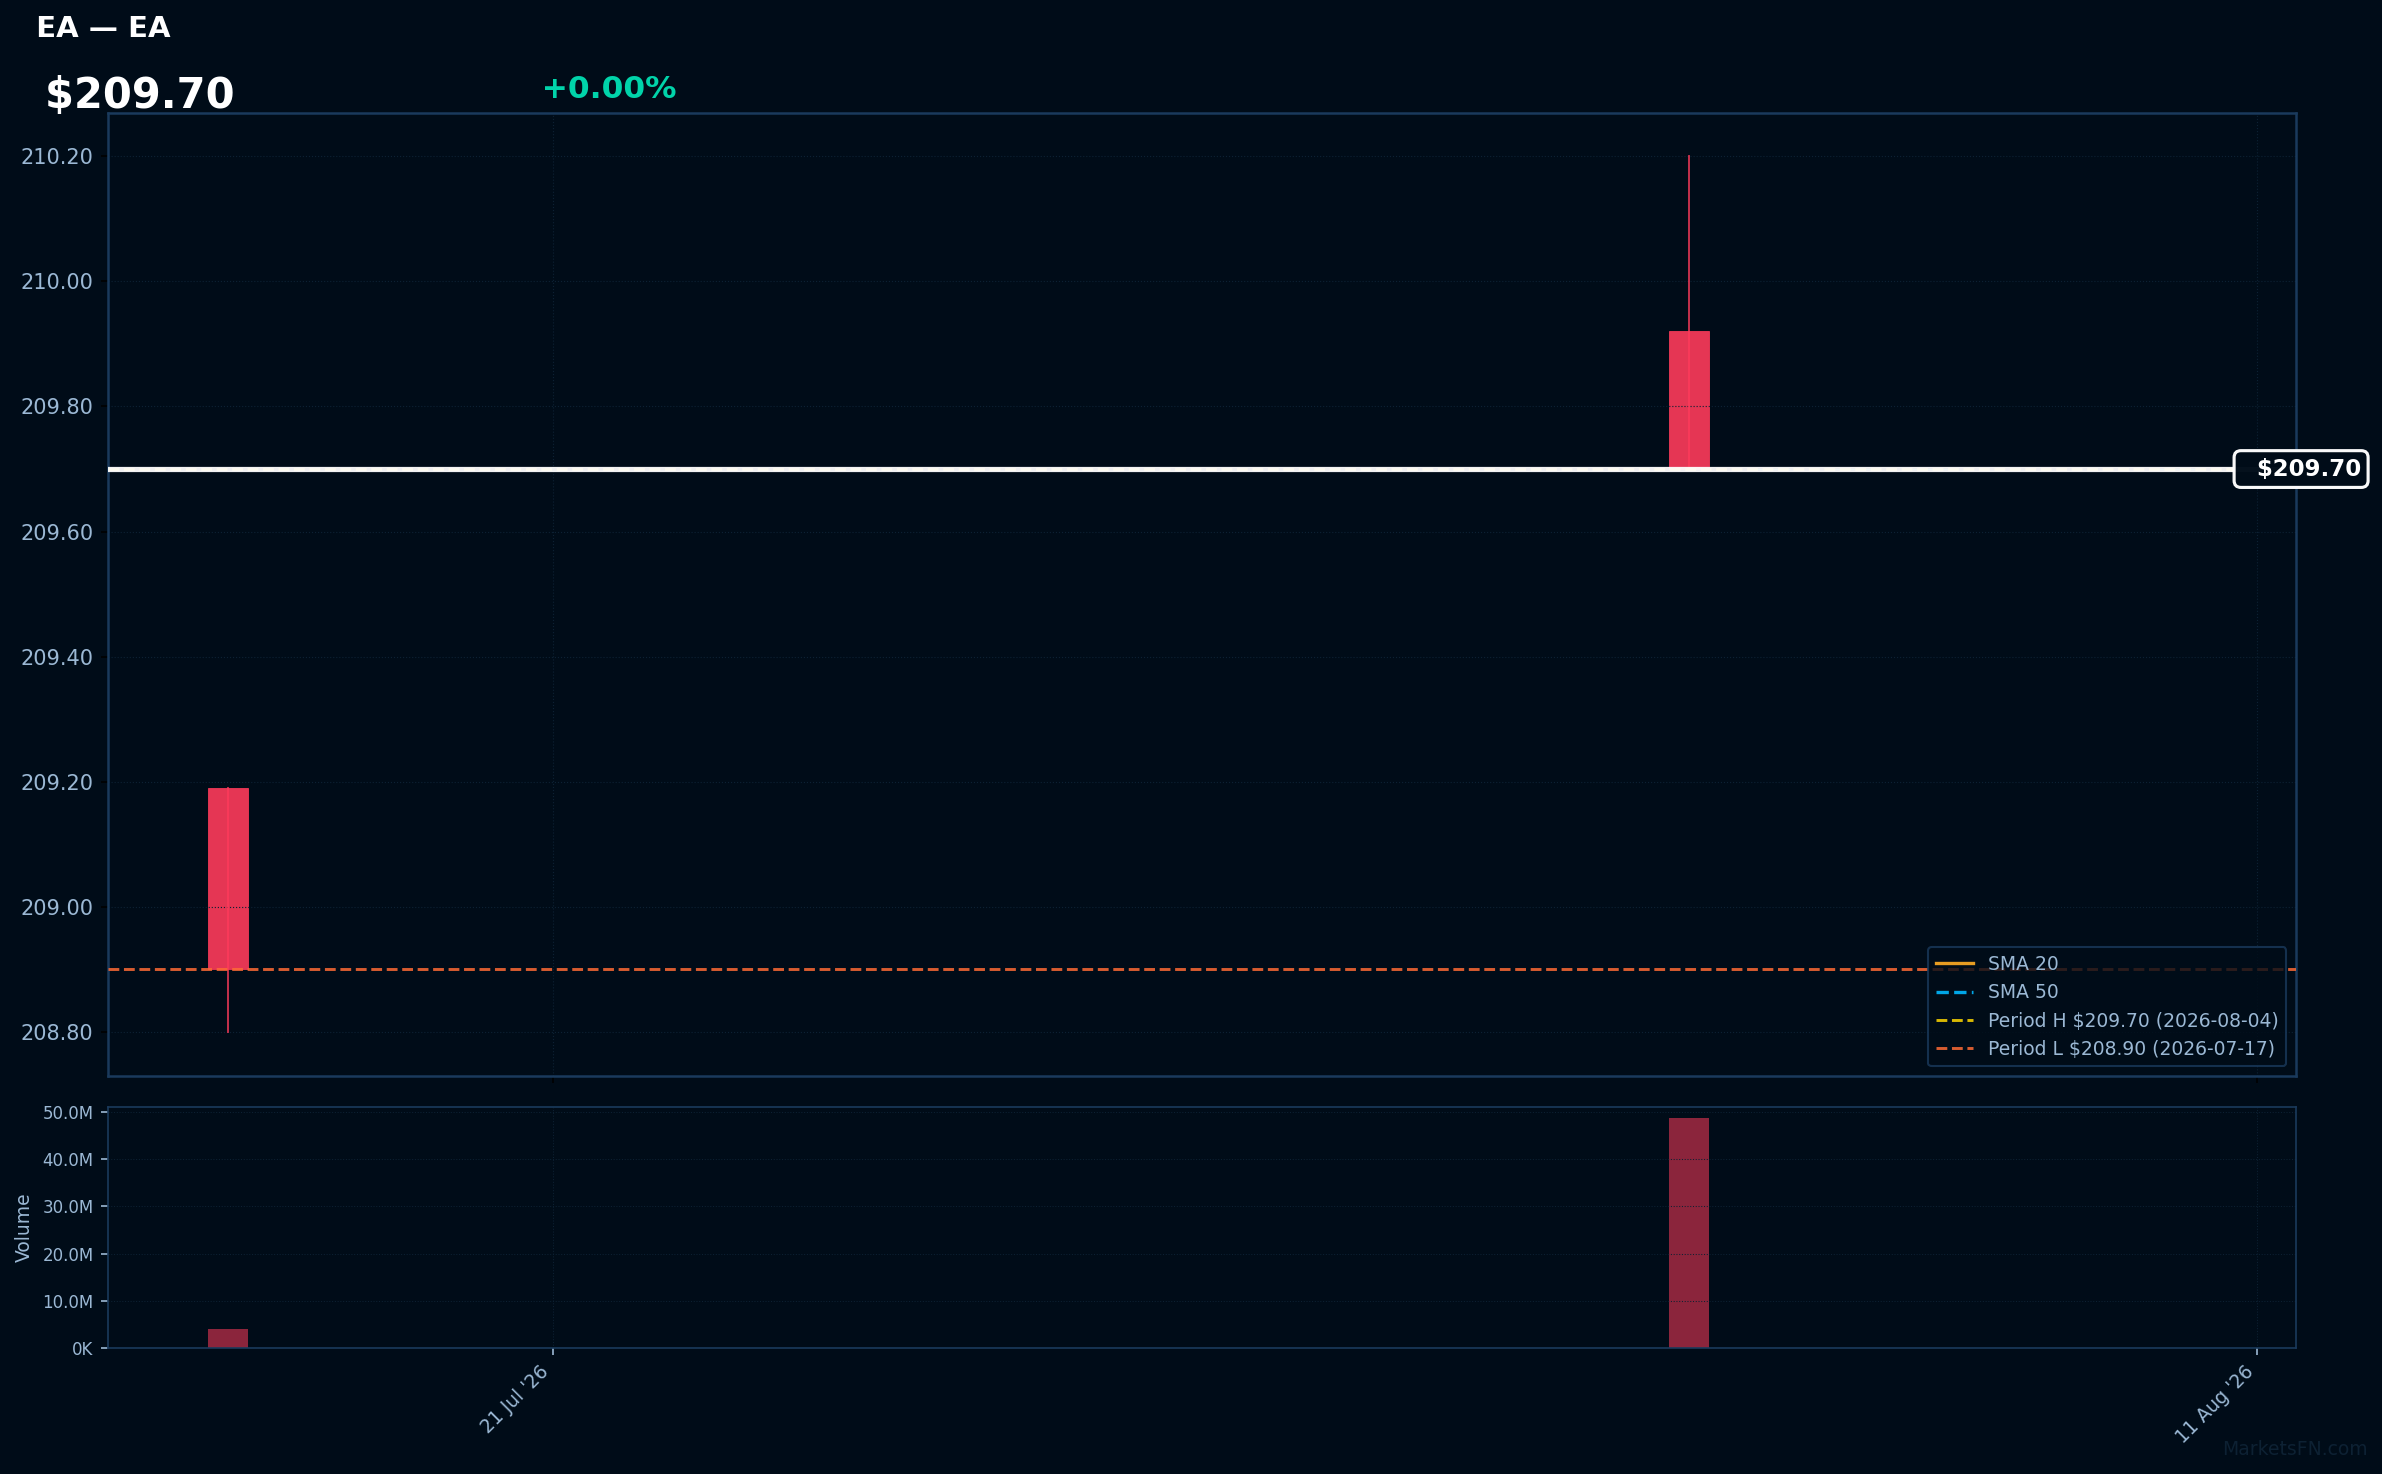
EA | Electronic Arts, Inc | Communication Services | Price Last: $209.70 | % Realized: +0.38% | RSI: — | % above MA200: — | Trend: —
Electronic Arts, Inc. develops and publishes interactive entertainment software, known for franchises like FIFA and The Sims. Investors should care due to its strong brand portfolio and potential for revenue growth in the gaming industry, particularly with ongoing trends in digital gaming and esports.
The stock is 0.0% below its 2026 YTD high, indicating a potential breakout level. However, RSI(14) data is N/A, and MA alignment is incomplete, limiting the assessment of momentum or fundamental strength.
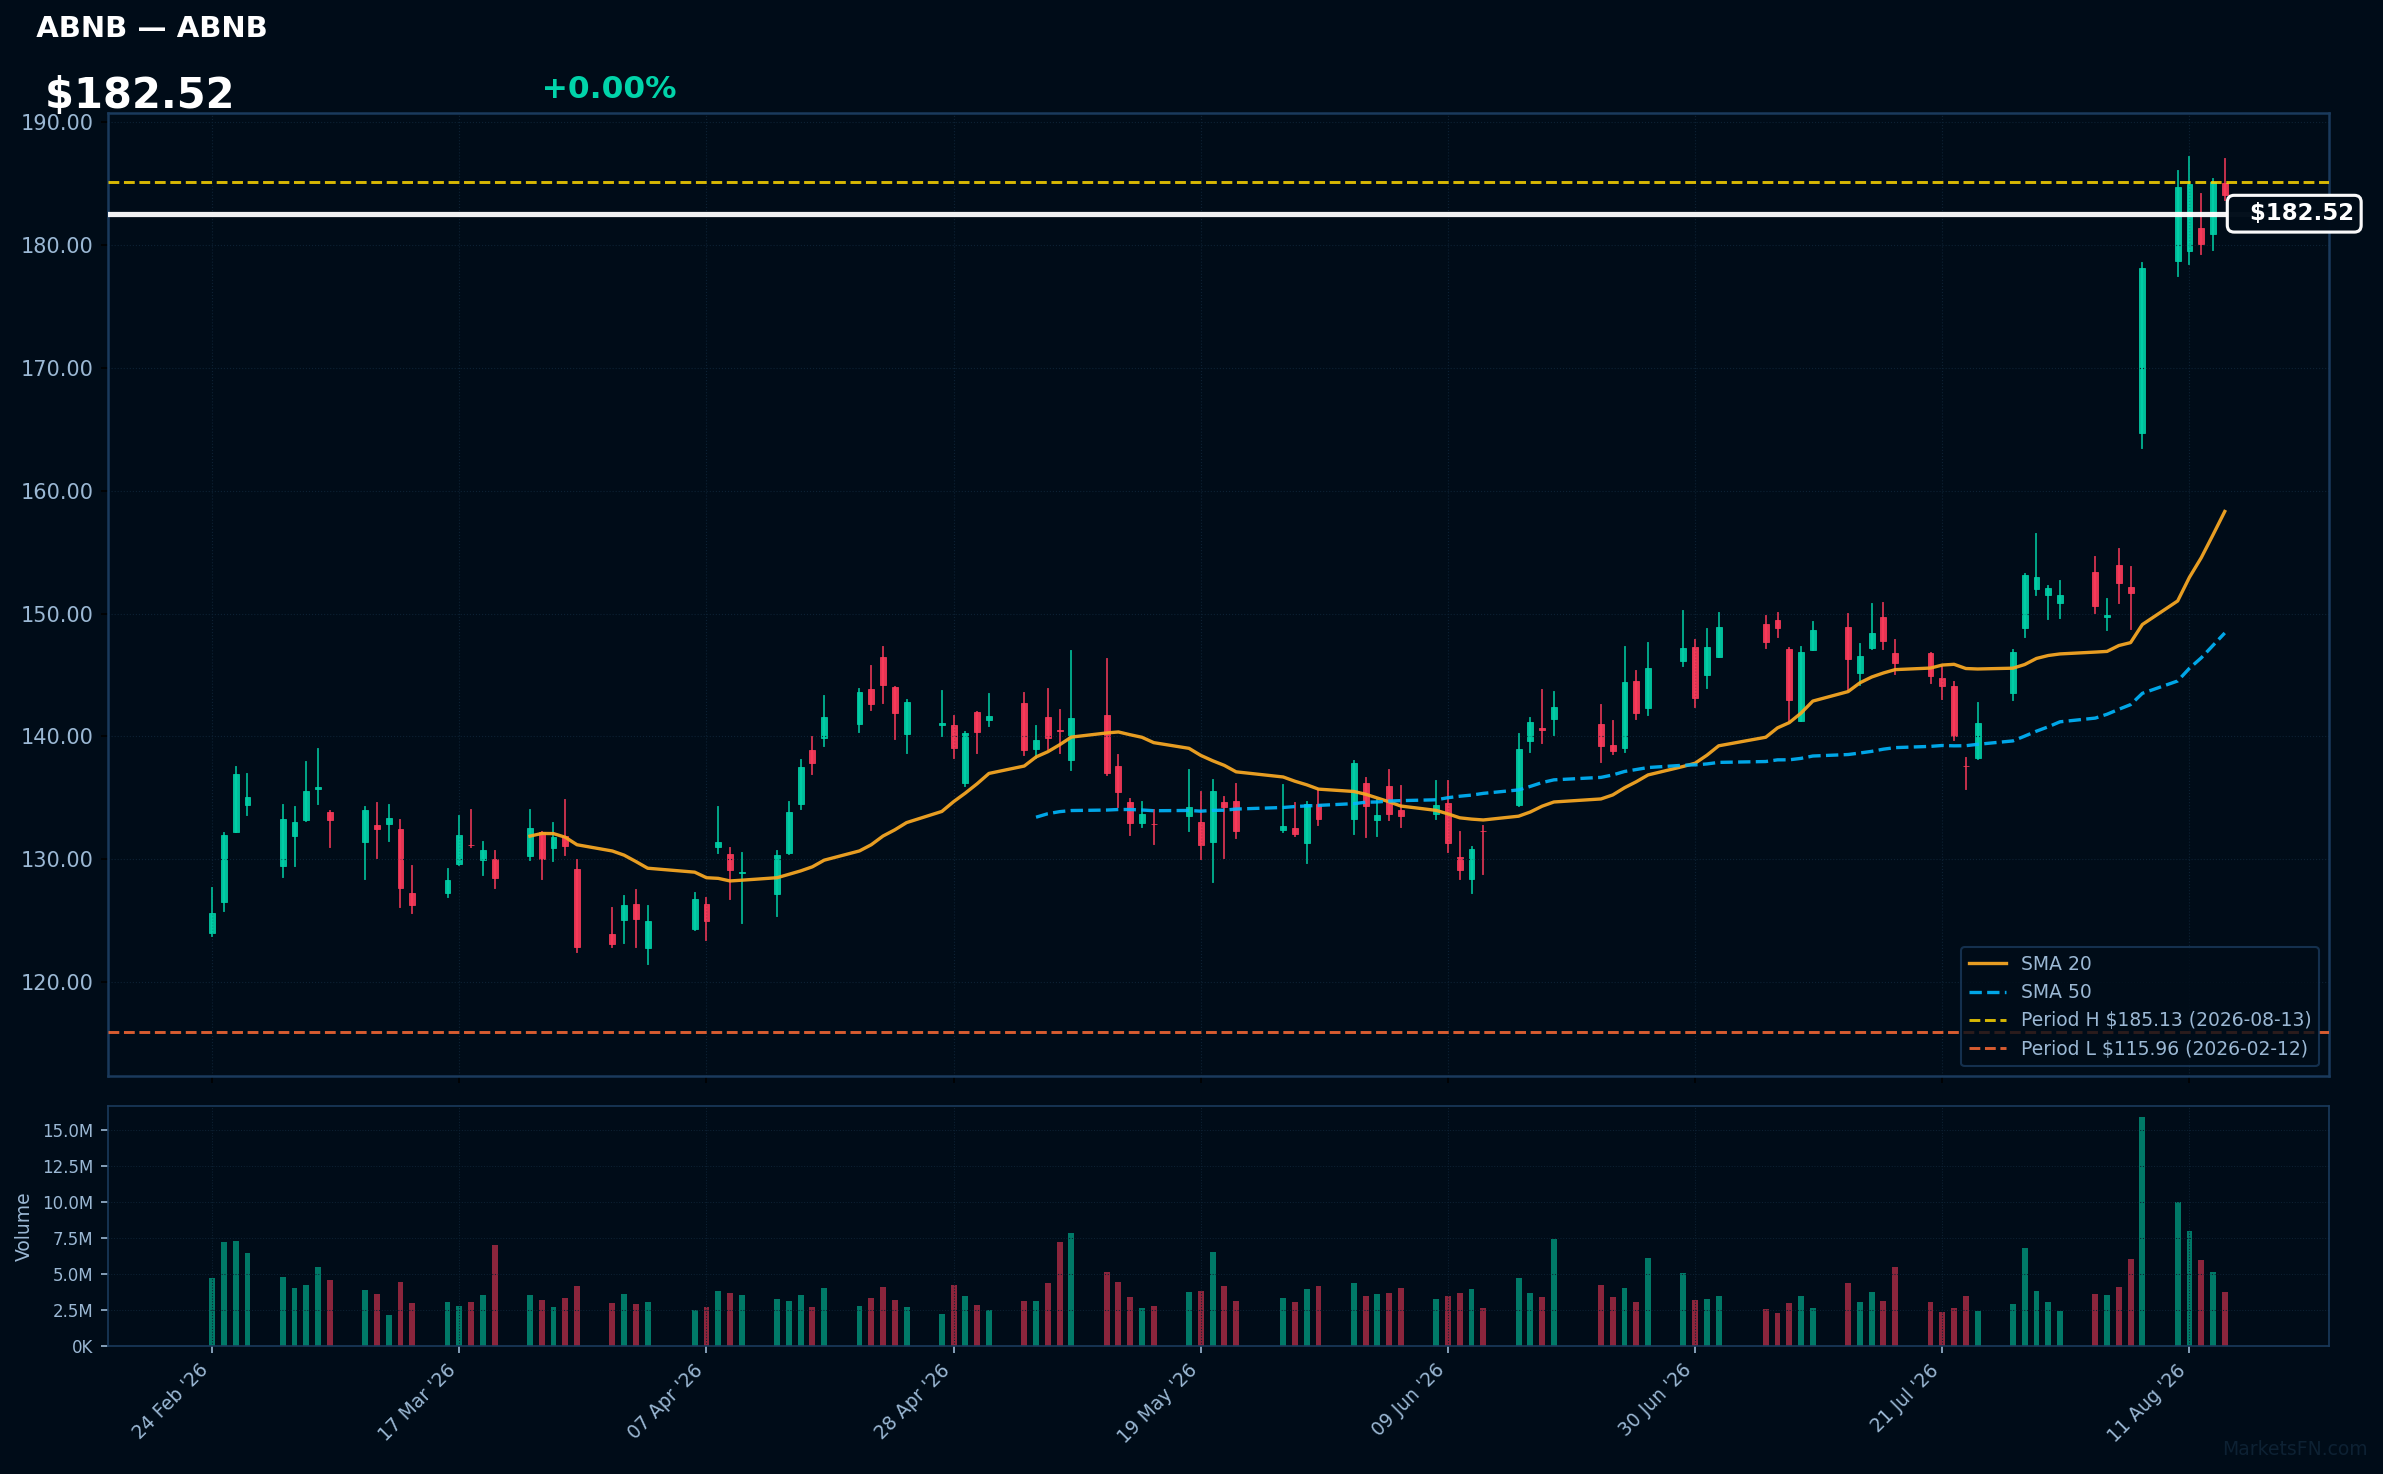
ABNB | Airbnb Inc | Consumer Cyclical | Price Last: $184.06 | % Realized: +38.38% | RSI: 72.7 | % above MA200: +36.3% | Trend: Above MA20, MA50, MA200
Airbnb Inc (ABNB) operates an online marketplace for lodging, primarily short-term rentals. Investors should care due to its innovative platform that disrupts traditional hospitality, enabling hosts to monetize spaces while offering travelers unique accommodations worldwide.
The current technical situation shows bullish momentum with an RSI(14) of 72.7 and a strong MA alignment: price > MA20 > MA50 > MA200, indicating a sustained uptrend.
Related headlines
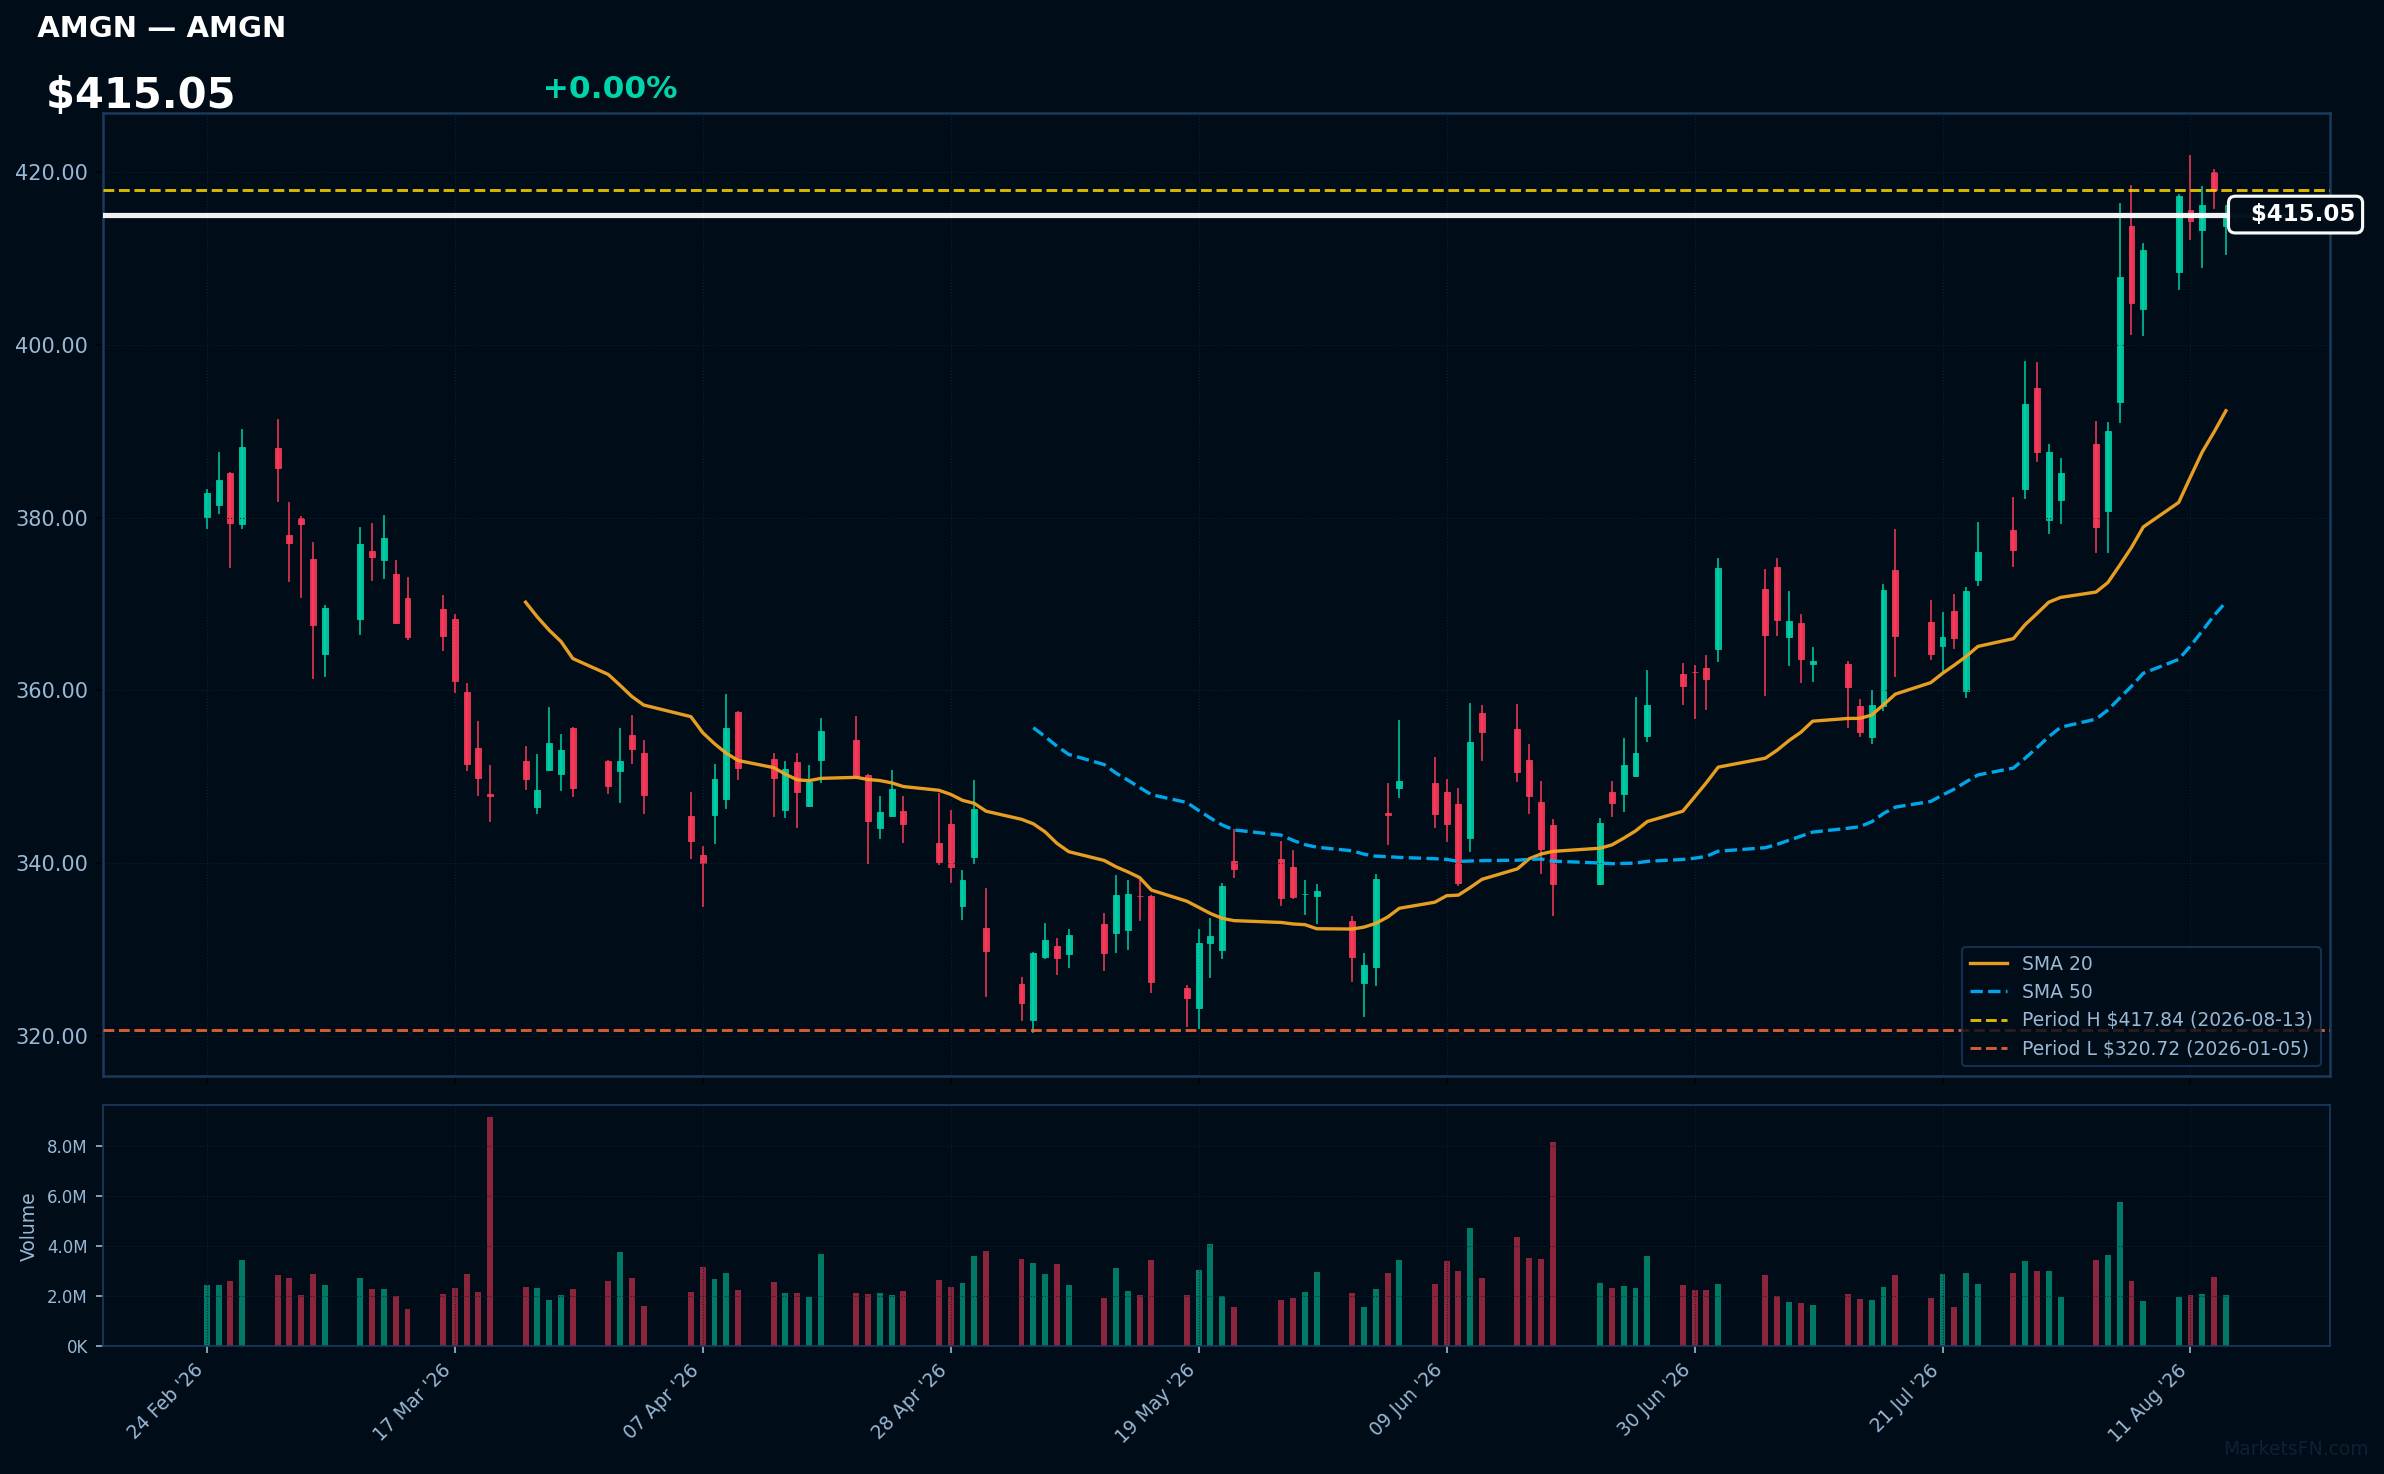
AMGN | AMGEN Inc | Healthcare | Price Last: $415.21 | % Realized: +26.73% | RSI: 69.8 | % above MA200: +18.6% | Trend: Above MA20, MA50, MA200
AMGEN Inc (AMGN) is a biotechnology company focused on developing innovative therapies for serious illnesses, particularly in oncology and cardiovascular diseases. Investors should care due to its strong pipeline and potential for significant market impact, driving future revenue growth.
AMGN shows bullish momentum with an RSI(14) of 69.8 and a strong MA alignment: price > MA20 > MA50 > MA200. The stock is 0.6% below its 2026 YTD high, indicating a potential breakout.
Related headlines
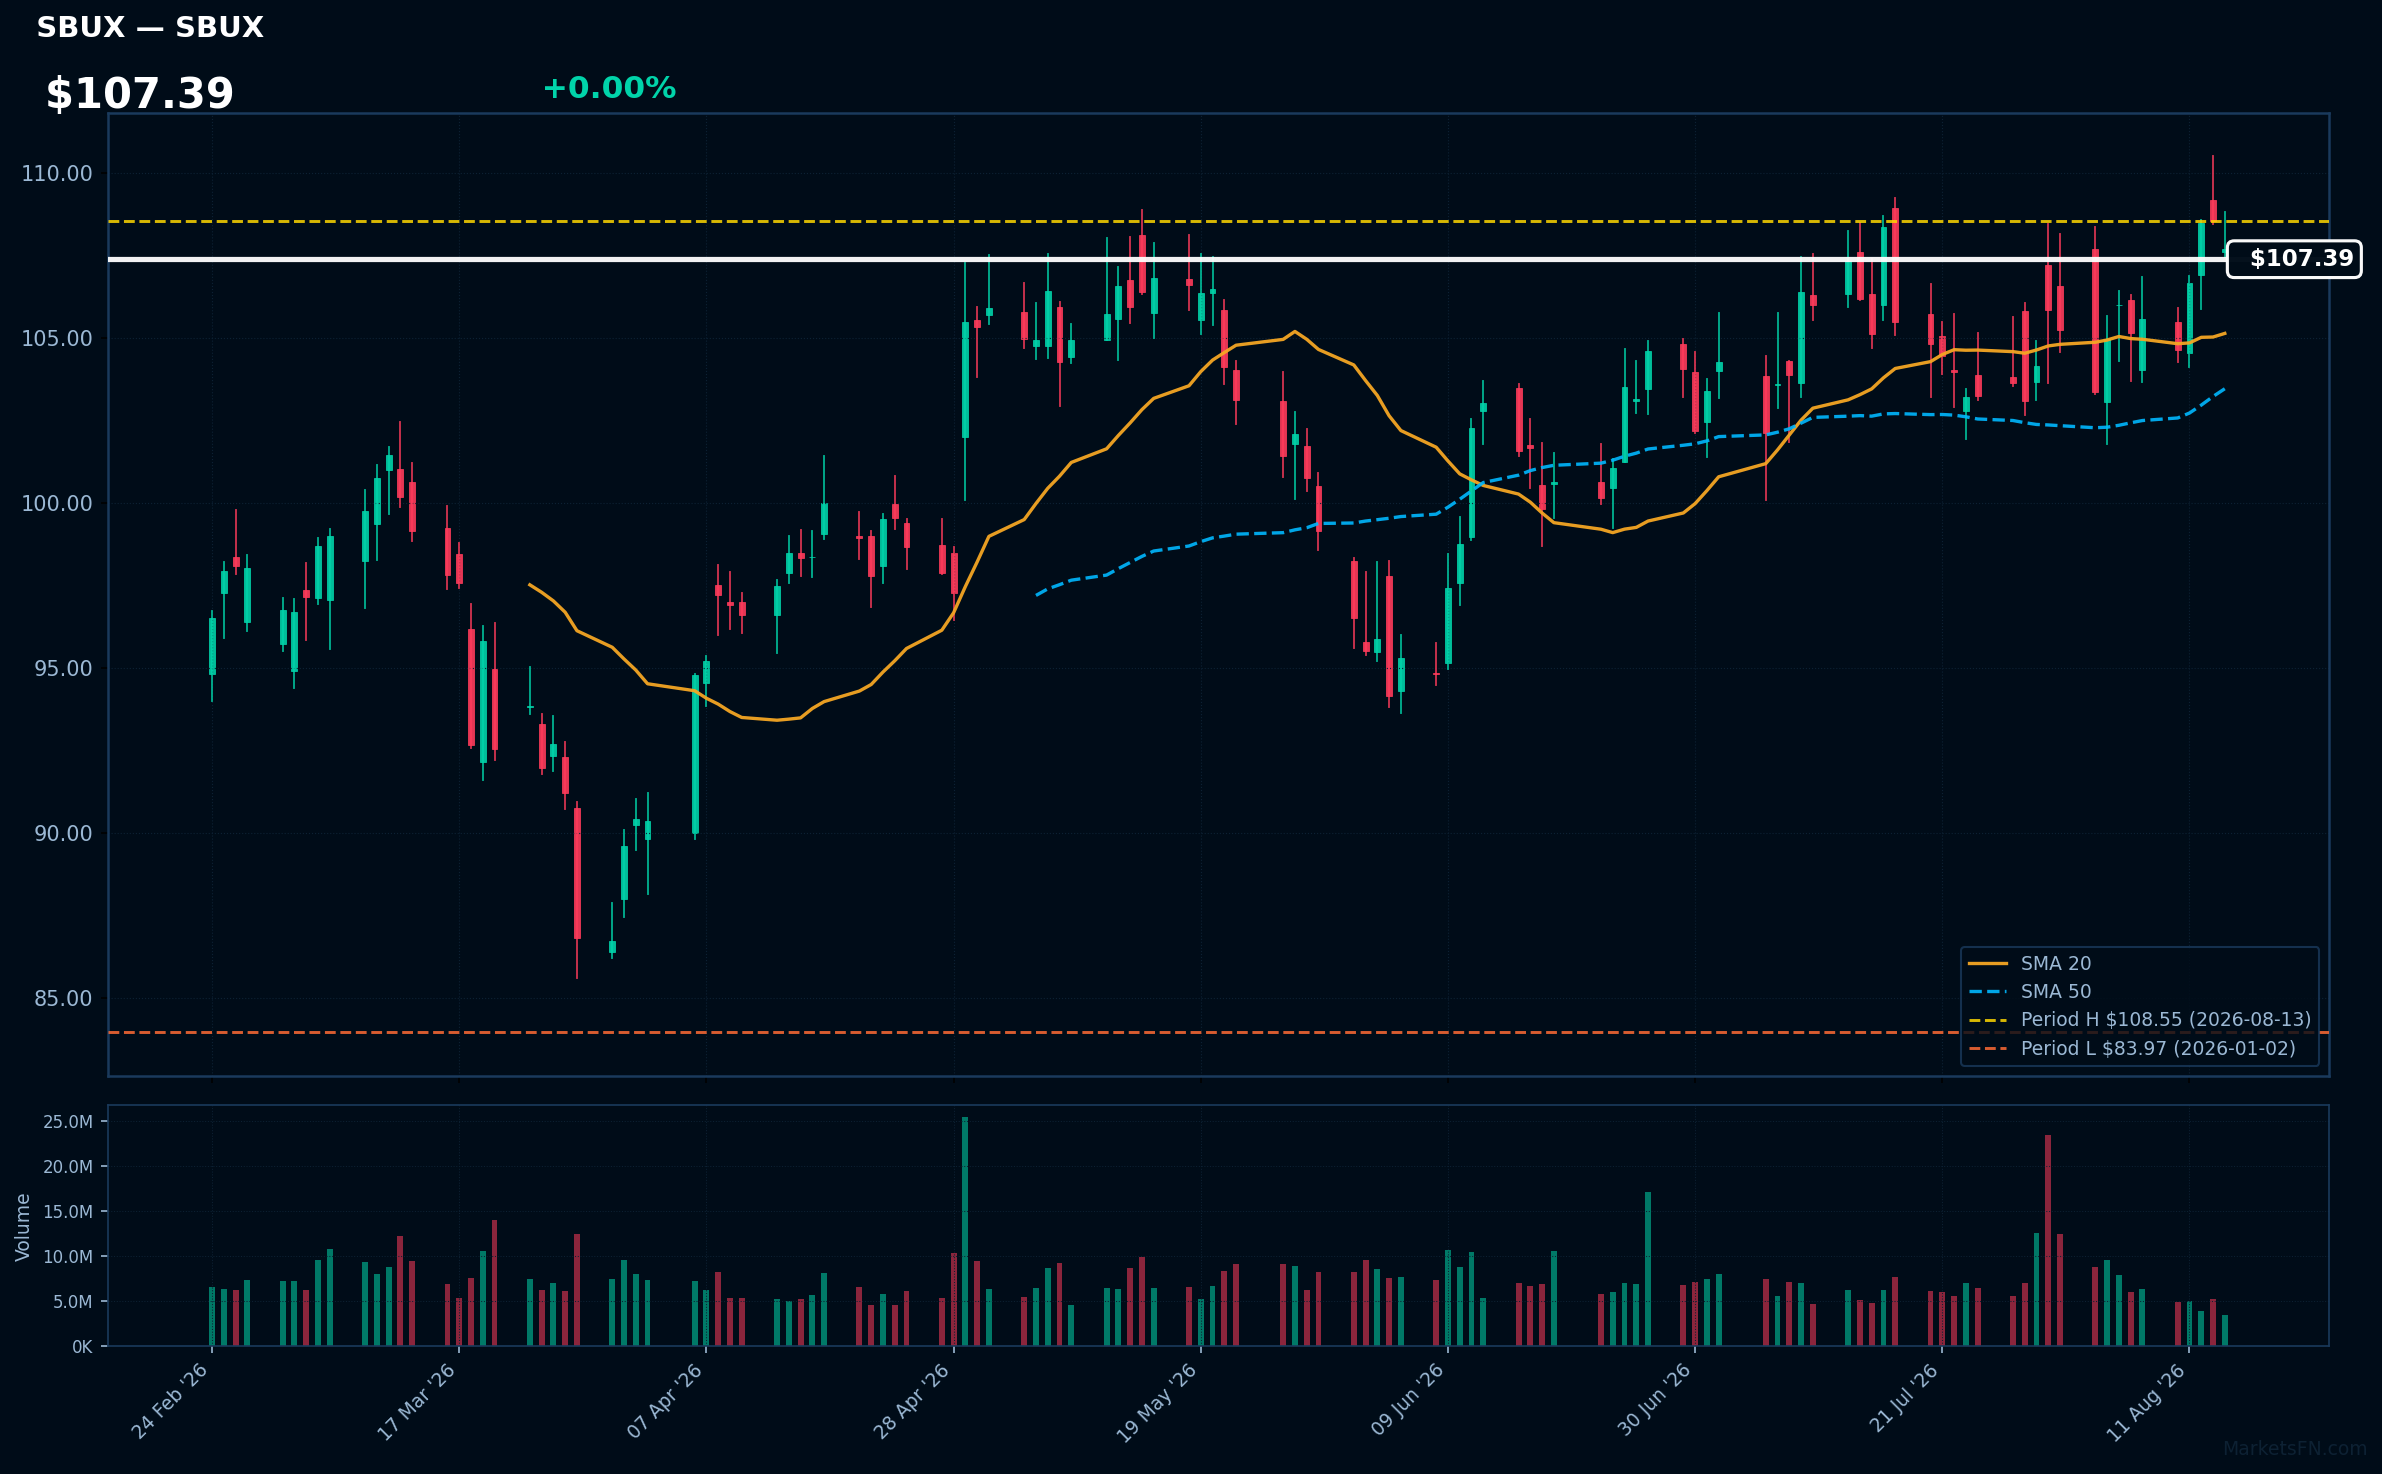
SBUX | Starbucks Corp | Consumer Cyclical | Price Last: $107.69 | % Realized: +28.25% | RSI: 57.3 | % above MA200: +12.1% | Trend: Above MA20, MA50, MA200
Starbucks Corp (SBUX) is a global coffeehouse chain known for its specialty coffee and beverages, driving consumer engagement and brand loyalty. Investors should care due to its strong market presence and growth potential in the premium coffee segment.
Currently, SBUX shows bullish momentum with an RSI(14) of 57.3 and a strong MA alignment: price > MA20 > MA50 > MA200, indicating a sustained uptrend. The stock is 0.8% below its 2026 YTD high.
Related headlines
📉 Nearest to 2026 Low
Sectors represented: Communication Services (2), Consumer Defensive (2), Healthcare (1)
| Ticker | Company | Sector | Price Last | % Realized | 2026 YTD Low Date | RSI | % above MA200 | Trend |
|---|---|---|---|---|---|---|---|---|
| EA | Electronic Arts, Inc | Communication Services | $209.70 | +0.38% | 2026-07-17 | — | — | — |
| AZN | Astrazeneca plc ADR | Healthcare | $156.45 | -14.57% | 2026-08-04 | 34.2 | -15.1% | Below MA20, MA50, MA200 |
| MNST | Monster Beverage Corp | Consumer Defensive | $46.82 | -38.52% | 2026-08-11 | 12.0 | -41.9% | Below MA20, MA50, MA200 |
| APP | Applovin Corp | Communication Services | $315.44 | -48.98% | 2026-08-12 | 30.8 | -37.7% | Below MA20, MA50, MA200 |
| PEP | PepsiCo Inc | Consumer Defensive | $140.79 | -1.01% | 2026-07-23 | 46.5 | -5.5% | Above MA20, MA50 · Below MA200 |
EA | Electronic Arts, Inc | Communication Services | Price Last: $209.70 | % Realized: +0.38% | RSI: — | % above MA200: — | Trend: —
Electronic Arts, Inc. develops and publishes interactive entertainment software, known for franchises like FIFA and The Sims. Investors should care due to its strong brand portfolio and potential for revenue growth in the gaming industry, particularly with ongoing trends in digital gaming and esports.
The stock is 0.0% below its 2026 YTD high, indicating a potential breakout level. However, RSI(14) data is N/A, and MA alignment is incomplete, limiting the assessment of momentum or fundamental strength.
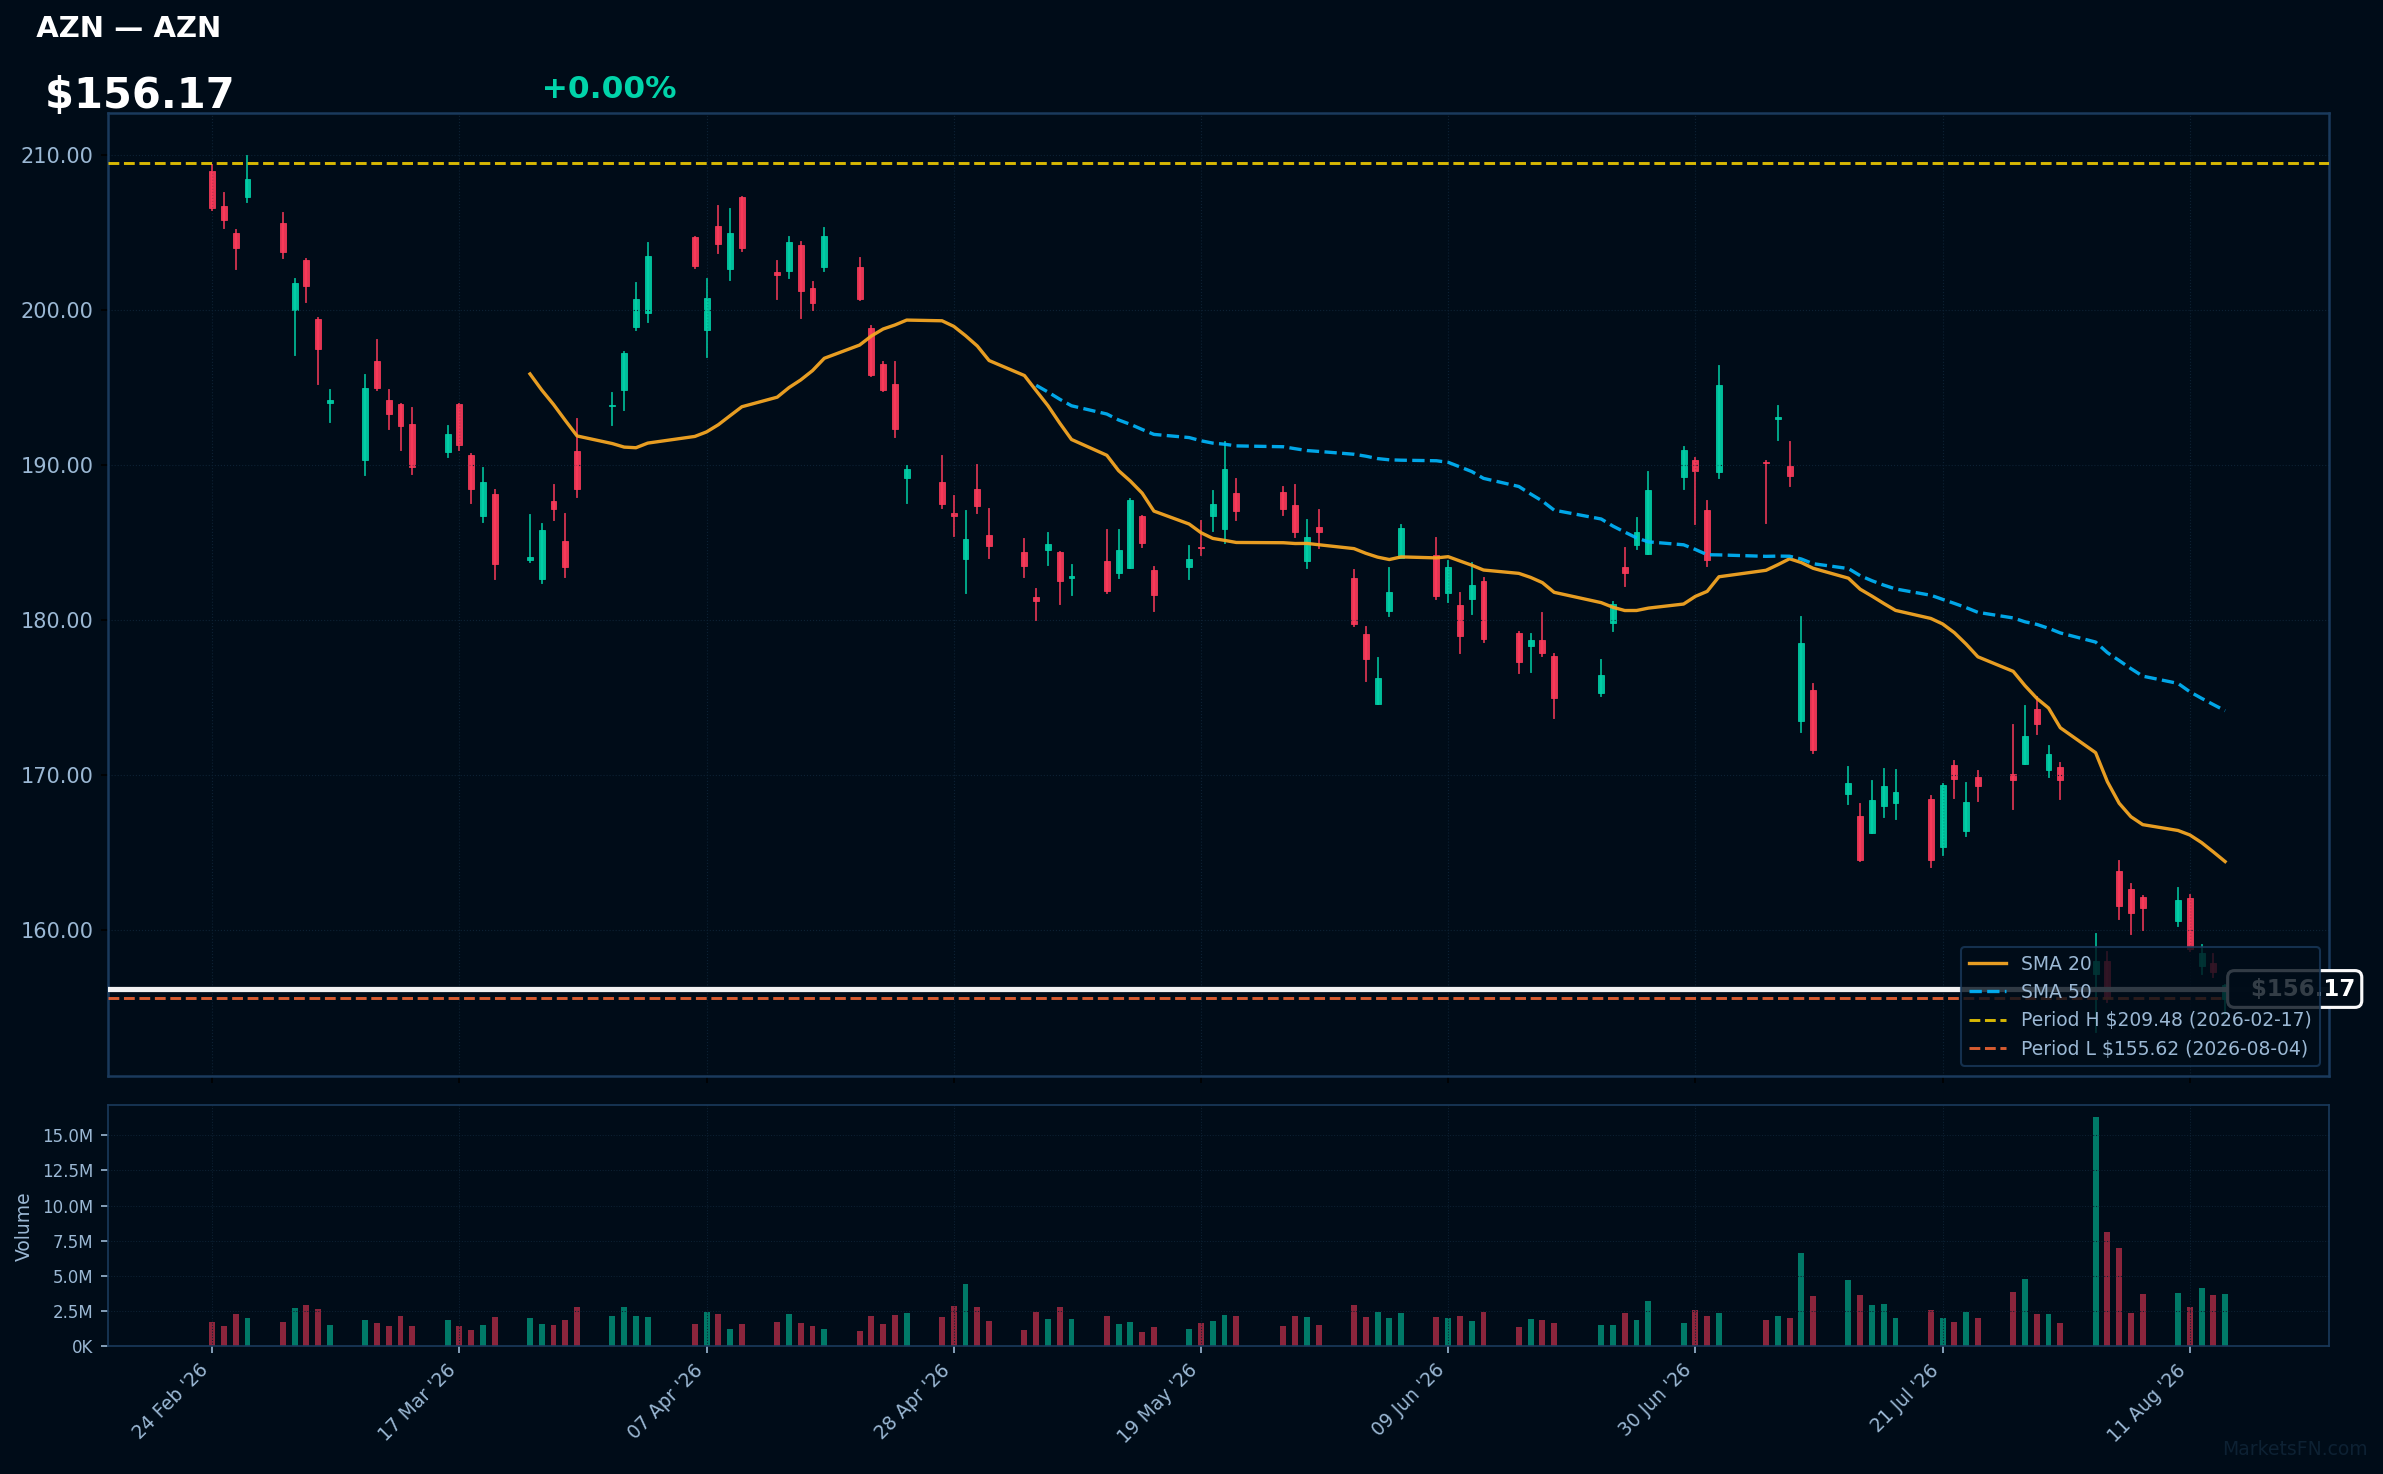
AZN | Astrazeneca plc ADR | Healthcare | Price Last: $156.45 | % Realized: -14.57% | RSI: 34.2 | % above MA200: -15.1% | Trend: Below MA20, MA50, MA200
Astrazeneca plc ADR (AZN) is a global biopharmaceutical company focused on the discovery, development, and commercialization of prescription medicines, particularly in oncology, cardiovascular, and respiratory diseases. Investors should care due to its significant role in innovative therapies and potential market impact.
The current technical situation indicates a bearish trend, with an RSI(14) of 34.2 and a MA alignment of price < MA20 < MA50 < MA200. The stock is also testing major support, being only 0.5% above its 2026 YTD low.
Related headlines
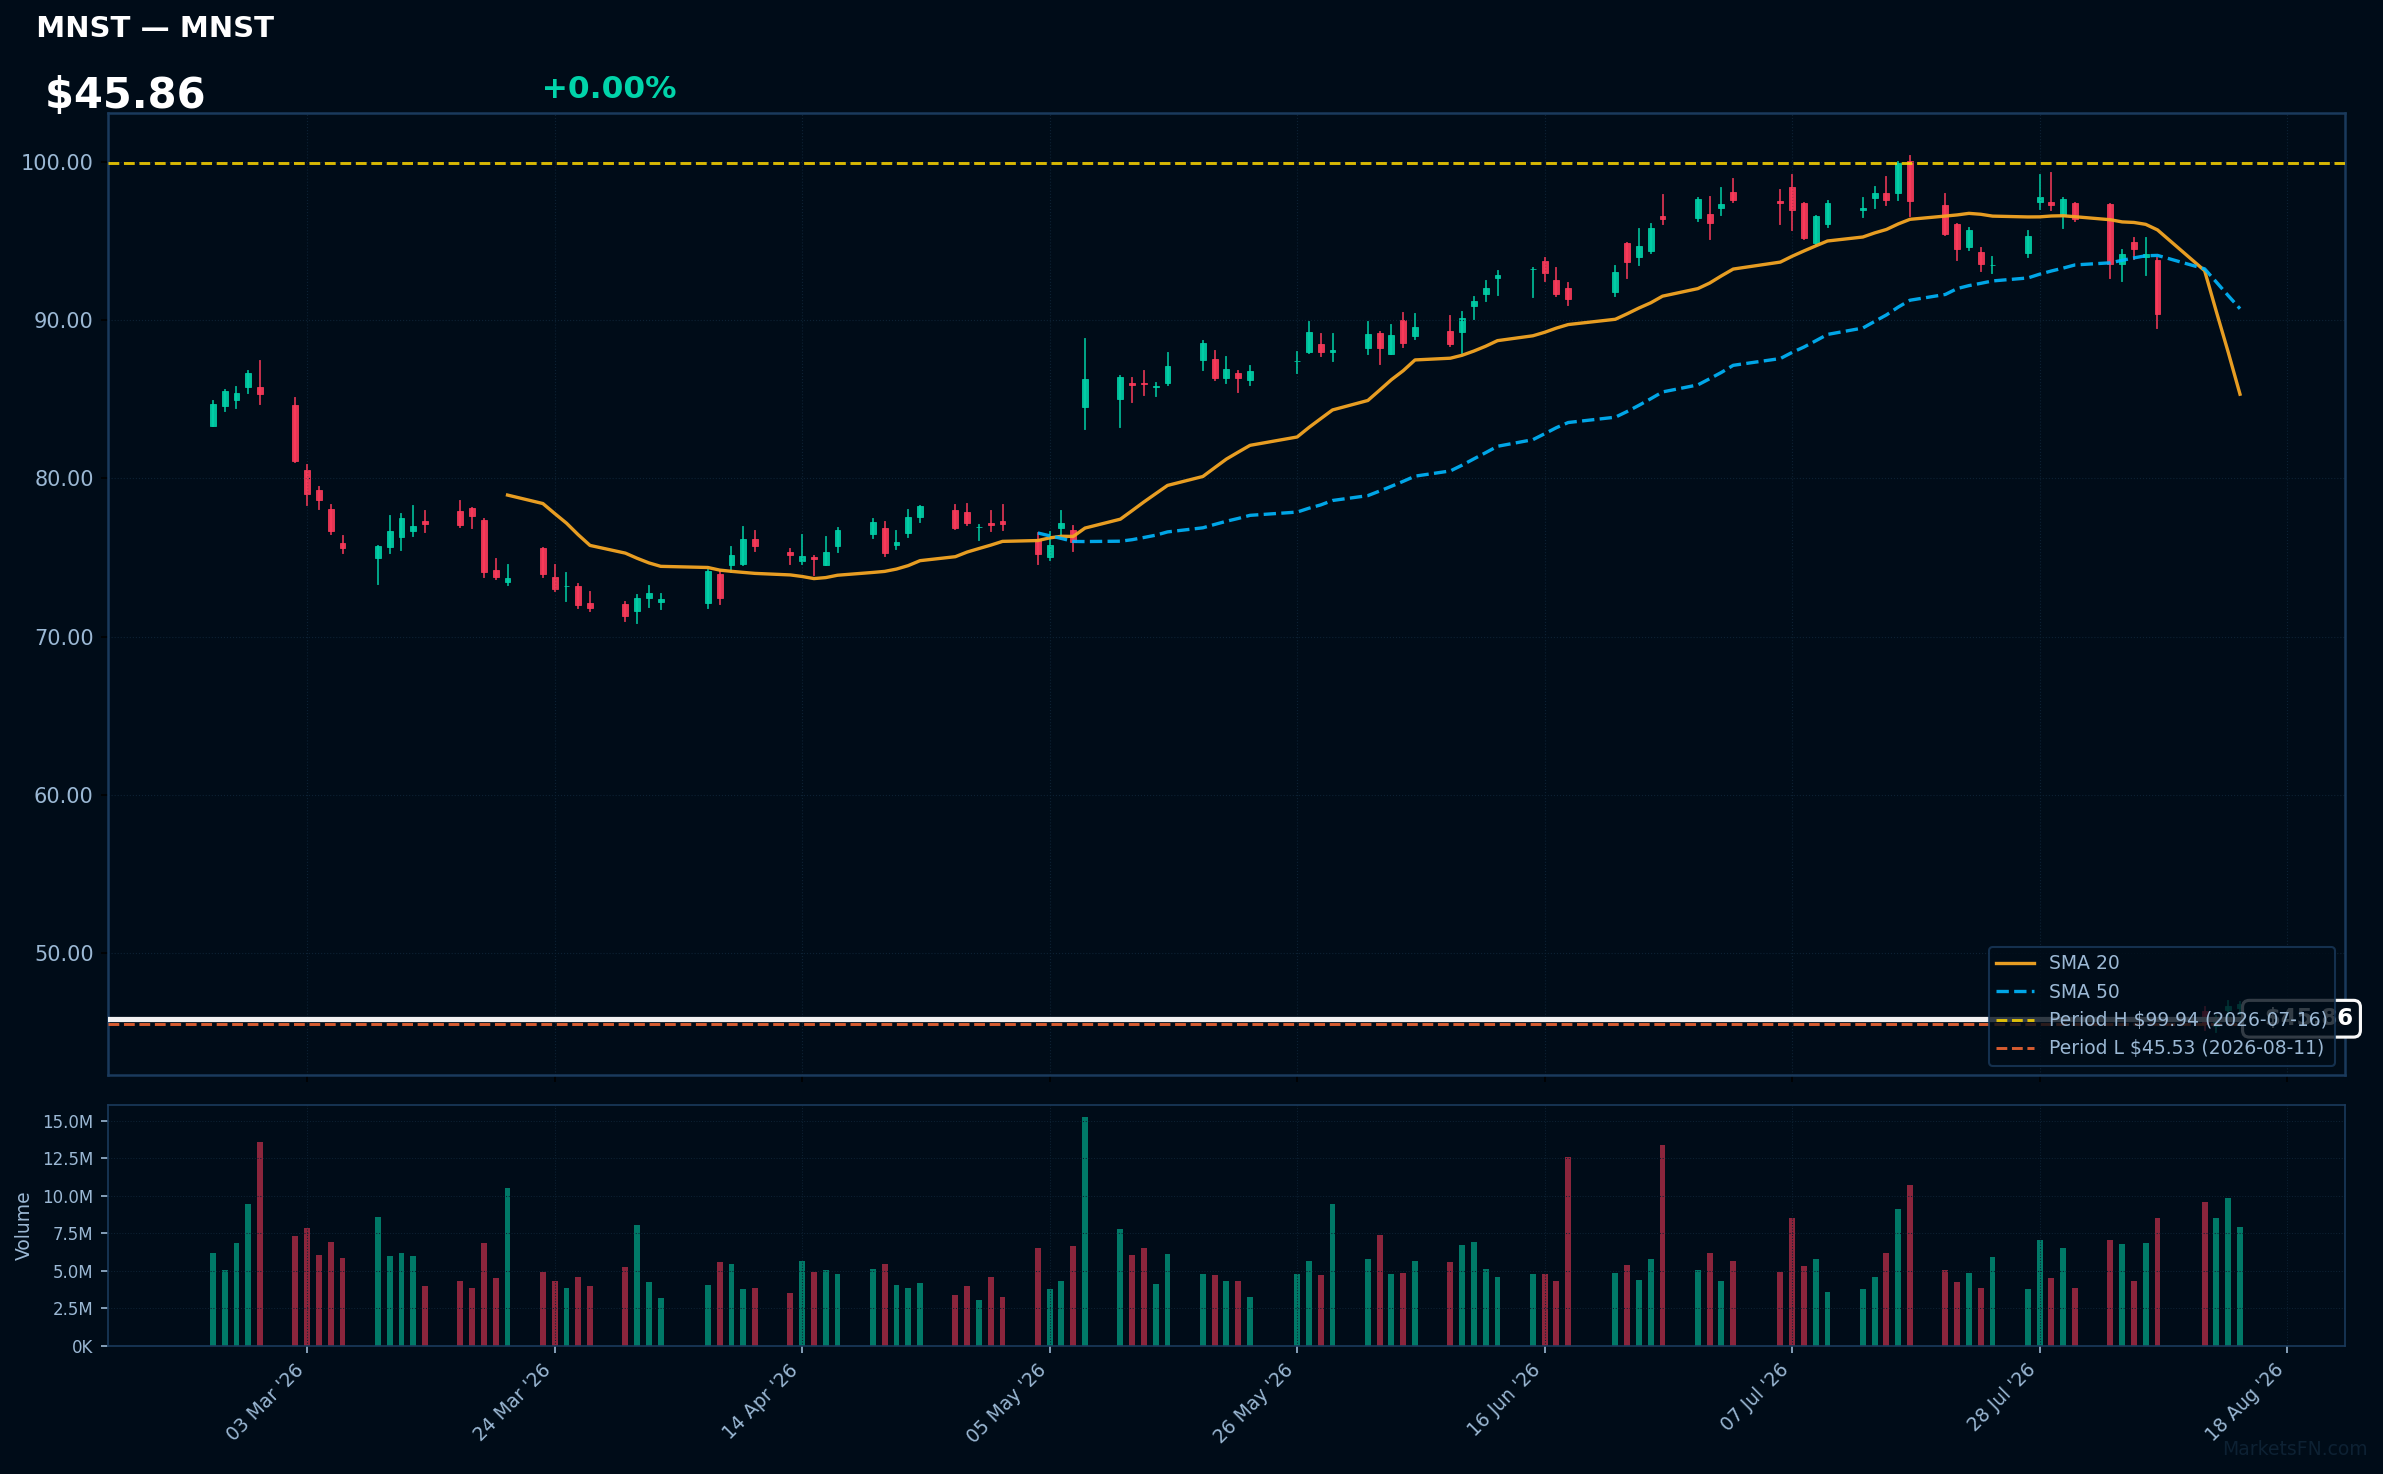
MNST | Monster Beverage Corp | Consumer Defensive | Price Last: $46.82 | % Realized: -38.52% | RSI: 12.0 | % above MA200: -41.9% | Trend: Below MA20, MA50, MA200
Monster Beverage Corp (MNST) specializes in energy drinks, offering a diverse portfolio that includes energy shots and sodas. Investors should care due to its significant market presence and brand loyalty, which can drive future growth despite current challenges.
The current technical situation is concerning, with an RSI(14) of 12.0 indicating oversold conditions. The stock is below MA20/MA50/MA200, presenting mixed signals and testing major support, being only 2.8% above its 2026 YTD low.
Related headlines
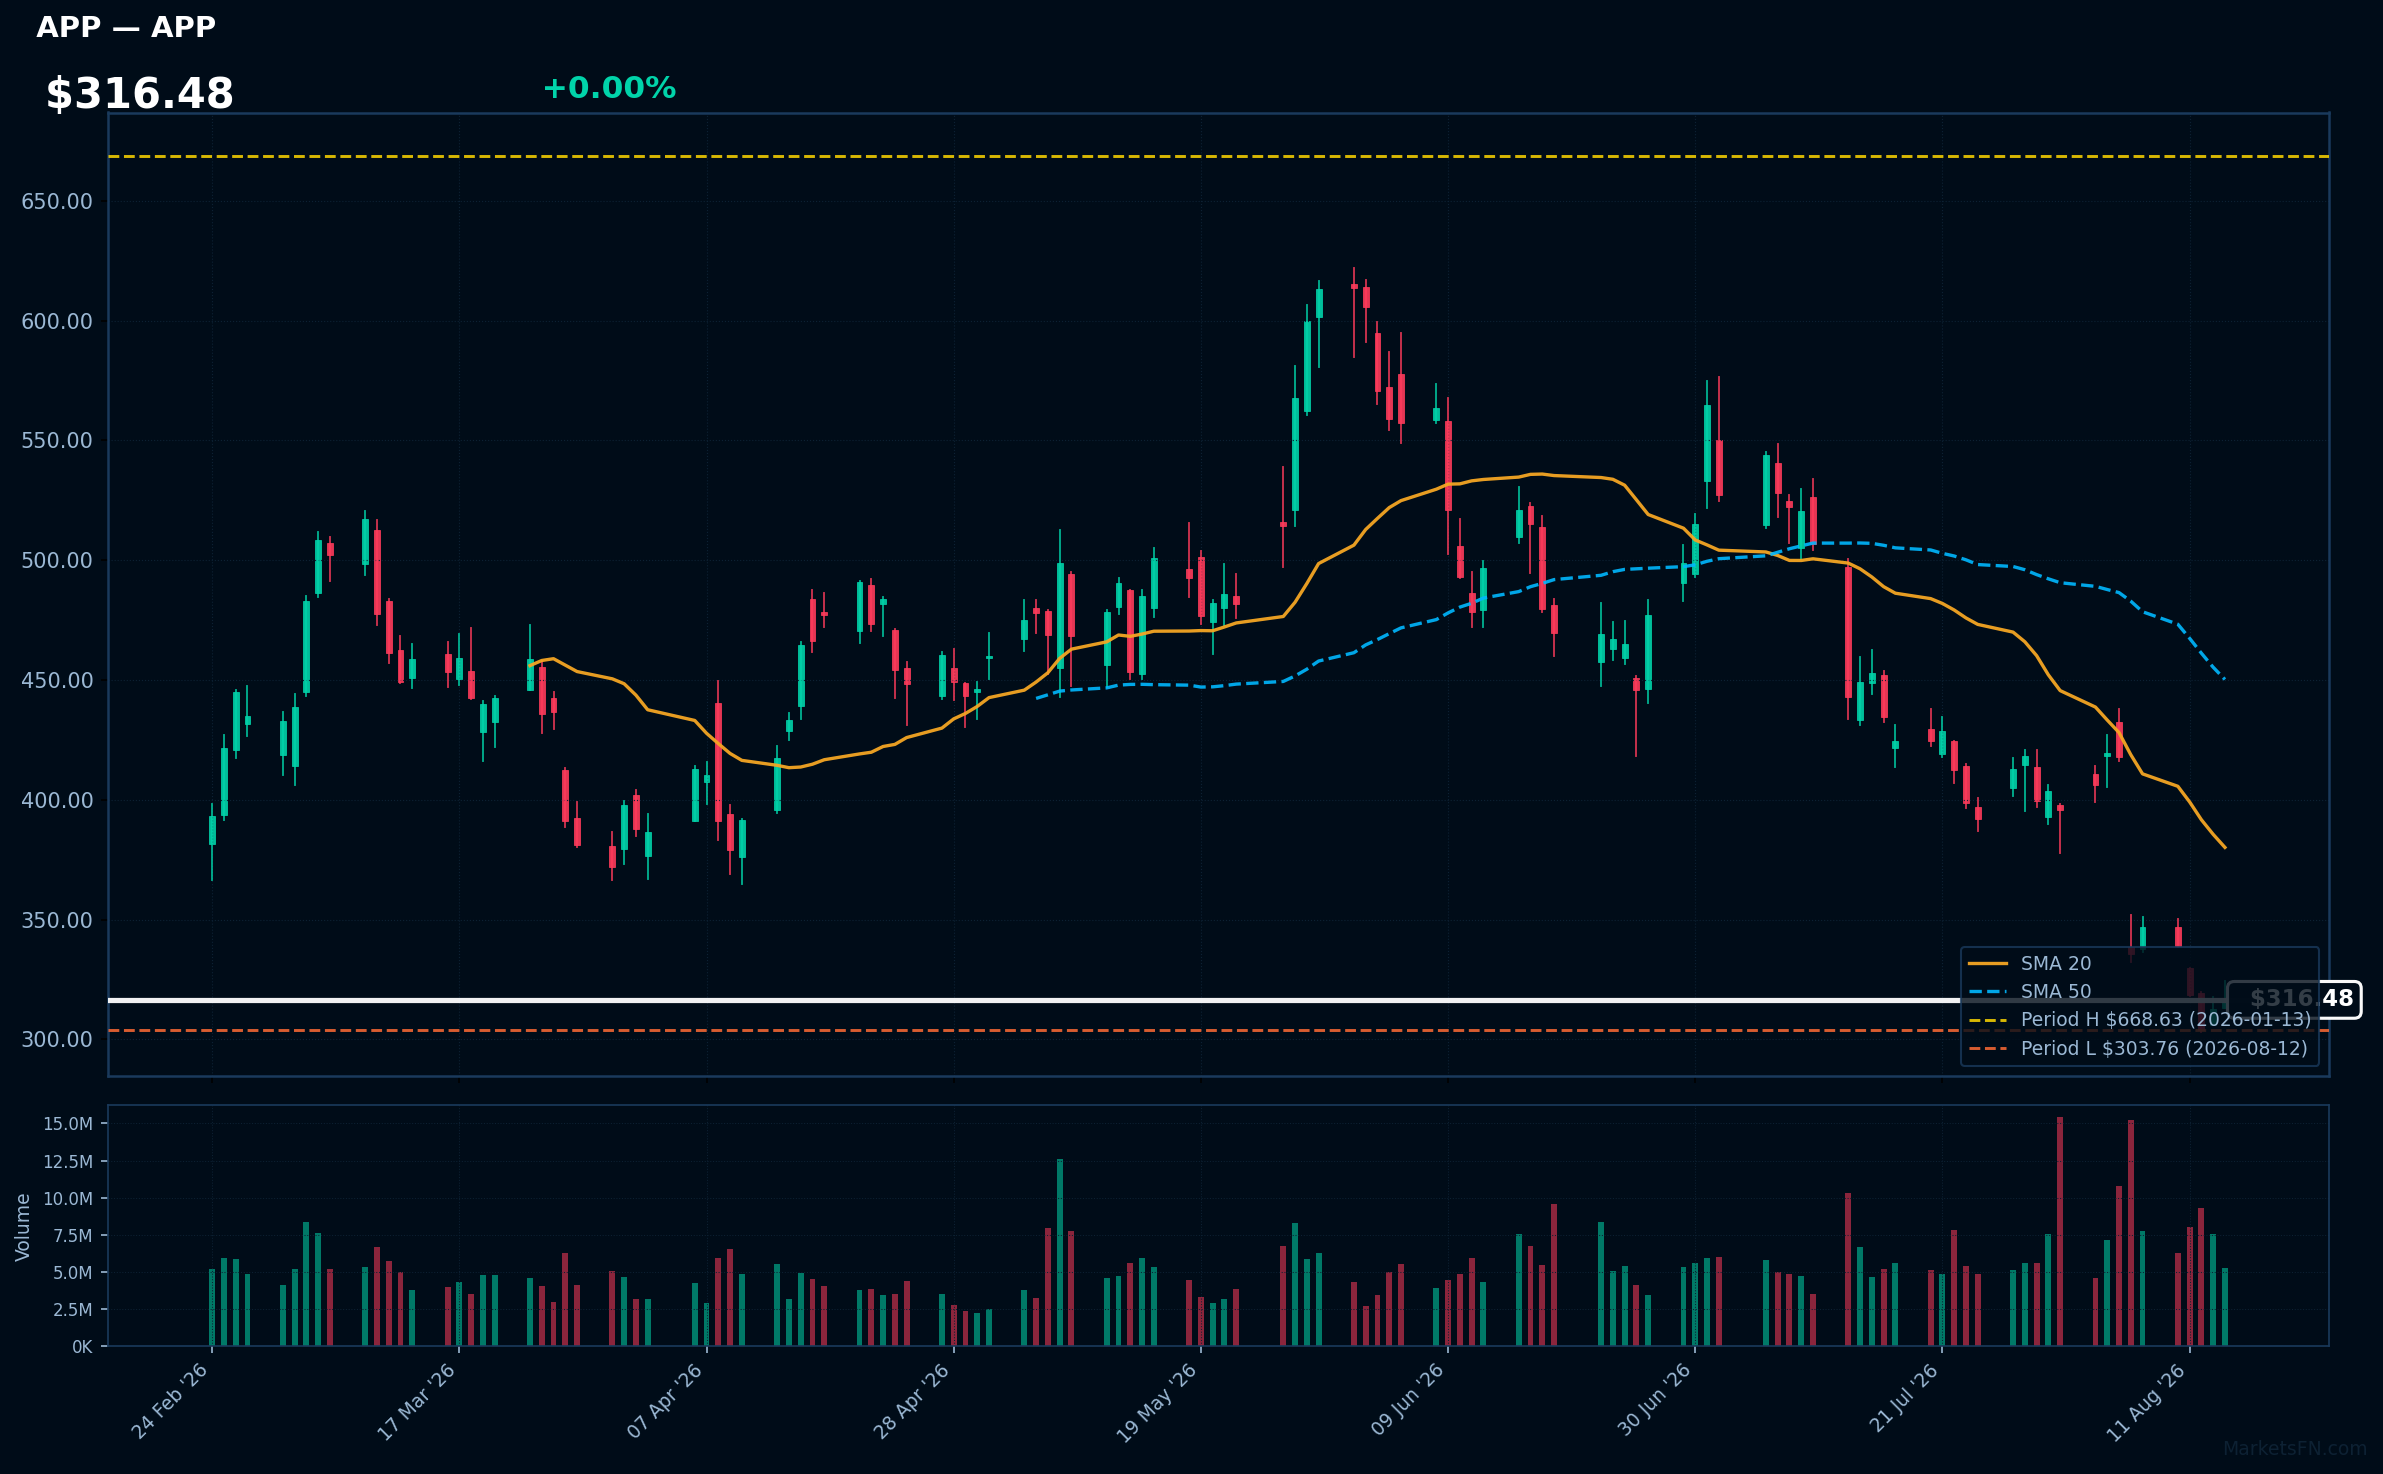
APP | Applovin Corp | Communication Services | Price Last: $315.44 | % Realized: -48.98% | RSI: 30.8 | % above MA200: -37.7% | Trend: Below MA20, MA50, MA200
Applovin Corp (APP) provides a platform for mobile app developers to monetize and market their applications. Investors should care due to its significant market position in mobile advertising and potential growth in the expanding app ecosystem.
The current technical situation indicates a bearish trend with an RSI(14) of 30.8 and a MA alignment of price < MA20 < MA50 < MA200, suggesting a sustained downtrend and testing major support.
Related headlines
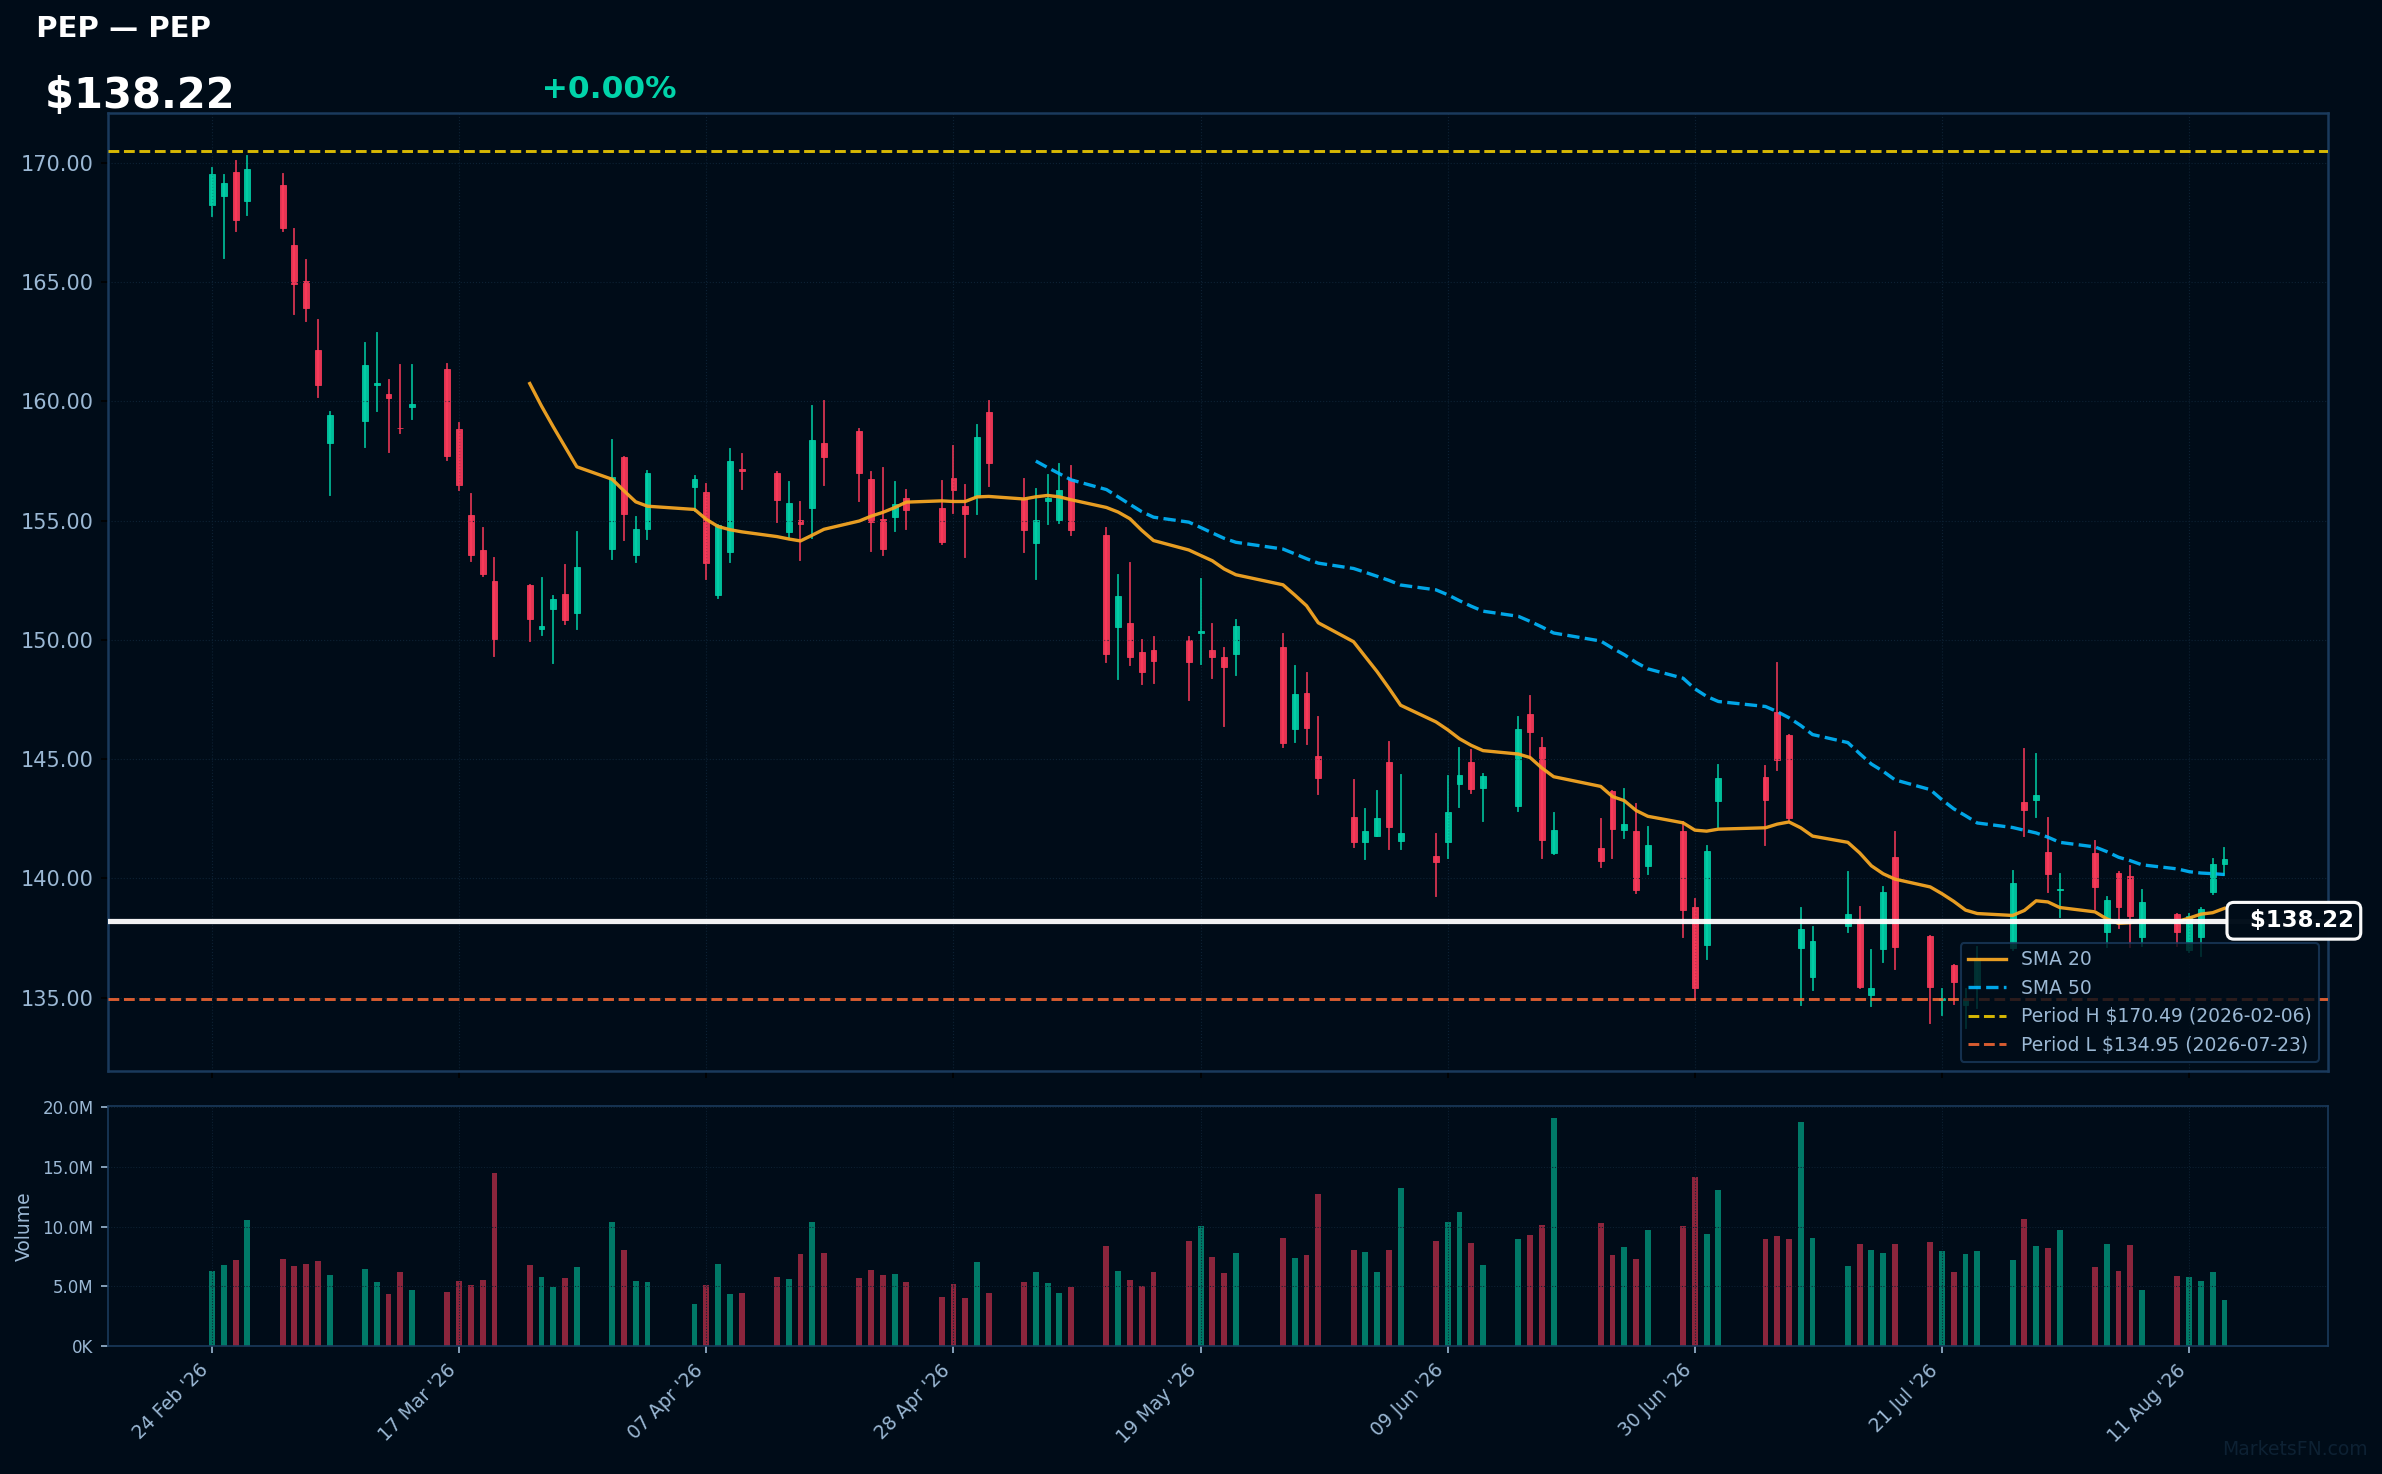
PEP | PepsiCo Inc | Consumer Defensive | Price Last: $140.79 | % Realized: -1.01% | RSI: 46.5 | % above MA200: -5.5% | Trend: Above MA20, MA50 · Below MA200
PepsiCo Inc (PEP) is a global leader in the food and beverage industry, known for its diverse portfolio including snacks, soft drinks, and health-focused products. Investors should care due to its strong market presence and potential for growth in emerging health trends.
The current technical situation indicates a bearish trend, with an RSI(14) of 46.5 and a MA alignment of price < MA20 < MA50 < MA200, suggesting sustained downtrend and testing major support just 4.3% above its 2026 YTD low.
Related headlines
Market Commentary
The proximity of Nasdaq 100 stocks to their 2026 year-to-date extremes indicates heightened volatility and investor sentiment in the technology sector. Stocks like PayPal Holdings Inc and Electronic Arts, both at 0.0% from their highs, suggest strong market confidence, while others like Airbnb Inc and AMGEN Inc, only slightly below their peaks, reflect a resilient performance amid fluctuating market conditions.
Current technology sector themes include the ongoing digital transformation, increased consumer engagement in gaming and e-commerce, and robust earnings reports from key players. Macro conditions such as interest rate fluctuations and inflation concerns are influencing investor behavior, leading to a cautious yet optimistic outlook. The resilience of companies like Starbucks Corp, only 0.8% from their high, highlights the sector's adaptability in a challenging economic environment.
Investors and traders should closely monitor upcoming earnings reports and macroeconomic indicators, as these will provide insights into the sustainability of current trends. Additionally, any shifts in consumer behavior or regulatory changes could significantly impact stock performance. Keeping an eye on stocks near their lows, such as Astrazeneca plc ADR and PepsiCo Inc, may also reveal potential buying opportunities as market dynamics evolve.
Methodology: All 101 Nasdaq 100 constituents screened. Close prices downloaded from 2026-01-01. Period high = highest close since Jan 1 2026; period low = lowest close since Jan 1 2026. Distance = (current price / period extreme − 1) × 100. Technical indicators computed on up to 1 year of daily OHLCV data.
Disclaimer: For informational purposes only. Not investment advice. Past performance is not indicative of future results.

