Nasdaq 100 2026 YTD Highs & Lows Radar: PayPal (PYPL), Monster Beverage (MNST) and more
MarketsFN Team

Nasdaq 100 2026 YTD Highs & Lows Radar: PayPal (PYPL), Monster Beverage (MNST) and more
Screening all 101 Nasdaq 100 constituents for stocks nearest to their 2026 year-to-date high and their 2026 YTD low. Data as of August 18, 2026. % Realized = total return since Jan 1 2026.
Legend: RSI > 70 = overbought · RSI < 30 = oversold · Green % Realized = positive YTD return · Red = negative.
📈 Nearest to 2026 High
Sectors represented: Consumer Cyclical (2), Financial (1), Communication Services (1), Healthcare (1)
| Ticker | Company | Sector | Price Last | % Realized | 2026 YTD High Date | RSI | % above MA200 | Trend |
|---|---|---|---|---|---|---|---|---|
| PYPL | PayPal Holdings Inc | Financial | $61.66 | +6.05% | 2026-08-14 | 74.2 | +19.5% | Above MA20, MA50, MA200 |
| EA | Electronic Arts, Inc | Communication Services | $209.70 | +0.38% | 2026-08-04 | — | — | — |
| ABNB | Airbnb Inc | Consumer Cyclical | $184.06 | +38.38% | 2026-08-13 | 72.9 | +36.3% | Above MA20, MA50, MA200 |
| AMGN | AMGEN Inc | Healthcare | $415.21 | +26.73% | 2026-08-13 | 73.8 | +18.6% | Above MA20, MA50, MA200 |
| SBUX | Starbucks Corp | Consumer Cyclical | $107.69 | +28.25% | 2026-08-13 | 57.3 | +12.1% | Above MA20, MA50, MA200 |
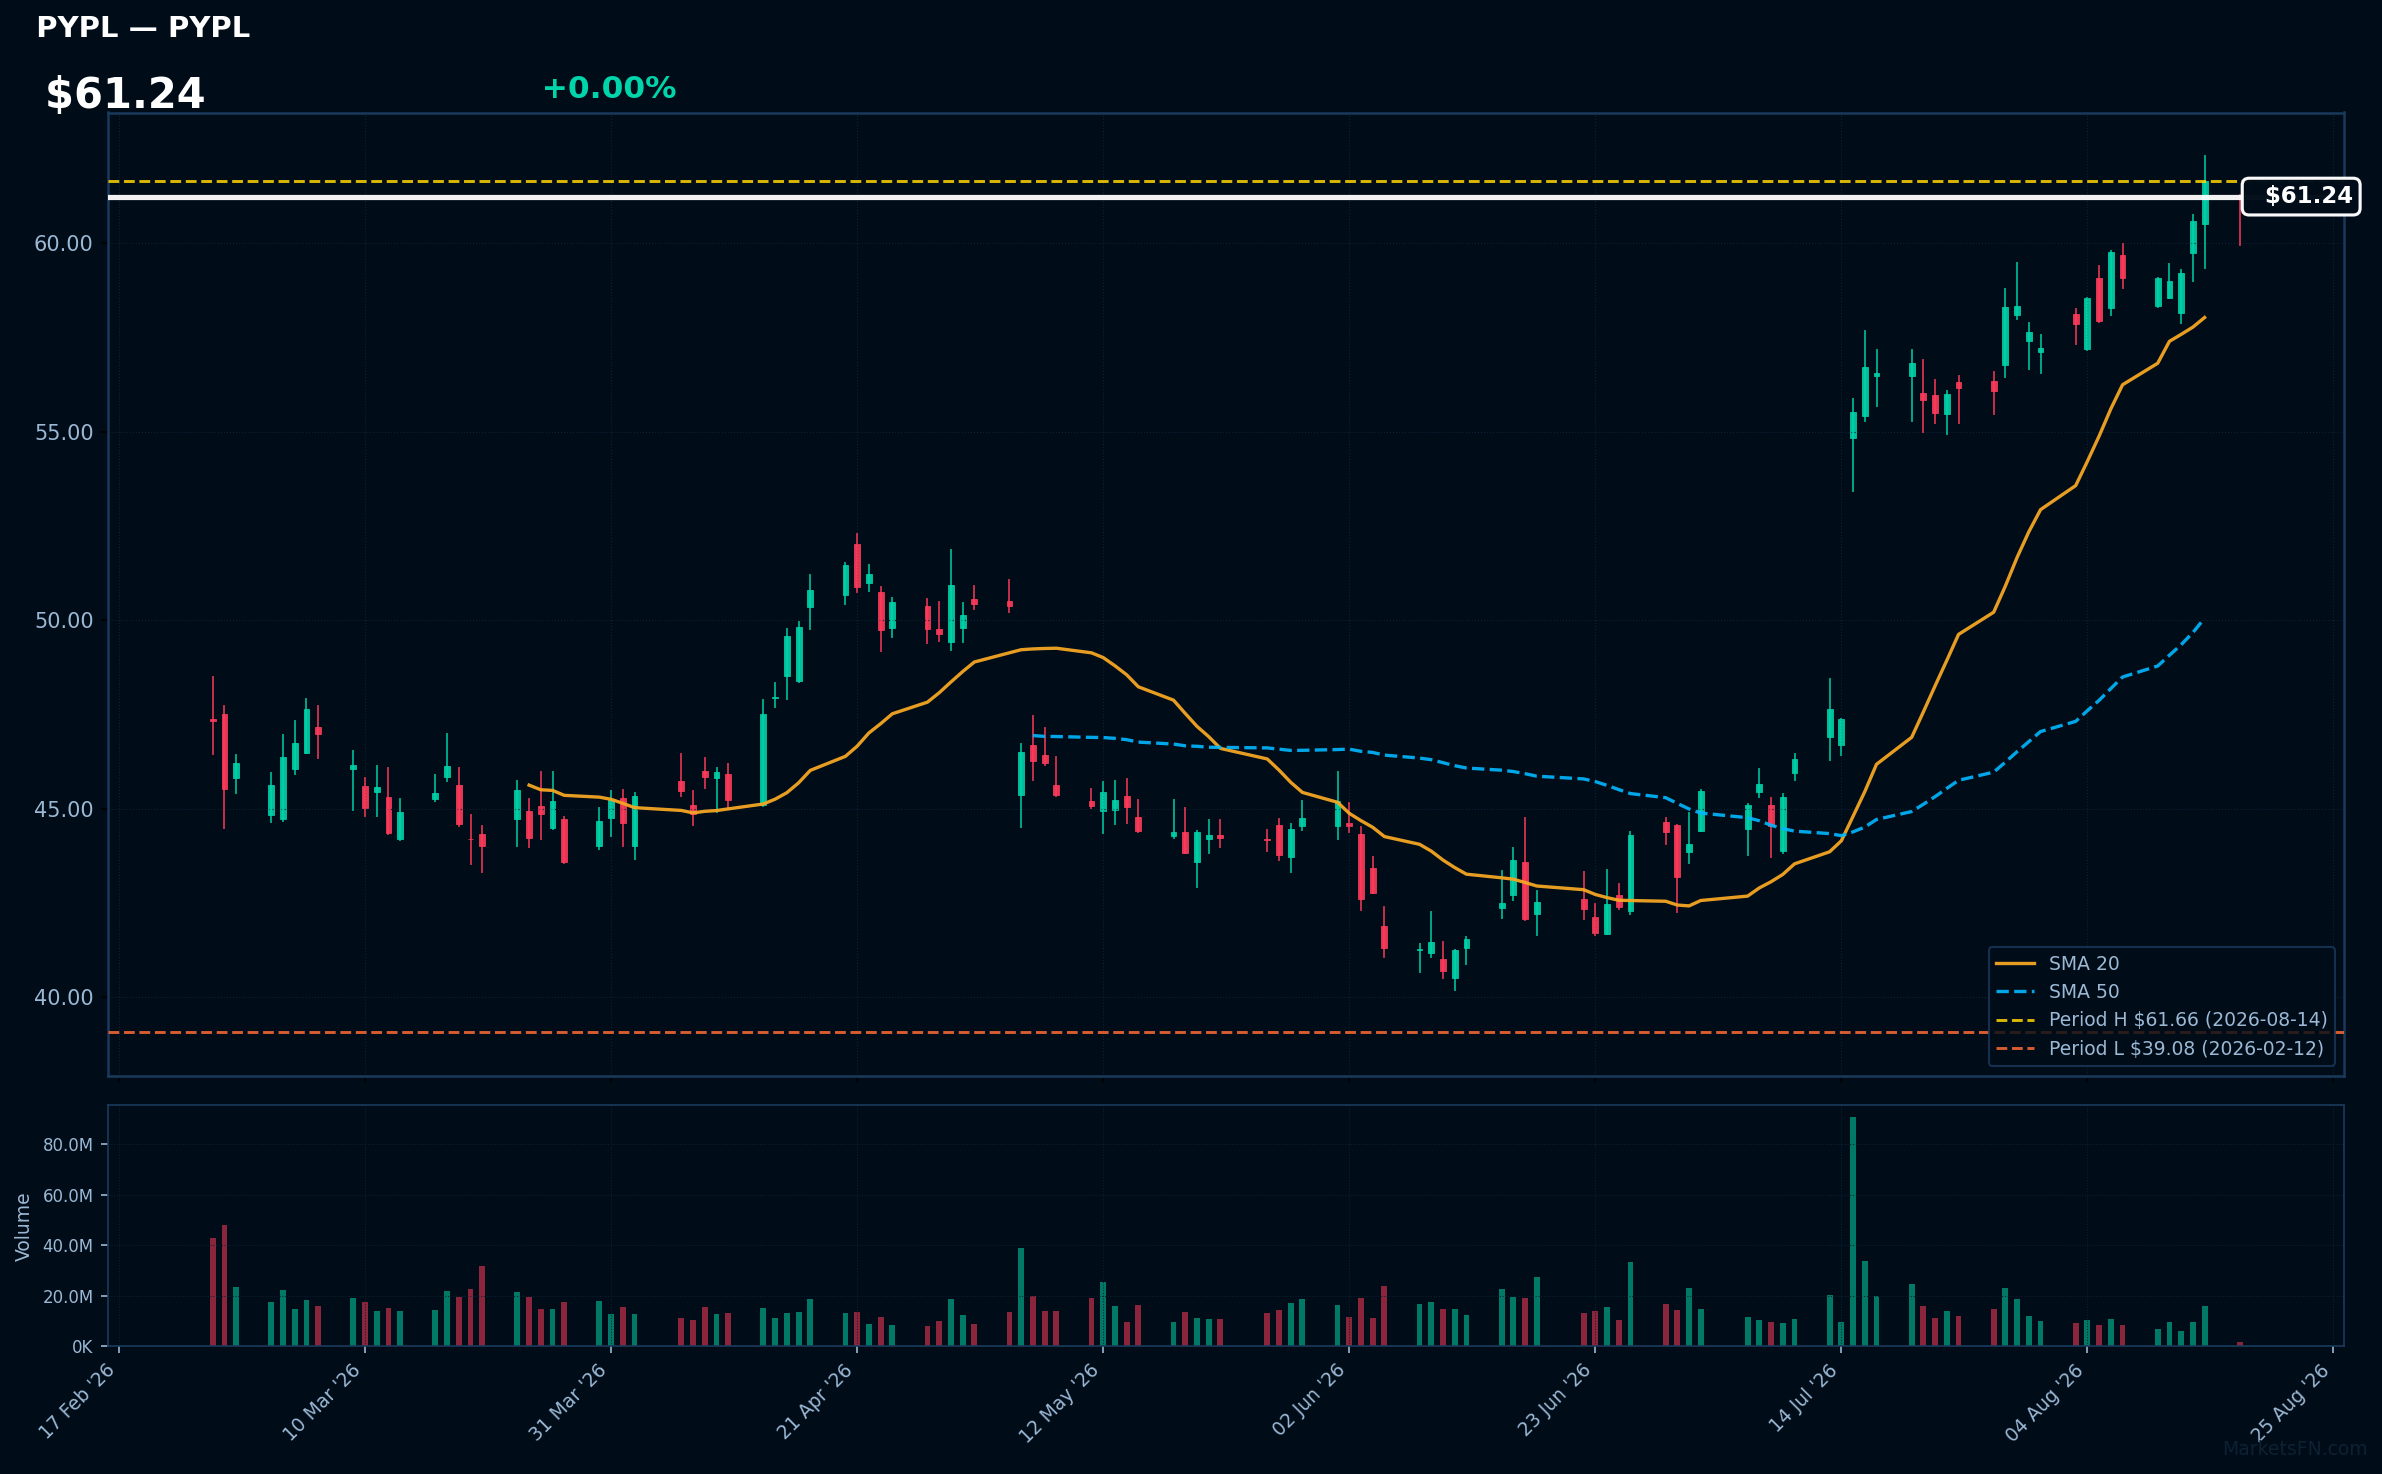
PYPL | PayPal Holdings Inc | Financial | Price Last: $61.66 | % Realized: +6.05% | RSI: 74.2 | % above MA200: +19.5% | Trend: Above MA20, MA50, MA200
PayPal Holdings Inc operates a digital payments platform, enabling online money transfers and facilitating e-commerce transactions. Investors should care due to its significant market presence and ongoing innovations in fintech, which can drive growth and enhance user engagement.
Currently, PayPal's RSI(14) is 74.2, indicating overbought conditions. The mixed signals from MA alignment—price above MA20/MA50/MA200—suggest potential volatility, despite being 0.0% below its 2026 YTD high.
Related headlines
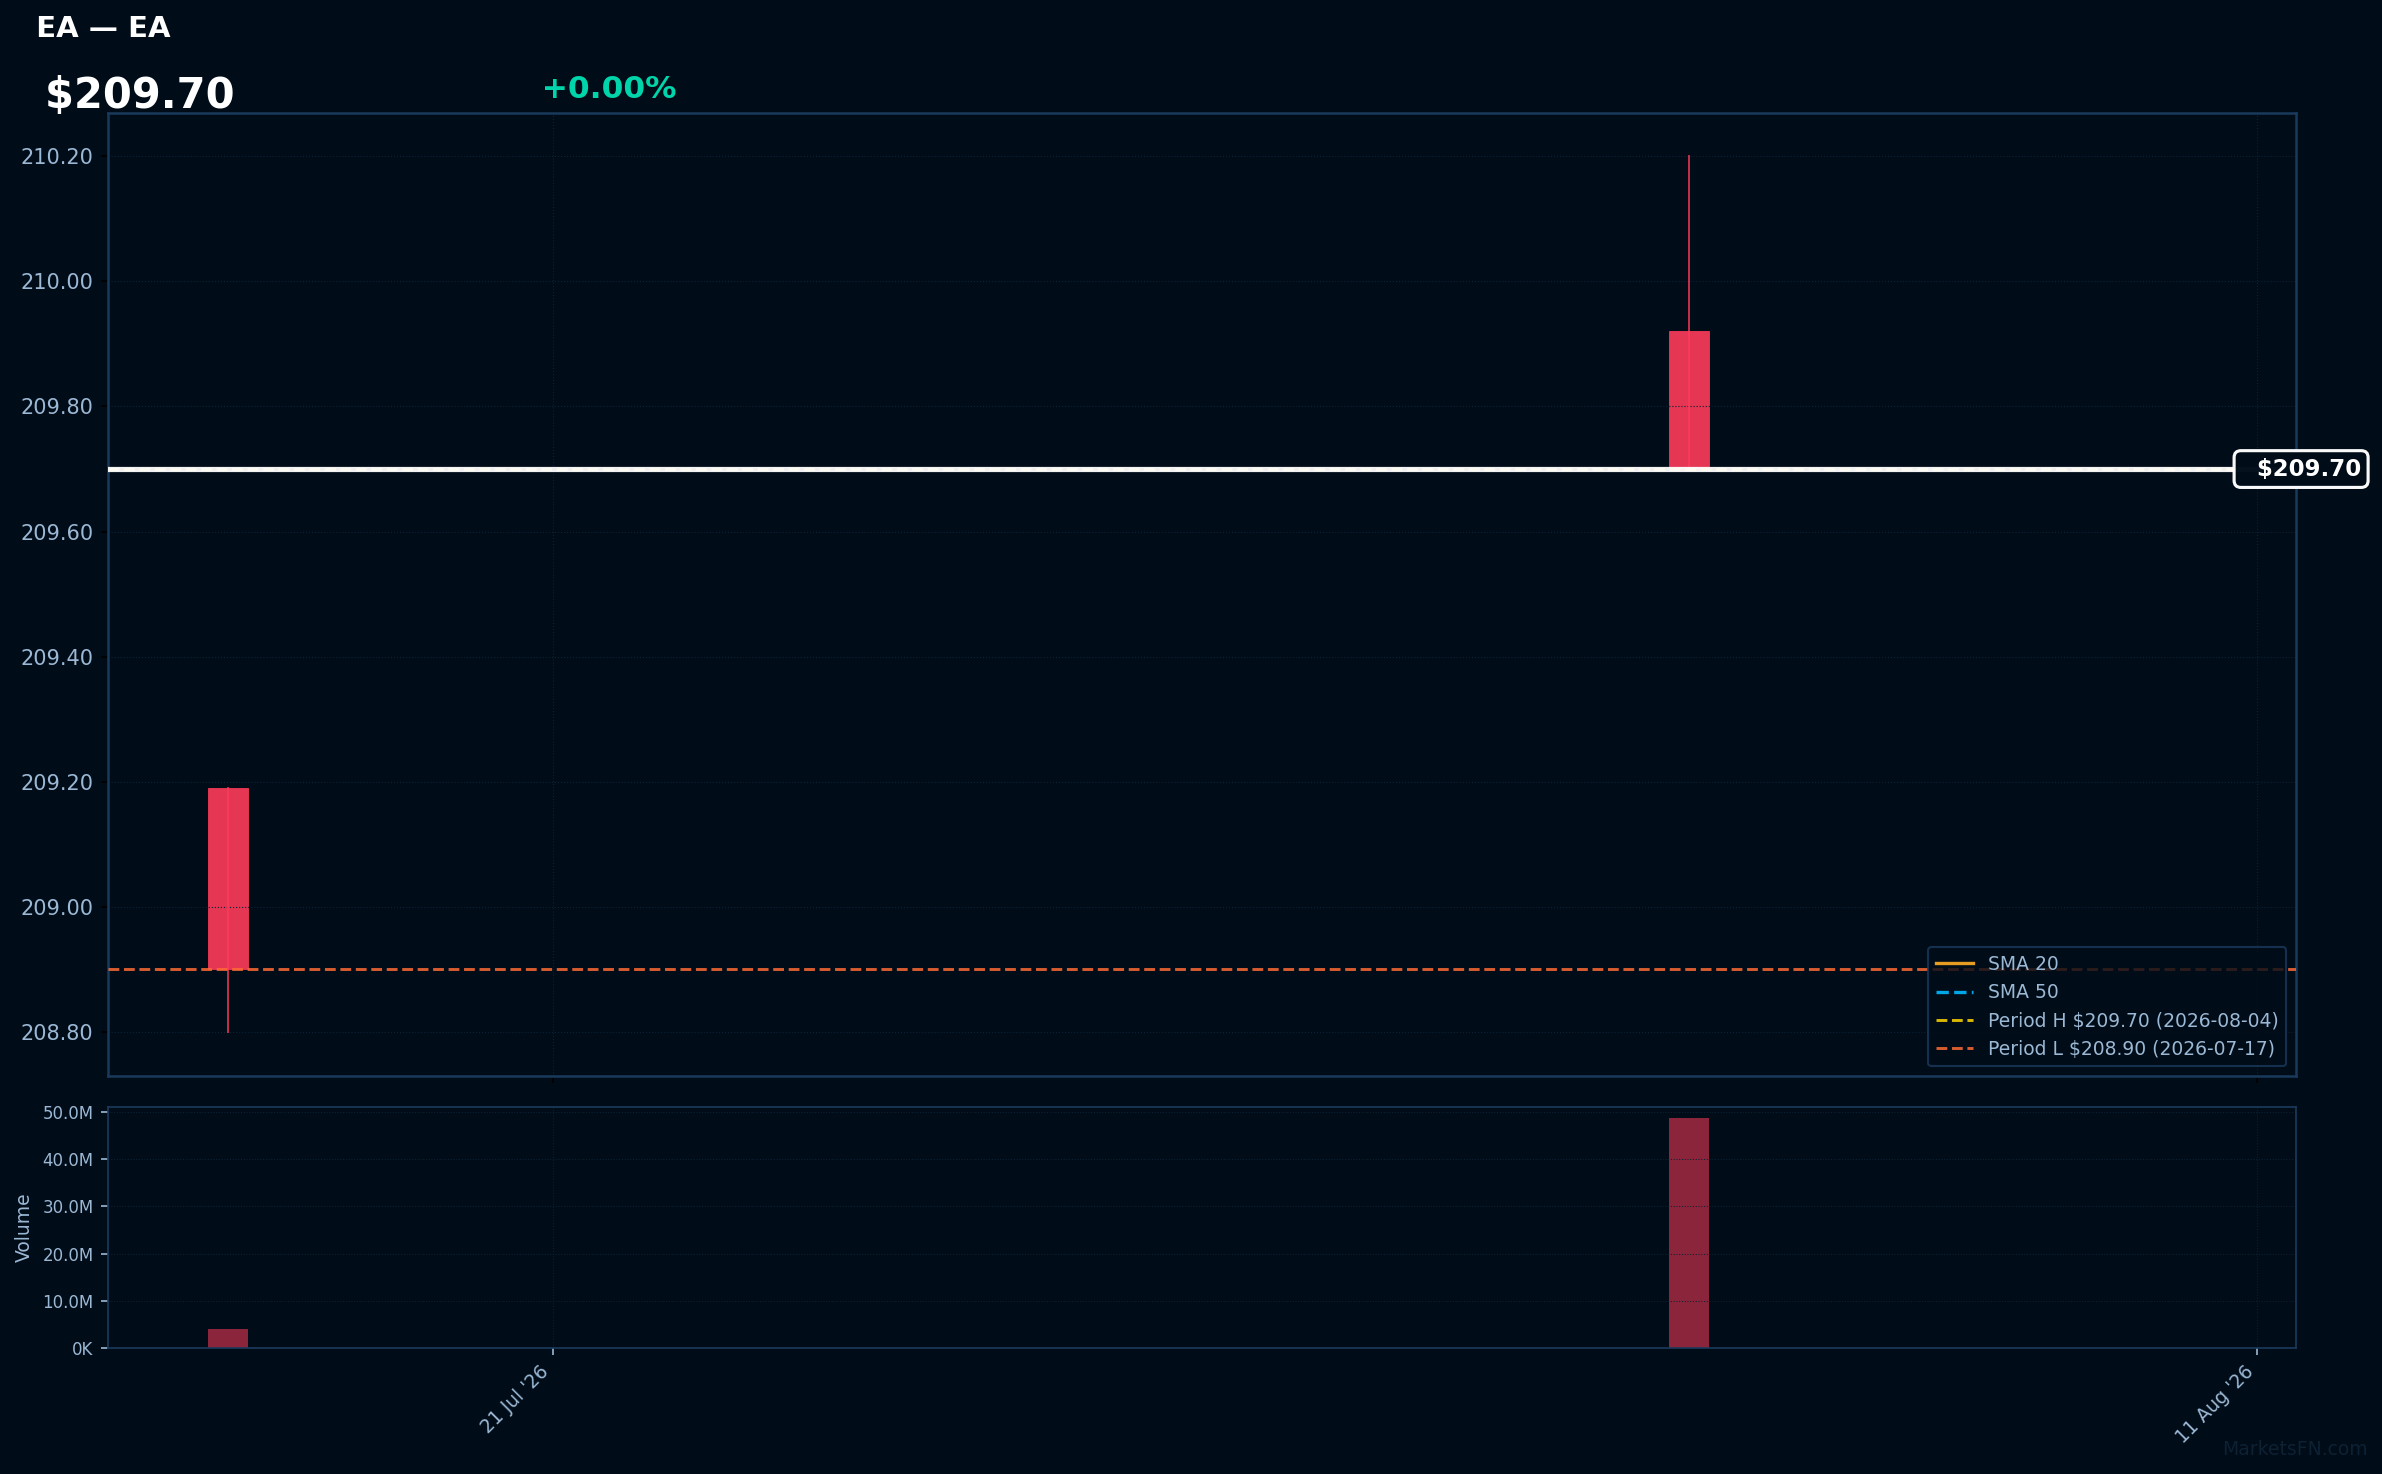
EA | Electronic Arts, Inc | Communication Services | Price Last: $209.70 | % Realized: +0.38% | RSI: — | % above MA200: — | Trend: —
Electronic Arts, Inc. develops and publishes interactive entertainment software, known for franchises like FIFA and Madden NFL. Investors should care due to its strong brand portfolio and potential for growth in the gaming industry, particularly with increasing digital sales and engagement.
The stock is 0.0% below its 2026 YTD high, indicating a potential breakout level. However, RSI(14) data is N/A and MA data is incomplete, limiting technical analysis.
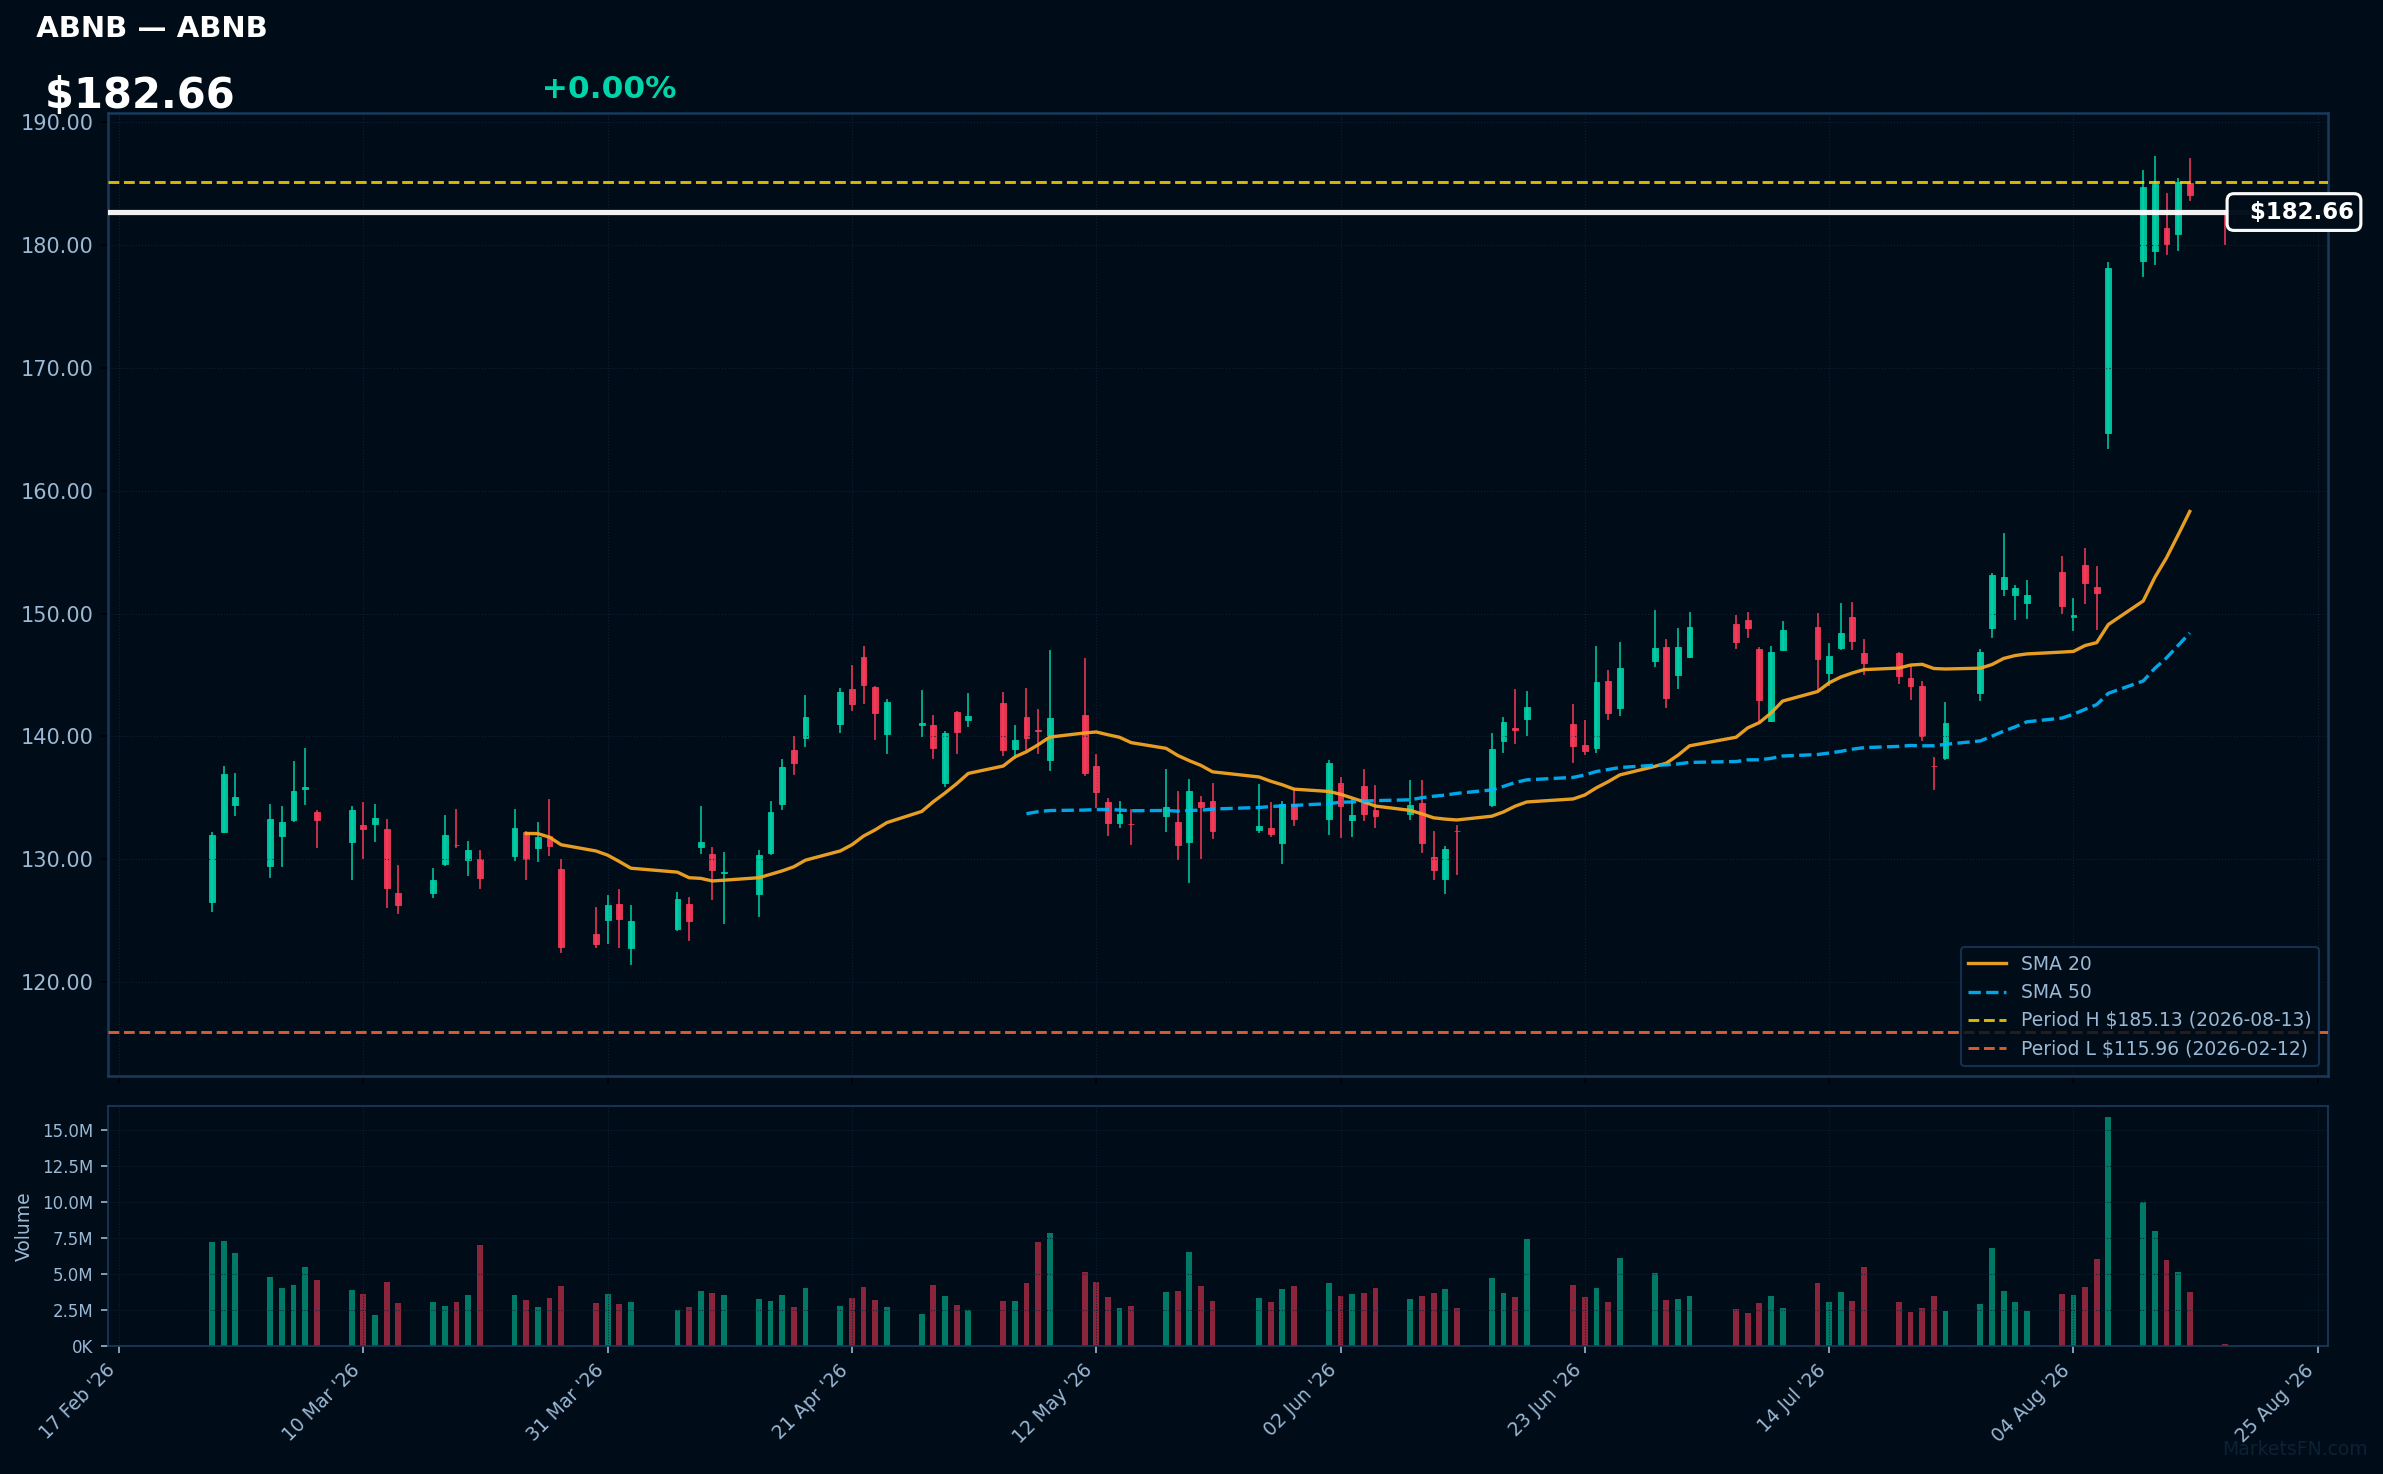
ABNB | Airbnb Inc | Consumer Cyclical | Price Last: $184.06 | % Realized: +38.38% | RSI: 72.9 | % above MA200: +36.3% | Trend: Above MA20, MA50, MA200
Airbnb Inc (ABNB) operates an online marketplace for lodging, primarily short-term rentals. Investors should care due to its innovative approach to travel accommodation, tapping into the growing demand for unique travel experiences and alternative lodging options.
Currently, ABNB shows bullish momentum with an RSI(14) of 72.9 and a strong MA alignment: price > MA20 > MA50 > MA200. The stock is also 0.6% below its 2026 YTD high, indicating potential for a breakout.
Related headlines
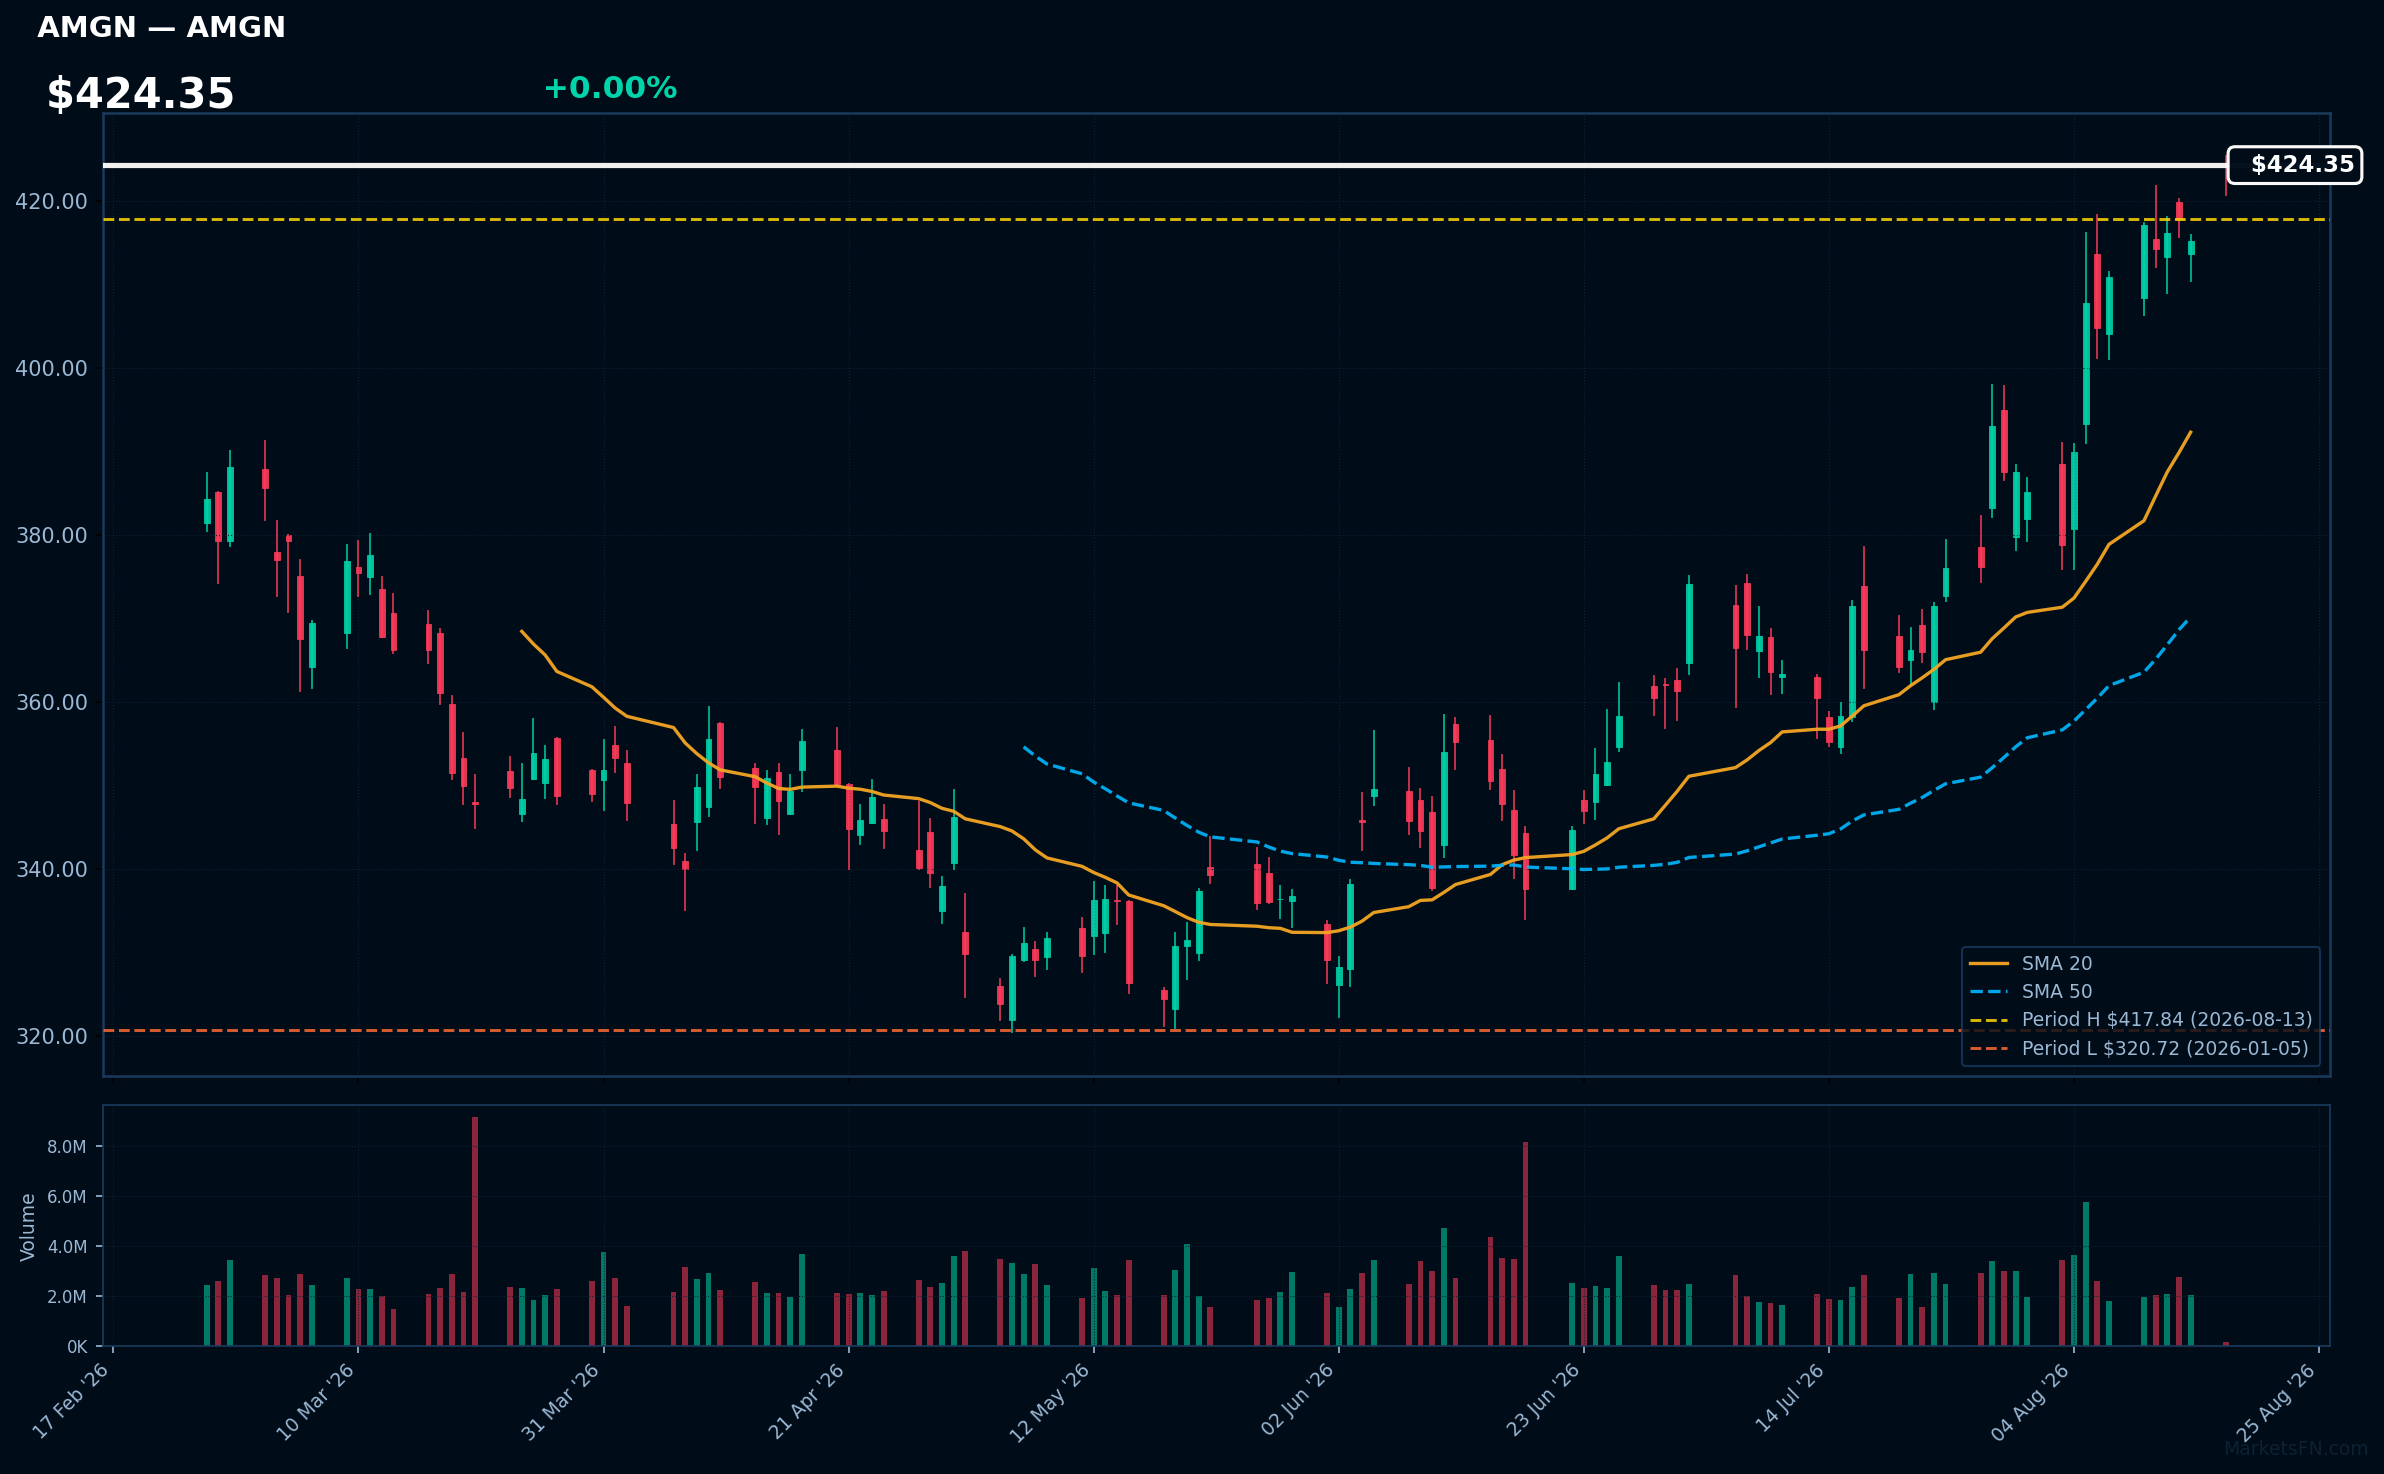
AMGN | AMGEN Inc | Healthcare | Price Last: $415.21 | % Realized: +26.73% | RSI: 73.8 | % above MA200: +18.6% | Trend: Above MA20, MA50, MA200
AMGEN Inc (AMGN) is a biotechnology company that develops innovative therapies for serious illnesses, focusing on areas like oncology and cardiovascular disease. Investors should care due to its strong pipeline and potential for significant market impact, driving future revenue growth.
AMGN shows bullish momentum with an RSI(14) of 73.8 and a strong MA alignment: price > MA20 > MA50 > MA200. The stock is 0.6% below its 2026 YTD high, indicating a potential breakout.
Related headlines
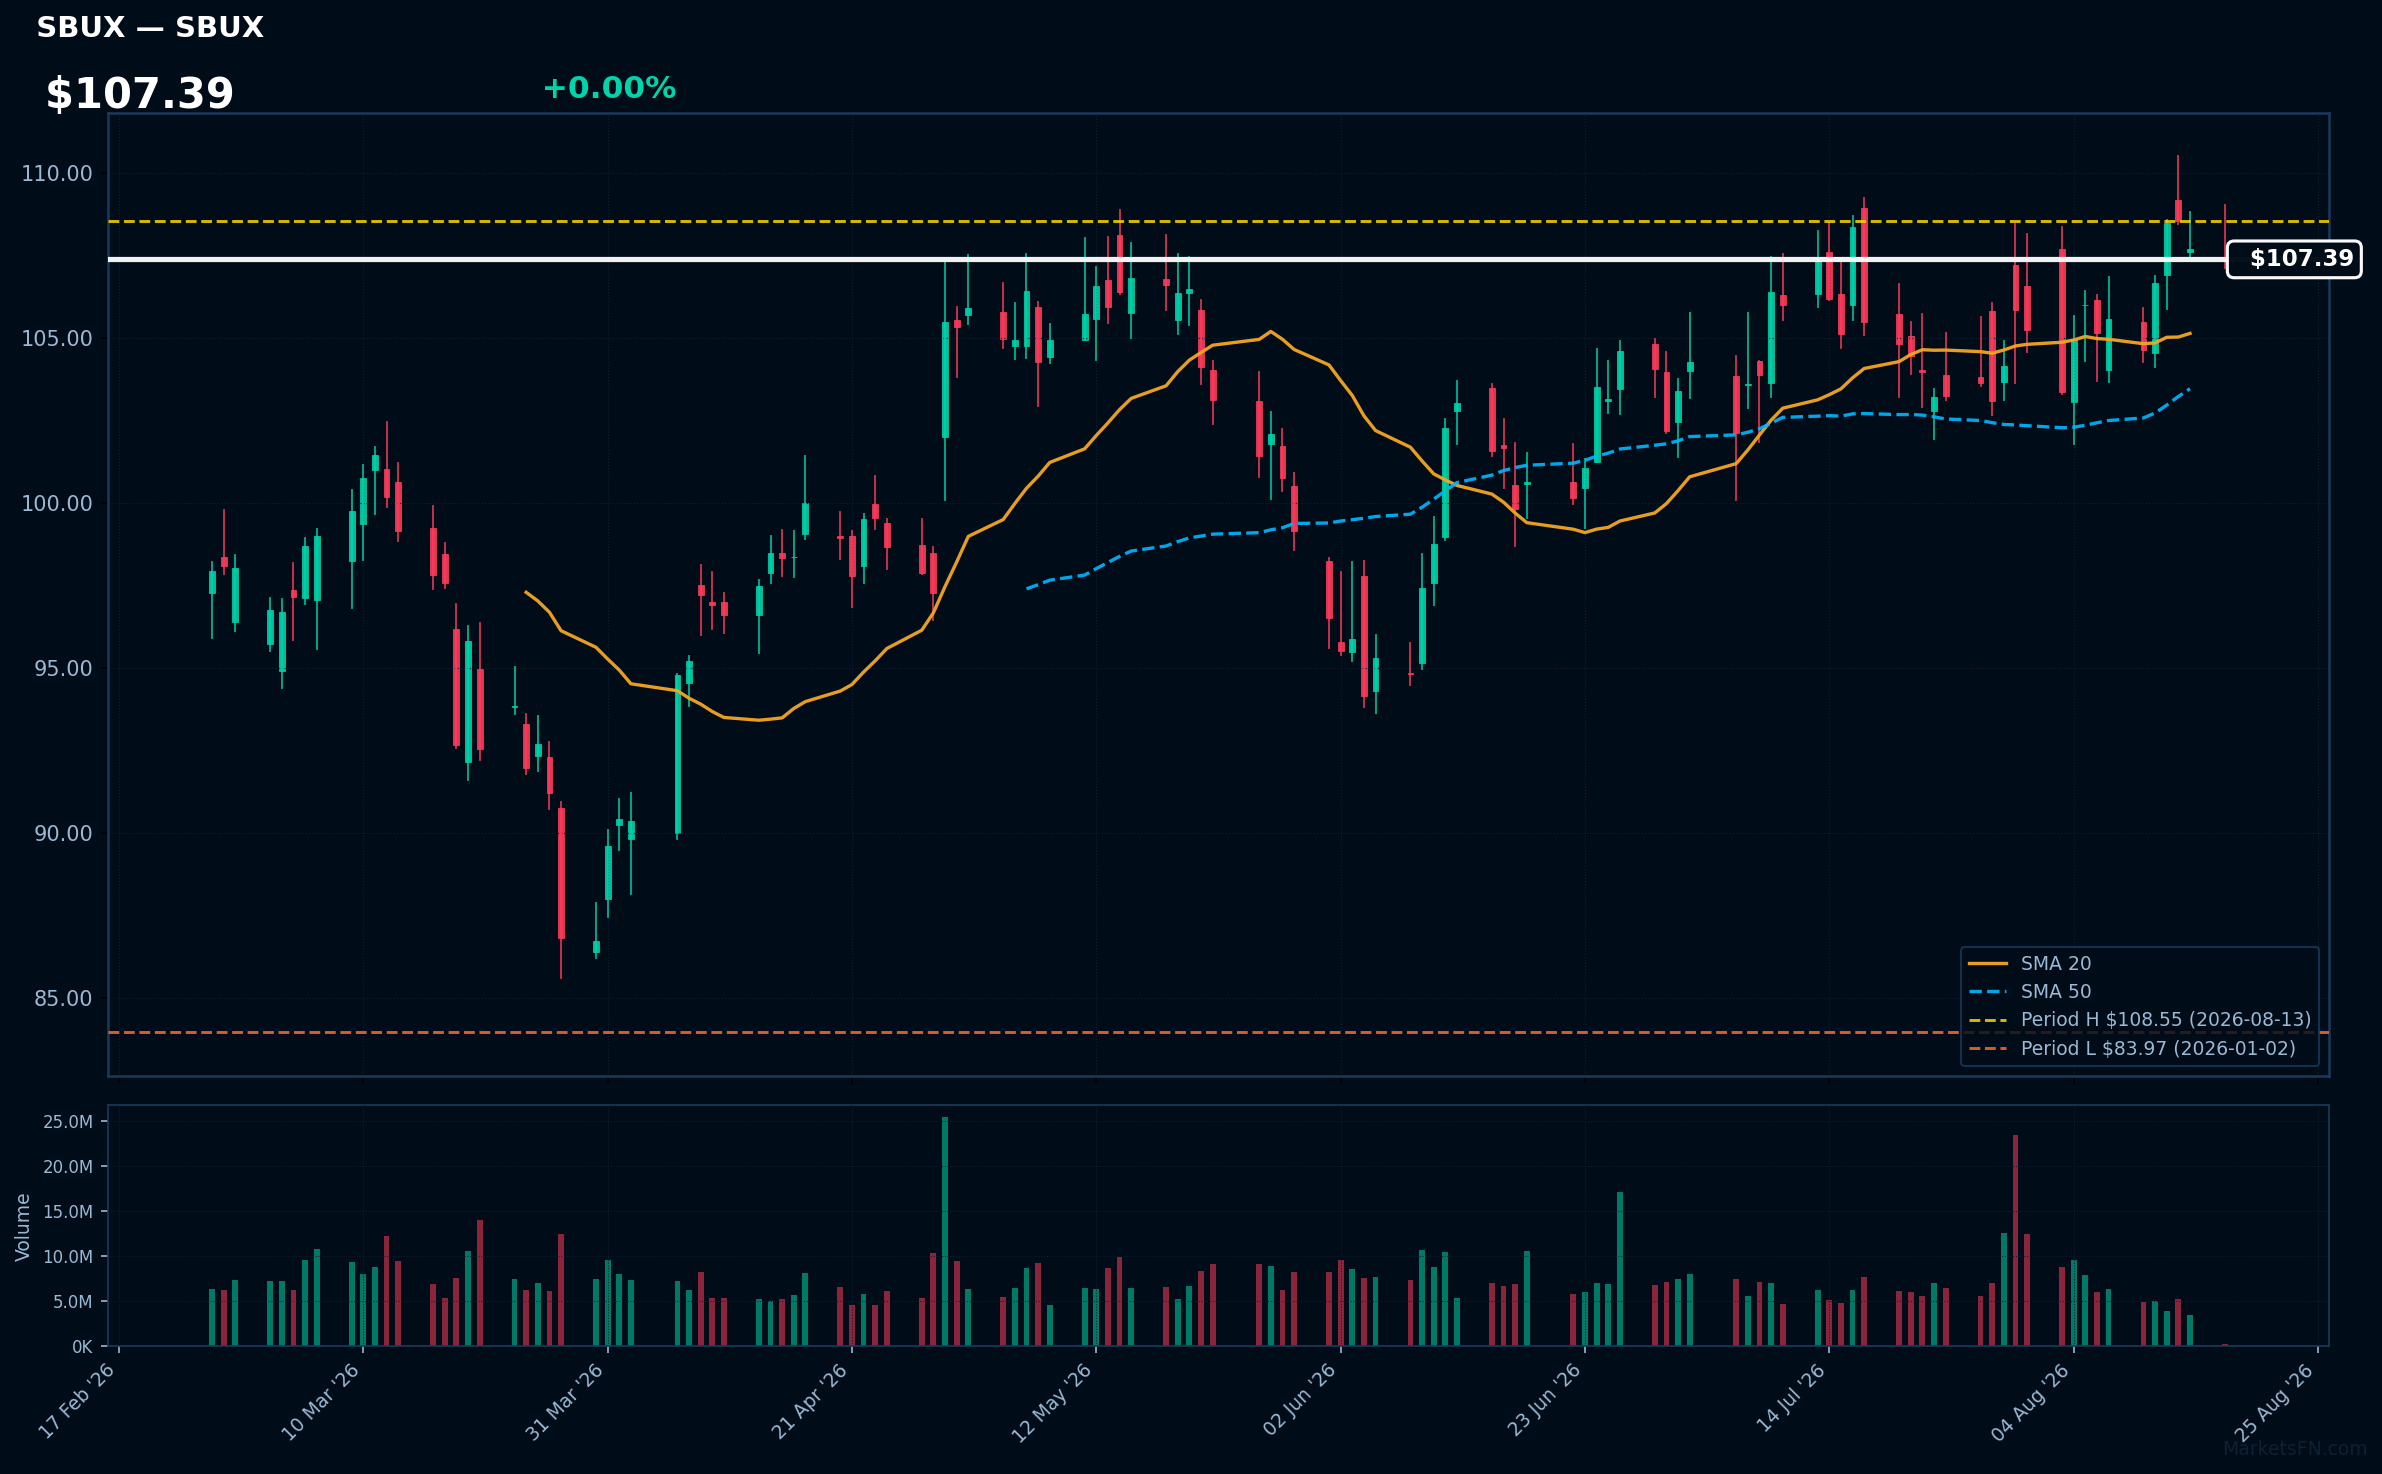
SBUX | Starbucks Corp | Consumer Cyclical | Price Last: $107.69 | % Realized: +28.25% | RSI: 57.3 | % above MA200: +12.1% | Trend: Above MA20, MA50, MA200
Starbucks Corp (SBUX) operates a global chain of coffeehouses, offering premium coffee, beverages, and food items. Investors should care due to its strong brand loyalty, consistent revenue growth, and expansion into new markets, which drive long-term profitability.
Currently, SBUX shows bullish momentum with an RSI(14) of 57.3 and a strong MA alignment: price > MA20 > MA50 > MA200. The stock is 0.8% below its 2026 YTD high, indicating potential for a breakout.
Related headlines
📉 Nearest to 2026 Low
Sectors represented: Consumer Defensive (2), Communication Services (2), Healthcare (1)
| Ticker | Company | Sector | Price Last | % Realized | 2026 YTD Low Date | RSI | % above MA200 | Trend |
|---|---|---|---|---|---|---|---|---|
| MNST | Monster Beverage Corp | Consumer Defensive | $45.52 | -40.23% | 2026-08-17 | 14.2 | -43.4% | Below MA20, MA50, MA200 |
| EA | Electronic Arts, Inc | Communication Services | $209.70 | +0.38% | 2026-07-17 | — | — | — |
| AZN | Astrazeneca plc ADR | Healthcare | $156.45 | -14.57% | 2026-08-04 | 40.4 | -15.1% | Below MA20, MA50, MA200 |
| APP | Applovin Corp | Communication Services | $315.44 | -48.98% | 2026-08-12 | 29.6 | -37.7% | Below MA20, MA50, MA200 |
| PEP | PepsiCo Inc | Consumer Defensive | $140.79 | -1.01% | 2026-07-23 | 50.3 | -5.5% | Above MA20, MA50 · Below MA200 |
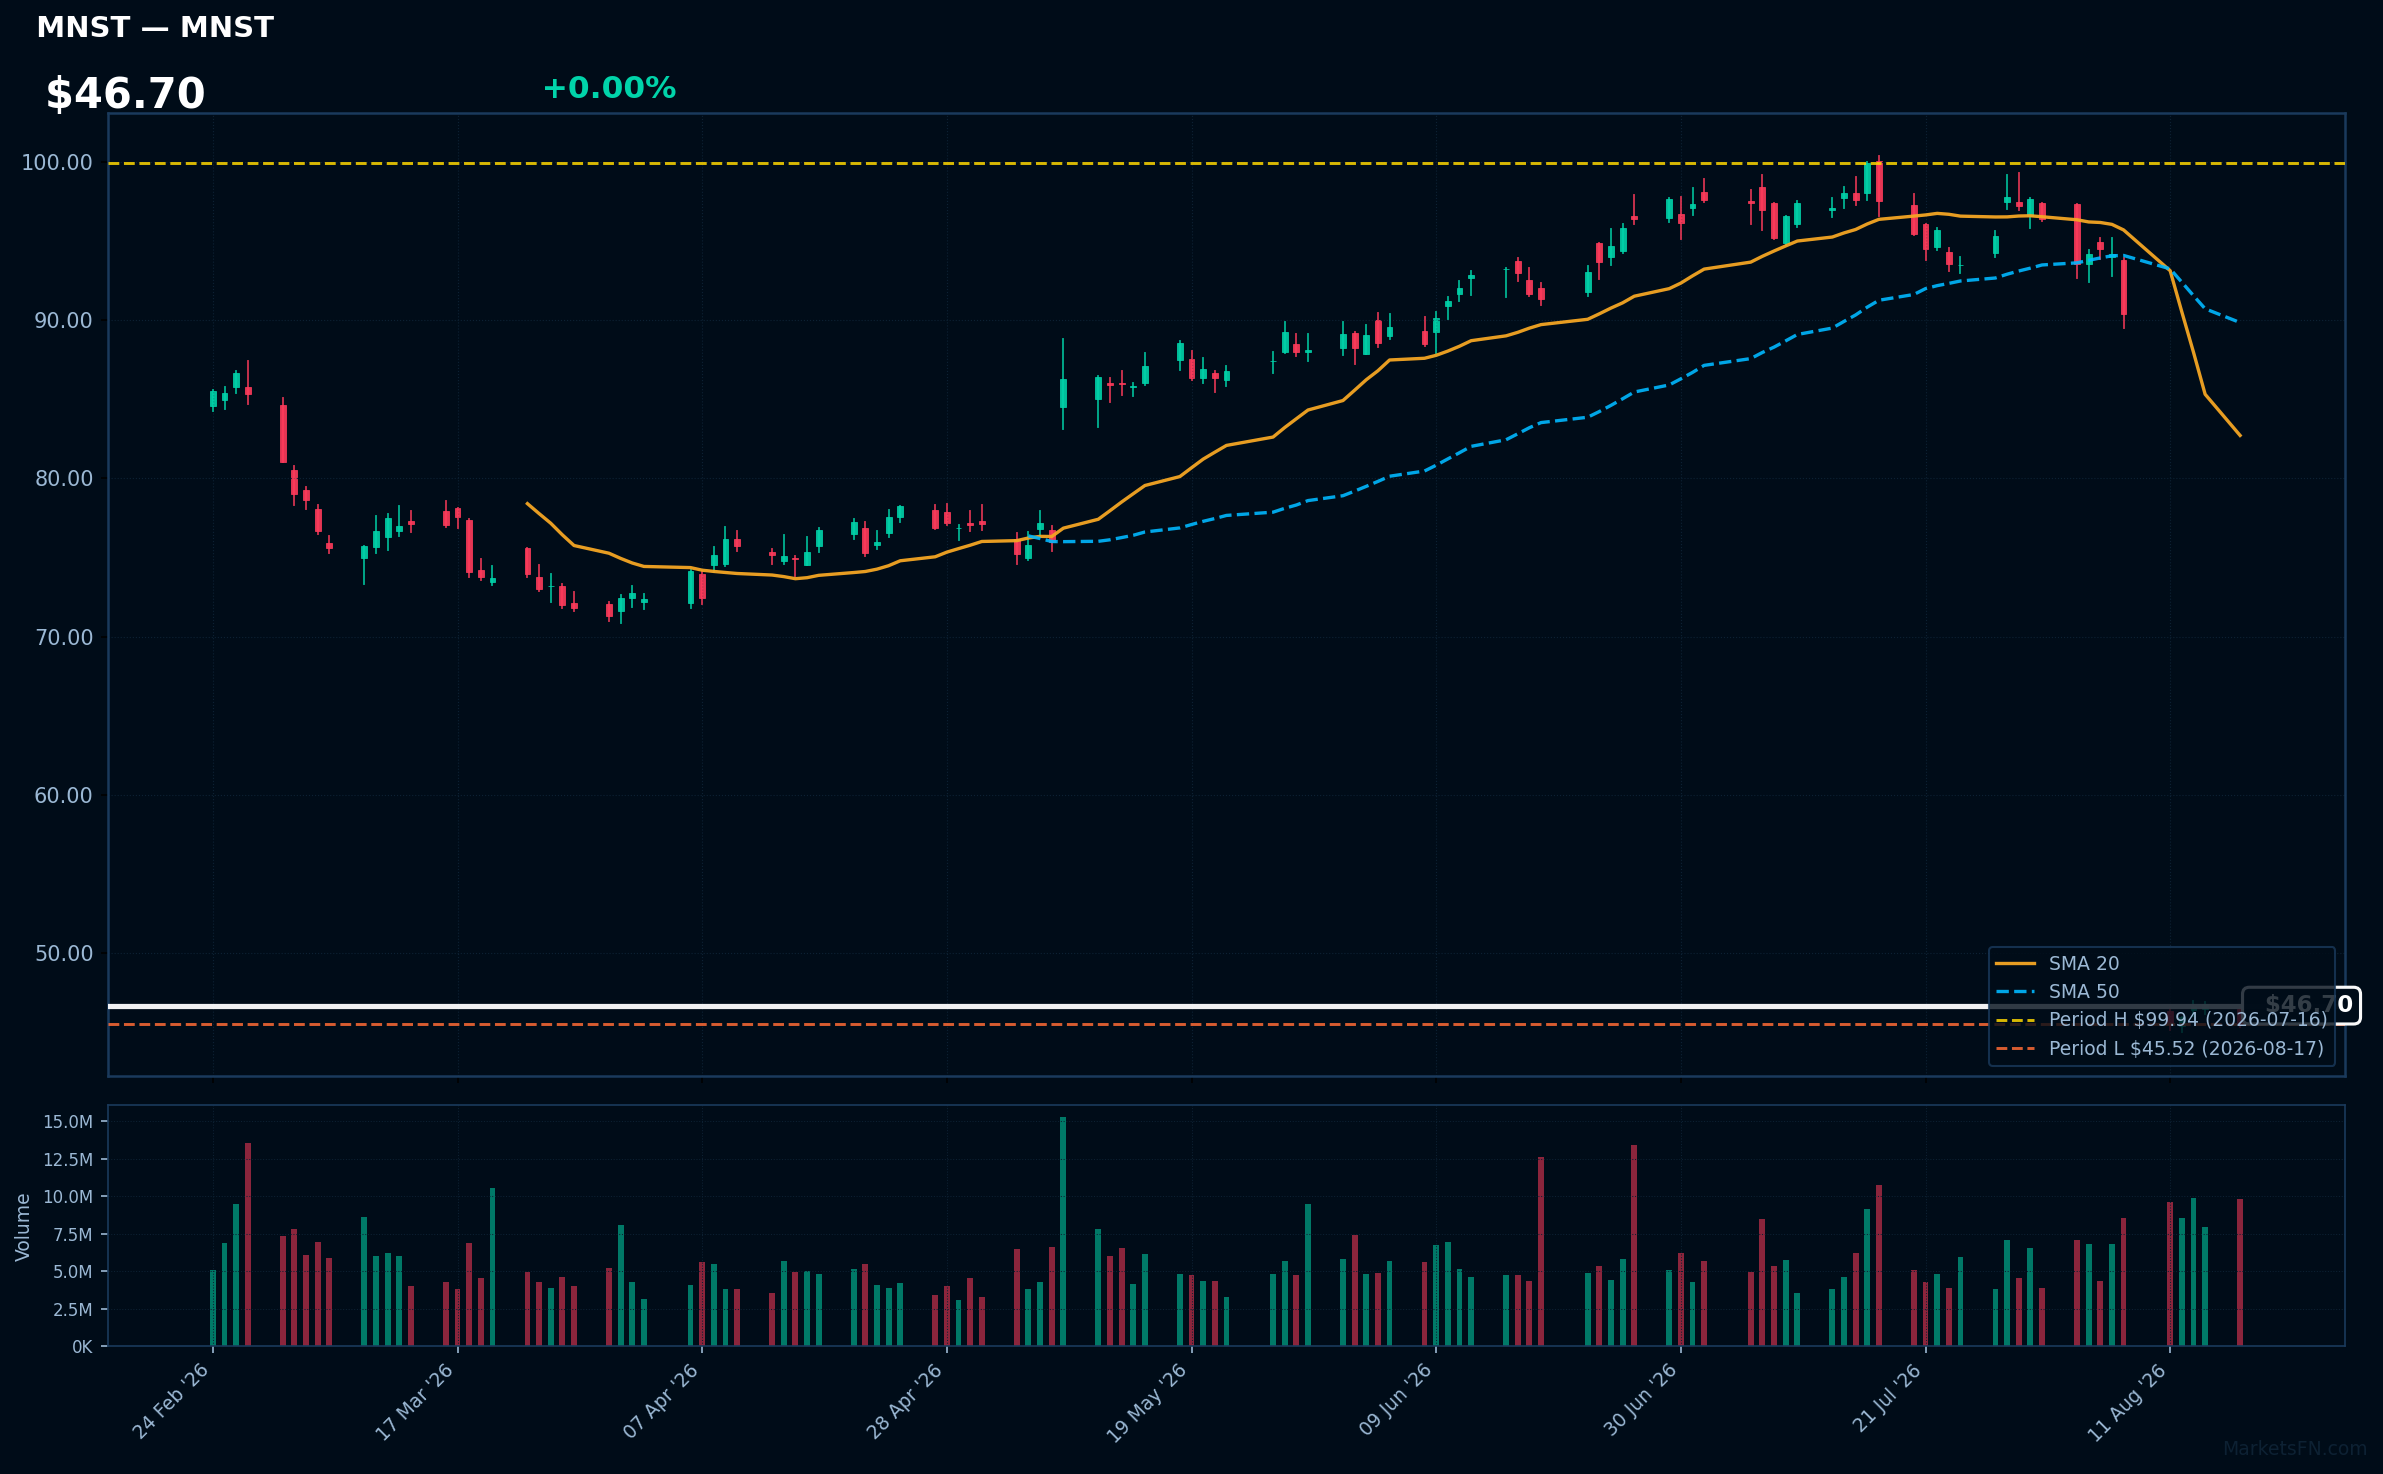
MNST | Monster Beverage Corp | Consumer Defensive | Price Last: $45.52 | % Realized: -40.23% | RSI: 14.2 | % above MA200: -43.4% | Trend: Below MA20, MA50, MA200
Monster Beverage Corp (MNST) develops and markets energy drinks, focusing on innovative flavors and branding. Investors should care due to its significant market presence and potential for growth in the expanding energy drink sector.
The current technical situation signals a warning sign, with an RSI(14) of 14.2 and mixed signals below MA20/MA50/MA200, indicating bearish momentum.
Related headlines
EA | Electronic Arts, Inc | Communication Services | Price Last: $209.70 | % Realized: +0.38% | RSI: — | % above MA200: — | Trend: —
Electronic Arts, Inc. develops and publishes interactive entertainment software, known for franchises like FIFA and Madden NFL. Investors should care due to its strong brand portfolio and potential for growth in the gaming industry, particularly with increasing digital sales and engagement.
The stock is 0.0% below its 2026 YTD high, indicating a potential breakout level. However, RSI(14) data is N/A and MA data is incomplete, limiting technical analysis.
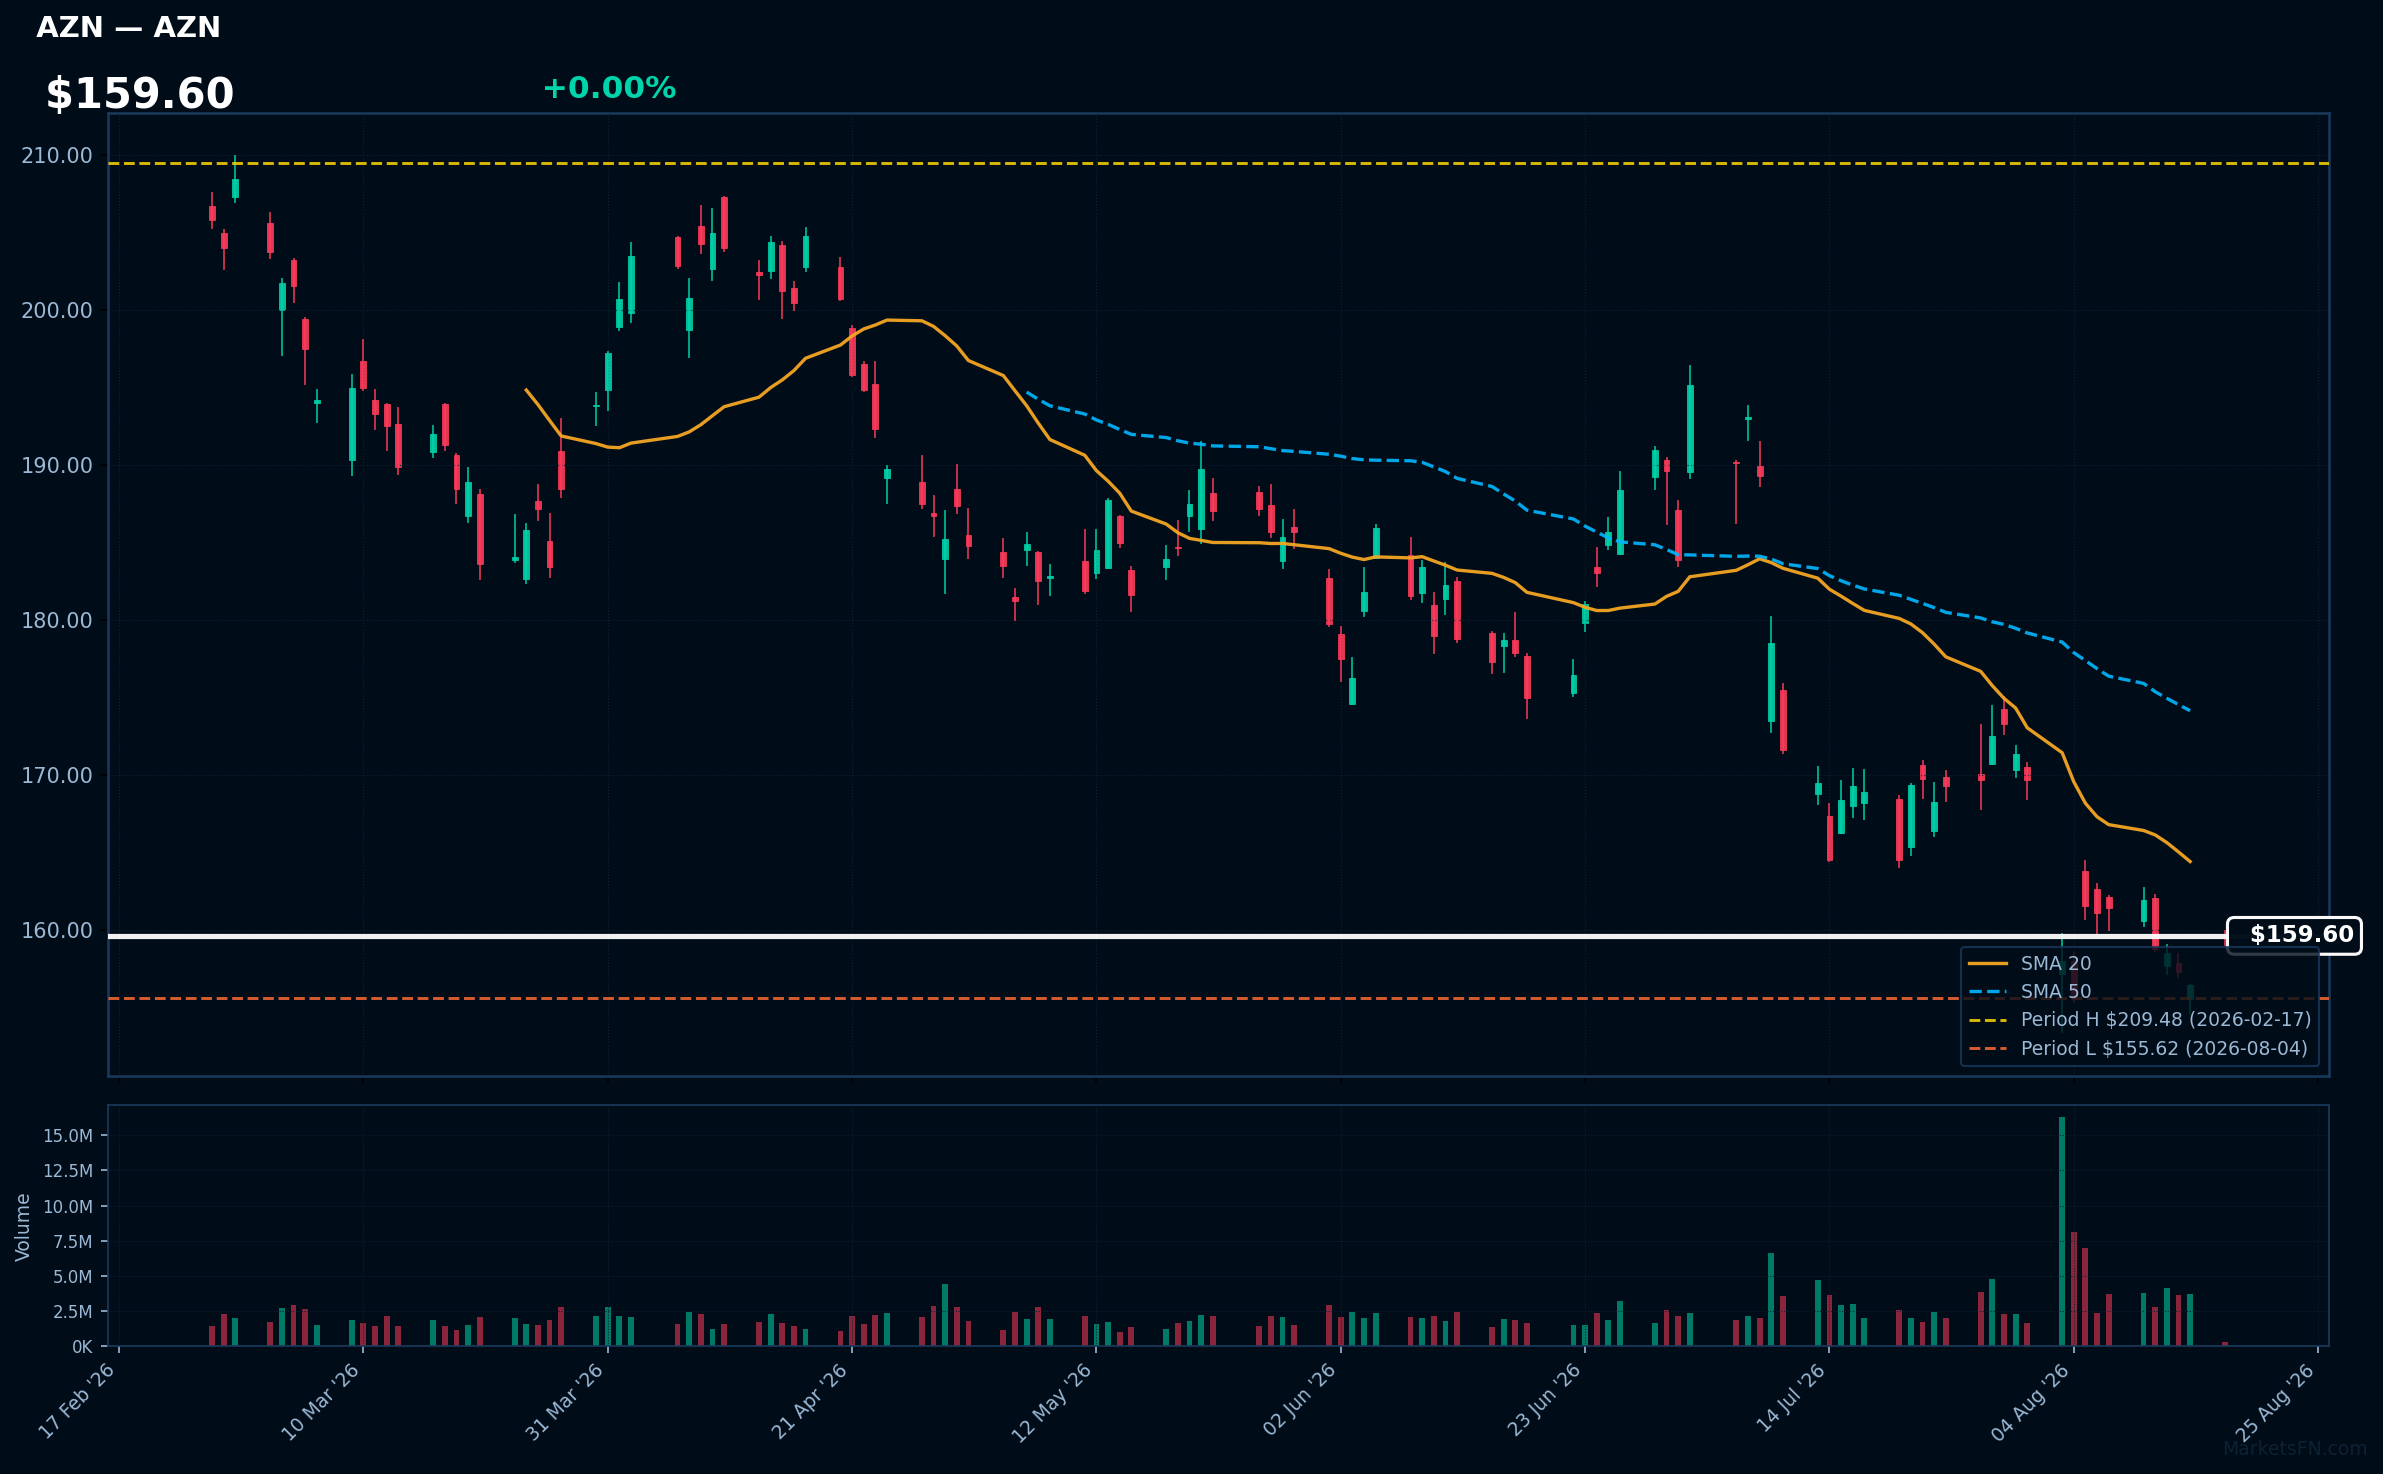
AZN | Astrazeneca plc ADR | Healthcare | Price Last: $156.45 | % Realized: -14.57% | RSI: 40.4 | % above MA200: -15.1% | Trend: Below MA20, MA50, MA200
Astrazeneca plc ADR is a global biopharmaceutical company focused on the discovery, development, and commercialization of prescription medicines, particularly in oncology, cardiovascular, and respiratory diseases. Investors should care due to its significant role in addressing critical health challenges and potential for growth in these therapeutic areas.
The current technical situation indicates a bearish trend, with an RSI(14) of 40.4 and a MA alignment showing price < MA20 < MA50 < MA200. The stock is testing major support, being only 0.5% above its 2026 YTD low.
Related headlines
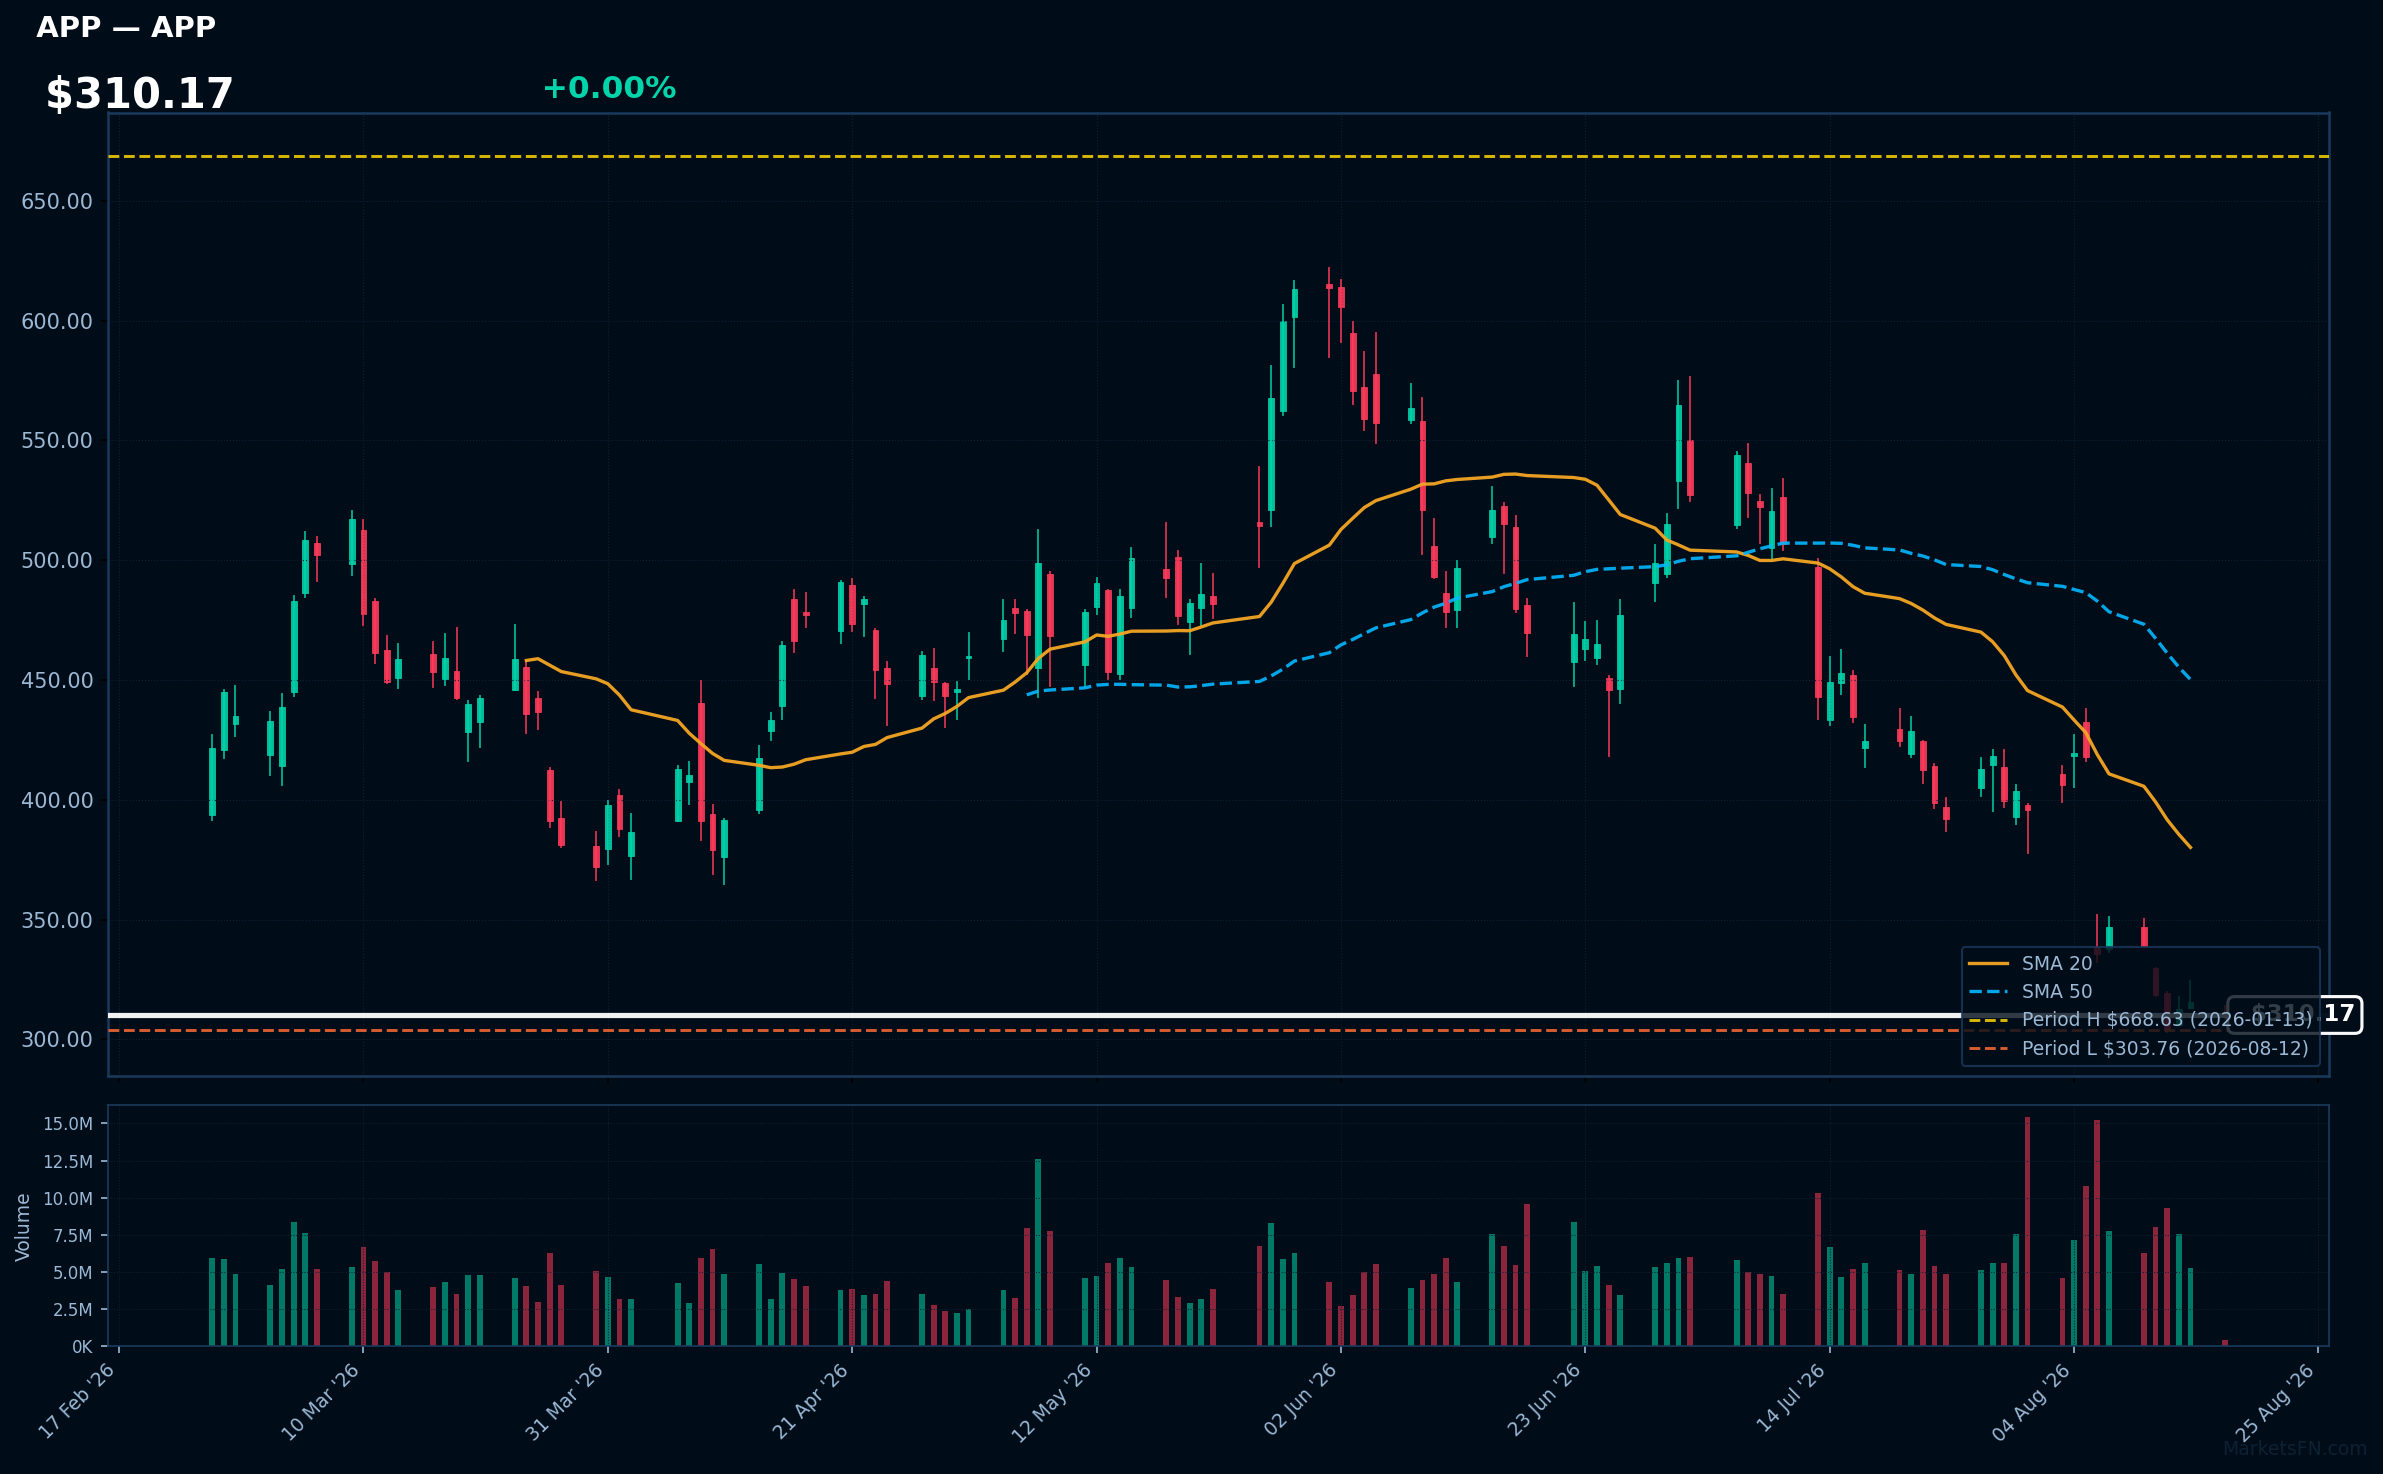
APP | Applovin Corp | Communication Services | Price Last: $315.44 | % Realized: -48.98% | RSI: 29.6 | % above MA200: -37.7% | Trend: Below MA20, MA50, MA200
Applovin Corp (APP) provides a platform for mobile app developers to monetize and market their applications. Investors should care due to its significant market presence and potential for growth in the mobile advertising sector, which is increasingly vital as app usage continues to rise.
The current technical situation indicates a warning sign, with an RSI(14) of 29.6 suggesting oversold conditions. The bearish MA alignment shows price < MA20 < MA50 < MA200, indicating a sustained downtrend as the stock tests major support, being only 3.8% above its 2026 YTD low.
Related headlines
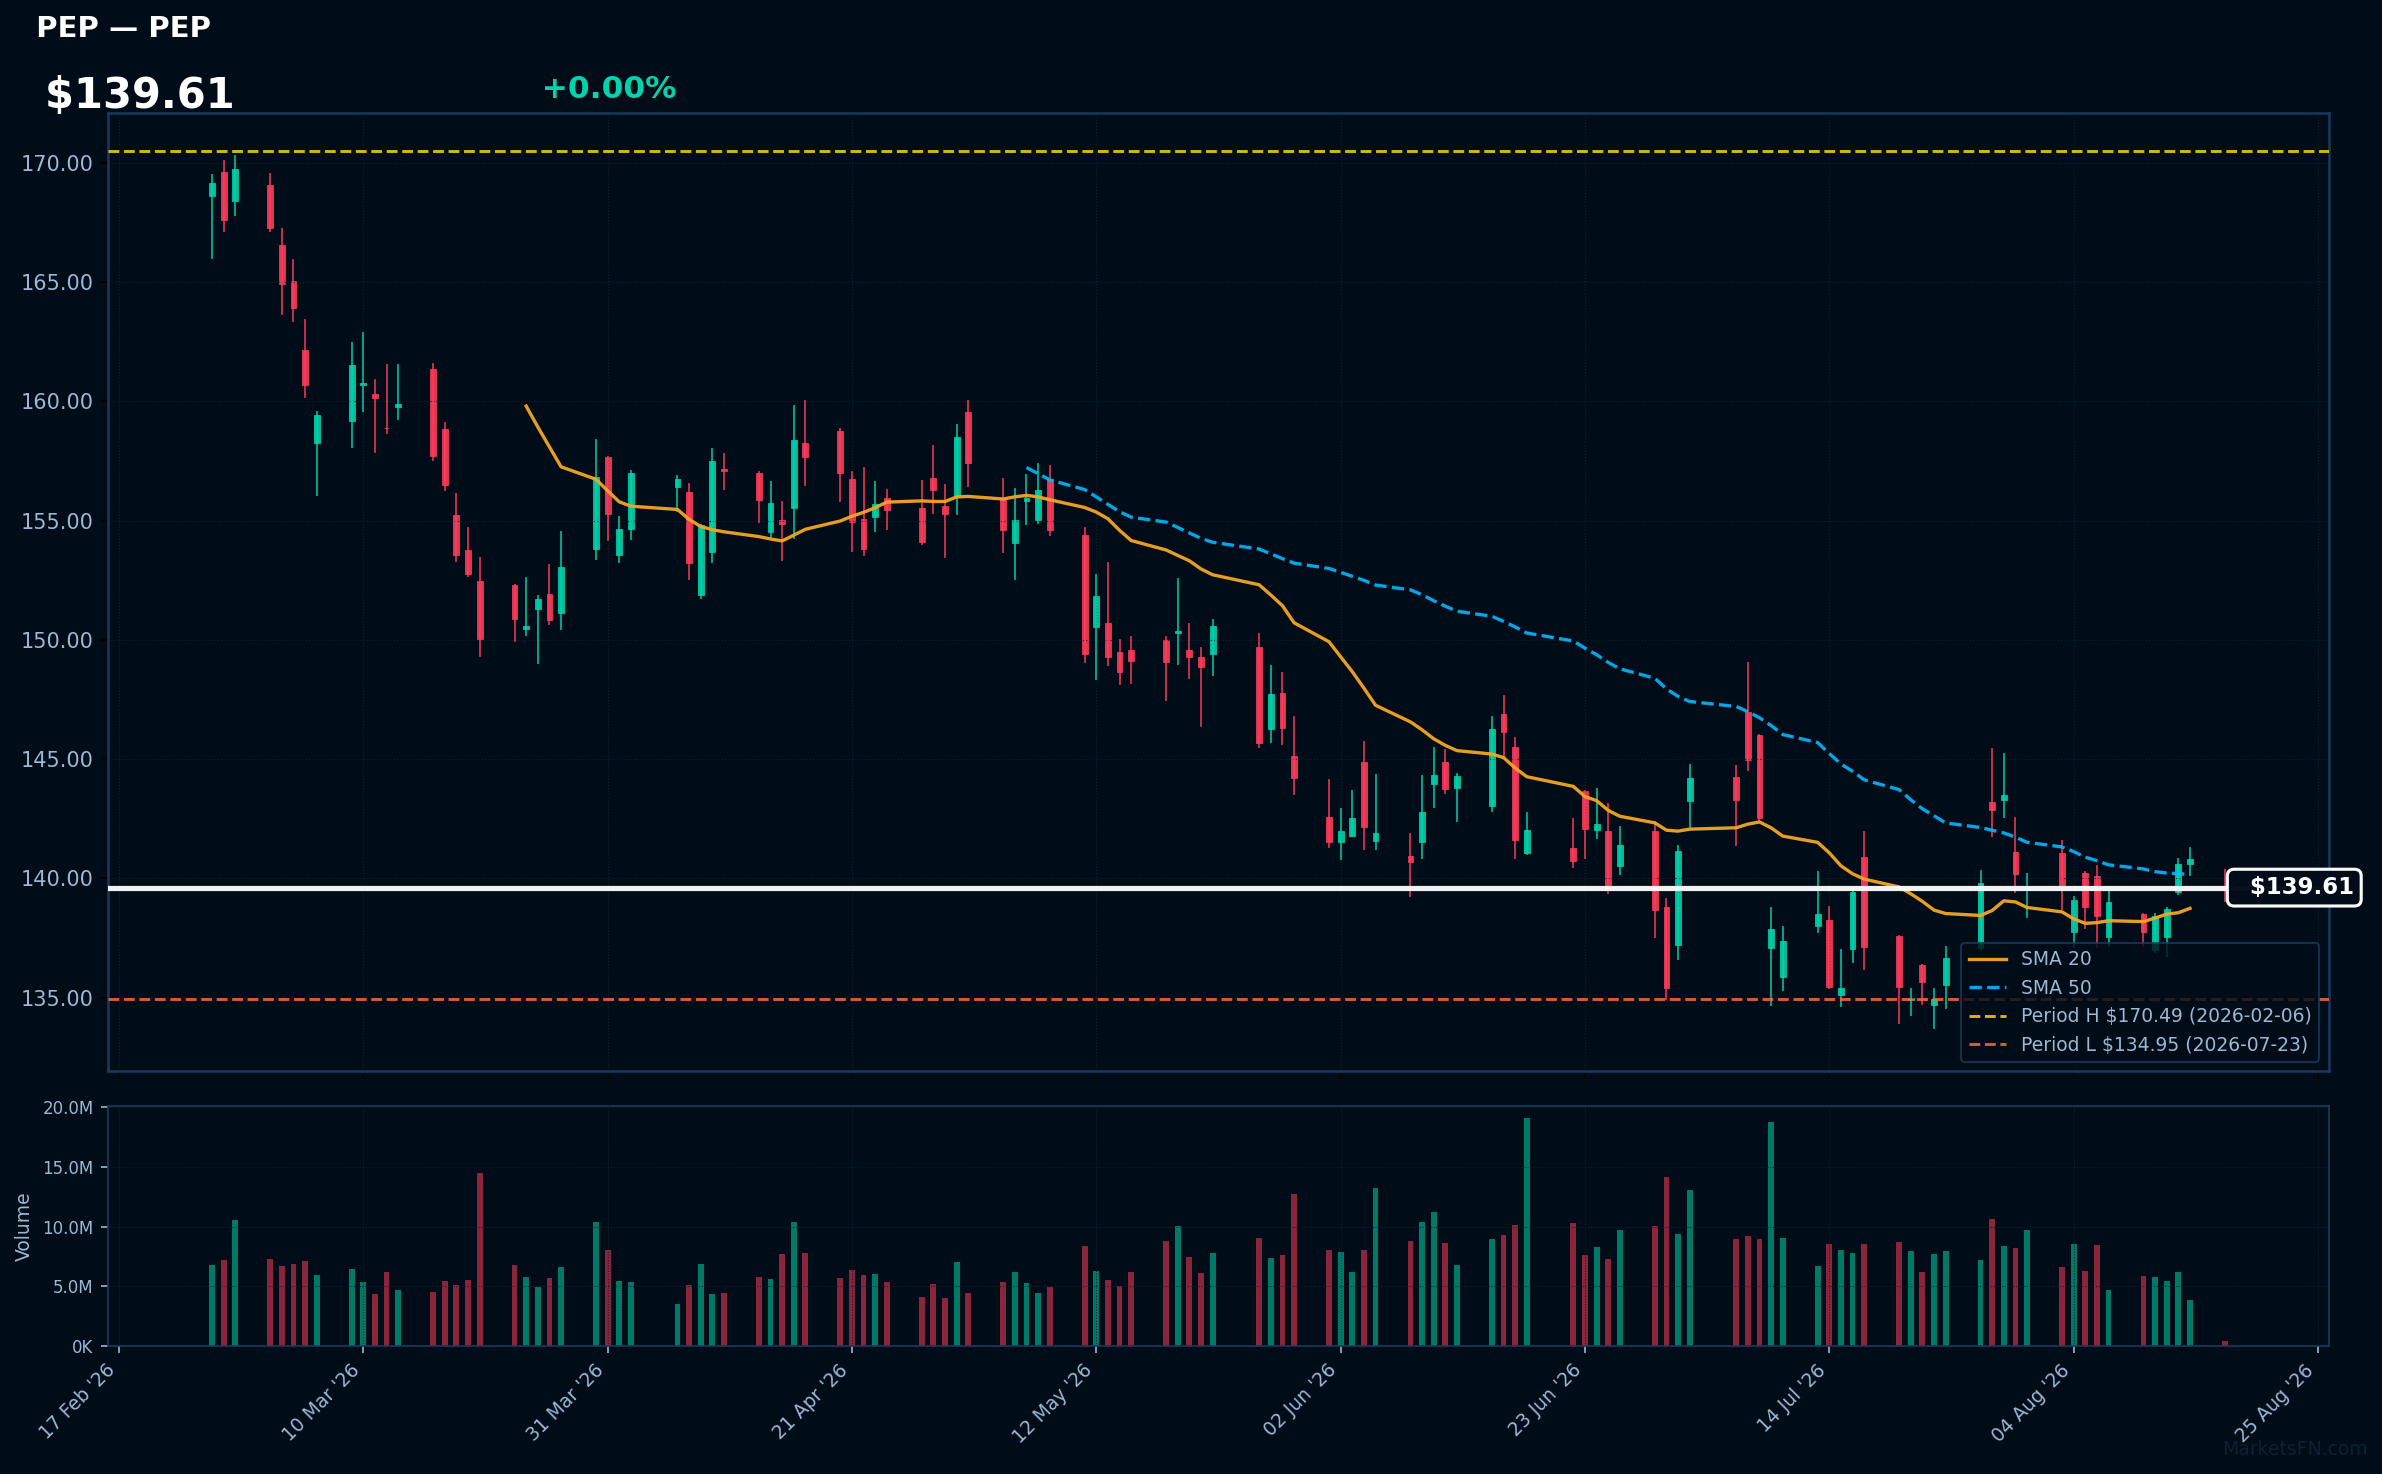
PEP | PepsiCo Inc | Consumer Defensive | Price Last: $140.79 | % Realized: -1.01% | RSI: 50.3 | % above MA200: -5.5% | Trend: Above MA20, MA50 · Below MA200
PepsiCo Inc (PEP) is a global leader in snacks and beverages, known for its diverse portfolio including brands like Lay's, Gatorade, and Tropicana. Investors should care due to its strong market presence and consistent demand for consumer staples, which can provide stability in volatile markets.
The current technical situation shows mixed signals: the RSI(14) is at 50.3, indicating neutrality, while the price is above MA20 but below MA50 and MA200. Additionally, the stock is only 4.3% above its 2026 YTD low, testing major support.
Related headlines
Market Commentary
The proximity of Nasdaq 100 stocks to their 2026 year-to-date extremes indicates heightened volatility and investor sentiment in the technology sector. Stocks like PayPal Holdings Inc (PYPL) and Electronic Arts, Inc (EA) are at their highs, suggesting strong market confidence and potential bullish momentum. Conversely, stocks such as Monster Beverage Corp (MNST) and Astrazeneca plc ADR (AZN) near their lows reflect underlying challenges that may be affecting investor perceptions and market dynamics.
Current technology sector themes include the ongoing digital transformation, increased demand for gaming and entertainment, and the impact of macroeconomic conditions such as interest rates and inflation. The resilience of companies like Airbnb Inc (ABNB) and Starbucks Corp (SBUX) near their highs suggests that consumer spending remains robust in certain segments, while others face pressures that could be linked to broader economic uncertainties.
Investors and traders should closely monitor earnings reports and guidance from these companies, as well as macroeconomic indicators that could influence market sentiment. Additionally, watching for shifts in consumer behavior and regulatory developments will be crucial in assessing future performance and potential investment opportunities within the Nasdaq 100.
Methodology: All 101 Nasdaq 100 constituents screened. Close prices downloaded from 2026-01-01. Period high = highest close since Jan 1 2026; period low = lowest close since Jan 1 2026. Distance = (current price / period extreme − 1) × 100. Technical indicators computed on up to 1 year of daily OHLCV data.
Disclaimer: For informational purposes only. Not investment advice. Past performance is not indicative of future results.

