Nasdaq 100 52-Week Highs & Lows Radar: Apple (AAPL), PDD ADR (PDD) and more
MarketsFN Team

Nasdaq 100 52-Week Highs & Lows Radar: Apple (AAPL), PDD ADR (PDD) and more
Screening all 101 Nasdaq 100 constituents for stocks nearest to their 52-week high and their 52-week low. Data as of May 25, 2026. % Realized = 52-week total return.
Legend: RSI > 70 = overbought · RSI < 30 = oversold · Green % Realized = positive 52W return · Red = negative.
📈 Nearest to 52-Week High
Sectors represented: Technology (4), Basic Materials (1)
| Ticker | Company | Sector | Price Last | % Realized | 52-Week High Date | RSI | % above MA200 | Trend |
|---|---|---|---|---|---|---|---|---|
| AAPL | Apple Inc | Technology | $308.82 | +58.15% | 2026-05-22 | 78.4 | +18.1% | Above MA20, MA50, MA200 |
| ASML | ASML Holding NV | Technology | $1632.90 | +122.92% | 2026-05-22 | 62.1 | +38.7% | Above MA20, MA50, MA200 |
| CSCO | Cisco Systems, Inc | Technology | $120.41 | +90.79% | 2026-05-22 | 80.8 | +54.6% | Above MA20, MA50, MA200 |
| AMD | Advanced Micro Devices Inc | Technology | $467.51 | +323.81% | 2026-05-22 | 72.6 | +102.5% | Above MA20, MA50, MA200 |
| LIN | Linde Plc | Basic Materials | $517.58 | +12.79% | 2026-05-22 | 60.3 | +11.4% | Above MA20, MA50, MA200 |
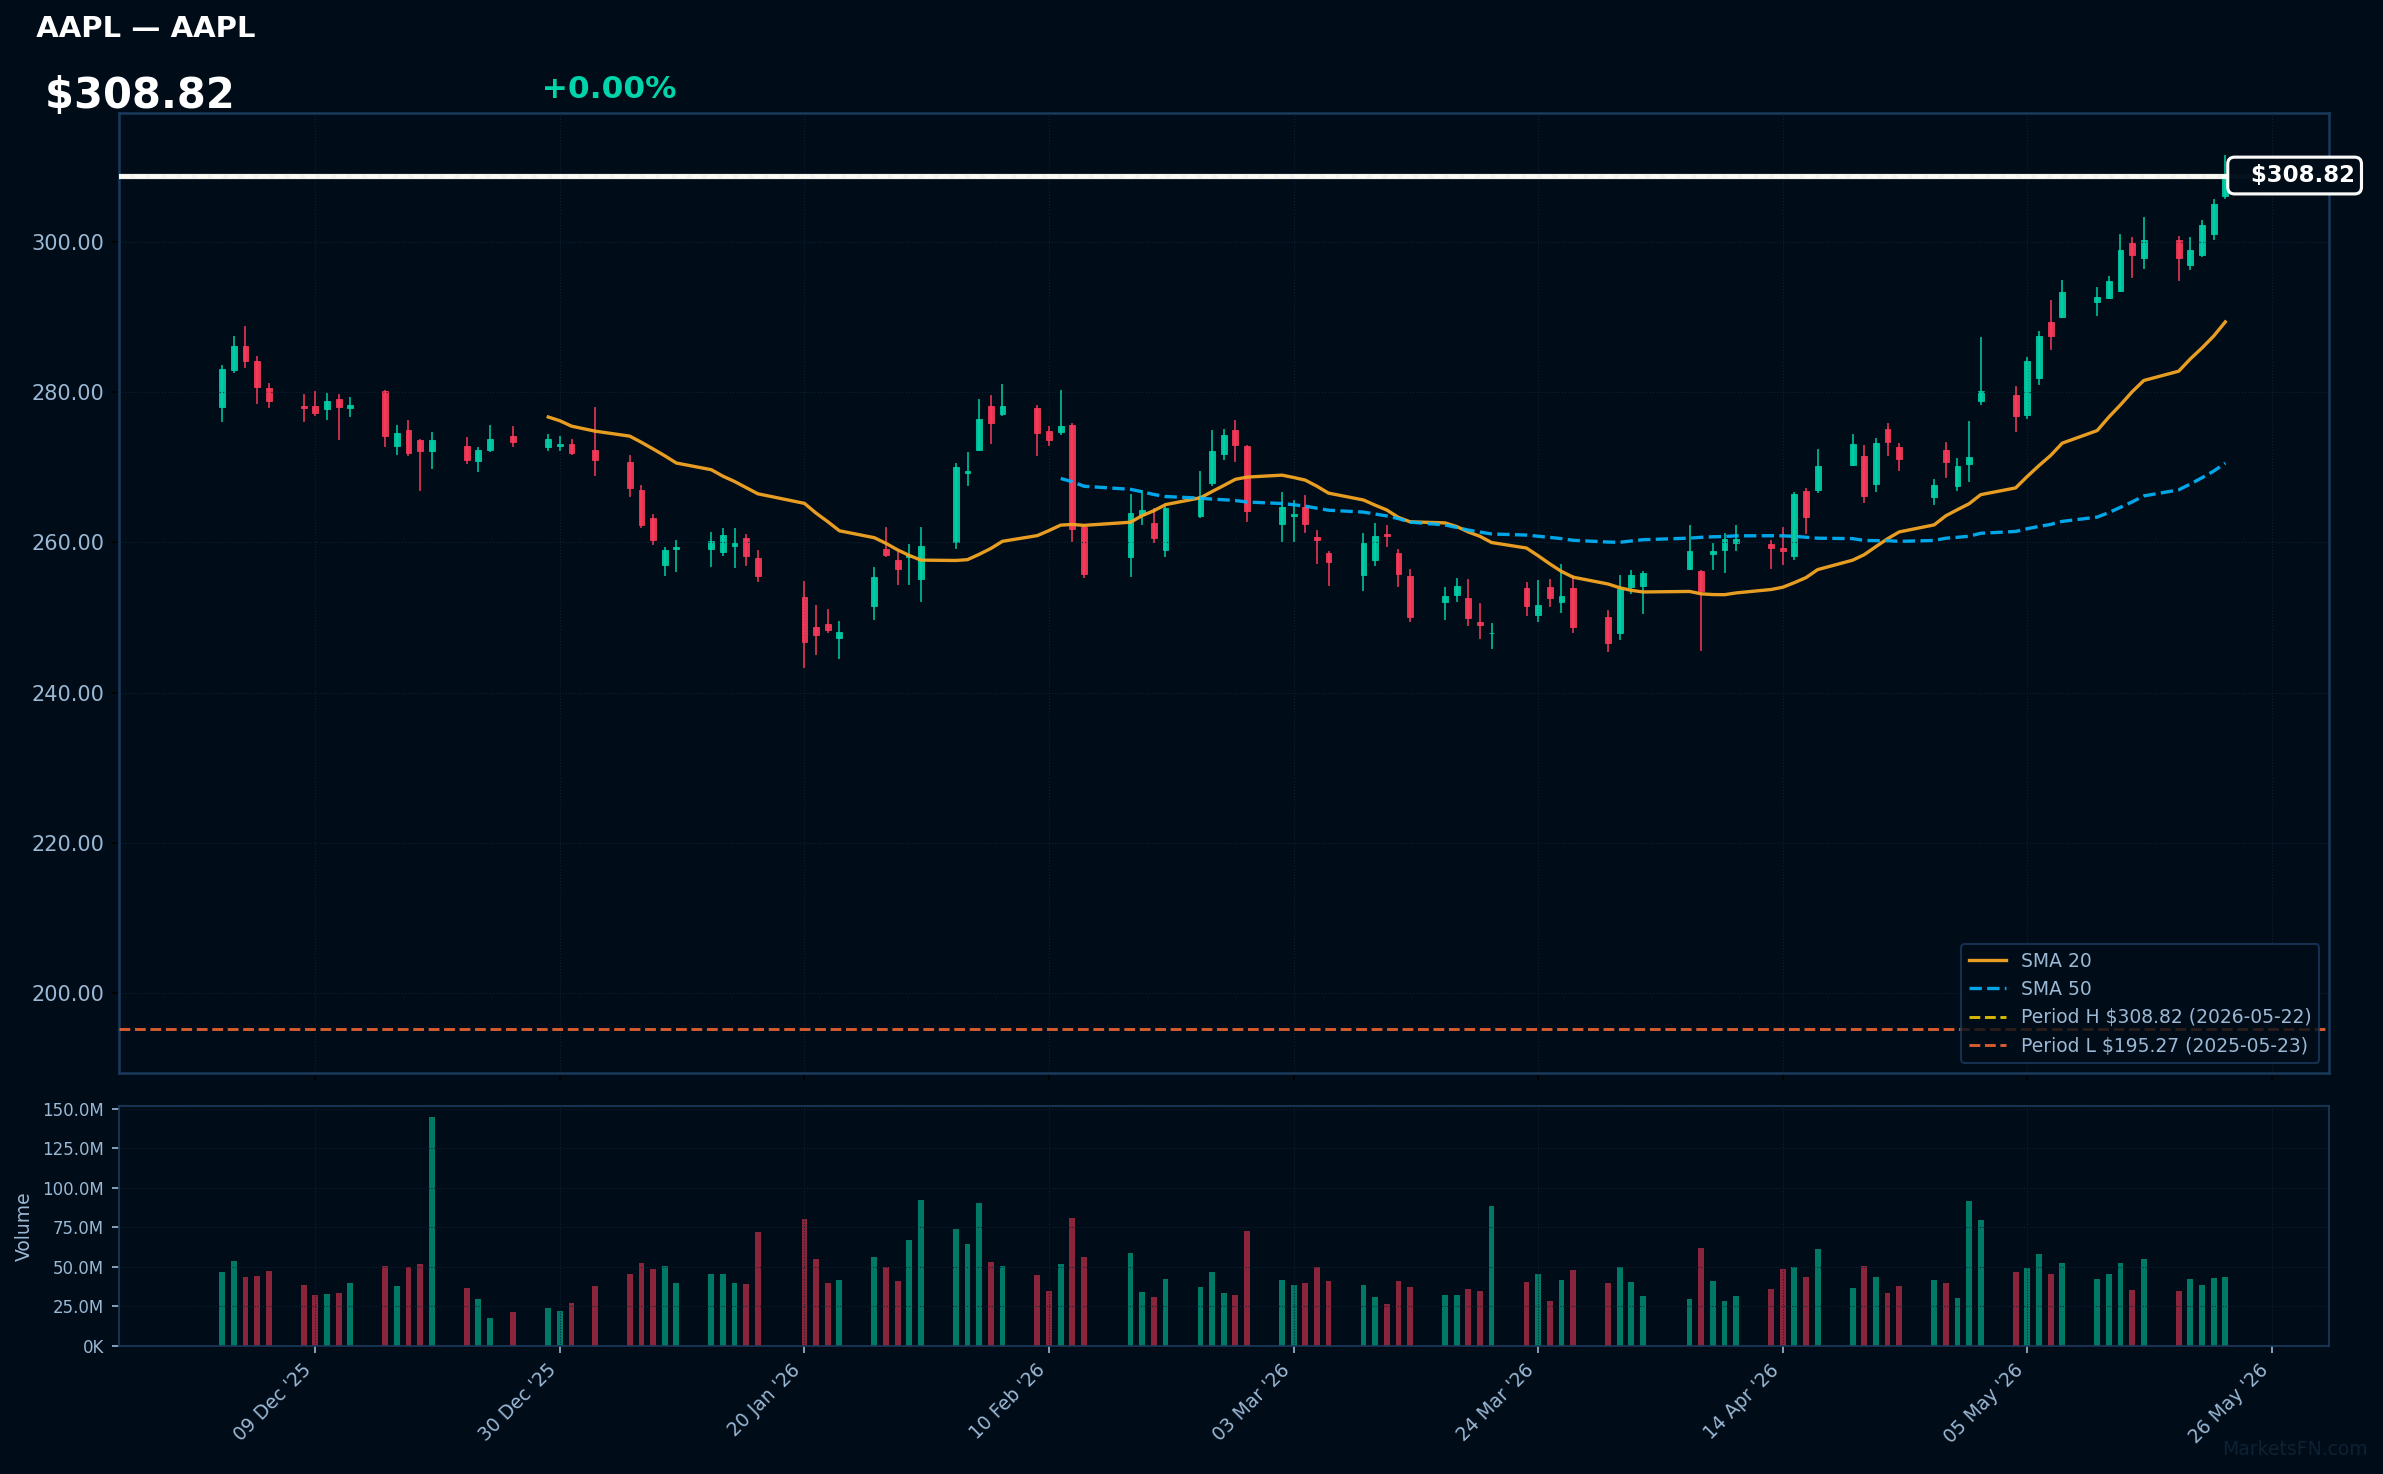
AAPL | Apple Inc | Technology | Price Last: $308.82 | % Realized: +58.15% | RSI: 78.4 | % above MA200: +18.1% | Trend: Above MA20, MA50, MA200
Apple Inc designs, manufactures, and markets consumer electronics, software, and services. Investors care about its innovative product ecosystem, including iPhones, Macs, and wearables, which drive revenue growth and profitability.
AAPL's RSI(14) is 78.4, indicating strong momentum. The bullish MA alignment (price > MA20 > MA50 > MA200) and 0.0% proximity to its 52-Week high suggest a potential breakout, reinforcing the uptrend with a 58.2% 52-Week return.
Related headlines
- Apple: Strong Execution, But Valuation Leaves Me Cautious
- The Apple Silicon Renaissance (Inside Orchard)
- Apple Closes Education Discount Loophole, Kansas City Schools to Become 'All-Apple,' Real Madrid on Apple Vision Pro
- Apple Raises Entry-Level Mac Mini Price, DRAM and NAND Impact on iPhone, Apple Device SKU Management
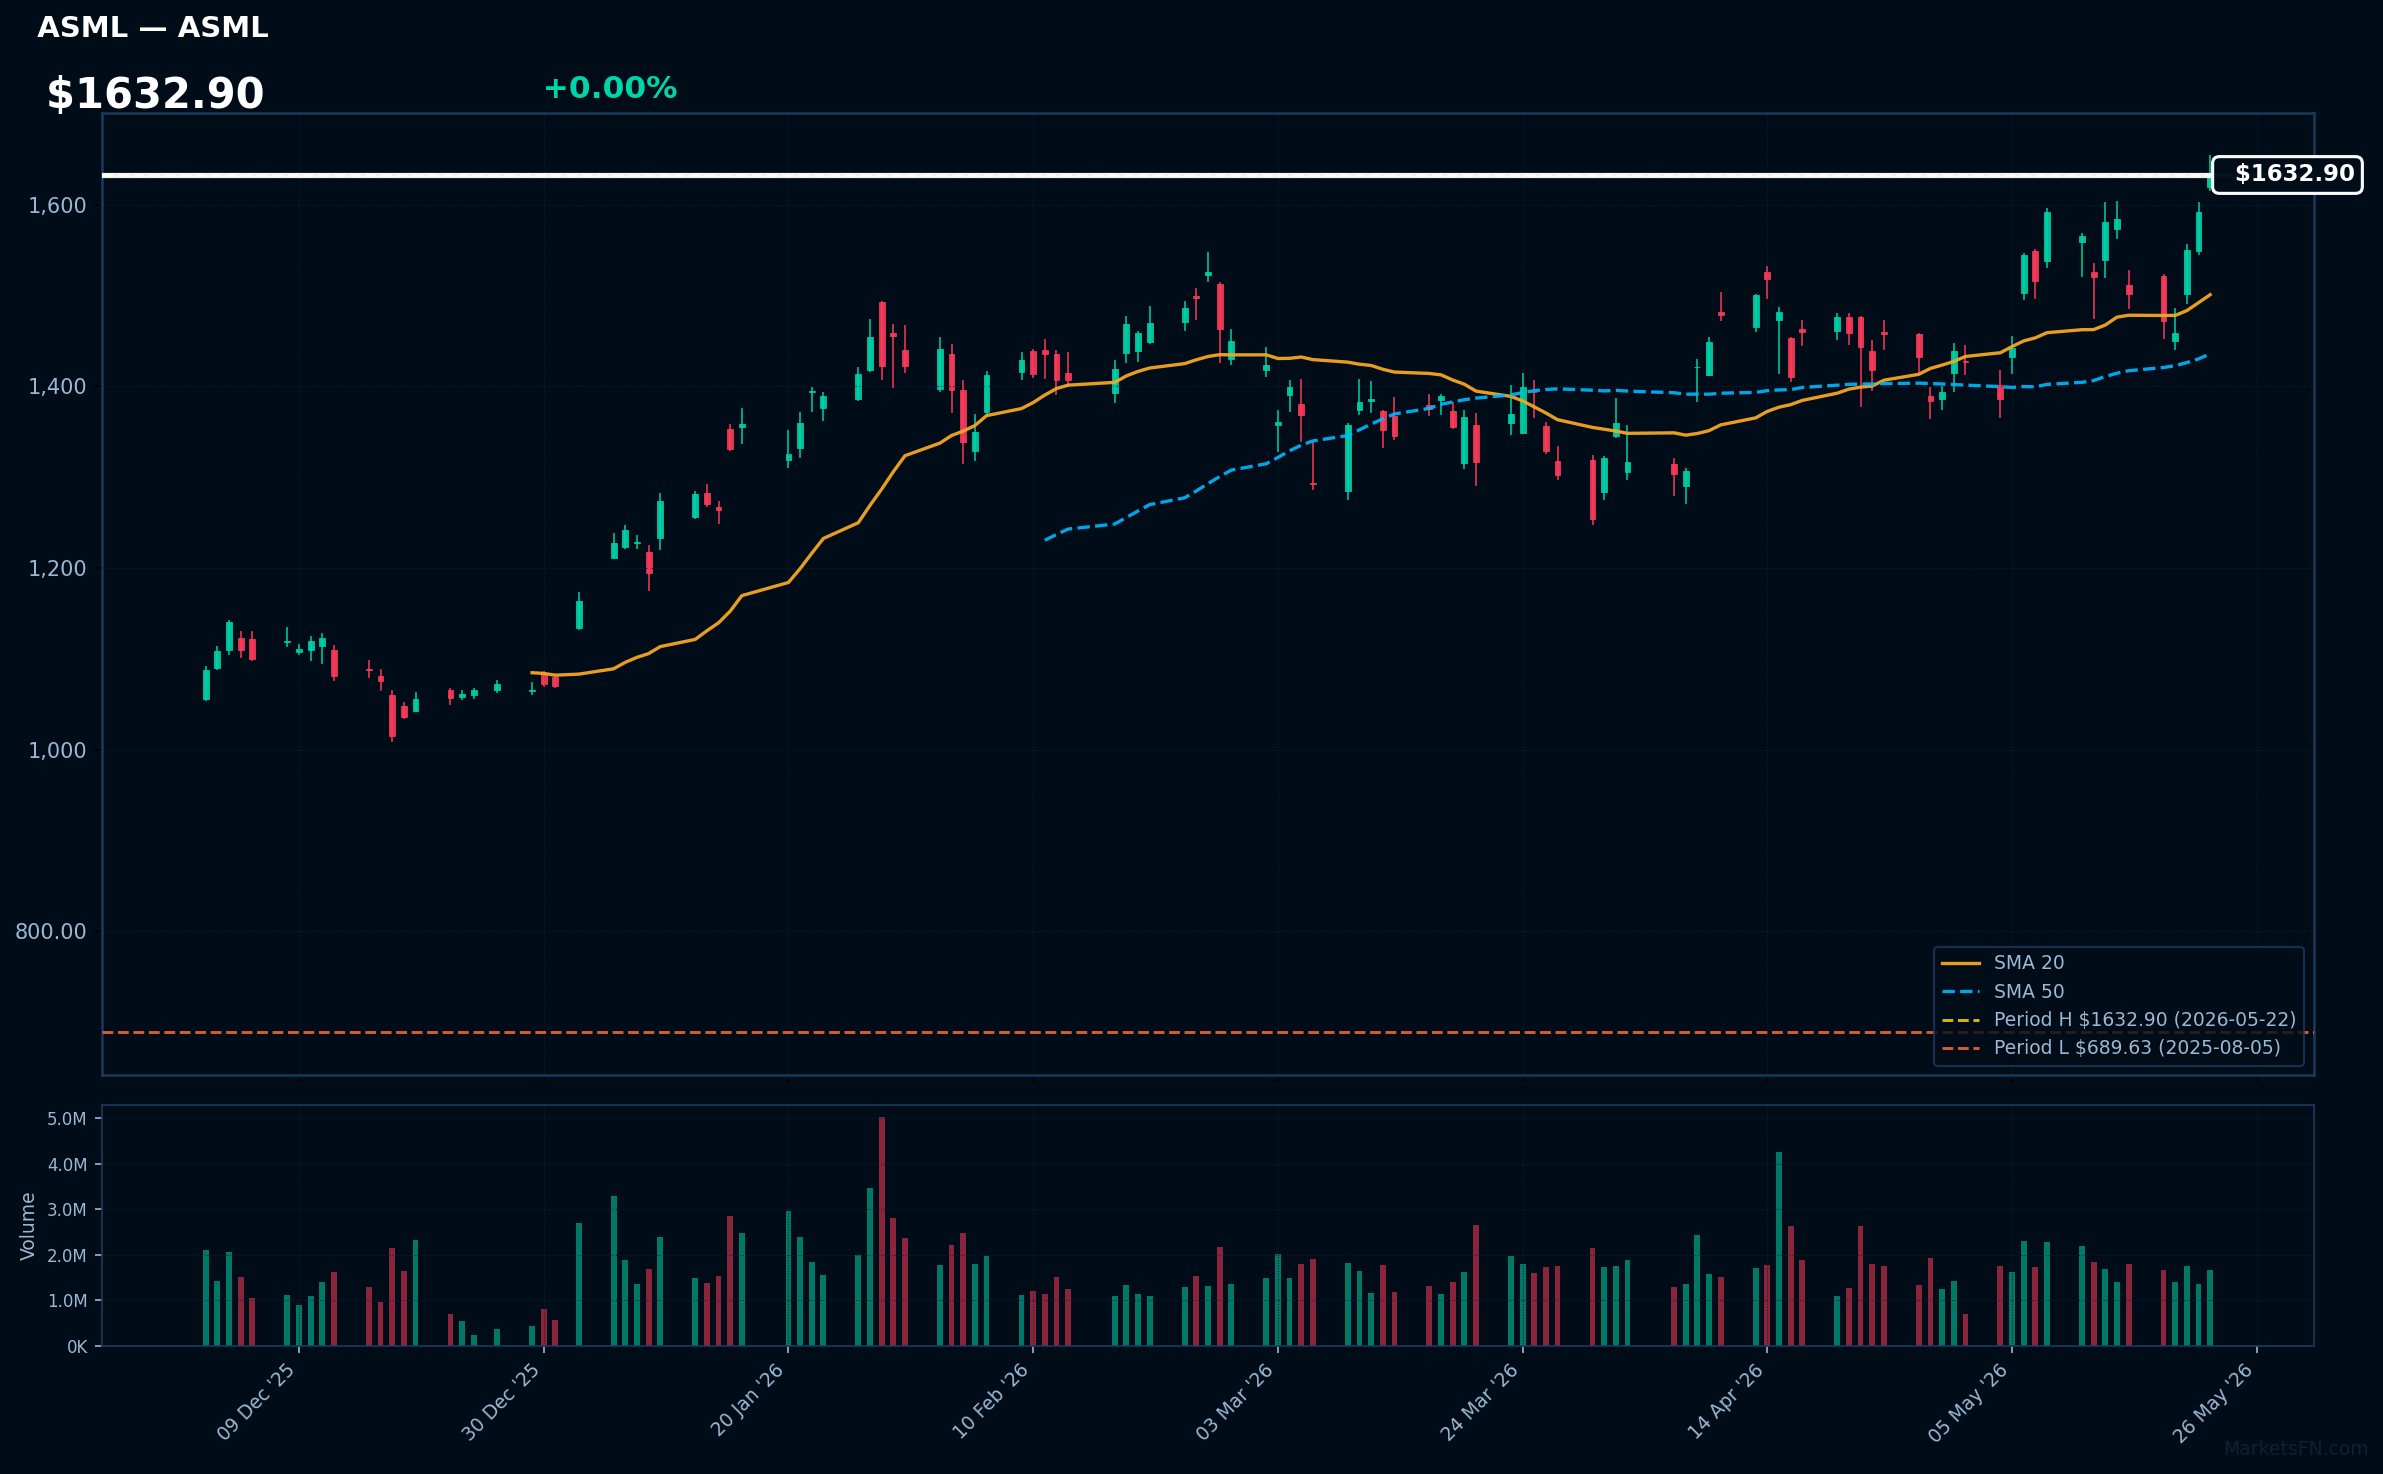
ASML | ASML Holding NV | Technology | Price Last: $1632.90 | % Realized: +122.92% | RSI: 62.1 | % above MA200: +38.7% | Trend: Above MA20, MA50, MA200
ASML Holding NV is a lithography equipment manufacturer crucial for semiconductor production. Investors care because its technology enables chipmakers to produce cutting-edge processors, driving growth in AI, 5G, and cloud computing.
ASML's technicals indicate sustained uptrend with price > MA20 > MA50 > MA200, RSI(14) at 62.1, and 0.0% below 52-Week high, suggesting momentum near a potential breakout level, with 122.9% 52-Week return.
Related headlines
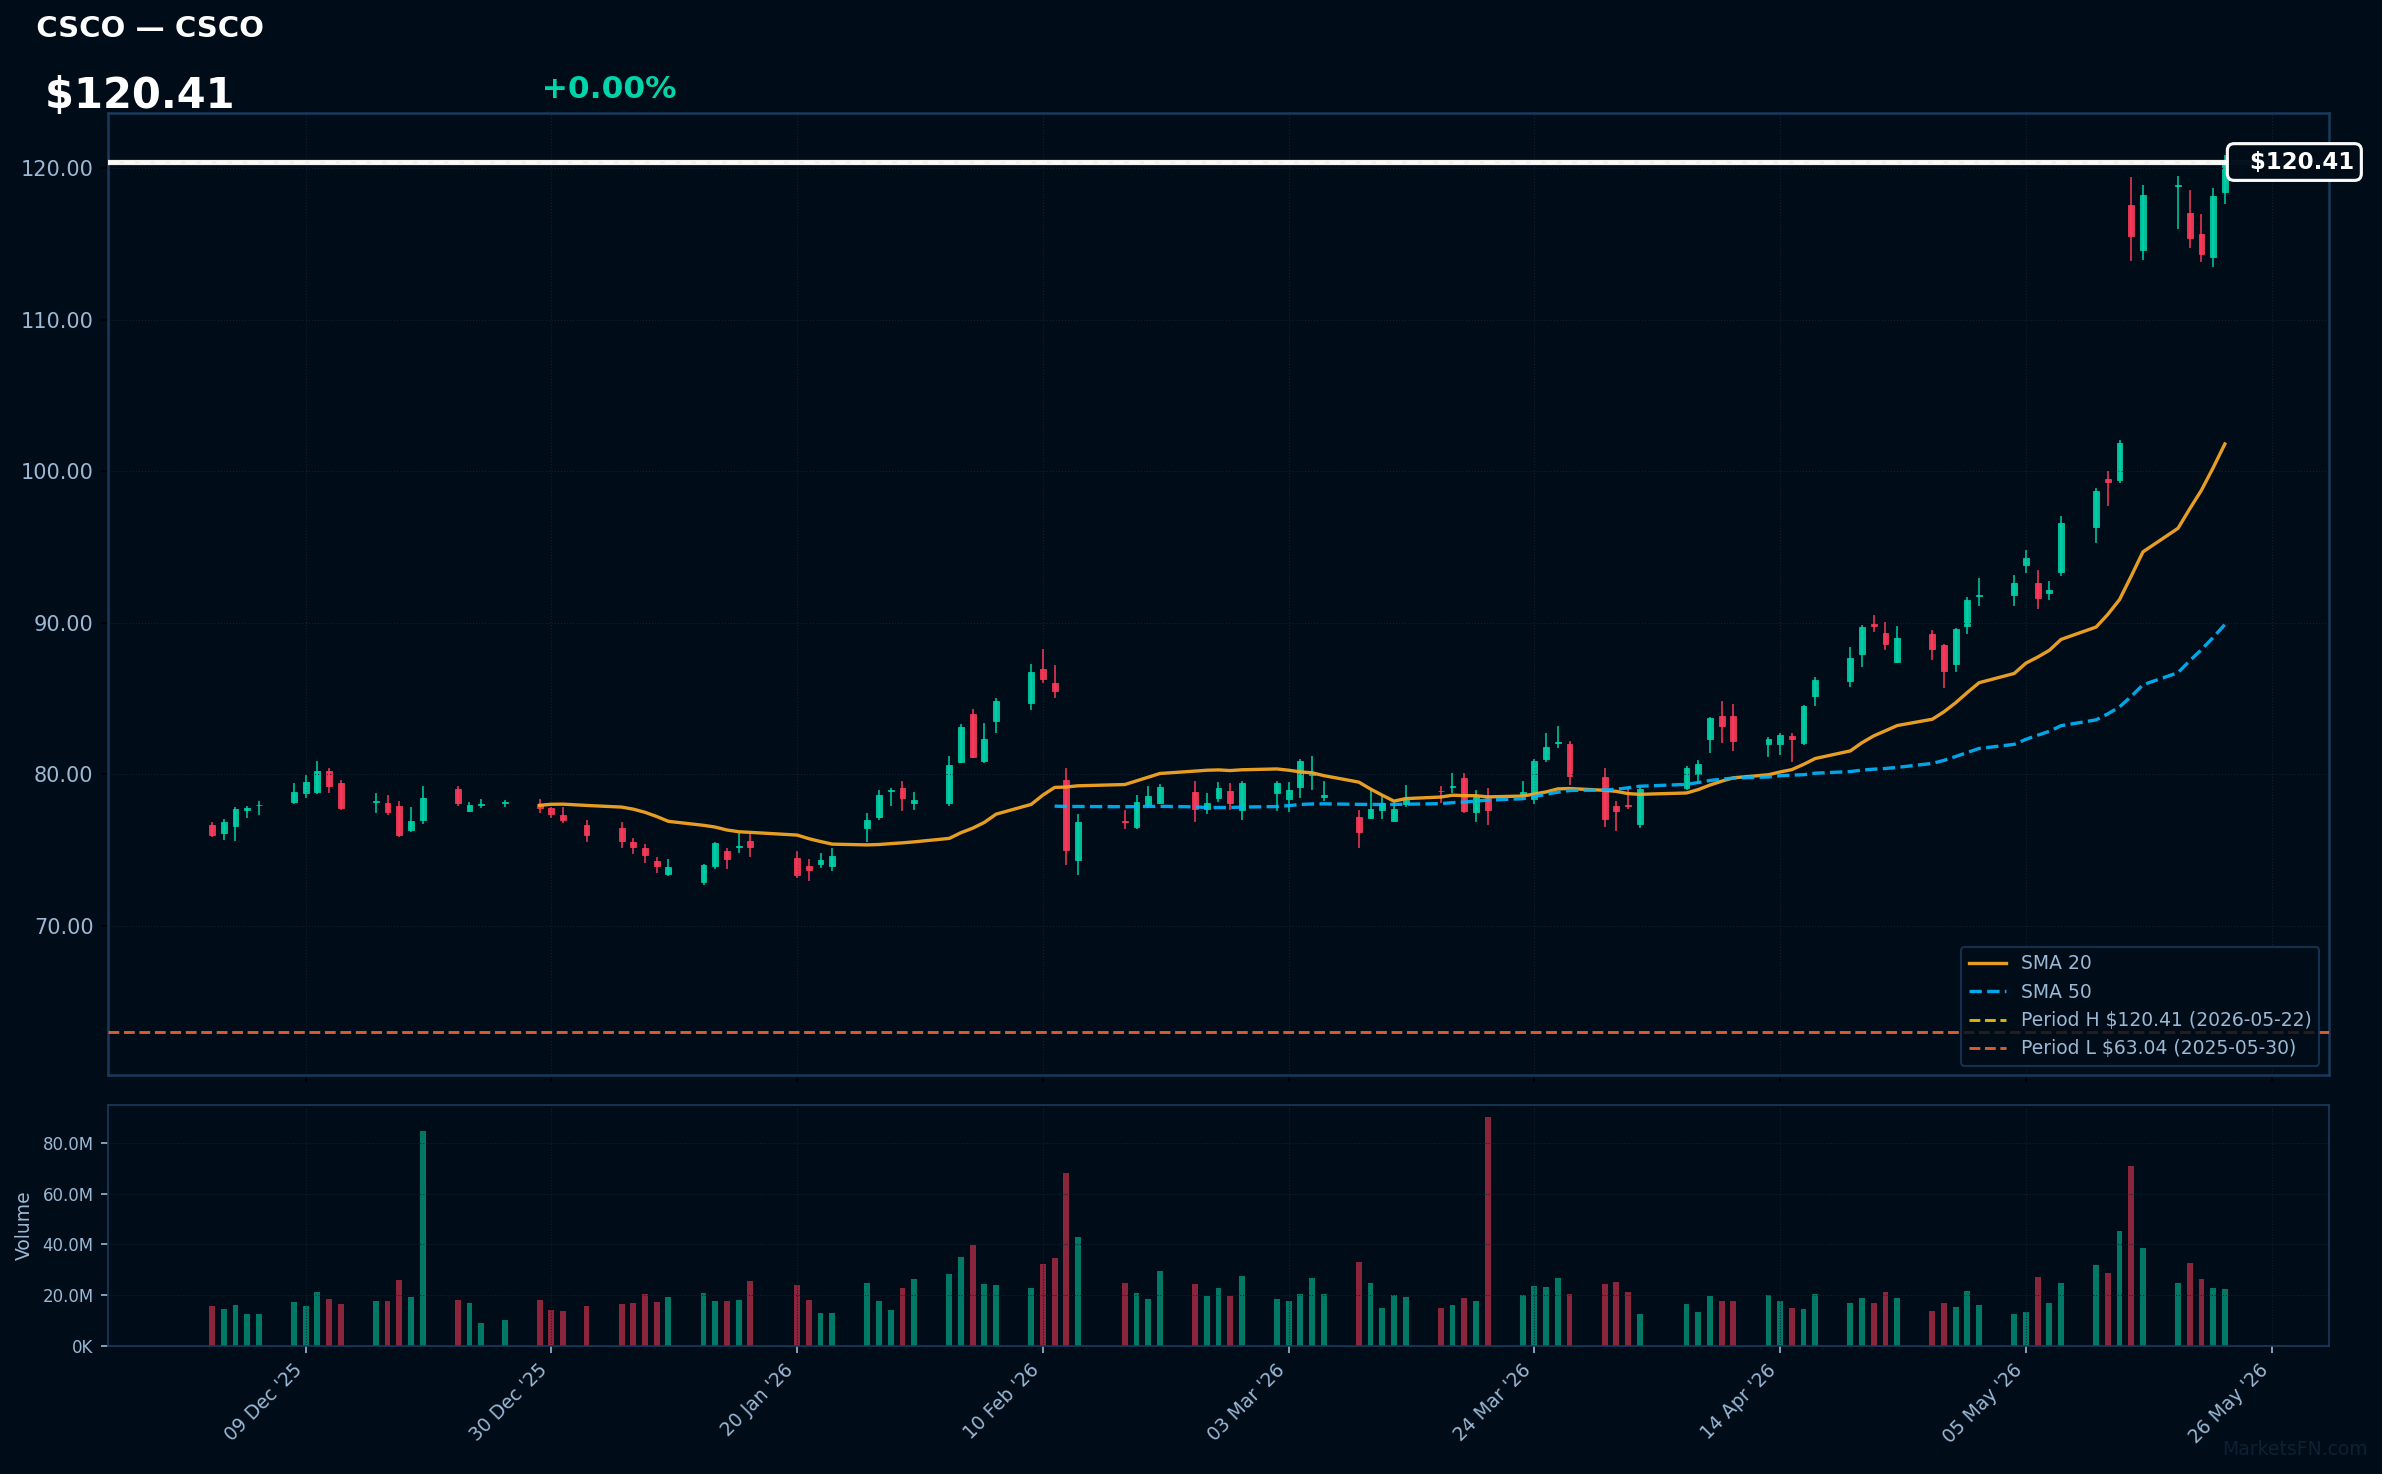
CSCO | Cisco Systems, Inc | Technology | Price Last: $120.41 | % Realized: +90.79% | RSI: 80.8 | % above MA200: +54.6% | Trend: Above MA20, MA50, MA200
Cisco Systems, Inc designs, manufactures, and sells networking hardware, software, and telecommunications equipment. Investors should care because its products are crucial for global digital infrastructure, driving demand for its solutions in areas like cybersecurity, cloud, and the Internet of Things.
Cisco's technical situation indicates strong momentum: RSI(14) is 80.8, nearing overbought territory, with a bullish MA alignment (price > MA20 > MA50 > MA200) and the stock is 0.0% below its 52-Week high, suggesting a potential breakout.
Related headlines
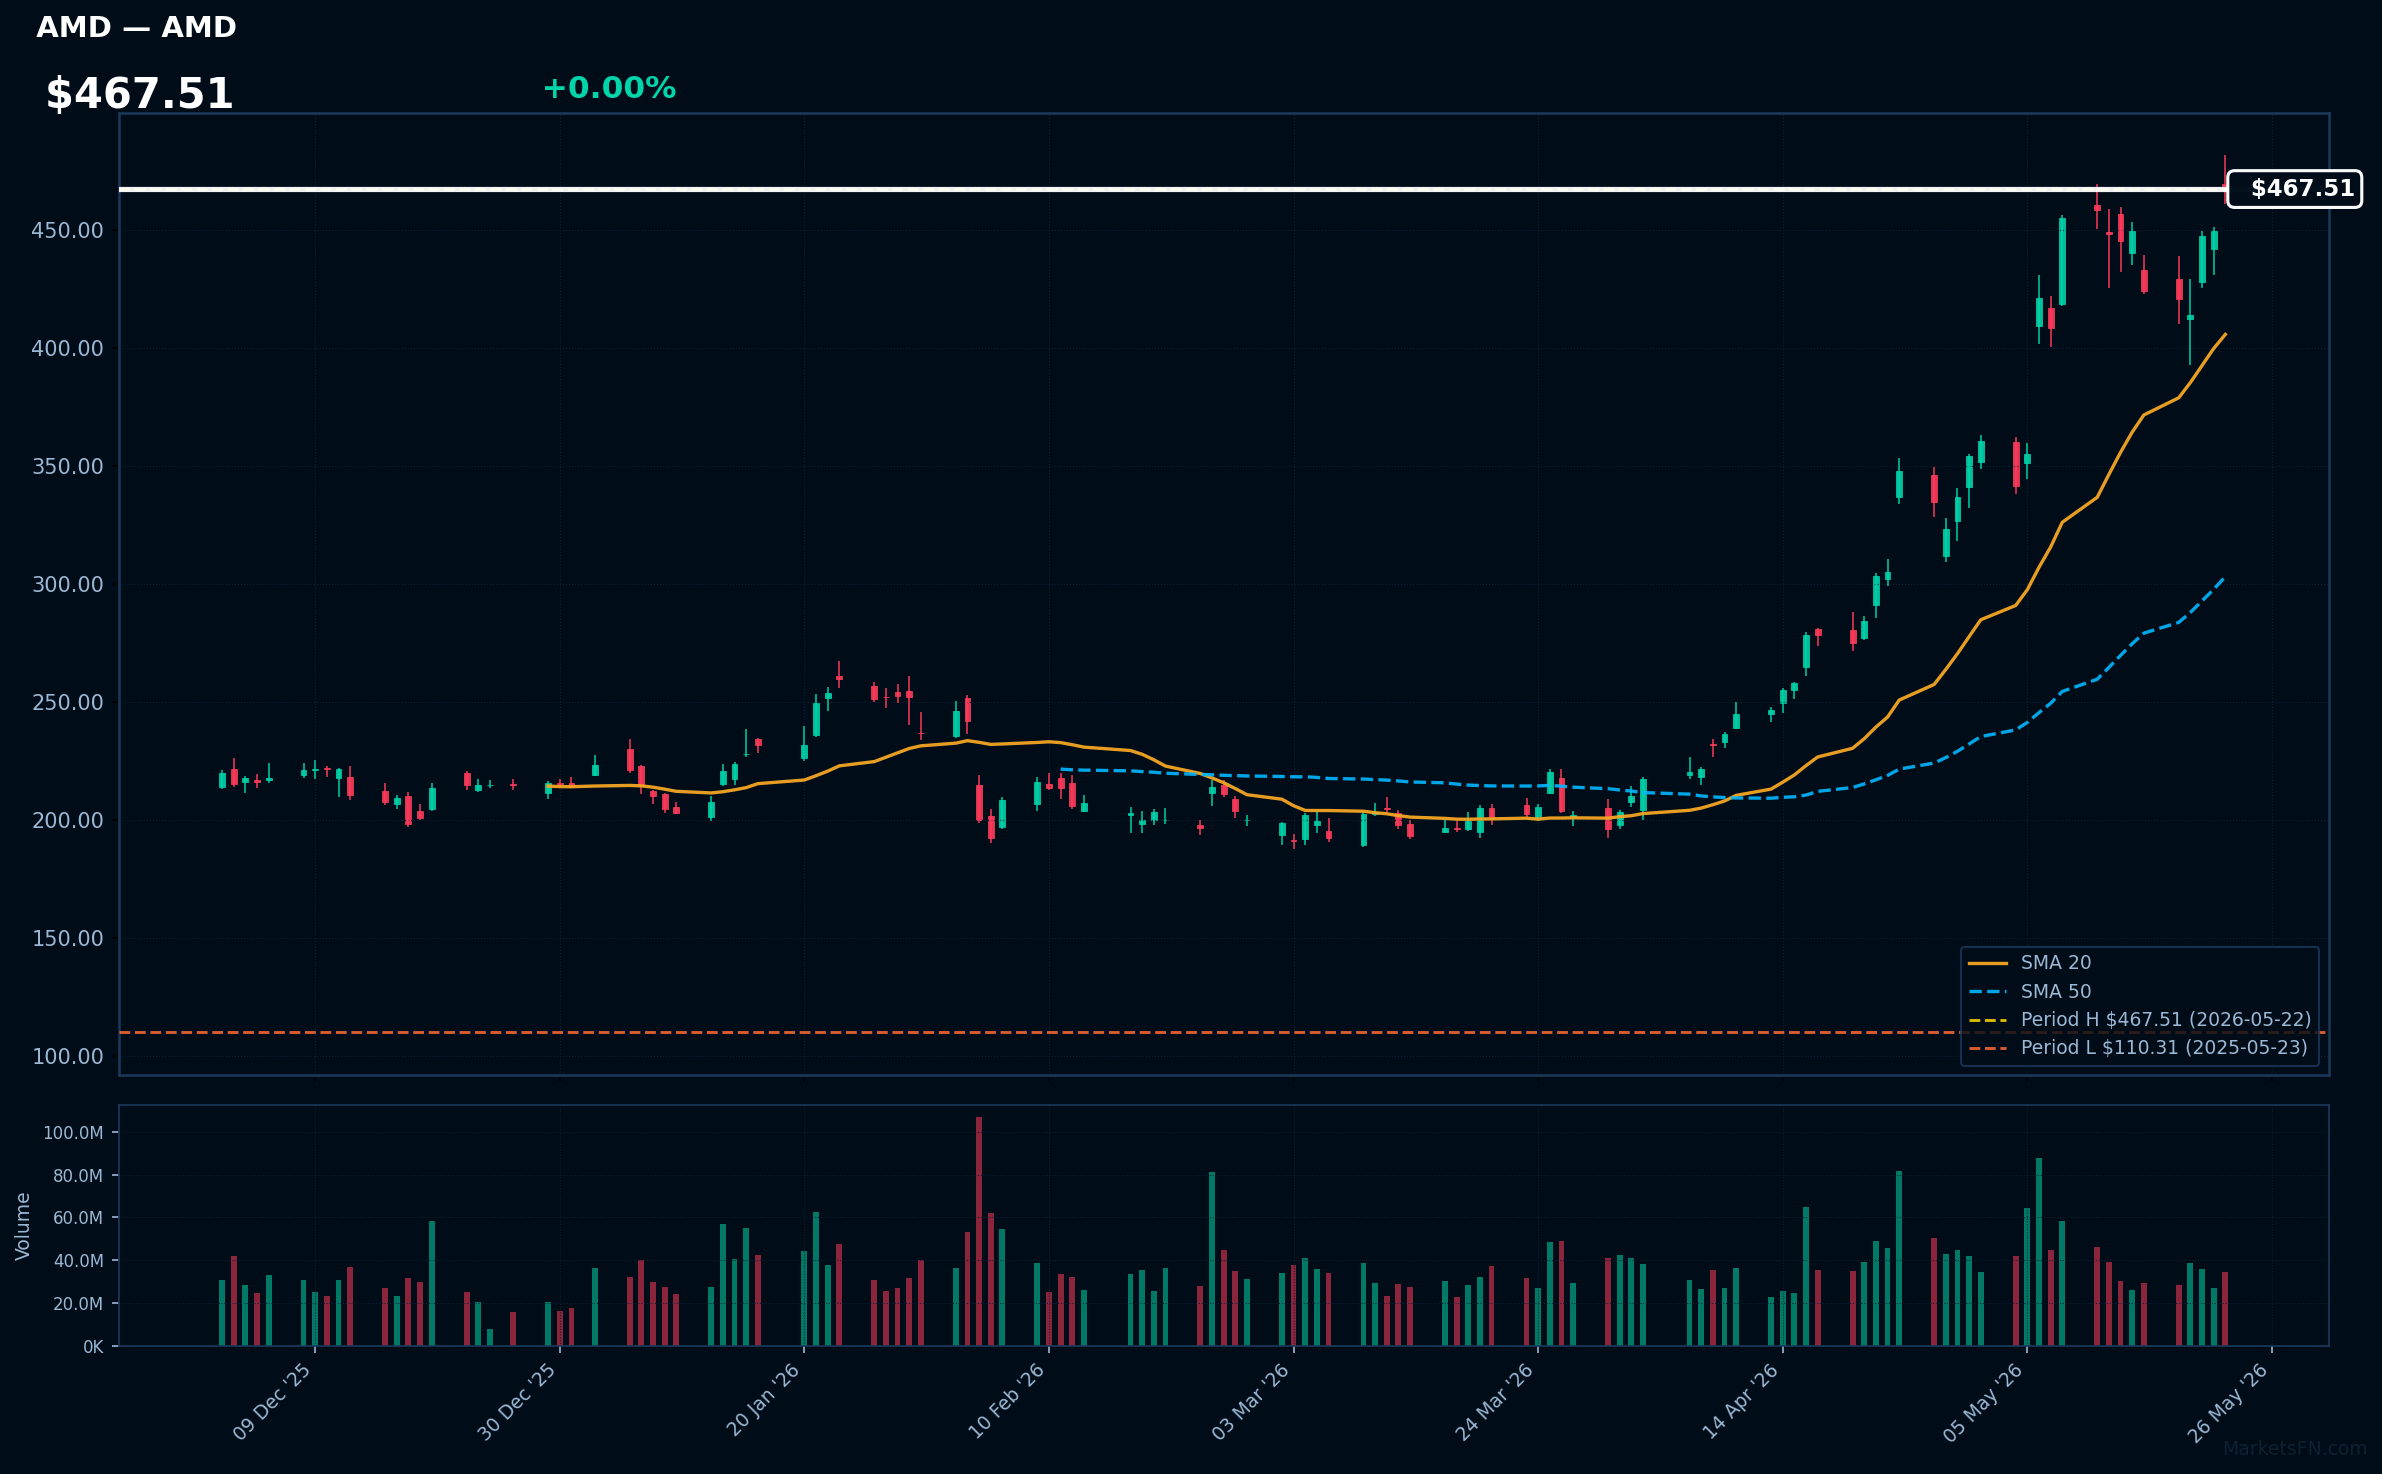
AMD | Advanced Micro Devices Inc | Technology | Price Last: $467.51 | % Realized: +323.81% | RSI: 72.6 | % above MA200: +102.5% | Trend: Above MA20, MA50, MA200
Advanced Micro Devices Inc designs and manufactures high-performance computing and graphics processing units, targeting gaming, data center, and AI markets, making it a key player in the semiconductor industry with significant growth potential.
AMD's current technical situation indicates strong momentum: RSI(14) is 72.6, nearing overbought territory, with a bullish MA alignment (price > MA20 > MA50 > MA200) and 0.0% below its 52-Week high, suggesting a potential breakout.
Related headlines
- Nvidia's reporting pivot and AMD's US$10B Taiwan bet signal a new frontier in AI chip war
- Nvidia, Intel, and AMD all in on AI: server supply chain faces shortage of orders, but does for three critical resources
- AMD: Strong AI Sales, But the Win Is Already Priced In
- Analysis: AMD bets the future of AI runs on CPUs as much as GPUs
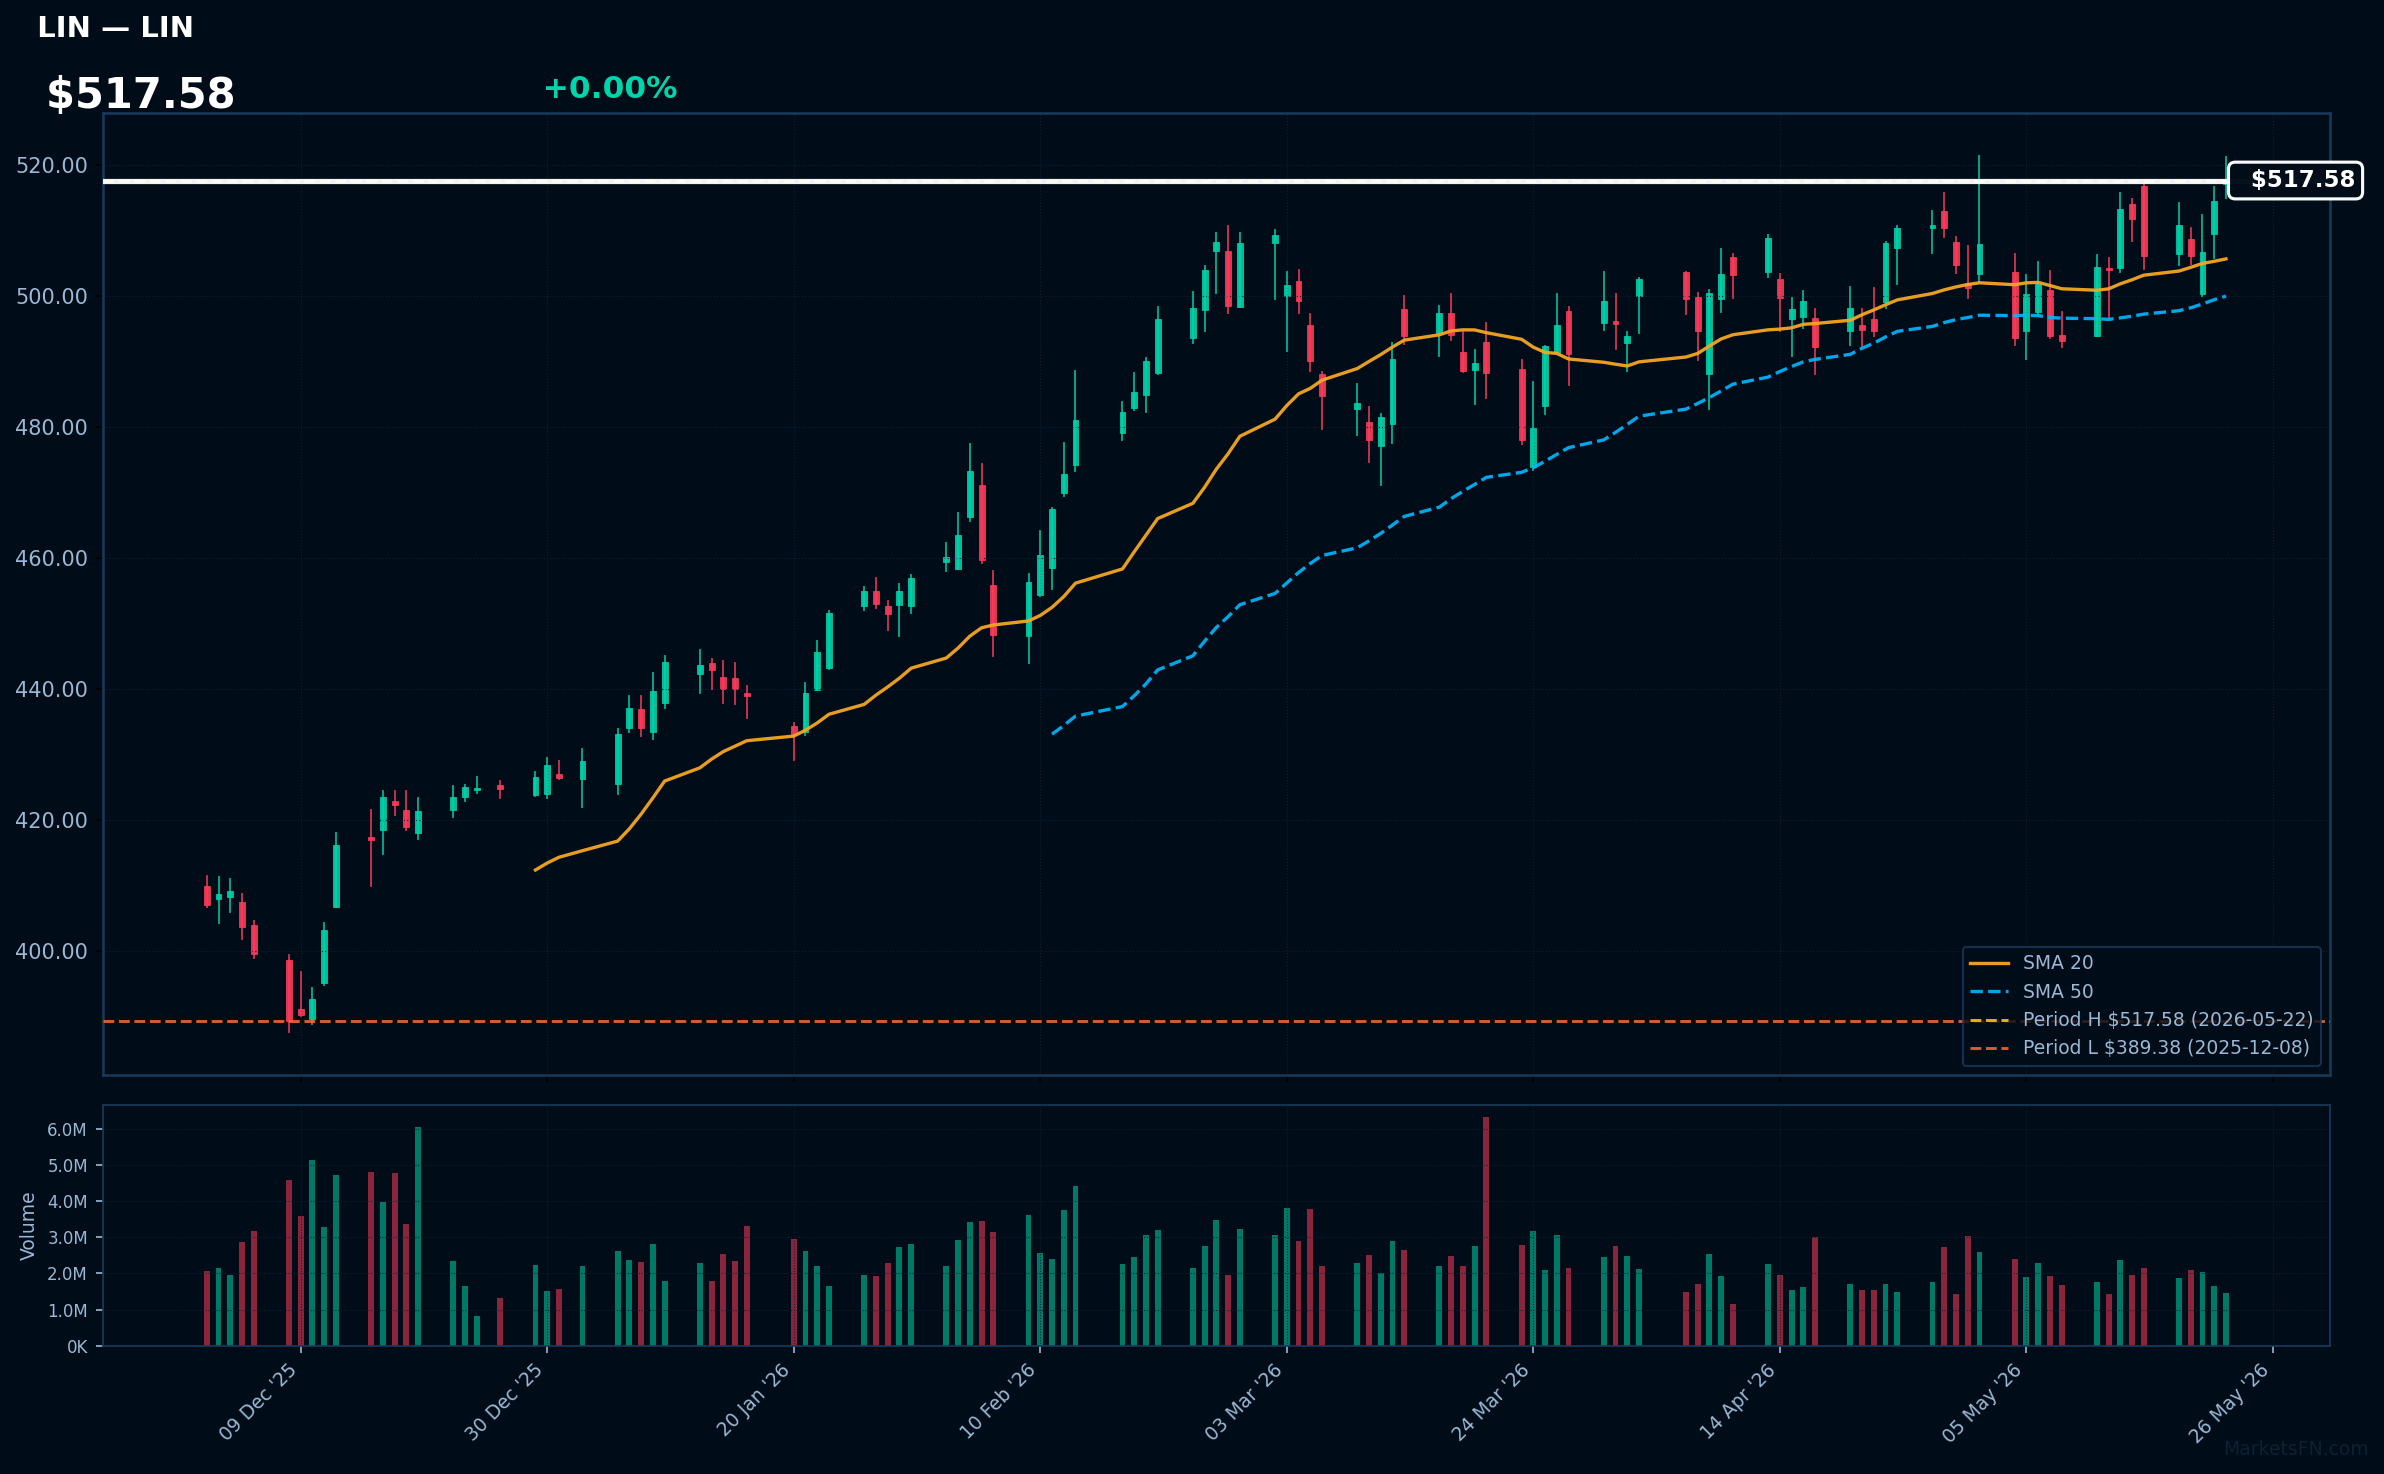
LIN | Linde Plc | Basic Materials | Price Last: $517.58 | % Realized: +12.79% | RSI: 60.3 | % above MA200: +11.4% | Trend: Above MA20, MA50, MA200
Linde Plc is a leading industrial gases and engineering company, providing essential products and services to various industries, including energy, healthcare, and manufacturing. Investors should care about its stable demand and potential for long-term growth.
Linde Plc's current technical situation indicates sustained uptrend with bullish MA alignment: price ($517.58) > MA20 > MA50 > MA200, and RSI(14) at 60.3, suggesting momentum. The stock is near its 52-Week high, 0.0% below, indicating a potential breakout level.
Related headlines
📉 Nearest to 52-Week Low
Sectors represented: Communication Services (2), Technology (2), Consumer Cyclical (1)
| Ticker | Company | Sector | Price Last | % Realized | 52-Week Low Date | RSI | % above MA200 | Trend |
|---|---|---|---|---|---|---|---|---|
| PDD | PDD Holdings Inc ADR | Consumer Cyclical | $94.52 | -20.73% | 2026-05-22 | 41.7 | -16.9% | Below MA20, MA50, MA200 |
| CMCSA | Comcast Corp | Communication Services | $25.21 | -22.08% | 2026-05-15 | 37.7 | -11.7% | Below MA20, MA50, MA200 |
| CHTR | Charter Communications Inc | Communication Services | $145.15 | -64.28% | 2026-05-15 | 33.4 | -34.9% | Below MA20, MA50, MA200 |
| ROP | Roper Technologies Inc | Technology | $326.94 | -42.34% | 2026-02-17 | 39.4 | -22.8% | Below MA20, MA50, MA200 |
| INTU | Intuit Inc | Technology | $319.94 | -55.57% | 2026-05-21 | 33.1 | -42.8% | Below MA20, MA50, MA200 |
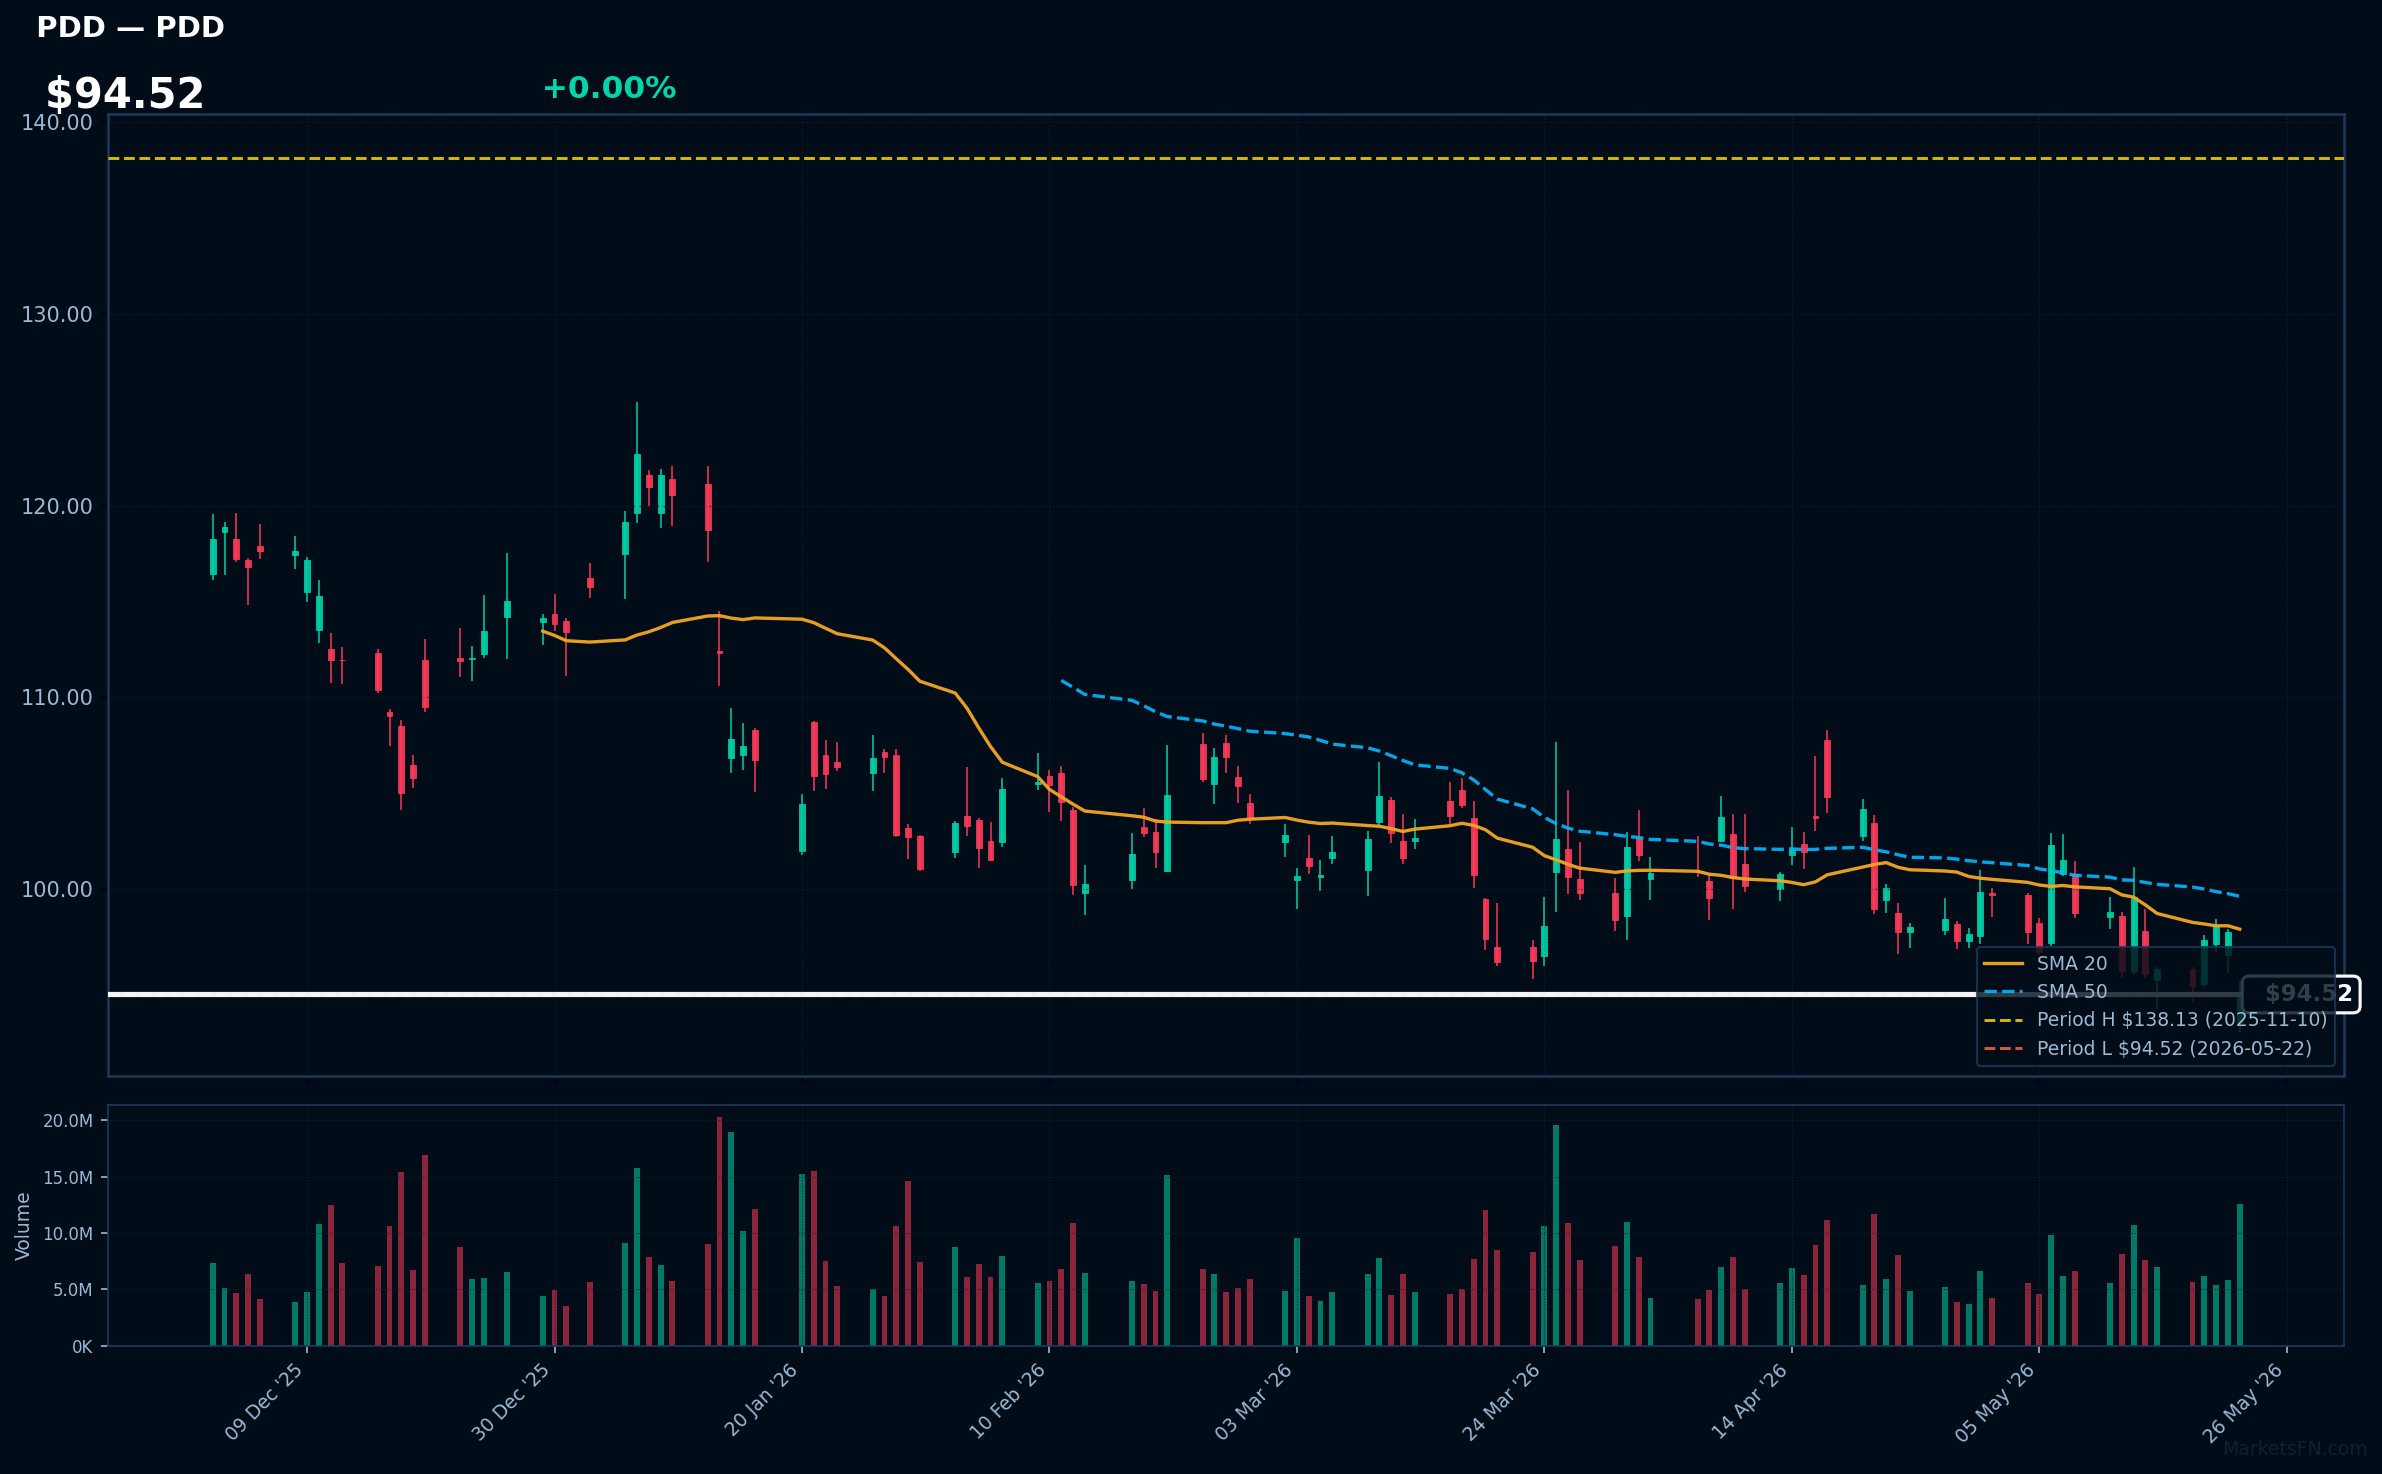
PDD | PDD Holdings Inc ADR | Consumer Cyclical | Price Last: $94.52 | % Realized: -20.73% | RSI: 41.7 | % above MA200: -16.9% | Trend: Below MA20, MA50, MA200
PDD Holdings Inc ADR operates e-commerce platforms, primarily through Temu and Pinduoduo, focusing on direct-from-factory sales and group buying. Investors care due to its rapid growth and disruption in the e-commerce space.
PDD is testing major support at its 52-Week low with an RSI(14) of 41.7, indicating bearish momentum. The sustained downtrend is evident with price < MA20 < MA50 < MA200, a warning sign for investors, with a -20.7% return over the 52-Week period.
Related headlines
- PDD Holdings to Report First Quarter 2026 Unaudited Financial Results on May 27, 2026
- China Fines Alibaba, PDD for Food Delivery Business Failures
- China Imposes $528 Million Penalty On Alibaba, JD, Meituan, PDD, Douyin
- PDD Holdings Inc (PDD) Q4 2025 Earnings Call Highlights: Robust Revenue Growth Amid Strategic ...
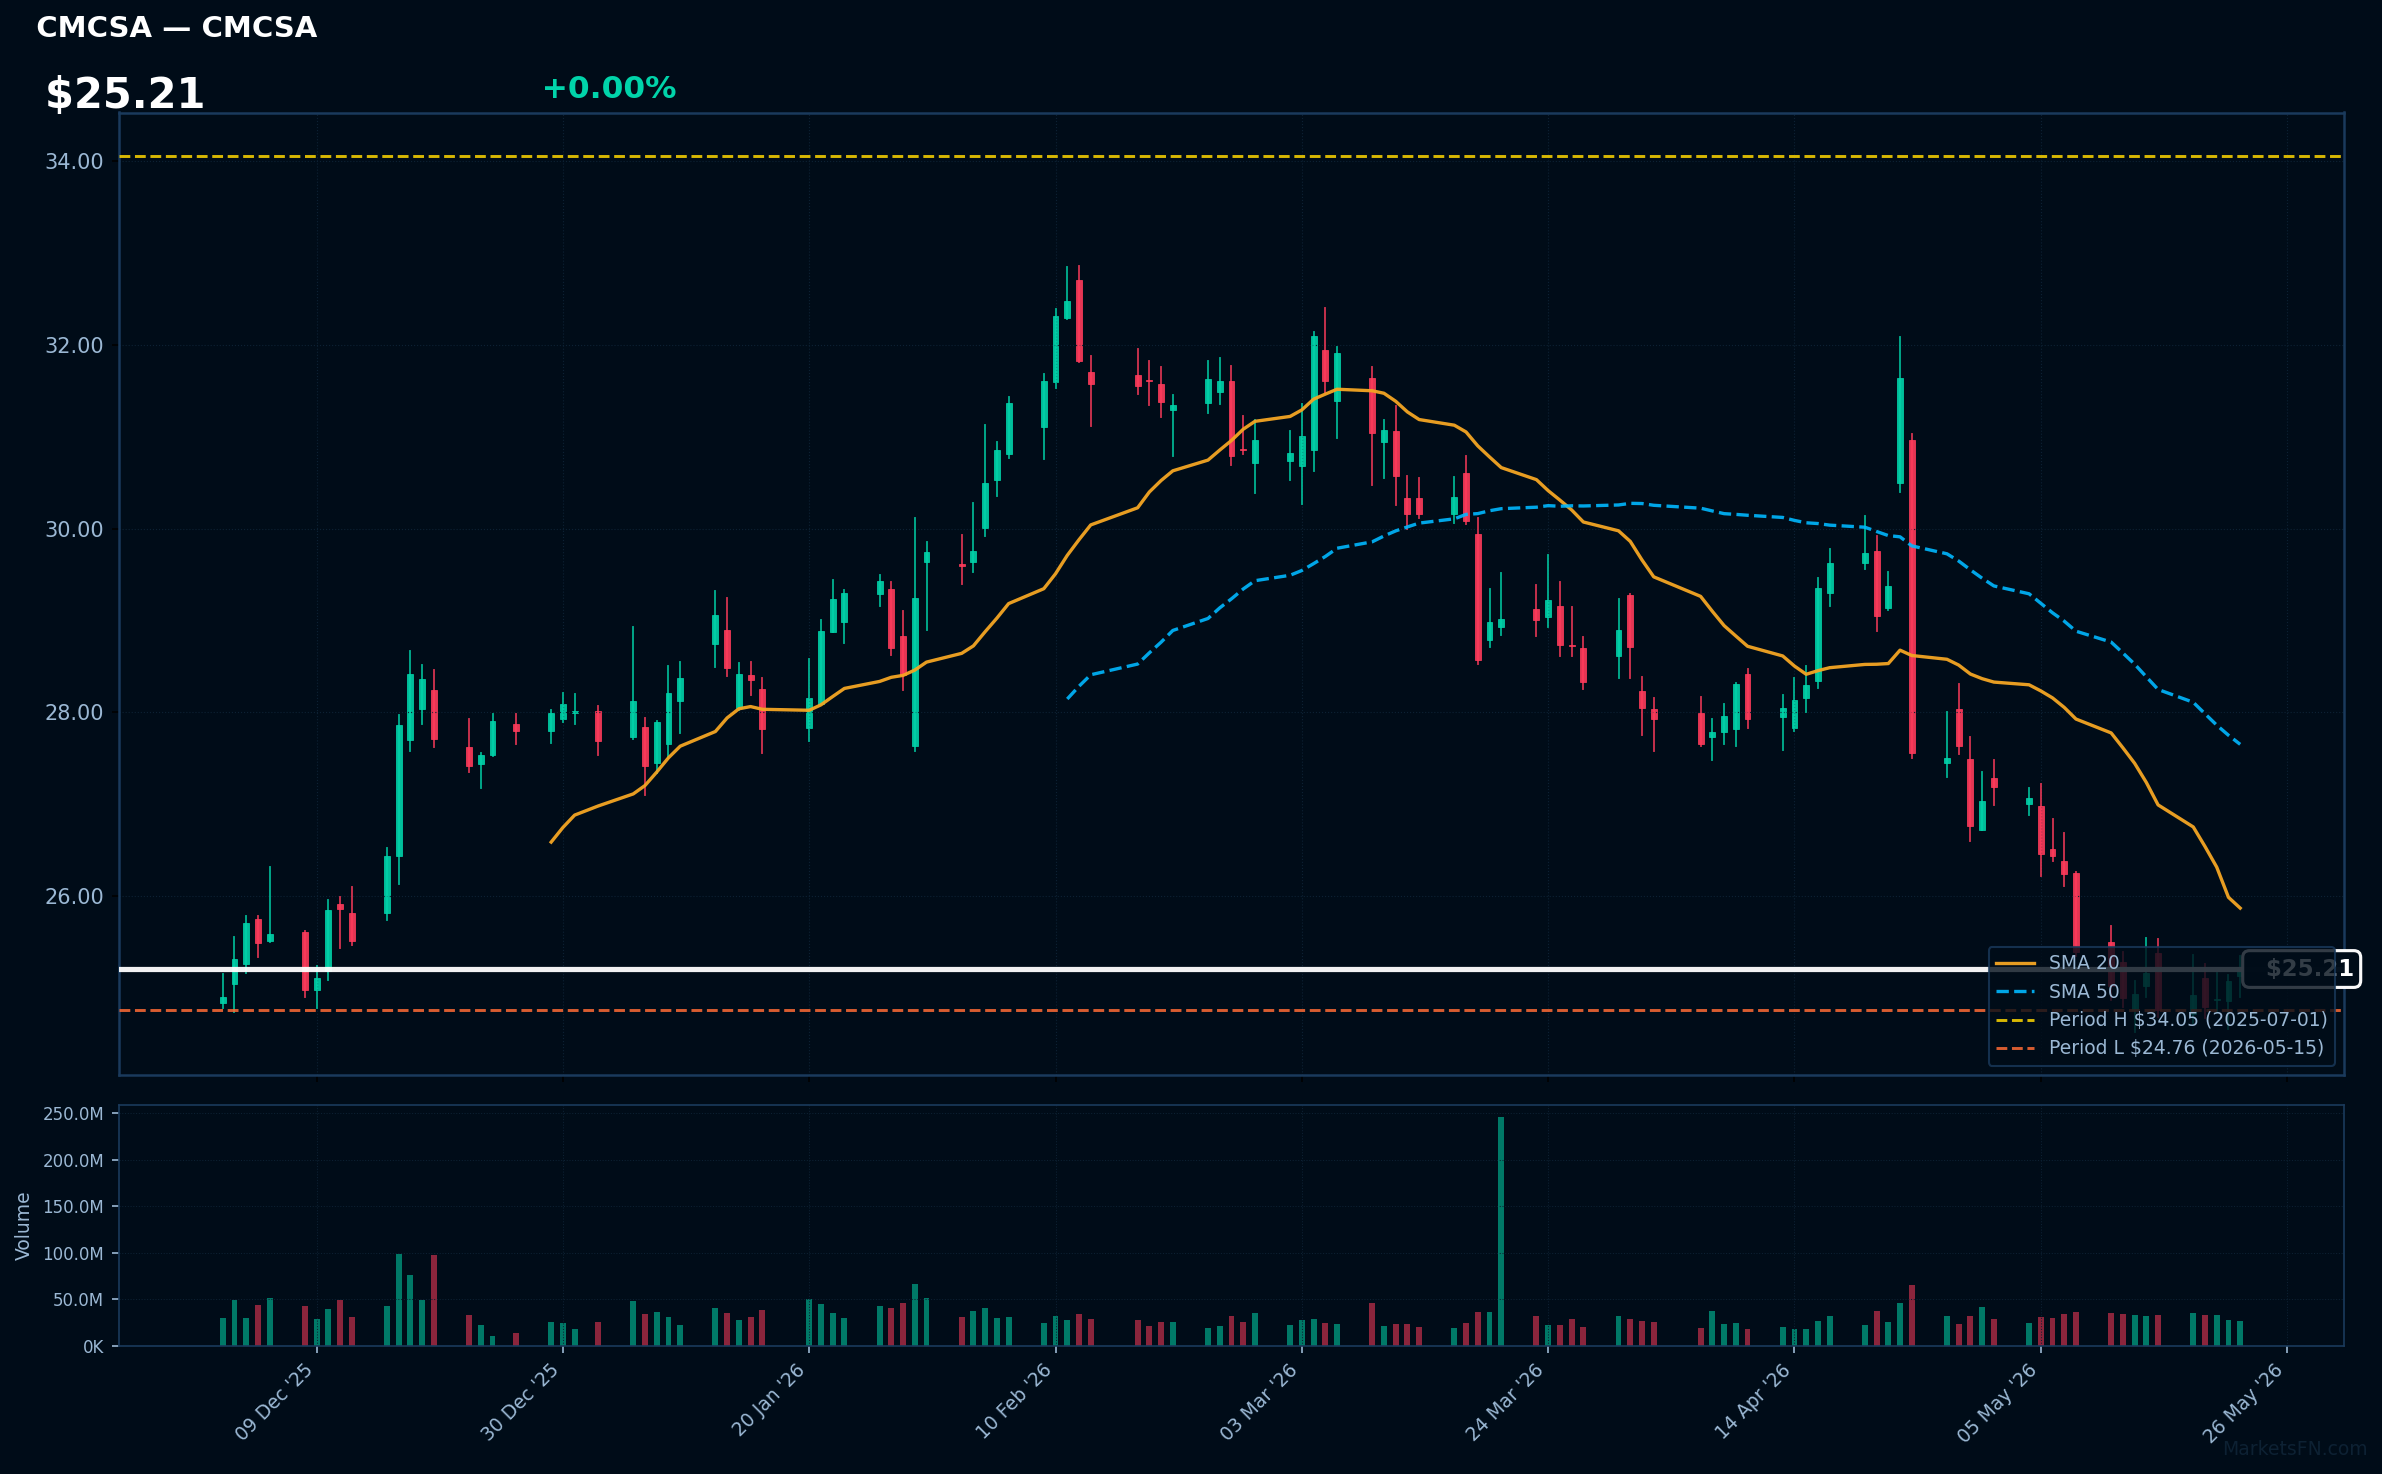
CMCSA | Comcast Corp | Communication Services | Price Last: $25.21 | % Realized: -22.08% | RSI: 37.7 | % above MA200: -11.7% | Trend: Below MA20, MA50, MA200
Comcast Corp is a media and telecommunications conglomerate providing cable television, internet, and phone services, as well as owning NBCUniversal, a major media company with film, television, and theme park assets, making it a significant player in both consumer connectivity and content creation.
Comcast Corp's technical situation is bearish, with an RSI(14) of 37.7 indicating oversold conditions, price below all key MAs (MA20, MA50, MA200), and a 1.8% proximity to its 52-Week low, warning of potential further downside; the sustained downtrend and -22.1% 52-Week return reinforce this negative momentum.
Related headlines
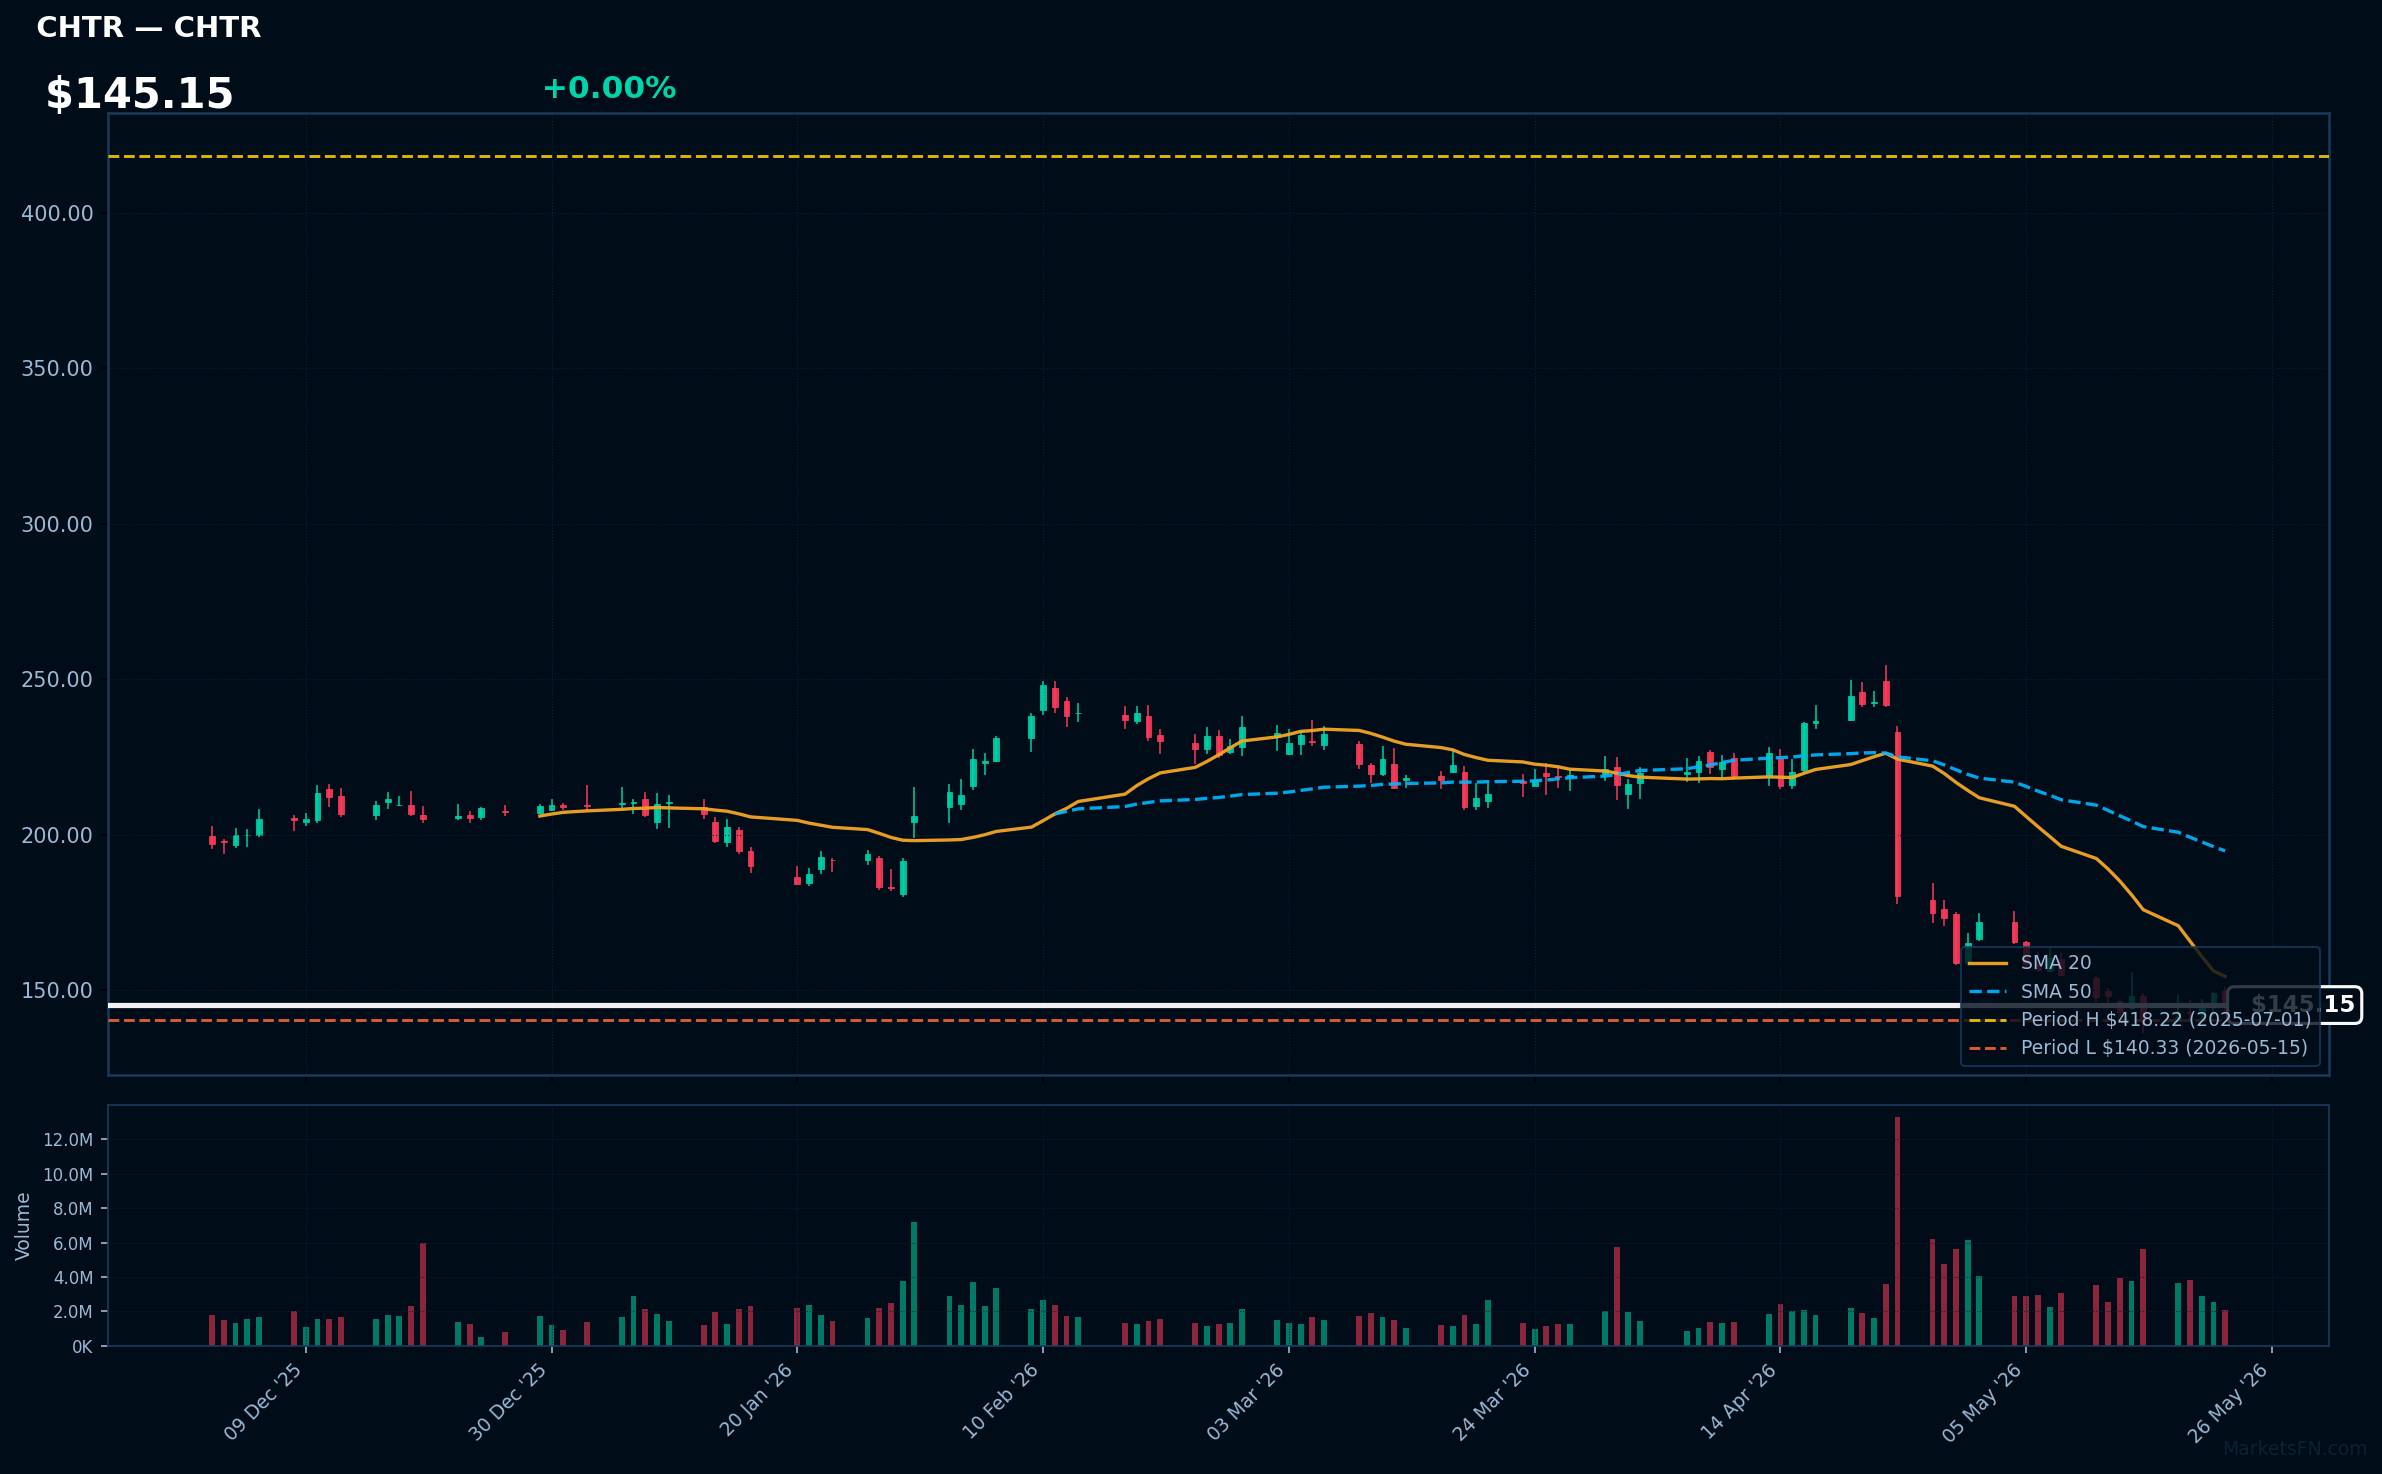
CHTR | Charter Communications Inc | Communication Services | Price Last: $145.15 | % Realized: -64.28% | RSI: 33.4 | % above MA200: -34.9% | Trend: Below MA20, MA50, MA200
Charter Communications Inc is a broadband connectivity company providing cable television, internet, and phone services to residential and commercial customers. Investors should care about its ability to maintain subscriber growth and navigate the competitive landscape.
Charter Communications Inc is in a sustained downtrend with price ($145.15) below MA20, MA50, and MA200. The RSI(14) is 33.4, near oversold territory, and the stock is 3.4% above its 52-Week low, testing major support after a -64.3% 52-Week return.
Related headlines
- Charter Communications Inc. Cl A stock underperforms Friday when compared to competitors
- Charter to Participate in J.P. Morgan Global Technology, Media and Communications Conference
- Charter to Participate in MoffettNathanson Media, Internet & Communications Conference
- Stop Valuing CHTR Stock Like It Is Going Out Of Business
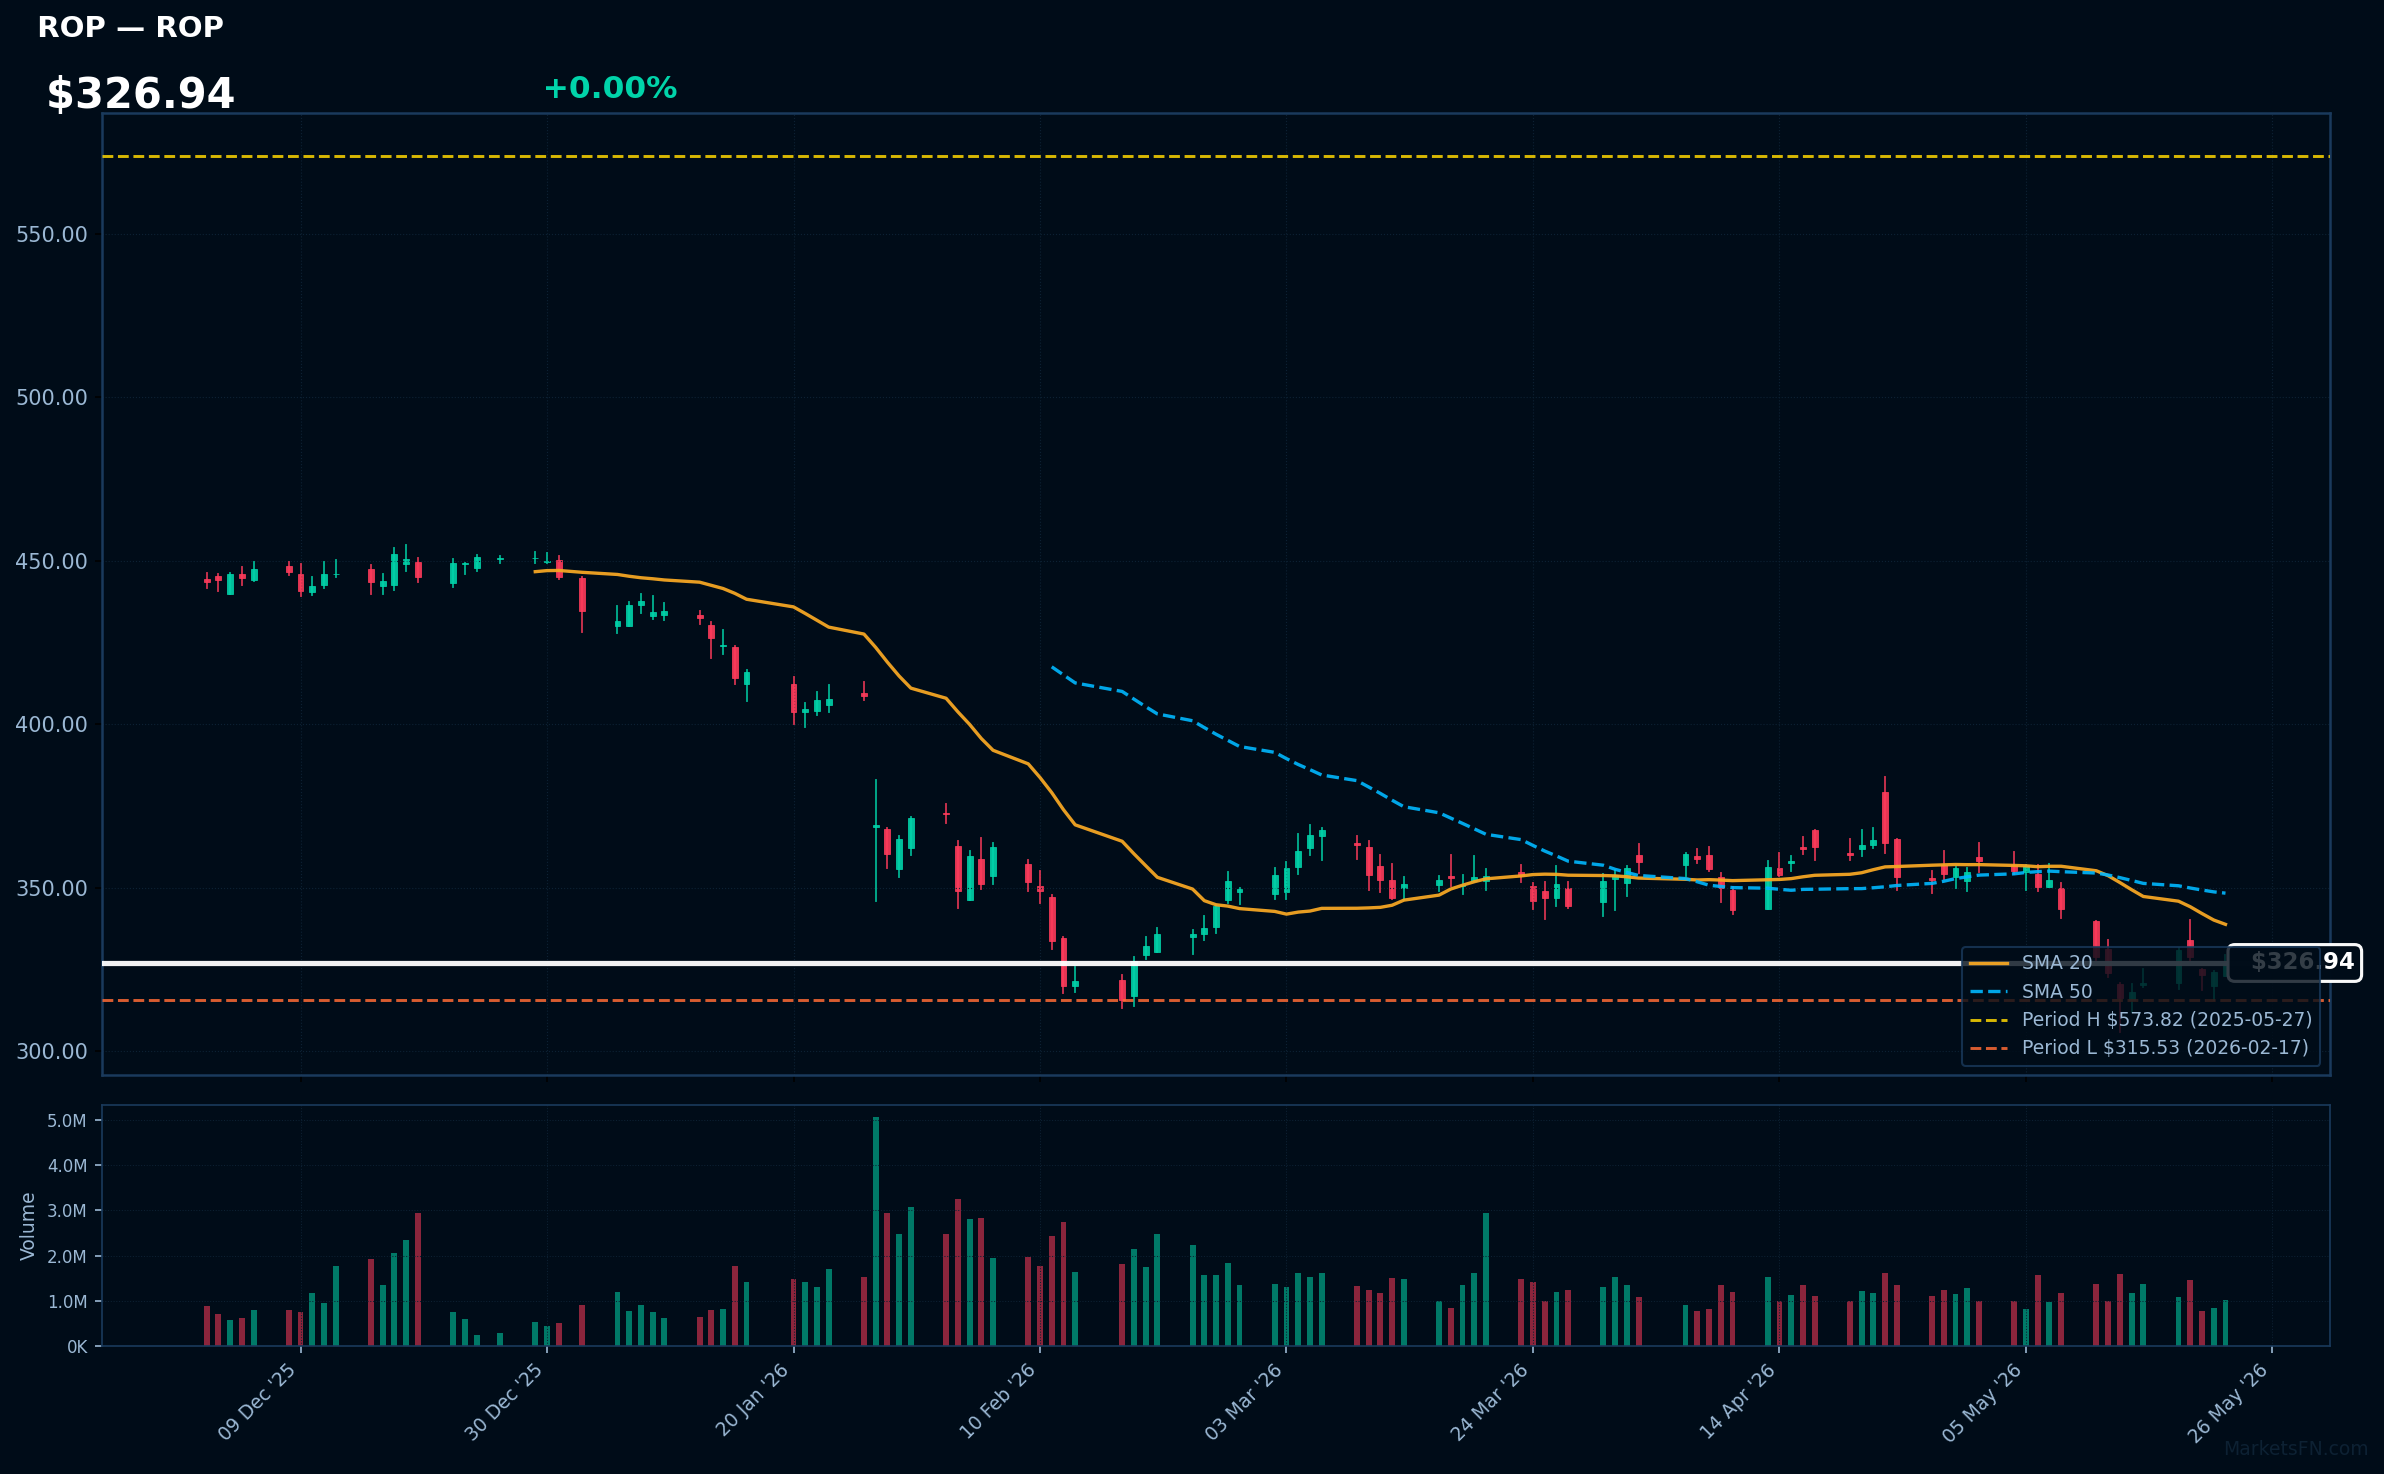
ROP | Roper Technologies Inc | Technology | Price Last: $326.94 | % Realized: -42.34% | RSI: 39.4 | % above MA200: -22.8% | Trend: Below MA20, MA50, MA200
Roper Technologies Inc is a diversified technology company providing software, engineered products, and services to various markets. Investors should care due to its exposure to growing segments like healthcare technology and industrial controls, potentially driving long-term growth.
Roper Technologies Inc is in a sustained downtrend with price ($326.94) below MA20, MA50, and MA200. The RSI(14) is 39.4, nearing oversold territory, and the stock is 3.6% above its 52-Week low, testing major support after a -42.3% 52-Week return.
Related headlines
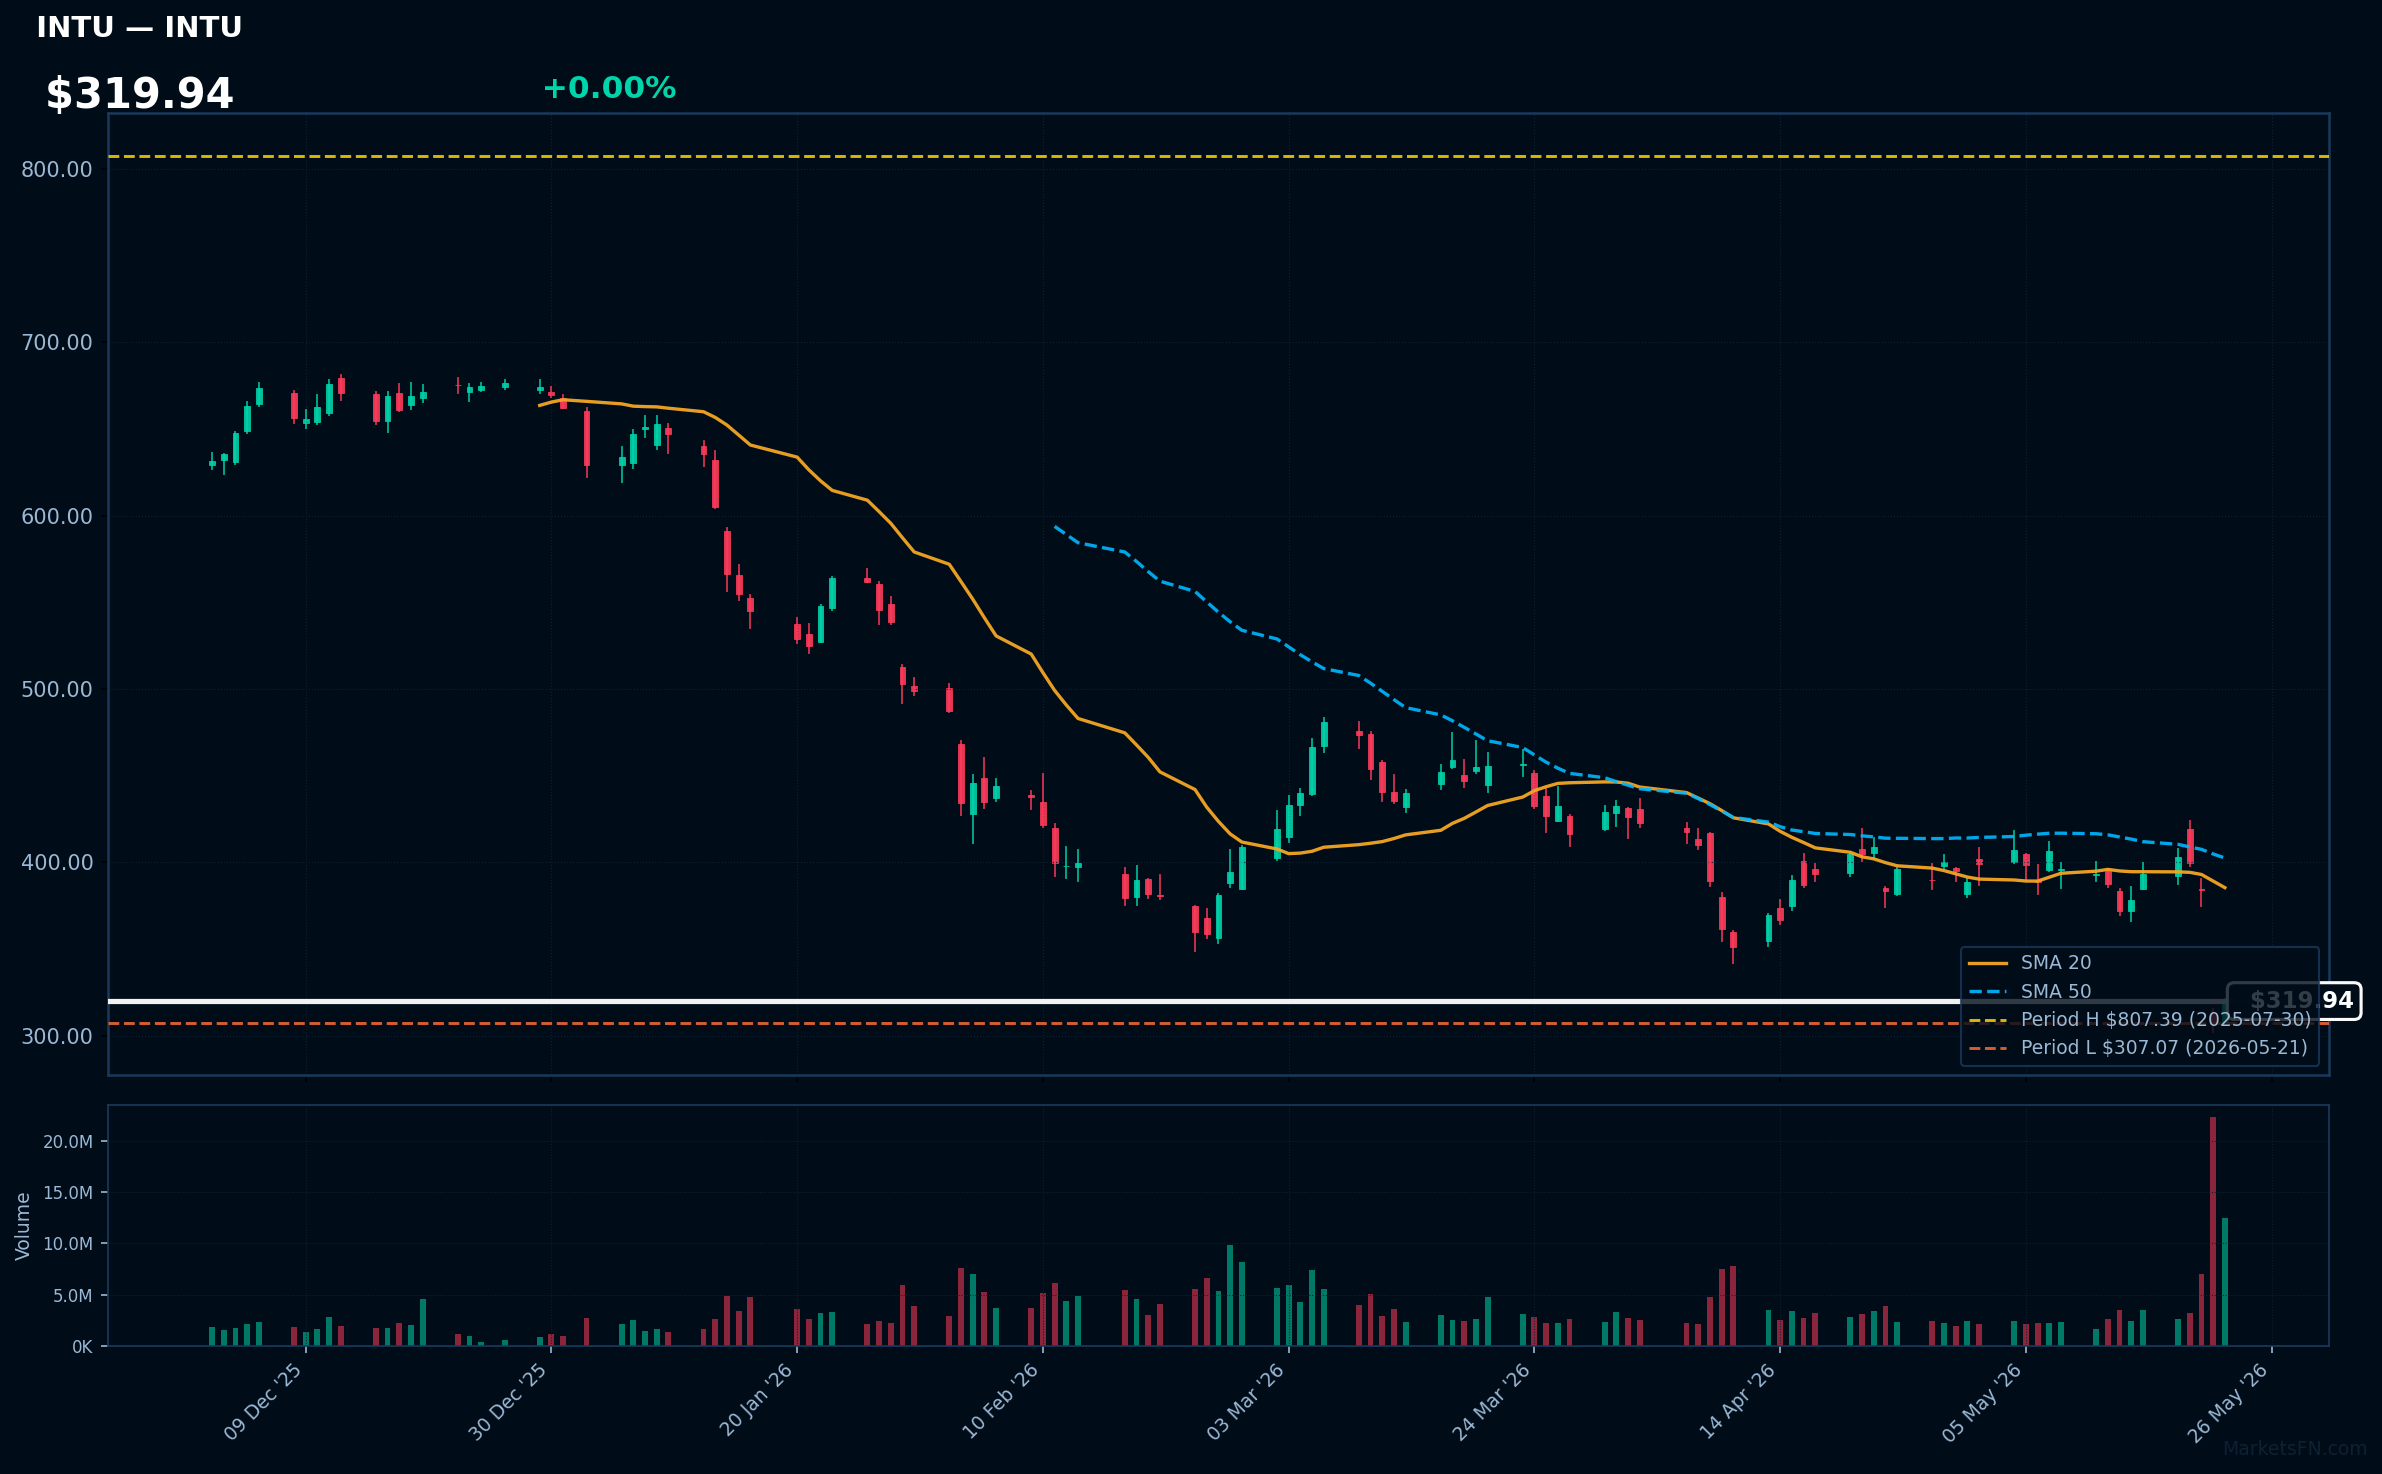
INTU | Intuit Inc | Technology | Price Last: $319.94 | % Realized: -55.57% | RSI: 33.1 | % above MA200: -42.8% | Trend: Below MA20, MA50, MA200
Intuit Inc (INTU) provides financial management solutions, including QuickBooks for small businesses and TurboTax for individual tax preparation, making it a key player in the financial software space with significant exposure to the tax and accounting industries.
INTU's technicals indicate a sustained downtrend with price ($319.94) below MA20, MA50, and MA200. The RSI(14) at 33.1 suggests oversold conditions, and the stock is 4.2% above its 52-Week low, testing major support after a -55.6% 52-Week return.
Related headlines
Market Commentary
The Nasdaq 100 stocks listed are currently trading near 52-week extremes, with some at all-time highs and others near their lowest levels over the past year. Stocks like AAPL, ASML, and AMD are at their 52-week highs, indicating strong performance, while PDD, CMCSA, and CHTR are near their 52-week lows, suggesting potential weakness.
The technology sector is driving these price levels, with companies like AAPL and ASML benefiting from strong demand for their products. Macro themes such as the ongoing AI boom and semiconductor demand are likely contributing to the highs. Conversely, companies like PDD and CMCSA may be impacted by concerns around consumer spending and competition.
Key levels to watch include the current 52-week extremes, as a breakout or breakdown could signal further momentum. For stocks at 52-week highs, a failure to sustain these levels could indicate a reversal, while stocks near 52-week lows may see a bounce if they can hold above these levels. Catalysts such as earnings reports and industry trends will be important to monitor for potential breakouts or breakdowns.
Methodology: All 101 Nasdaq 100 constituents screened. 52-week high = highest daily close over the past 252 trading days (approx. 1 year). 52-week low = lowest daily close over the same period. Distance = (current price / extreme − 1) × 100. Technical indicators computed on up to 1 year of daily OHLCV data.
Disclaimer: For informational purposes only. Not investment advice. Past performance is not indicative of future results.

