Nasdaq 100 52-Week Highs & Lows Radar: Airbnb (ABNB), Applovin (APP) and more
MarketsFN Team

Nasdaq 100 52-Week Highs & Lows Radar: Airbnb (ABNB), Applovin (APP) and more
Screening all 101 Nasdaq 100 constituents for stocks nearest to their 52-week high and their 52-week low. Data as of August 24, 2026. % Realized = 52-week total return.
Legend: RSI > 70 = overbought · RSI < 30 = oversold · Green % Realized = positive 52W return · Red = negative.
📈 Nearest to 52-Week High
Sectors represented: Healthcare (2), Consumer Cyclical (1), Consumer Defensive (1), Communication Services (1)
| Ticker | Company | Sector | Price Last | % Realized | 52-Week High Date | RSI | % above MA200 | Trend |
|---|---|---|---|---|---|---|---|---|
| ABNB | Airbnb Inc | Consumer Cyclical | $191.25 | +49.24% | 2026-08-24 | 74.0 | +40.1% | Above MA20, MA50, MA200 |
| MDLZ | Mondelez International Inc | Consumer Defensive | $65.30 | +5.39% | 2026-08-24 | 63.8 | +11.0% | Above MA20, MA50, MA200 |
| EA | Electronic Arts, Inc | Communication Services | $209.70 | +0.38% | 2026-08-04 | — | — | — |
| DXCM | Dexcom Inc | Healthcare | $92.25 | +21.44% | 2026-08-21 | 69.7 | +32.8% | Above MA20, MA50, MA200 |
| AMGN | AMGEN Inc | Healthcare | $440.56 | +52.72% | 2026-08-19 | 73.9 | +24.6% | Above MA20, MA50, MA200 |
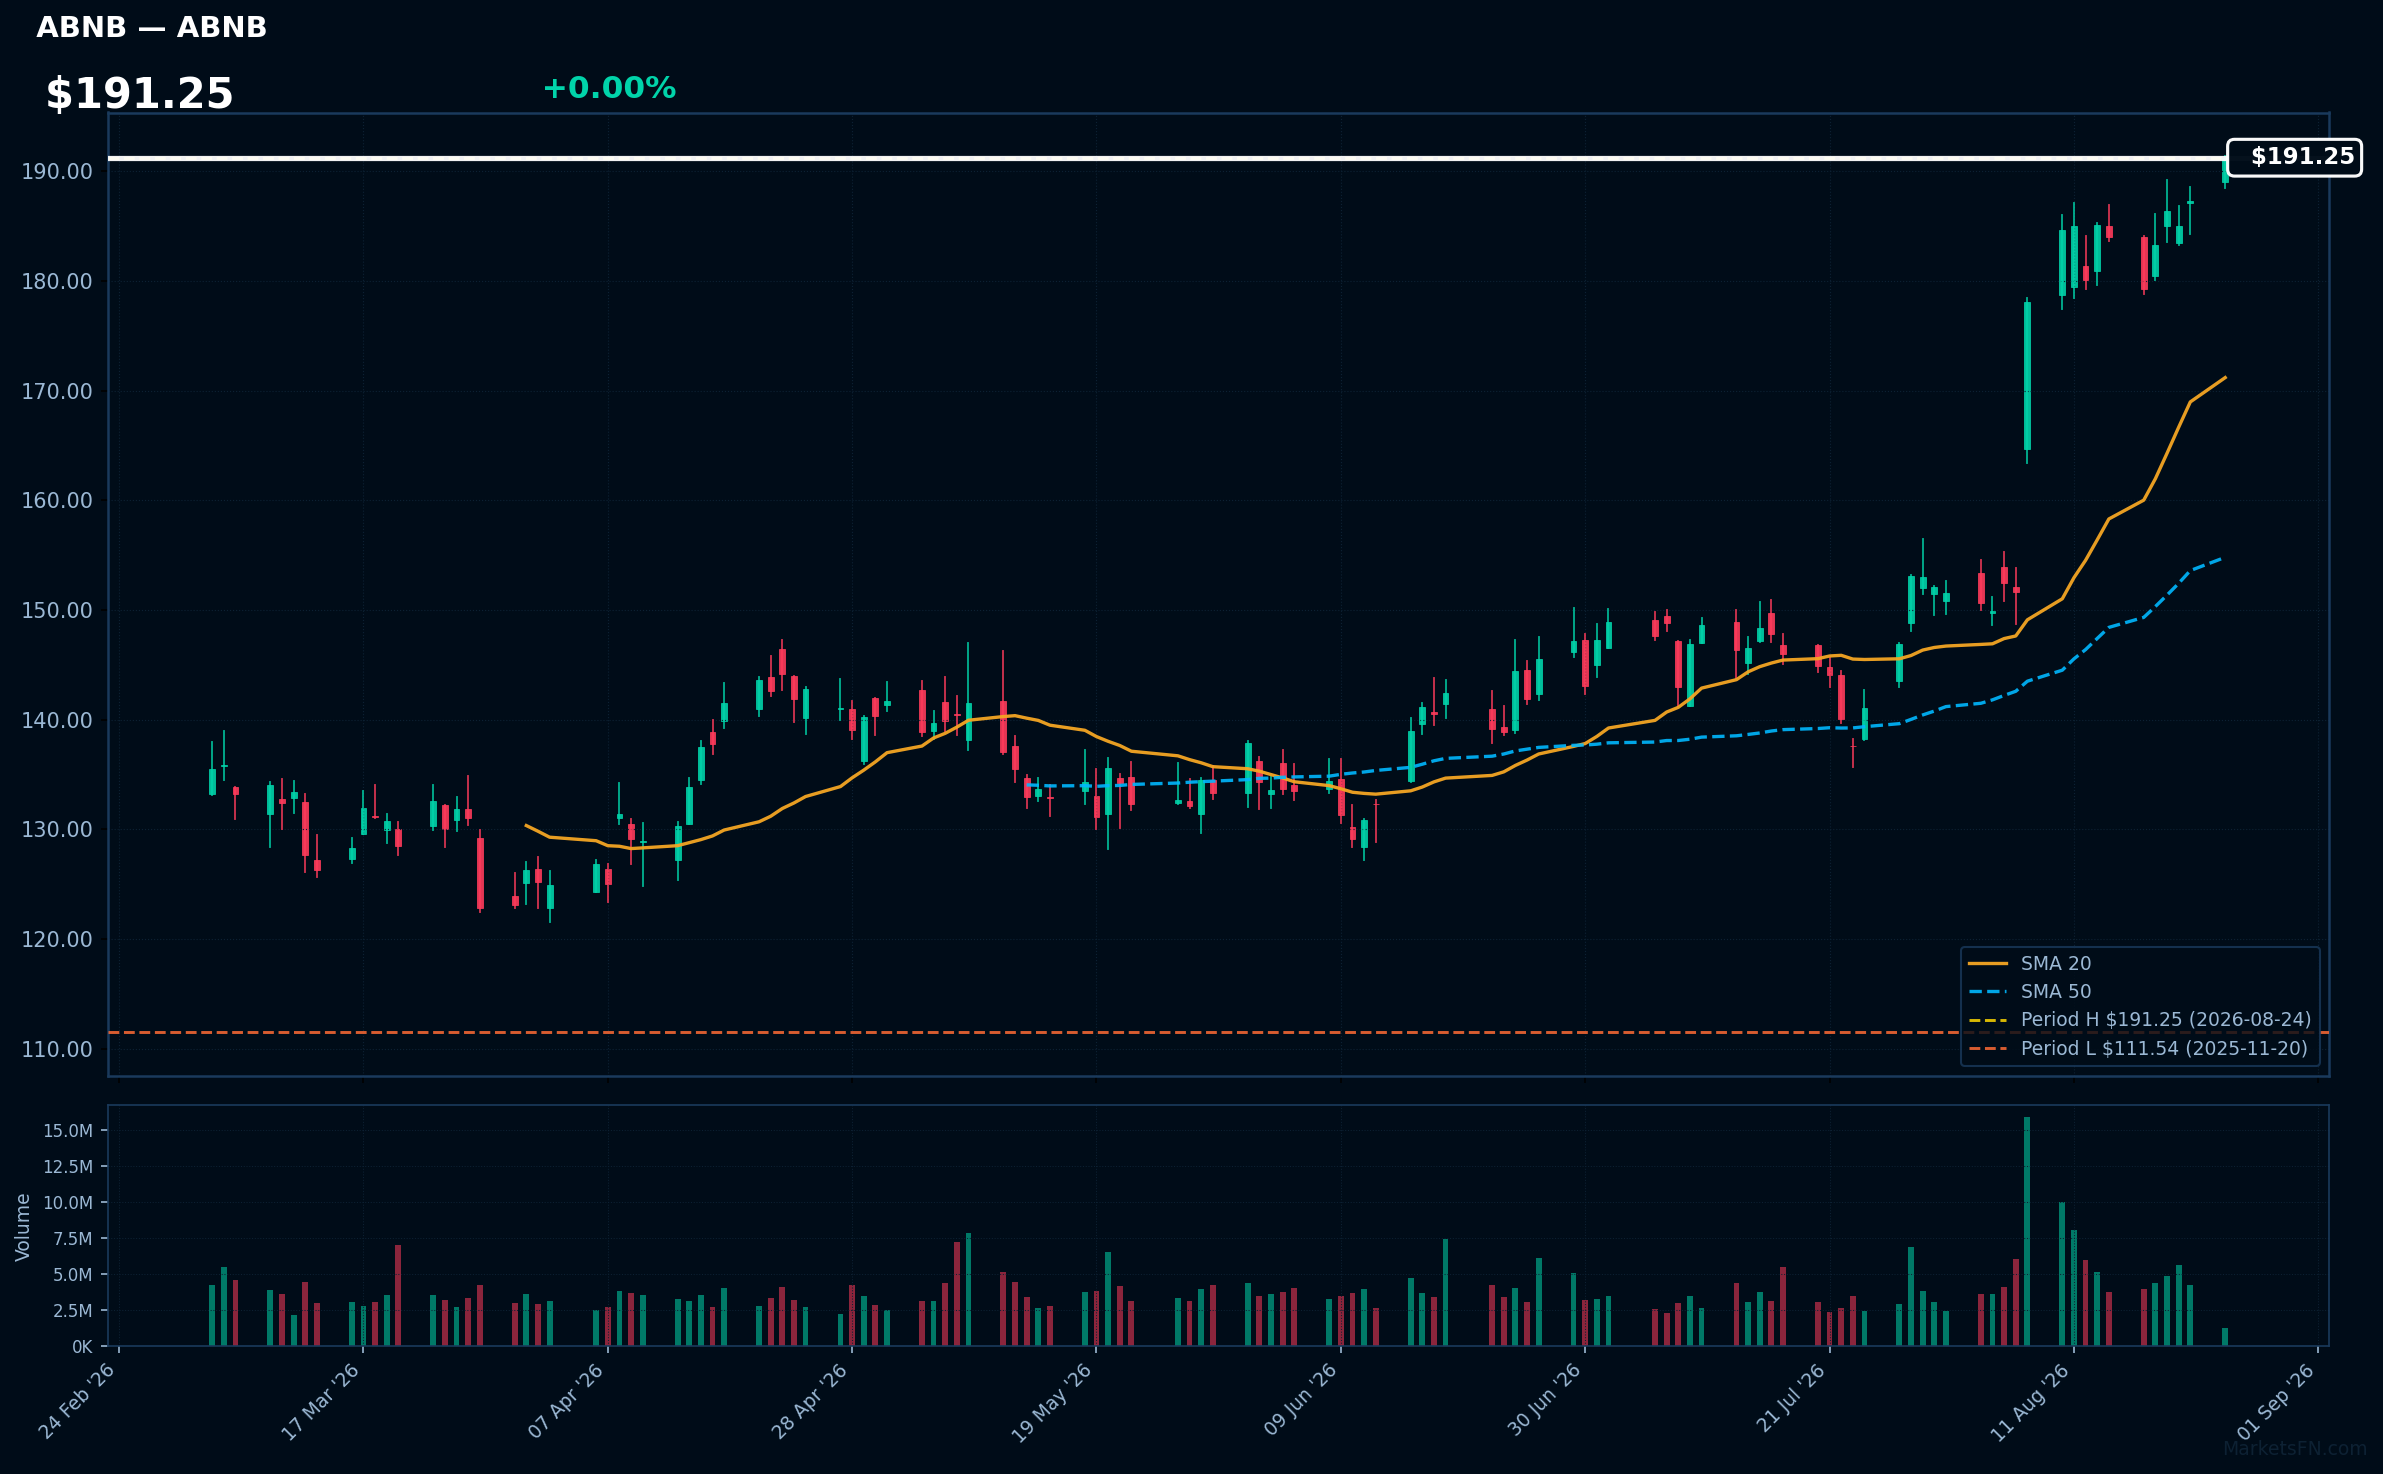
ABNB | Airbnb Inc | Consumer Cyclical | Price Last: $191.25 | % Realized: +49.24% | RSI: 74.0 | % above MA200: +40.1% | Trend: Above MA20, MA50, MA200
Airbnb Inc (ABNB) operates an online marketplace for lodging, primarily short-term rentals, connecting hosts and guests globally. Investors should care due to its innovative business model and significant growth potential in the travel and hospitality sectors.
The current technical situation shows bullish momentum with an RSI of 74.0 and a strong MA alignment: price > MA20 > MA50 > MA200, indicating a sustained uptrend.
Related headlines
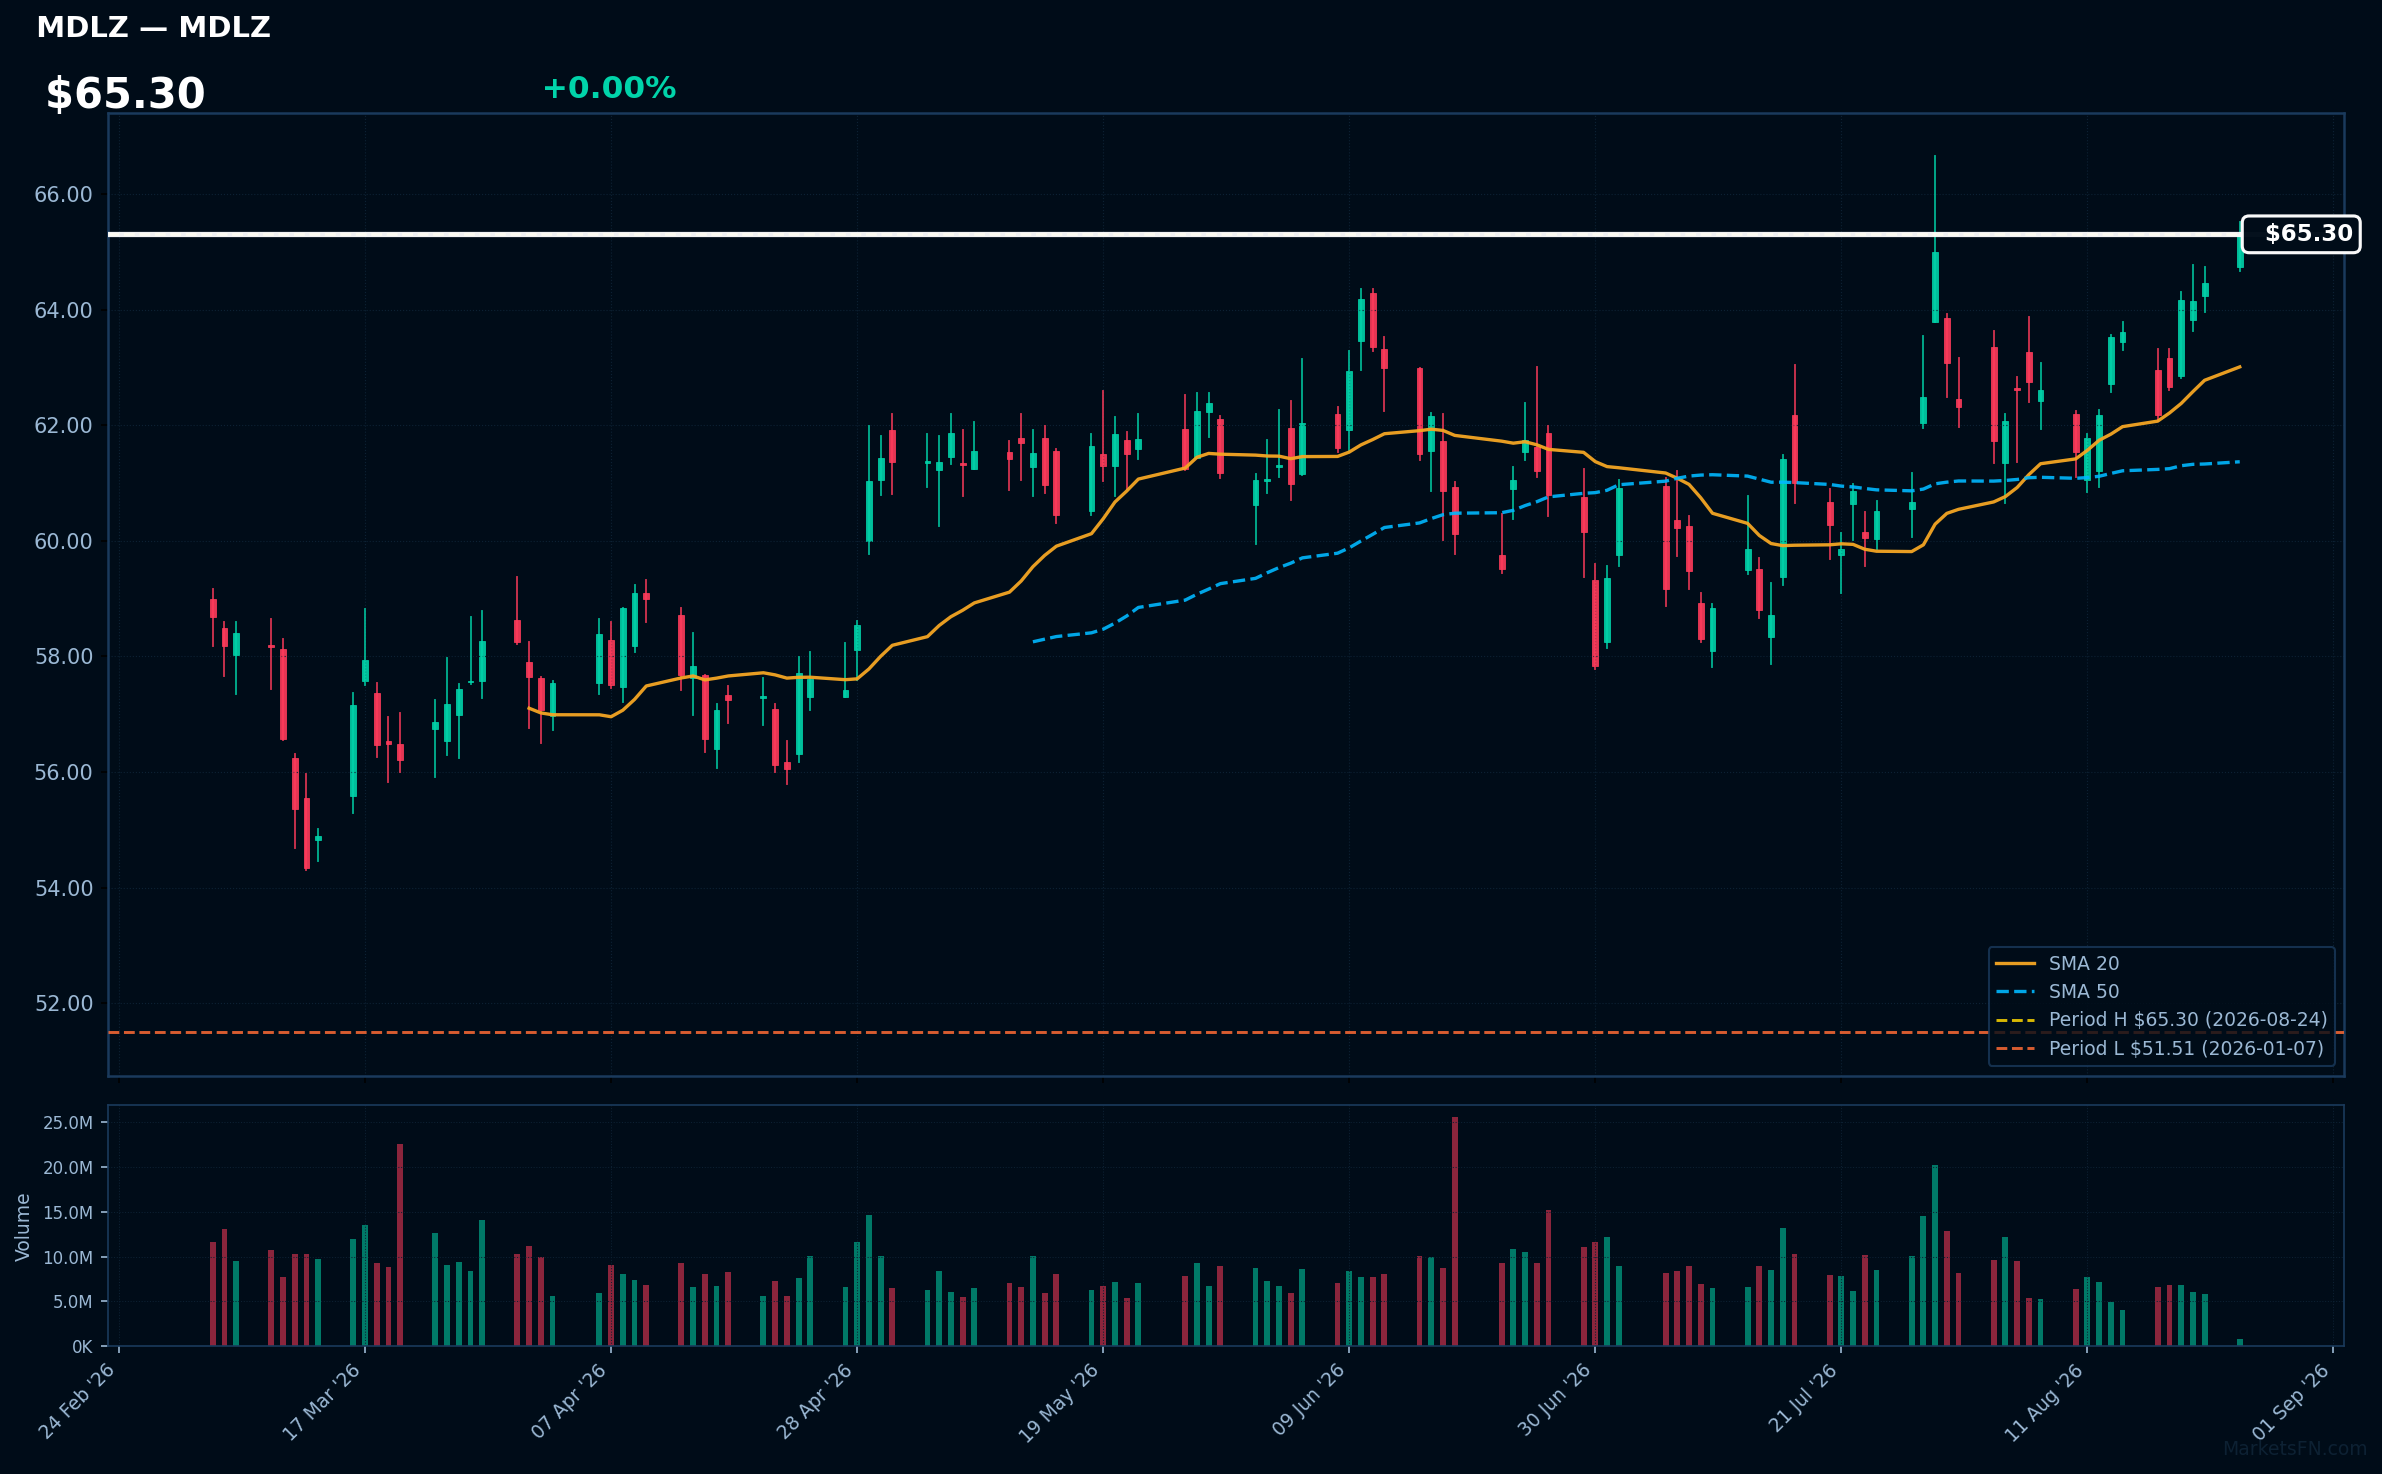
MDLZ | Mondelez International Inc | Consumer Defensive | Price Last: $65.30 | % Realized: +5.39% | RSI: 63.8 | % above MA200: +11.0% | Trend: Above MA20, MA50, MA200
Mondelez International Inc (MDLZ) is a global leader in snack foods, producing popular brands like Oreo and Cadbury. Investors should care due to its strong market position and consistent demand for snacks, which can provide stable revenue growth.
The current technical situation indicates bullish momentum, with an RSI(14) of 63.8 and a bullish MA alignment: price > MA20 > MA50 > MA200. The stock is also 0.0% below its 52-Week high.
Related headlines
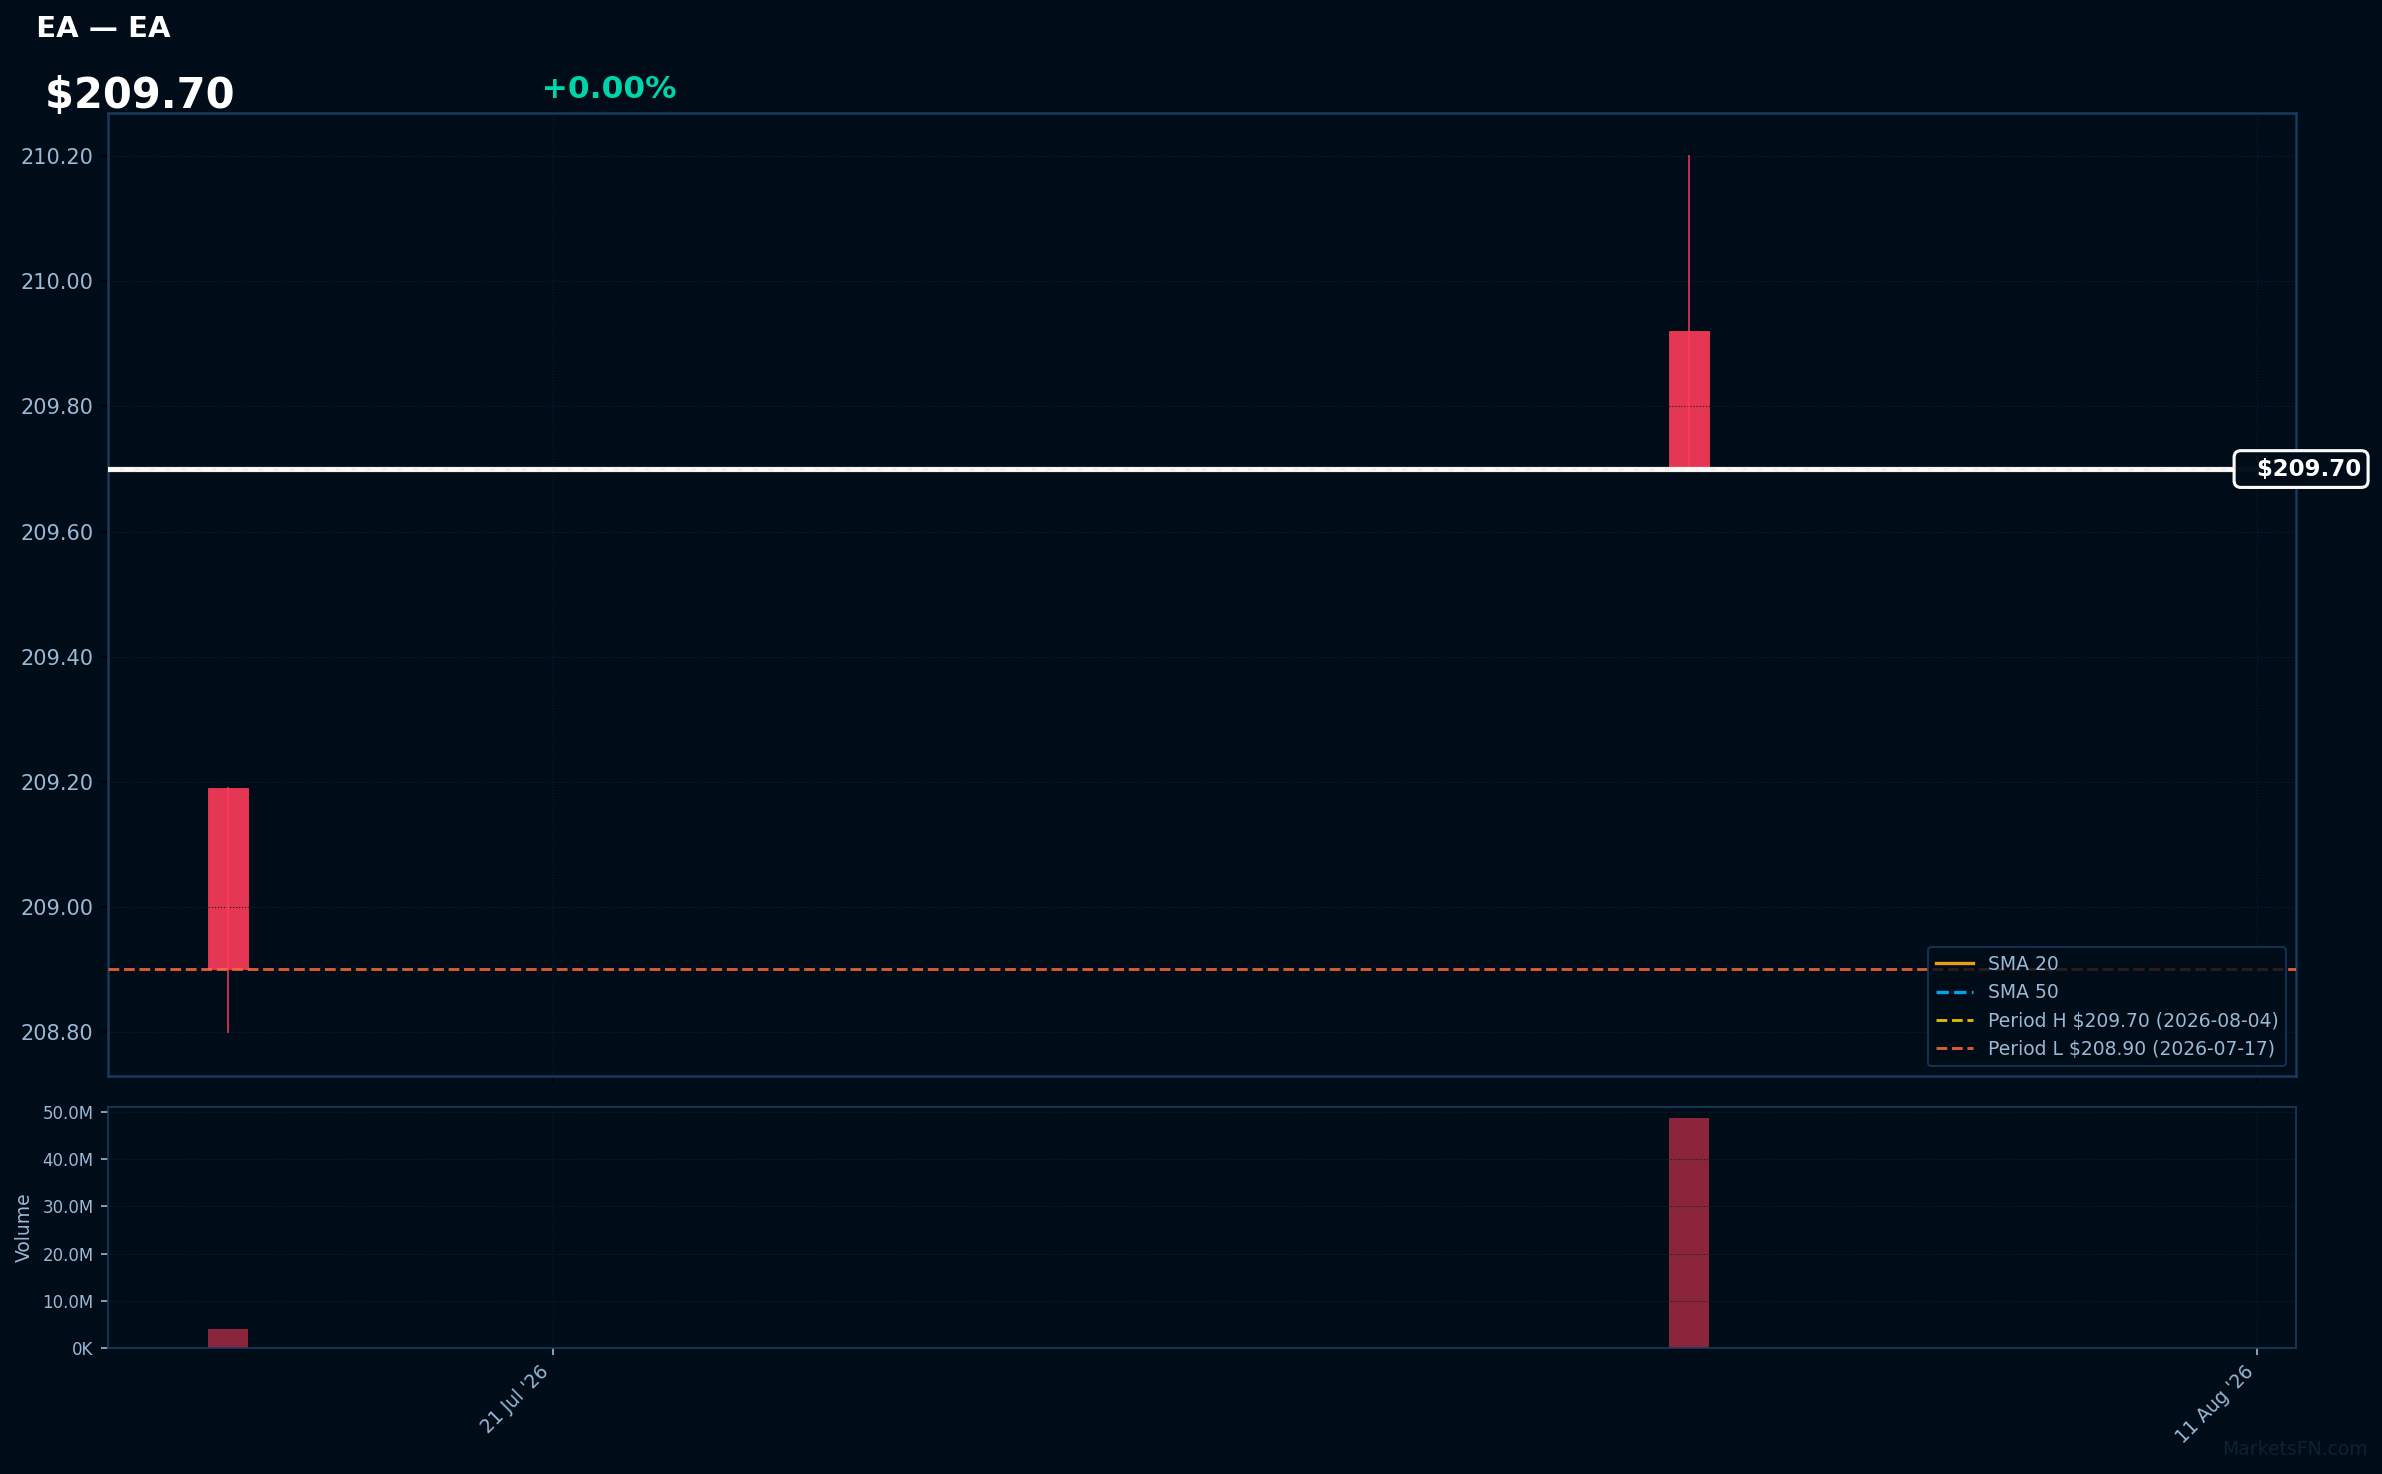
EA | Electronic Arts, Inc | Communication Services | Price Last: $209.70 | % Realized: +0.38% | RSI: — | % above MA200: — | Trend: —
Electronic Arts, Inc. develops and publishes interactive software, primarily in the gaming sector, with popular franchises like FIFA and Madden NFL. Investors should care due to its strong market position and potential for growth in the expanding gaming industry.
The stock is 0.0% below its 52-Week high, indicating a potential breakout level. RSI(14) data is N/A, and MA data is incomplete, limiting further technical analysis.
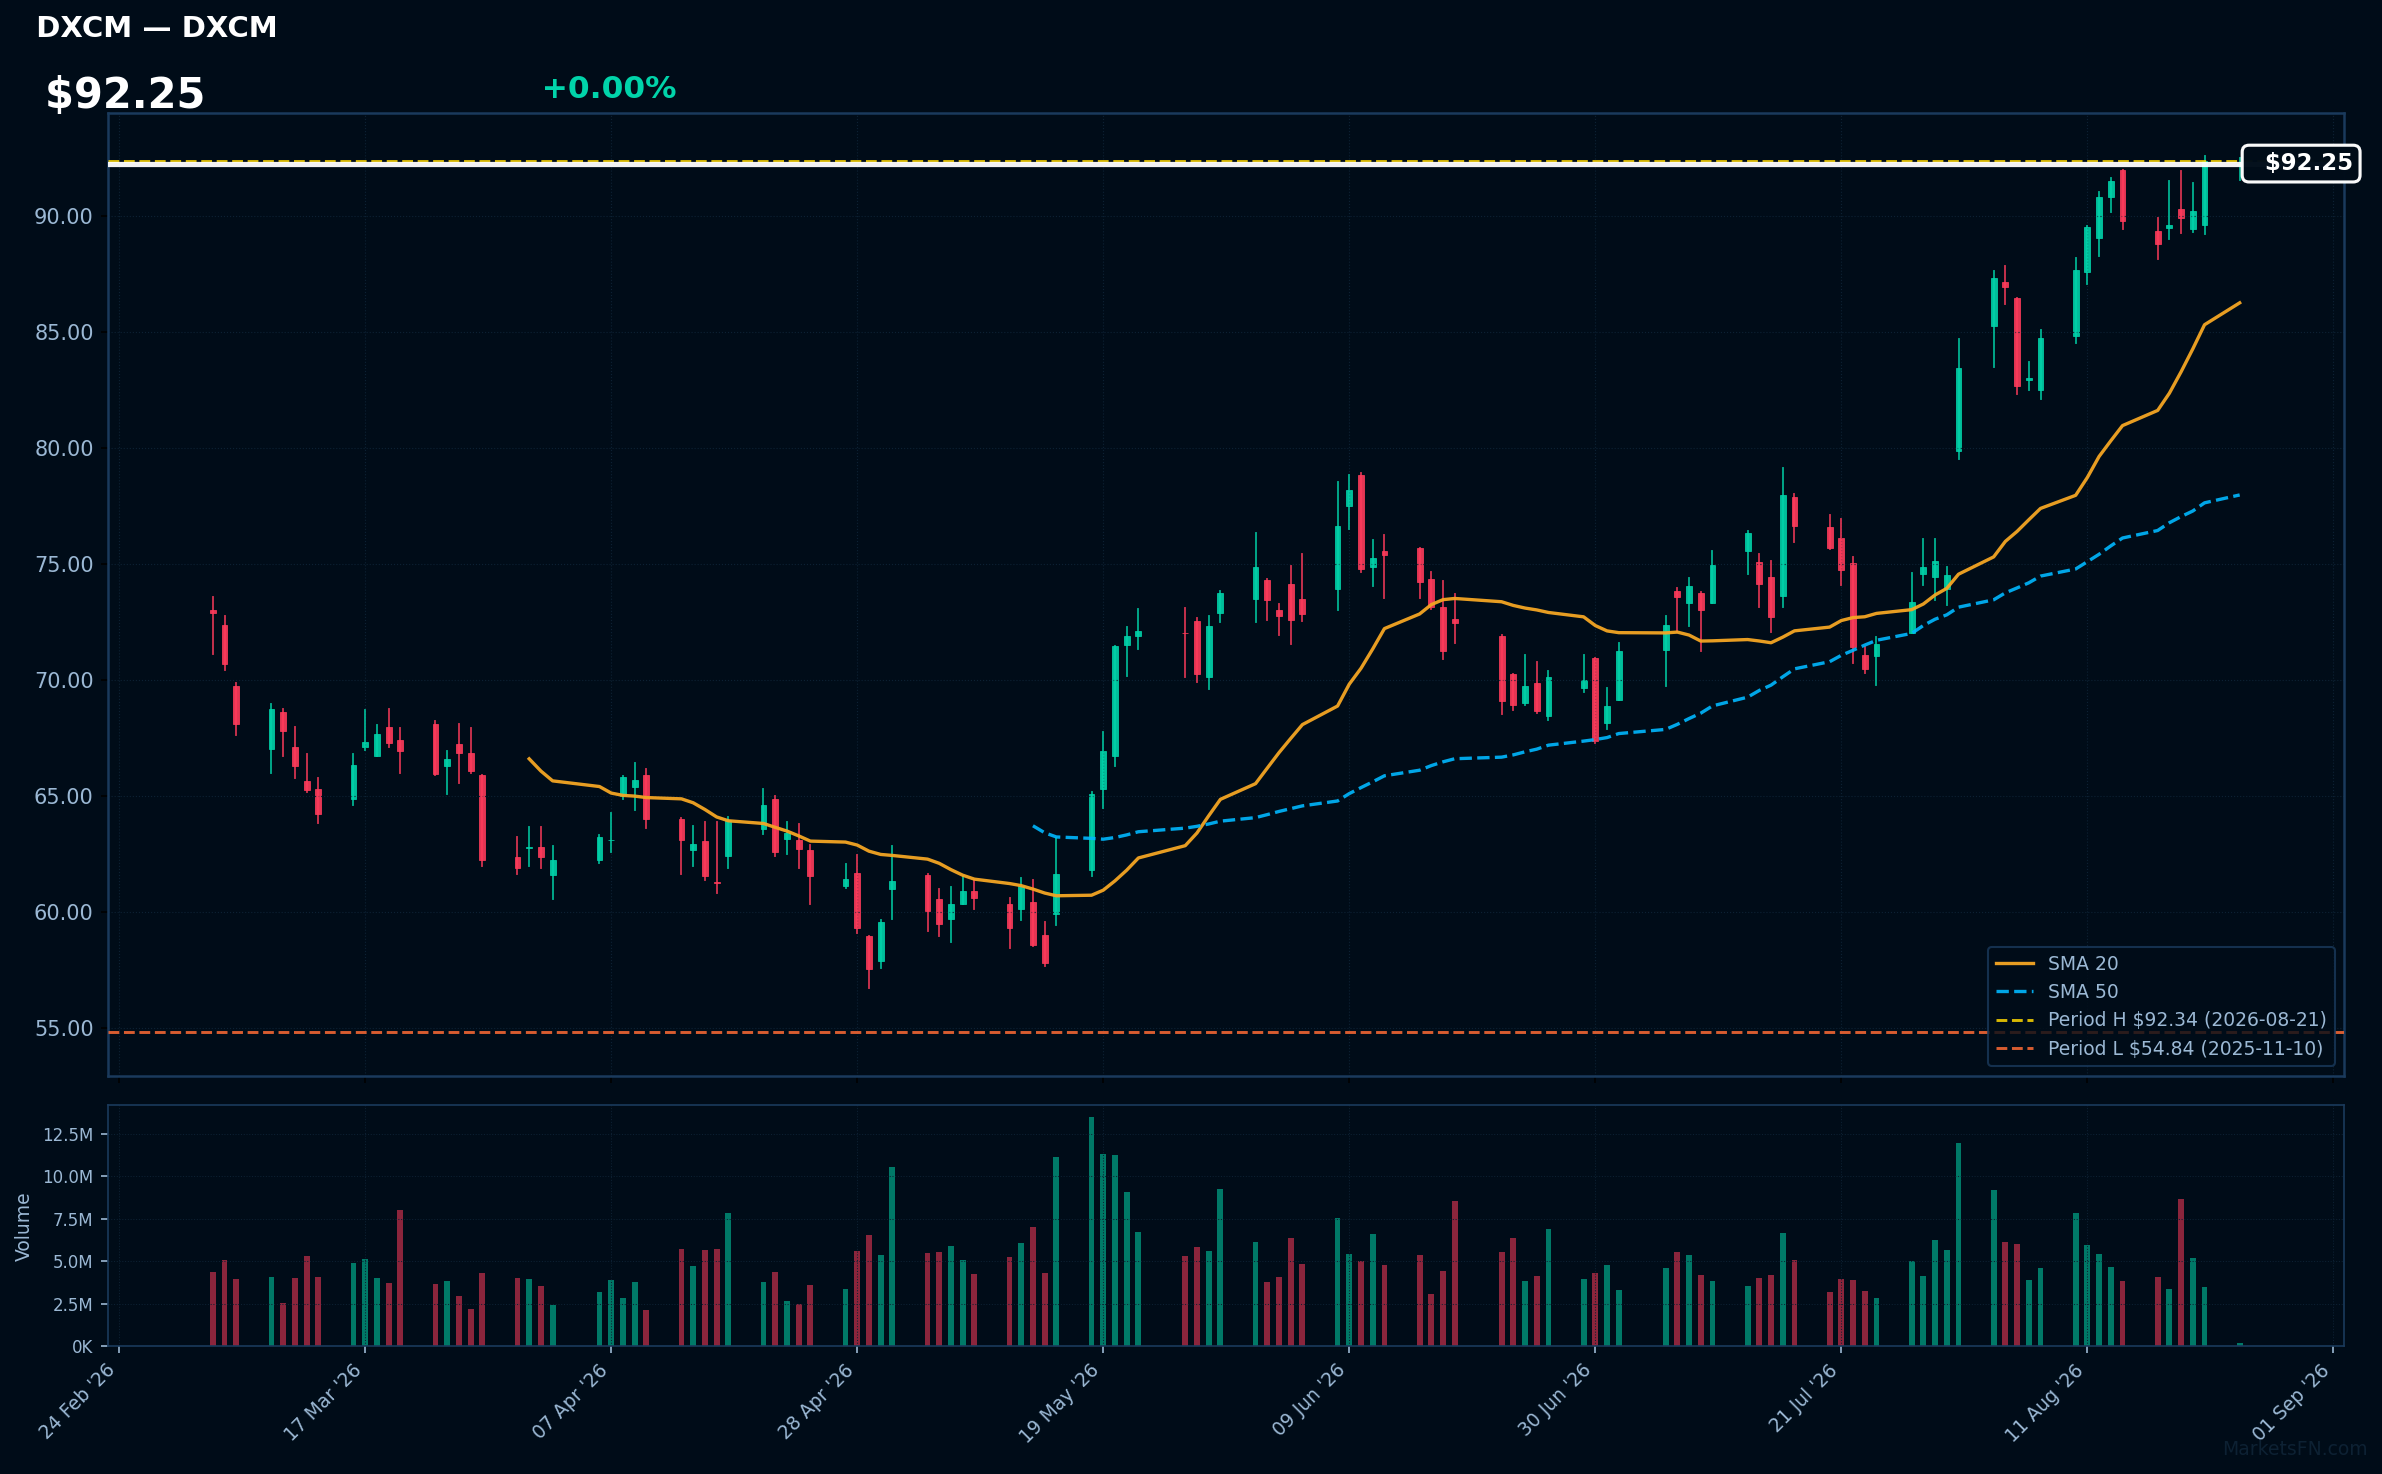
DXCM | Dexcom Inc | Healthcare | Price Last: $92.25 | % Realized: +21.44% | RSI: 69.7 | % above MA200: +32.8% | Trend: Above MA20, MA50, MA200
Dexcom Inc specializes in continuous glucose monitoring systems for diabetes management, providing real-time data that empowers patients and healthcare providers. Investors should care due to the growing demand for diabetes care solutions and Dexcom's innovative technology positioning it as a leader in this market.
The current technical situation shows bullish momentum with an RSI(14) of 69.7 and a strong MA alignment: price > MA20 > MA50 > MA200. The stock is also 0.1% below its 52-Week high, indicating a potential breakout.
Related headlines
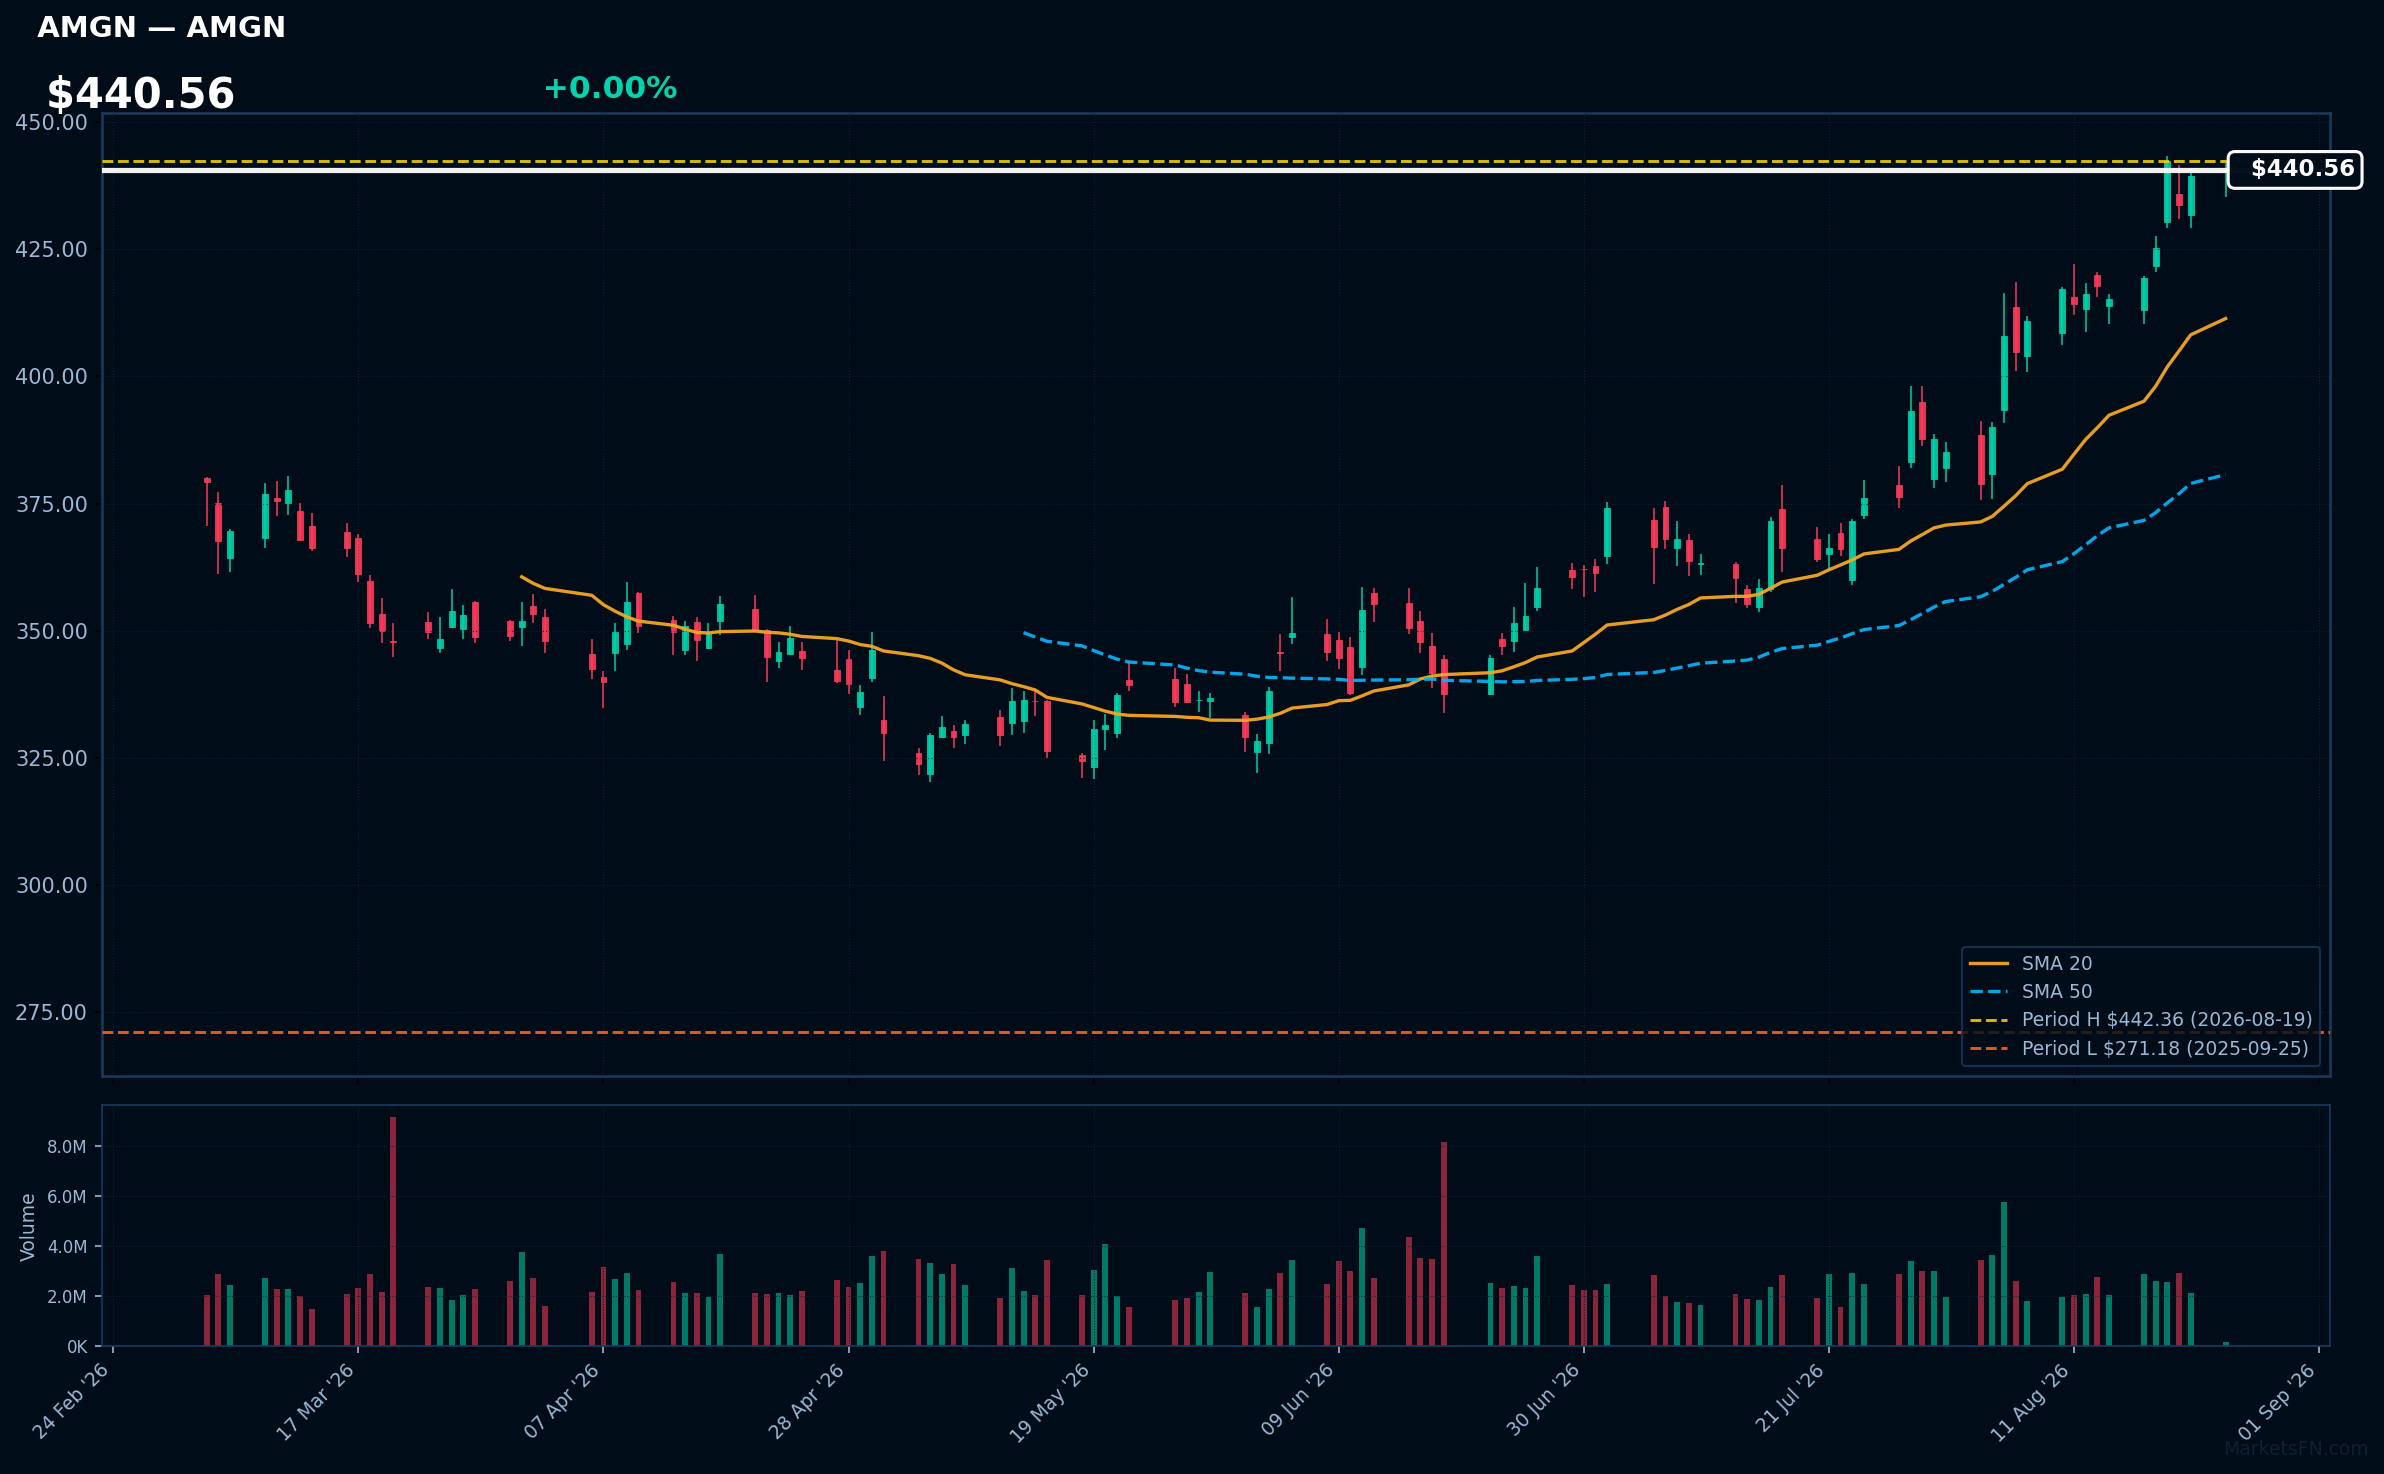
AMGN | AMGEN Inc | Healthcare | Price Last: $440.56 | % Realized: +52.72% | RSI: 73.9 | % above MA200: +24.6% | Trend: Above MA20, MA50, MA200
AMGEN Inc (AMGN) is a biotechnology company focused on developing innovative therapies for serious illnesses, particularly in oncology and inflammation. Investors should care due to its strong pipeline and market position, which drive growth and potential returns.
AMGN shows bullish momentum with an RSI(14) of 73.9 and a strong MA alignment: price > MA20 > MA50 > MA200. The stock is 0.4% below its 52-Week high, indicating a potential breakout.
Related headlines
📉 Nearest to 52-Week Low
Sectors represented: Communication Services (3), Utilities (1), Technology (1)
| Ticker | Company | Sector | Price Last | % Realized | 52-Week Low Date | RSI | % above MA200 | Trend |
|---|---|---|---|---|---|---|---|---|
| APP | Applovin Corp | Communication Services | $300.60 | -33.30% | 2026-08-24 | 28.6 | -39.7% | Below MA20, MA50, MA200 |
| EA | Electronic Arts, Inc | Communication Services | $209.70 | +0.38% | 2026-07-17 | — | — | — |
| TTD | Trade Desk Inc | Communication Services | $13.32 | -74.56% | 2026-08-21 | 32.7 | -49.5% | Below MA20, MA50, MA200 |
| EXC | Exelon Corp | Utilities | $44.06 | -1.20% | 2025-09-16 | 37.1 | -4.2% | Below MA20, MA50, MA200 |
| SNPS | Synopsys, Inc | Technology | $389.07 | -34.83% | 2026-07-30 | 39.0 | -12.8% | Below MA20, MA50, MA200 |
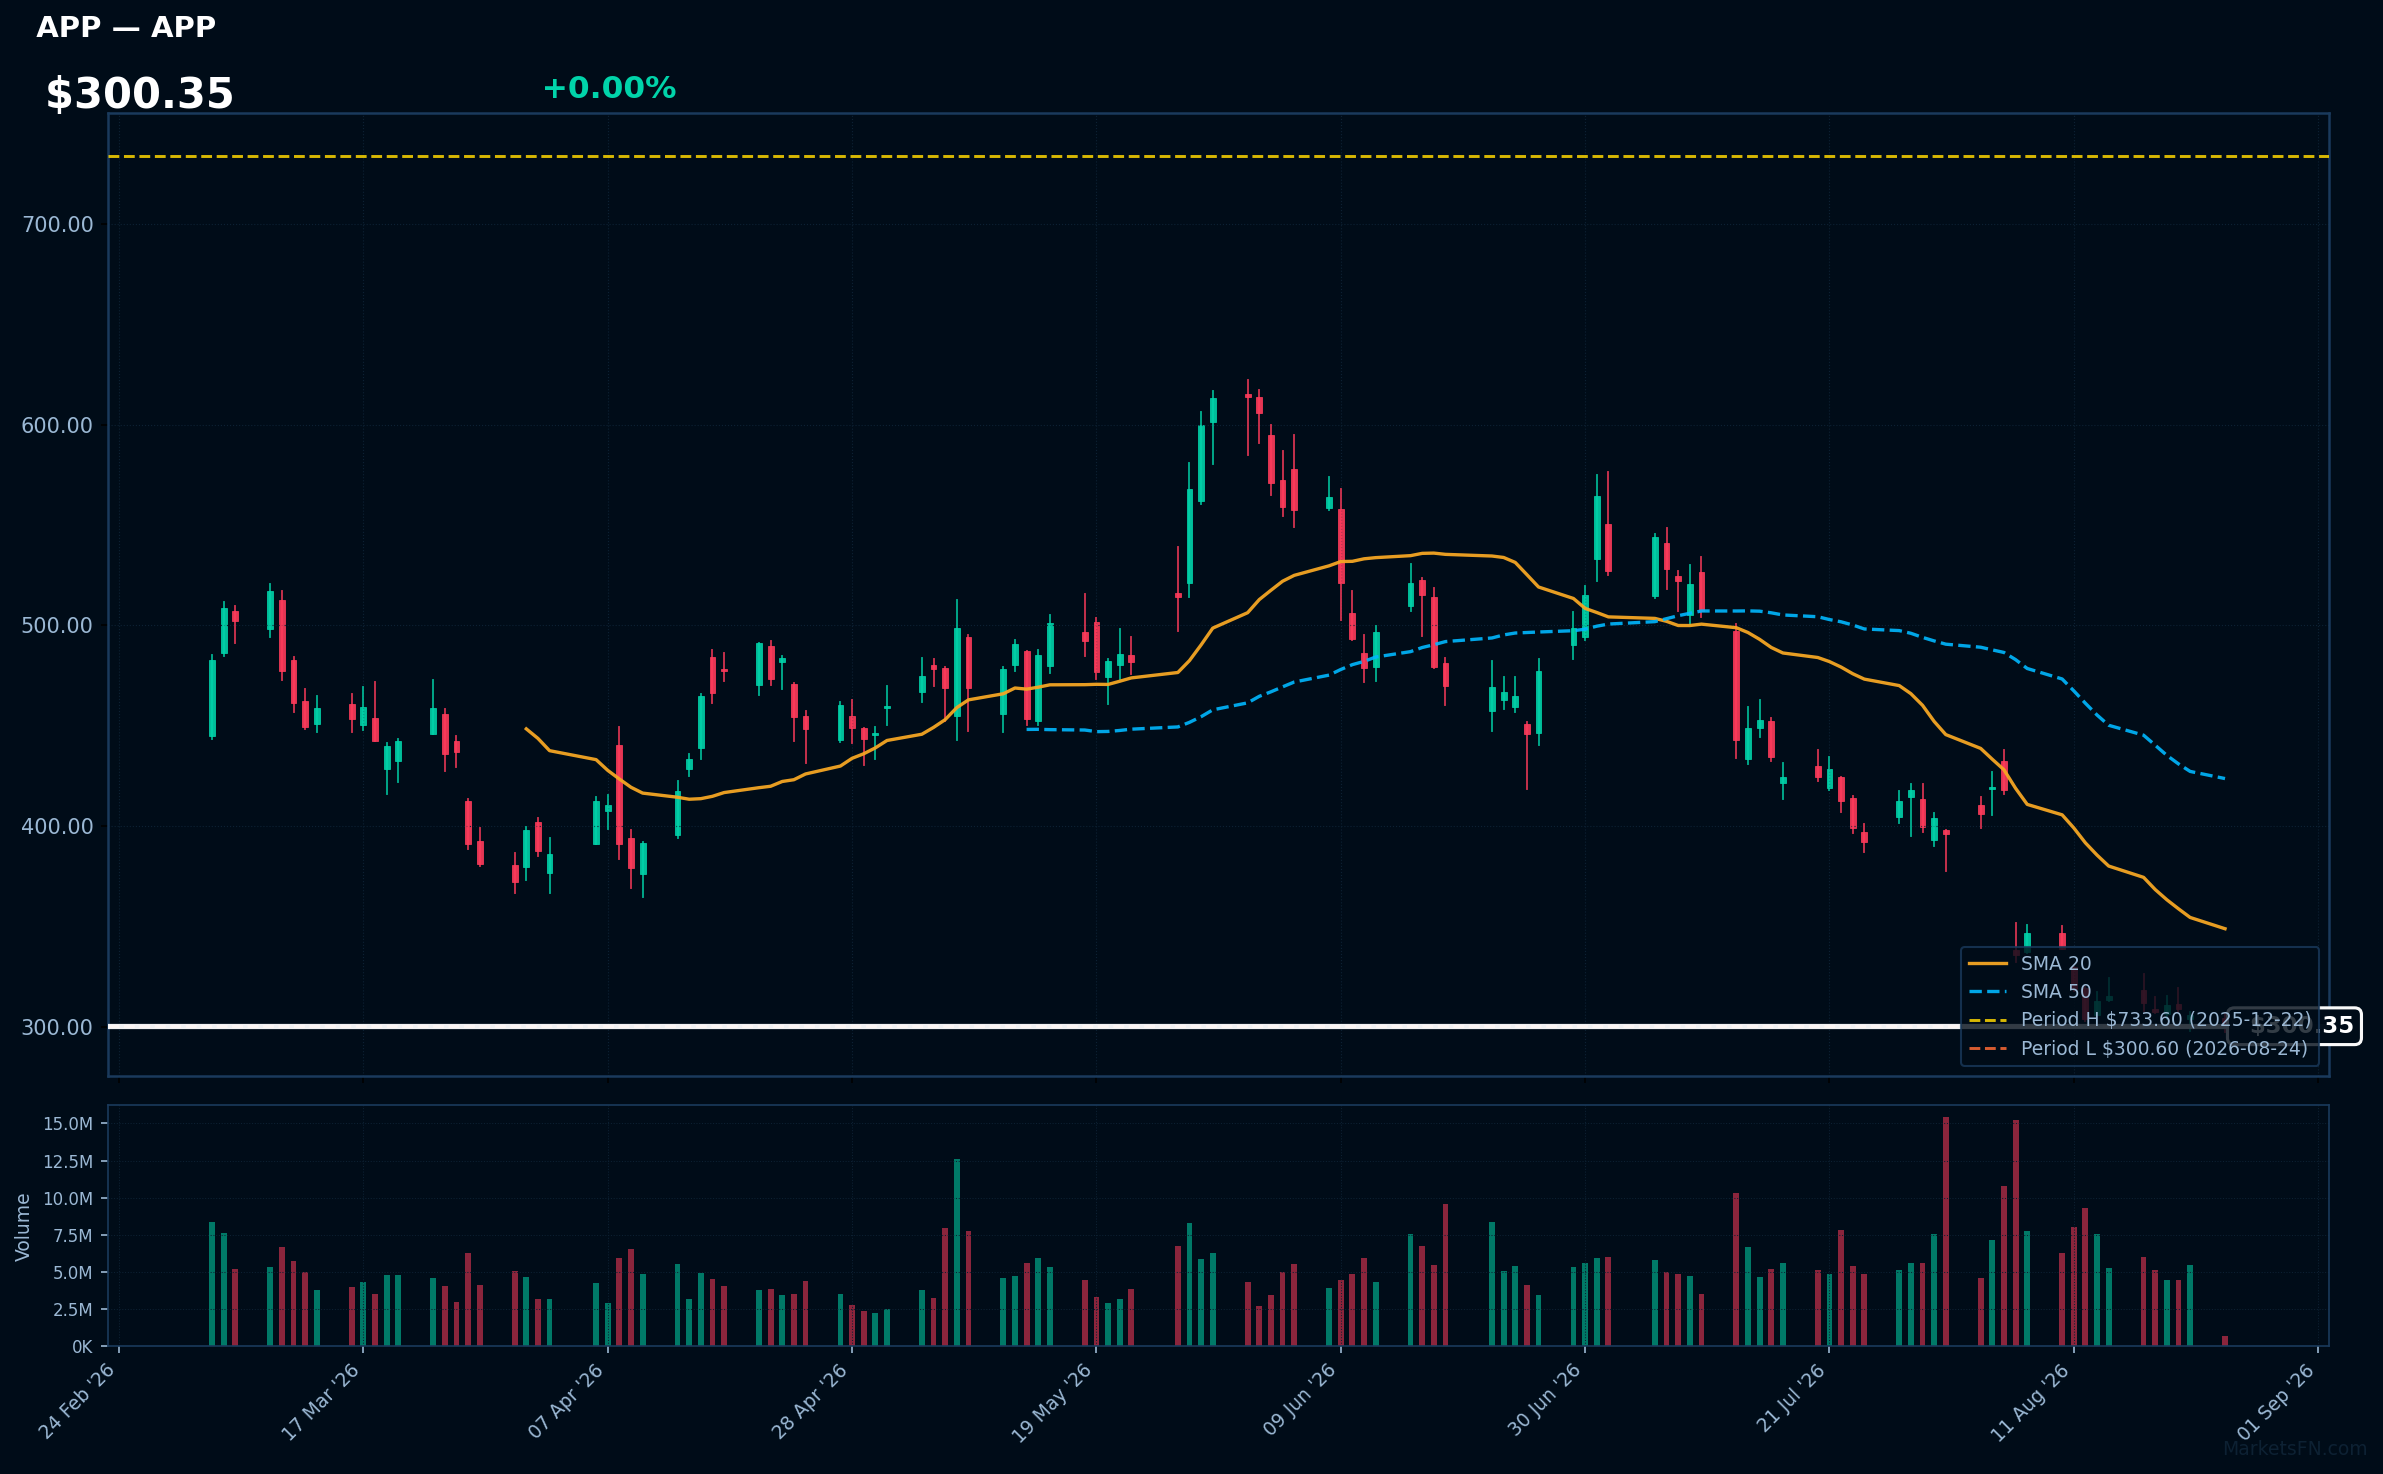
APP | Applovin Corp | Communication Services | Price Last: $300.60 | % Realized: -33.30% | RSI: 28.6 | % above MA200: -39.7% | Trend: Below MA20, MA50, MA200
Applovin Corp (APP) provides a platform for mobile app developers to monetize and market their applications through advertising technology, making it crucial for investors focused on the growing mobile ecosystem and digital advertising trends.
Currently, APP shows a bearish technical situation with an RSI(14) of 28.6 and a MA alignment indicating a sustained downtrend: price < MA20 < MA50 < MA200. It is testing major support, being only 0.0% above its 52-Week low.
Related headlines
- Why Did APP, CMS, MVIS Stocks Plunge To 52-Week Lows Last Week?
- APP Stock Dips Below $300 For First Time In Over A Year Analyst Cuts Target By $60, But Believes Business Remains High Quality
- AppLovin sentiment turns negative as bull case grows harder to find, Jefferies says
- Why Did FVRR, APP, GPRO Stocks Plunge To 52-Week Lows On Wednesday?
EA | Electronic Arts, Inc | Communication Services | Price Last: $209.70 | % Realized: +0.38% | RSI: — | % above MA200: — | Trend: —
Electronic Arts, Inc. develops and publishes interactive software, primarily in the gaming sector, with popular franchises like FIFA and Madden NFL. Investors should care due to its strong market position and potential for growth in the expanding gaming industry.
The stock is 0.0% below its 52-Week high, indicating a potential breakout level. RSI(14) data is N/A, and MA data is incomplete, limiting further technical analysis.
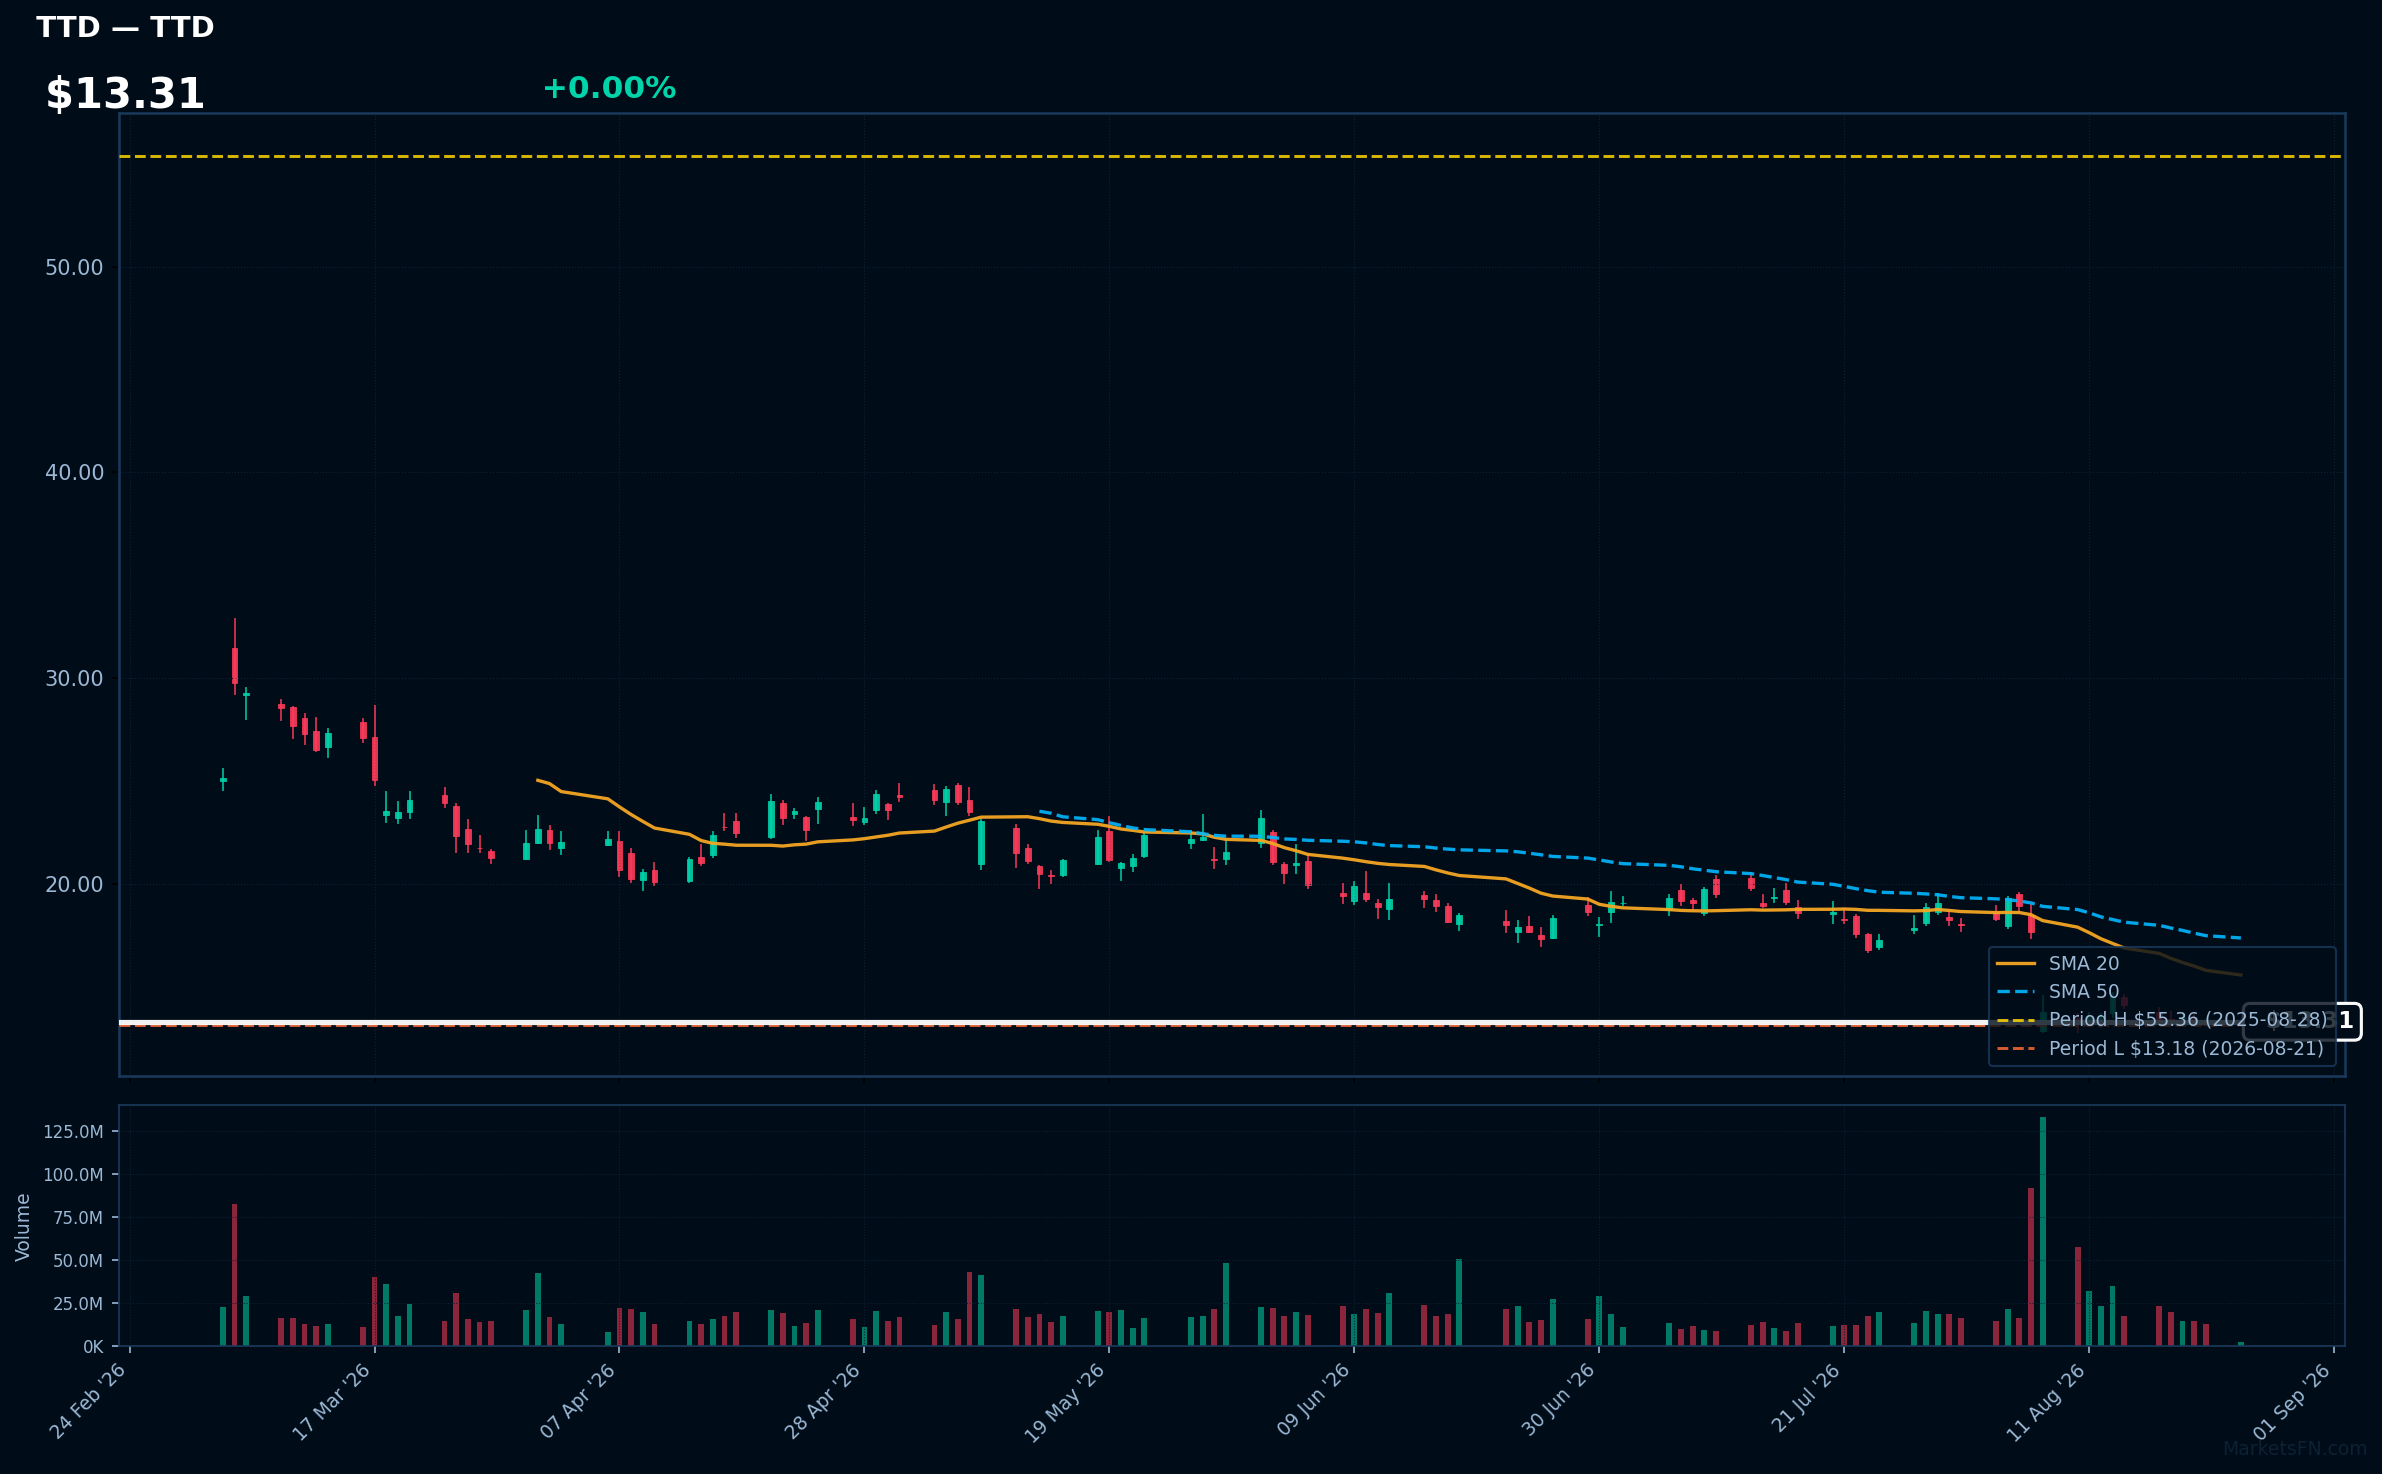
TTD | Trade Desk Inc | Communication Services | Price Last: $13.32 | % Realized: -74.56% | RSI: 32.7 | % above MA200: -49.5% | Trend: Below MA20, MA50, MA200
Trade Desk Inc (TTD) provides a technology platform for digital advertising, enabling advertisers to manage and optimize their ad campaigns across various channels. Investors should care due to its significant market position and potential for growth in the expanding digital advertising sector.
The current technical situation indicates a warning sign, with an RSI(14) of 32.7 suggesting oversold conditions. The bearish MA alignment shows price < MA20 < MA50 < MA200, indicating a sustained downtrend and testing major support, being only 1.1% above its 52-Week low.
Related headlines
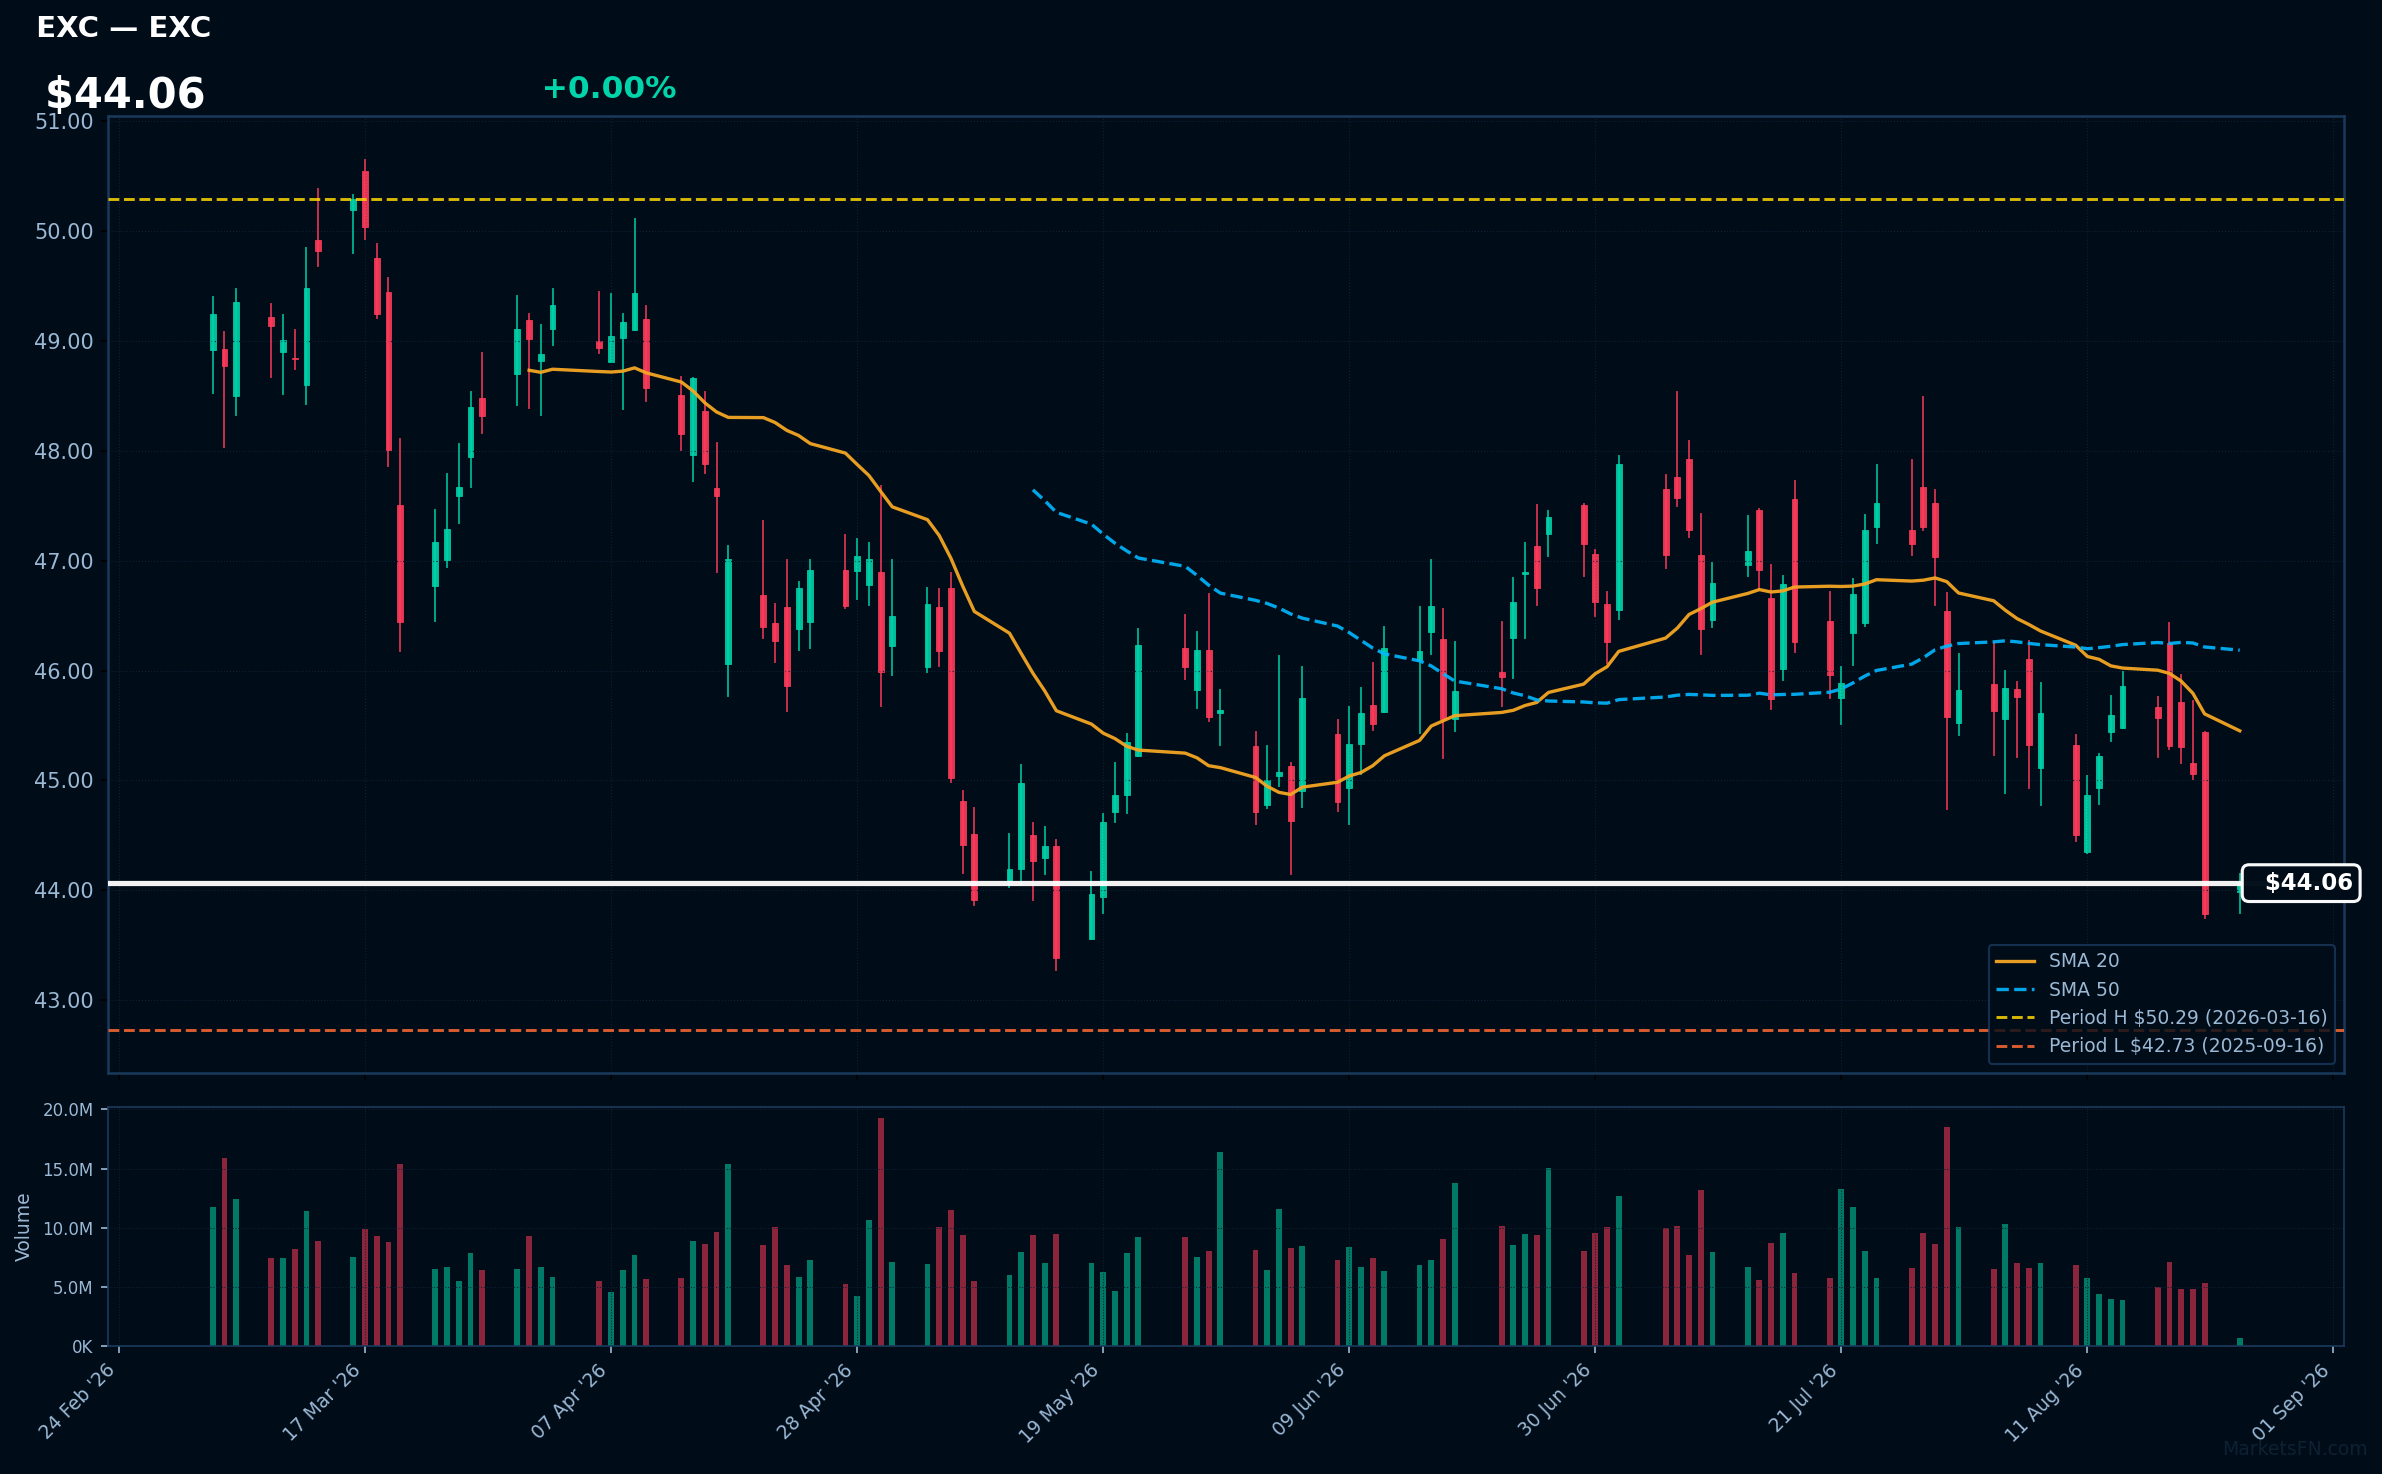
EXC | Exelon Corp | Utilities | Price Last: $44.06 | % Realized: -1.20% | RSI: 37.1 | % above MA200: -4.2% | Trend: Below MA20, MA50, MA200
Exelon Corp (EXC) is a leading energy provider, focusing on nuclear and renewable energy generation. Investors should care due to its significant role in the transition to cleaner energy, which positions it well amid increasing demand for sustainable power solutions.
Currently, EXC shows mixed technical signals with an RSI(14) of 37.1, indicating potential weakness. The stock is below MA20, MA50, and MA200, suggesting a warning sign as it tests major support, being only 3.1% above its 52-Week low.
Related headlines
- Exelon Secures More Than $1 Billion in Customer Protections Through Pioneering Transmission Security Agreements
- Exelon high probability data center load falls 40%
- Exelon Corp (EXC) (Q2 2026) Earnings Call Highlights: Navigating Regulatory Hurdles and Data ...
- Exelon Corporation Q2 2026 Earnings Call Summary
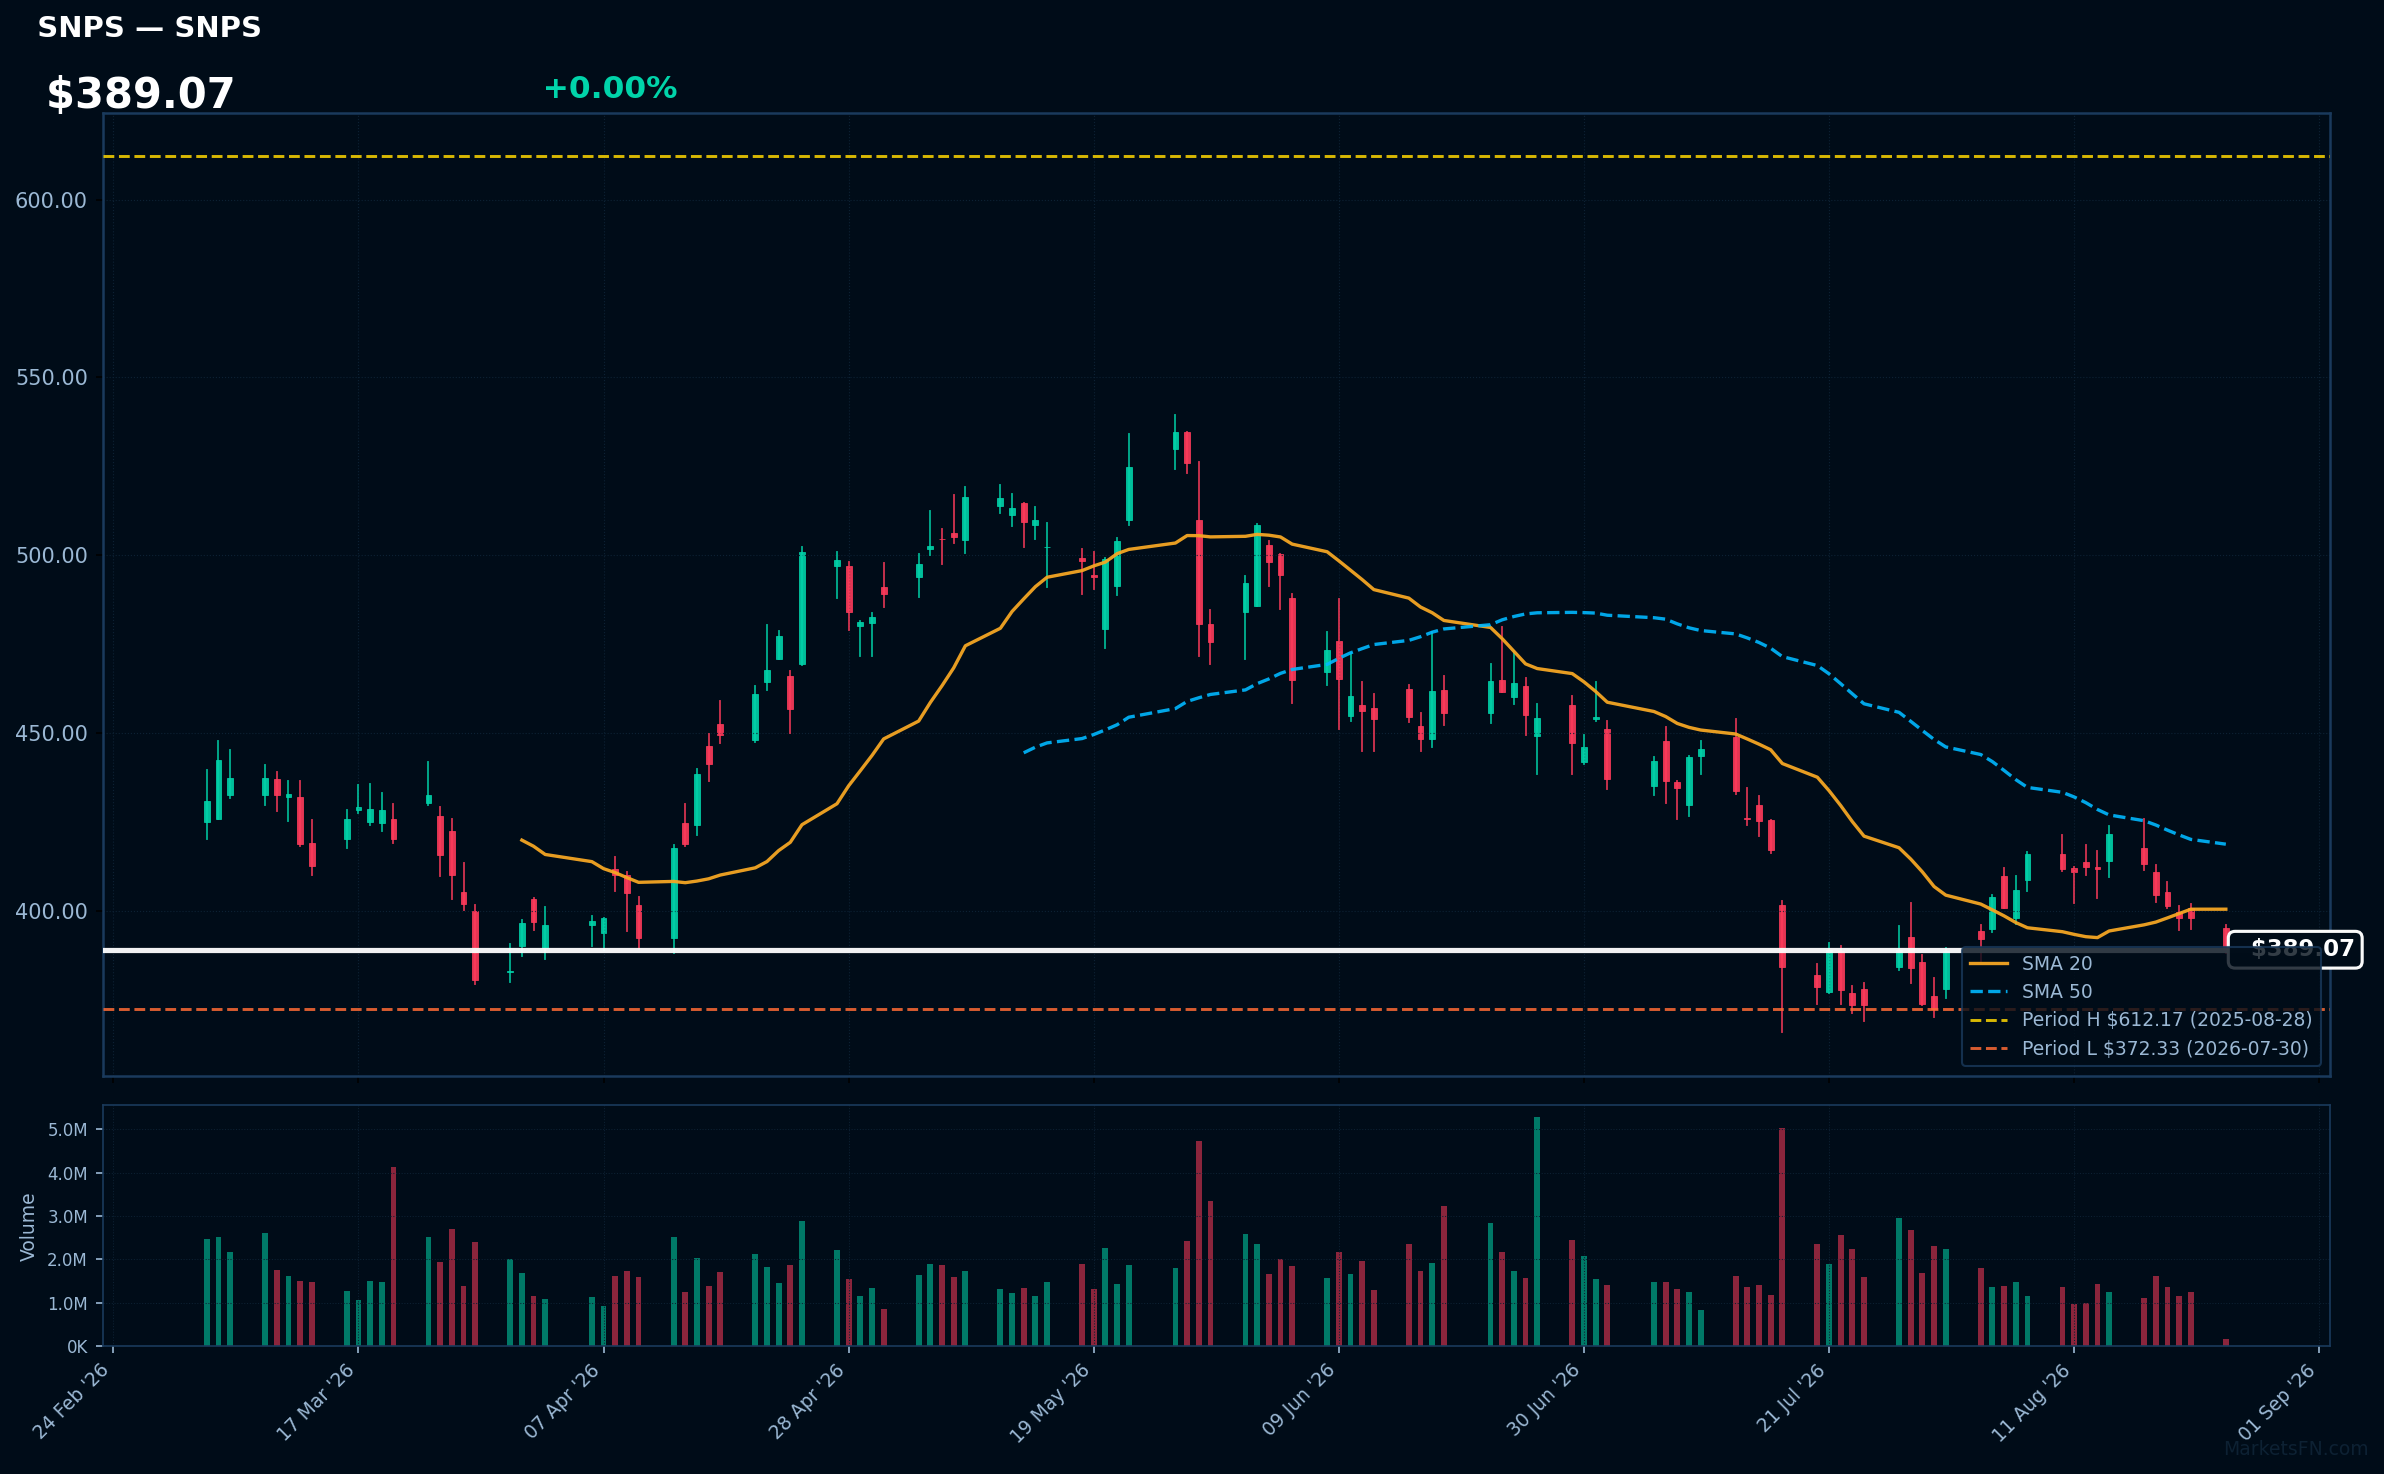
SNPS | Synopsys, Inc | Technology | Price Last: $389.07 | % Realized: -34.83% | RSI: 39.0 | % above MA200: -12.8% | Trend: Below MA20, MA50, MA200
Synopsys, Inc. provides software and services for semiconductor design and verification, enabling companies to develop advanced electronic systems. Investors should care due to its critical role in the tech supply chain, especially as demand for semiconductors continues to grow.
The current technical situation indicates a bearish trend, with an RSI(14) of 39.0 and a MA alignment of price < MA20 < MA50 < MA200, suggesting sustained downtrend and potential warning signs for investors.
Related headlines
Market Commentary
The presence of several Nasdaq 100 stocks near their 52-week extremes signals a heightened volatility and investor interest in the technology sector. Stocks like Airbnb Inc (ABNB), Mondelez International Inc (MDLZ), and Electronic Arts, Inc (EA) are at their 52-week highs, indicating strong bullish sentiment and potential momentum. Conversely, stocks such as Applovin Corp (APP) and Trade Desk Inc (TTD) are near their 52-week lows, suggesting bearish pressure and possible concerns about their future performance.
Current macro themes influencing these price levels include ongoing advancements in technology, shifts in consumer behavior, and broader economic conditions. The resilience of companies like Dexcom Inc (DXCM) and AMGEN Inc (AMGN) reflects strong demand for health tech and biotech solutions, while the struggles of firms like EA may indicate market saturation or changing consumer preferences. Investors are closely monitoring these trends as they assess the sector's growth potential.
Key levels to watch include the 52-week highs for stocks like ABNB and MDLZ, which could serve as breakout points if surpassed. Conversely, the lows for stocks like APP and EXC may act as critical support levels. Potential catalysts for movement include upcoming earnings reports, changes in consumer spending, and macroeconomic data releases that could influence investor sentiment and market direction.
Methodology: All 101 Nasdaq 100 constituents screened. 52-week high = highest daily close over the past 252 trading days (approx. 1 year). 52-week low = lowest daily close over the same period. Distance = (current price / extreme − 1) × 100. Technical indicators computed on up to 1 year of daily OHLCV data.
Disclaimer: For informational purposes only. Not investment advice. Past performance is not indicative of future results.

