Nasdaq 100 52-Week Highs & Lows Radar: AMGEN (AMGN), Tesla (TSLA) and more
MarketsFN Team

Nasdaq 100 52-Week Highs & Lows Radar: AMGEN (AMGN), Tesla (TSLA) and more
Screening all 101 Nasdaq 100 constituents for stocks nearest to their 52-week high and their 52-week low. Data as of July 28, 2026. % Realized = 52-week total return.
Legend: RSI > 70 = overbought · RSI < 30 = oversold · Green % Realized = positive 52W return · Red = negative.
📈 Nearest to 52-Week High
Sectors represented: Consumer Cyclical (2), Healthcare (1), Industrials (1), Communication Services (1)
| Ticker | Company | Sector | Price Last | % Realized | 52-Week High Date | RSI | % above MA200 | Trend |
|---|---|---|---|---|---|---|---|---|
| AMGN | AMGEN Inc | Healthcare | $393.55 | +30.62% | 2026-07-28 | 73.0 | +15.1% | Above MA20, MA50, MA200 |
| ABNB | Airbnb Inc | Consumer Cyclical | $149.73 | +5.32% | 2026-07-28 | 58.5 | +13.5% | Above MA20, MA50, MA200 |
| PCAR | Paccar Inc | Industrials | $134.10 | +33.24% | 2026-07-28 | 70.1 | +16.5% | Above MA20, MA50, MA200 |
| ROST | Ross Stores, Inc | Consumer Cyclical | $248.81 | +76.69% | 2026-07-28 | 69.5 | +24.1% | Above MA20, MA50, MA200 |
| EA | Electronic Arts, Inc | Communication Services | $209.32 | +37.72% | 2026-07-28 | 78.3 | +3.3% | Above MA20, MA50, MA200 |
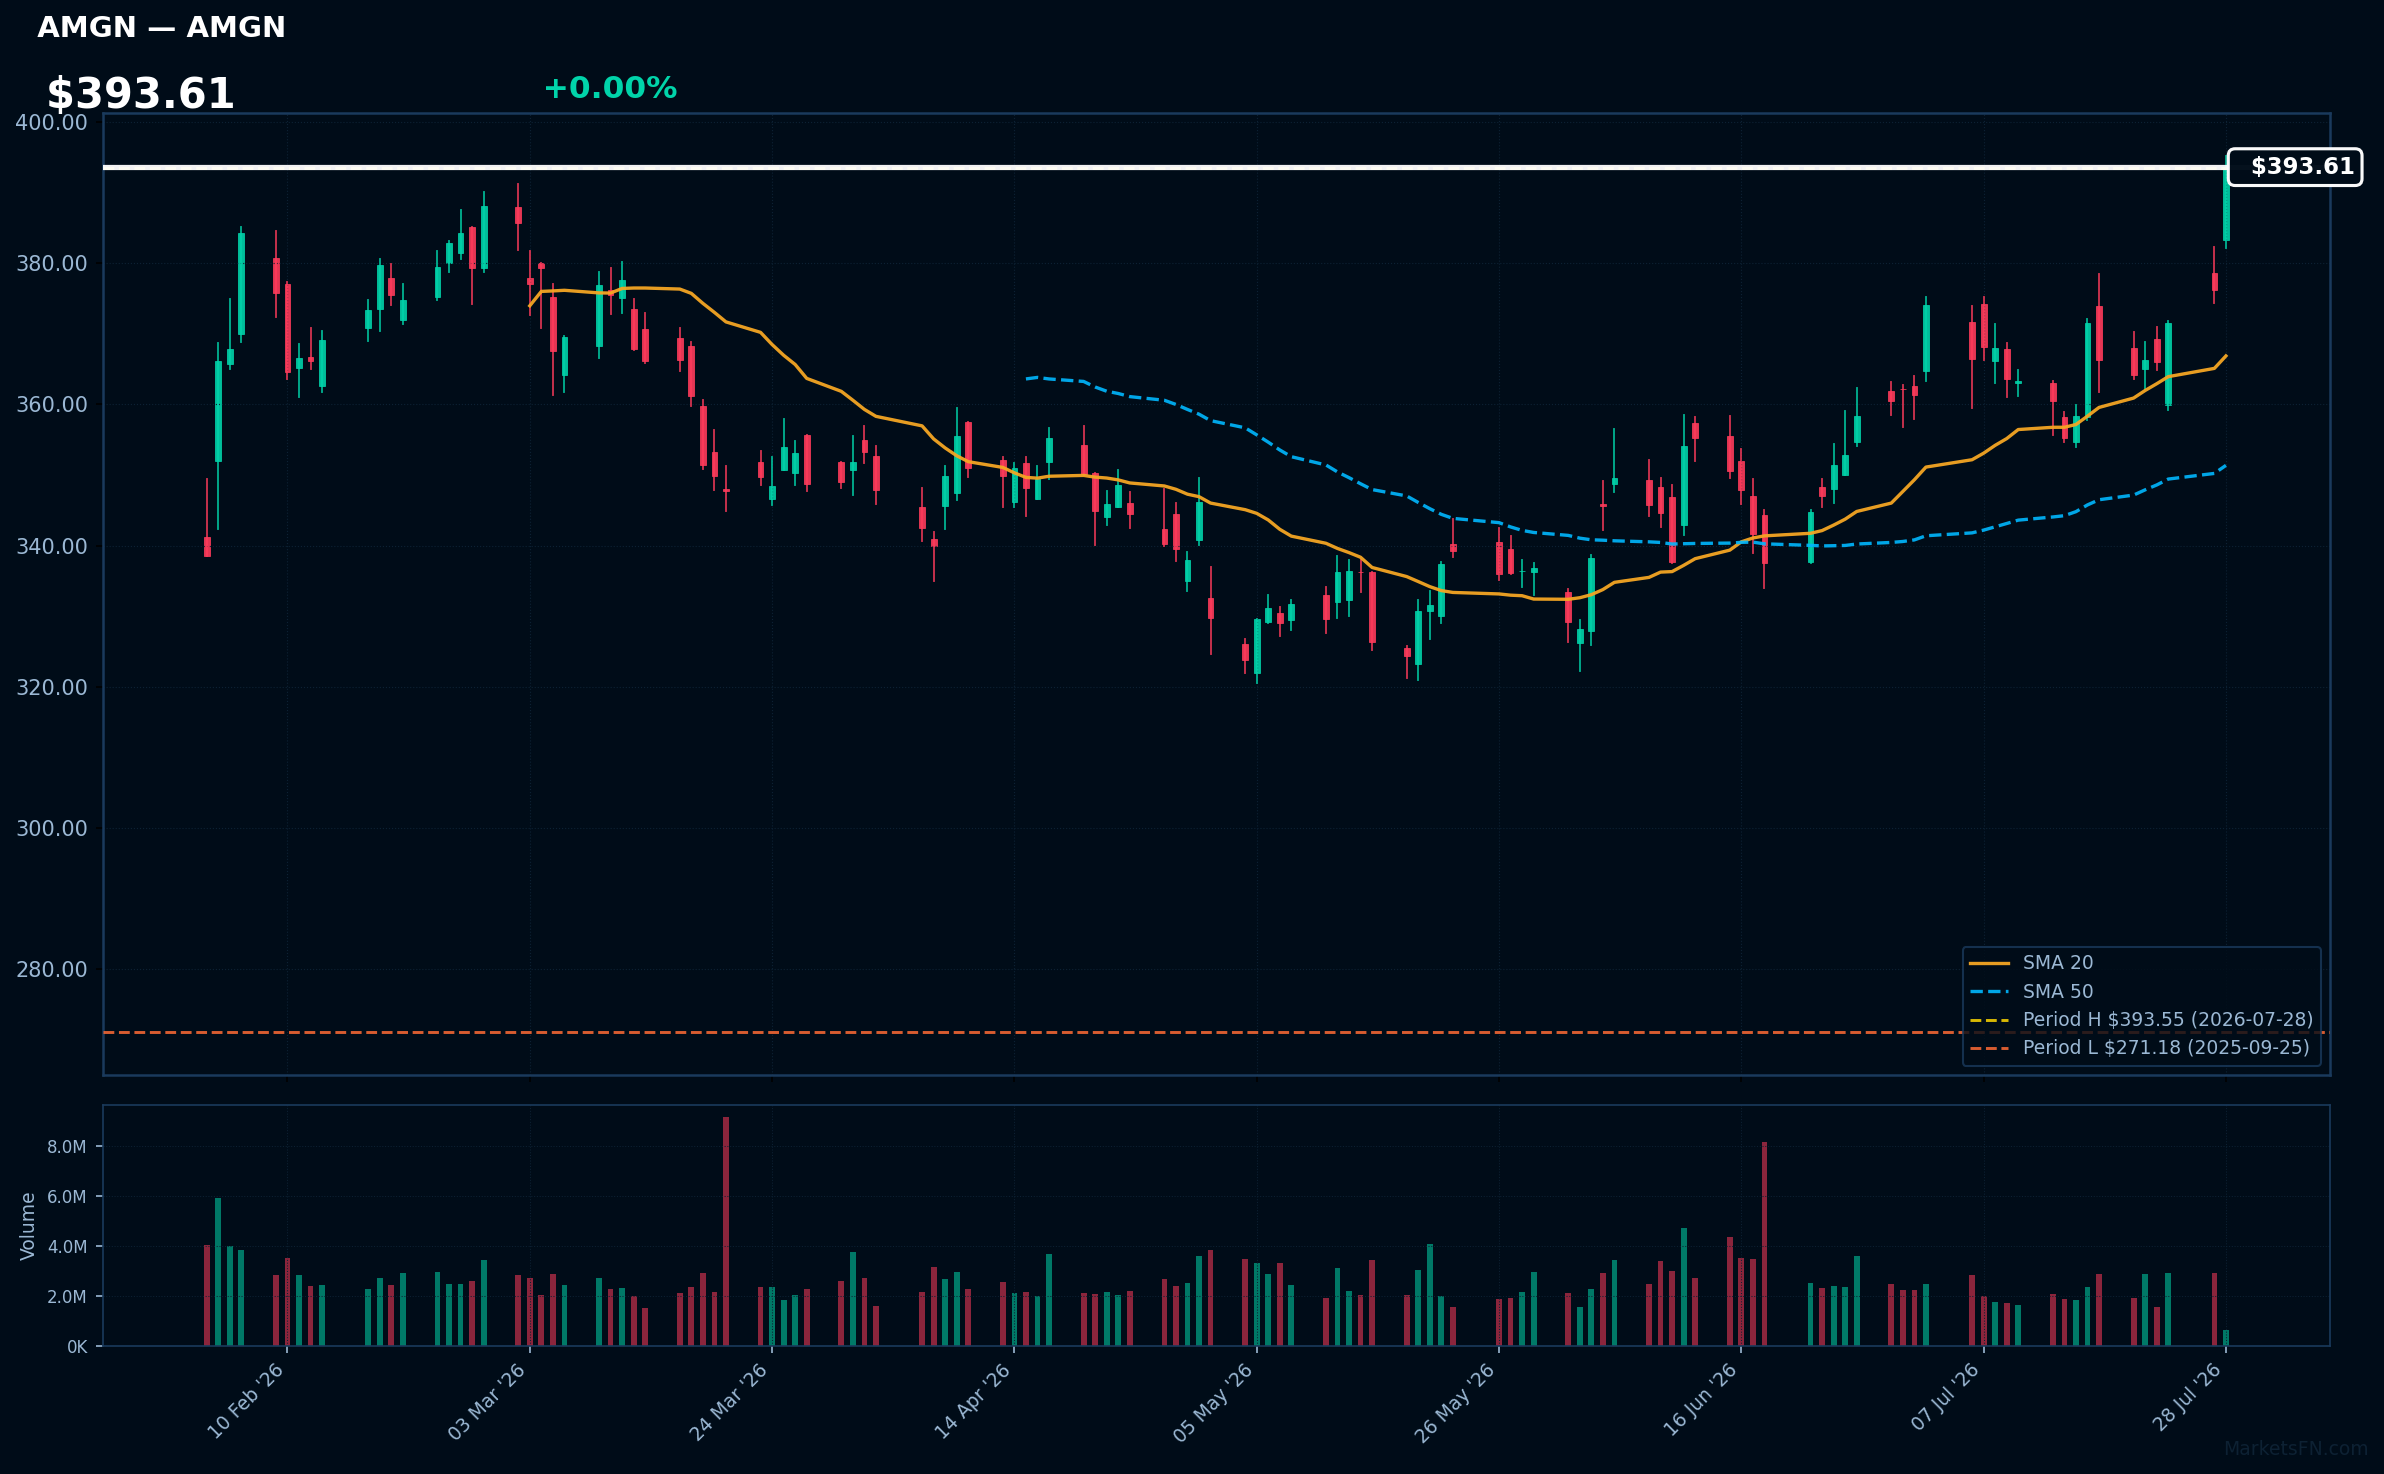
AMGN | AMGEN Inc | Healthcare | Price Last: $393.55 | % Realized: +30.62% | RSI: 73.0 | % above MA200: +15.1% | Trend: Above MA20, MA50, MA200
AMGEN Inc is a biotechnology company that develops and markets human therapeutics, focusing on innovative treatments for serious illnesses such as cancer, cardiovascular disease, and bone health conditions, making it an attractive investment for those seeking exposure to the biotech sector.
AMGN's current technical situation indicates strong momentum, with an RSI(14) of 73.0 and a bullish MA alignment (price > MA20 > MA50 > MA200), suggesting a sustained uptrend; it's near a potential breakout level, 0.0% below its 52-Week high.
Related headlines
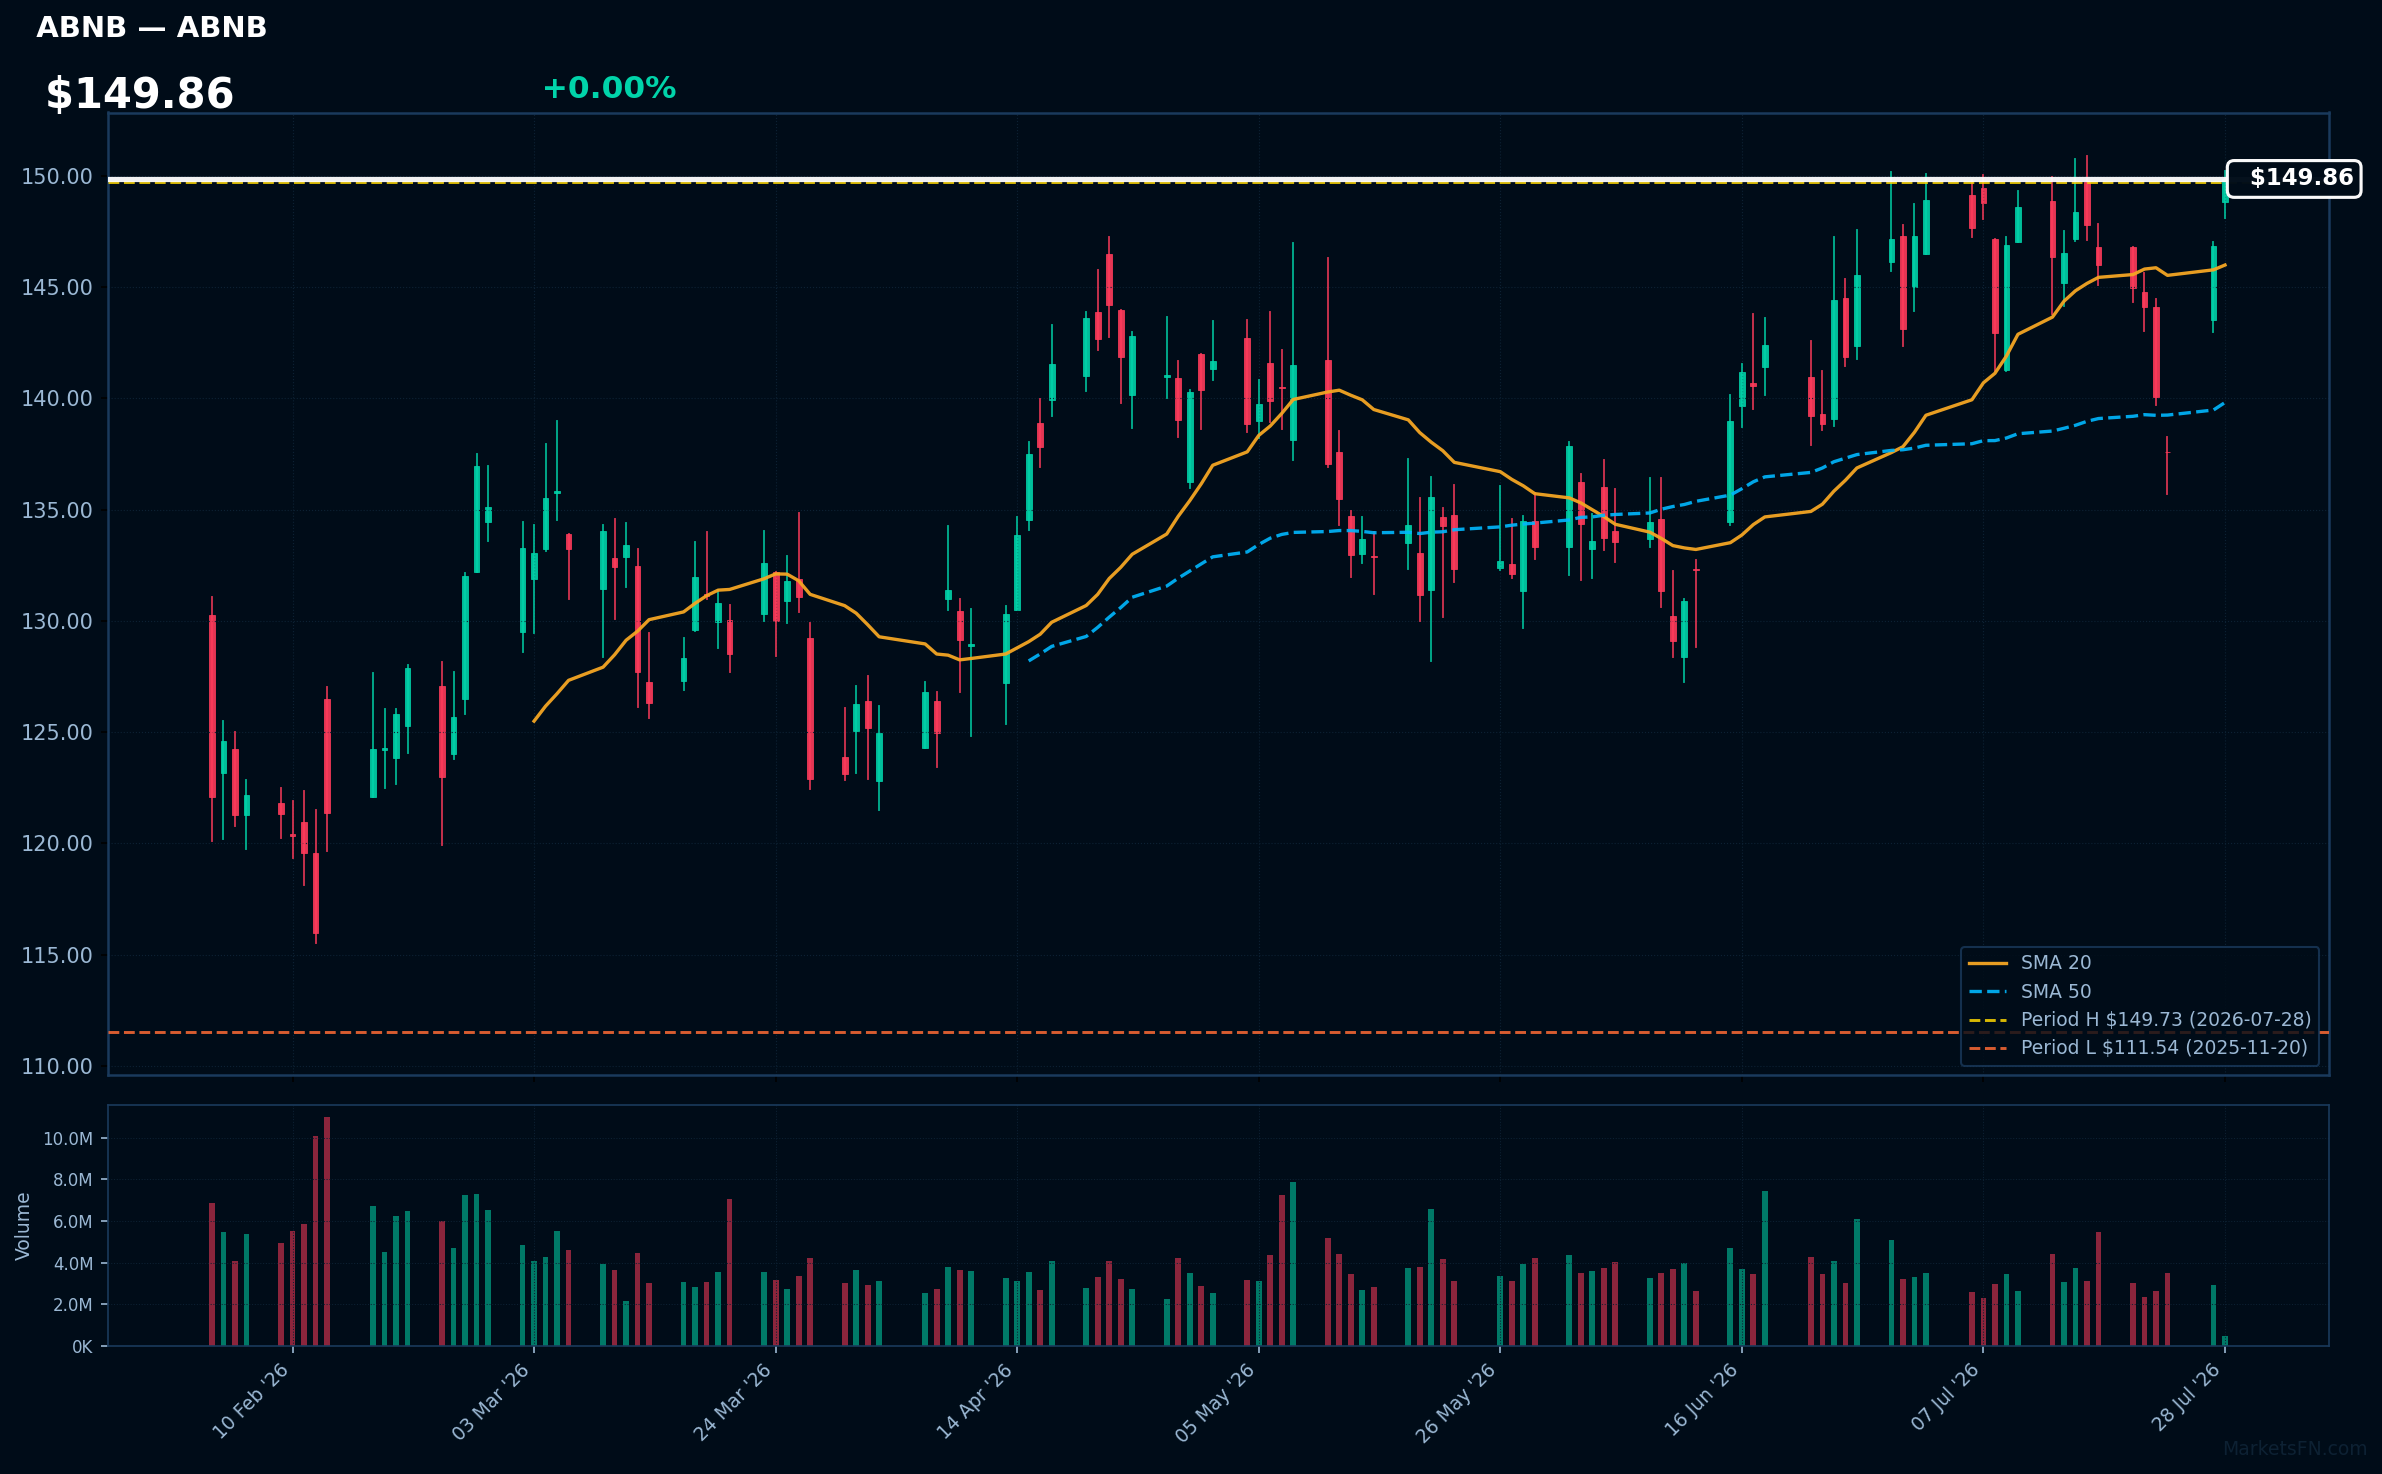
ABNB | Airbnb Inc | Consumer Cyclical | Price Last: $149.73 | % Realized: +5.32% | RSI: 58.5 | % above MA200: +13.5% | Trend: Above MA20, MA50, MA200
Airbnb Inc operates a platform connecting travelers with local hosts offering unique accommodations, experiences, and services, capitalizing on the shift towards experiential travel and alternative lodging, presenting a growth opportunity in the hospitality industry.
Airbnb's technicals indicate sustained uptrend with price > MA20 > MA50 > MA200, RSI(14) at 58.5, near 52-Week high, suggesting momentum; the stock is 0.0% below its 52-Week high, indicating a potential breakout level.
Related headlines
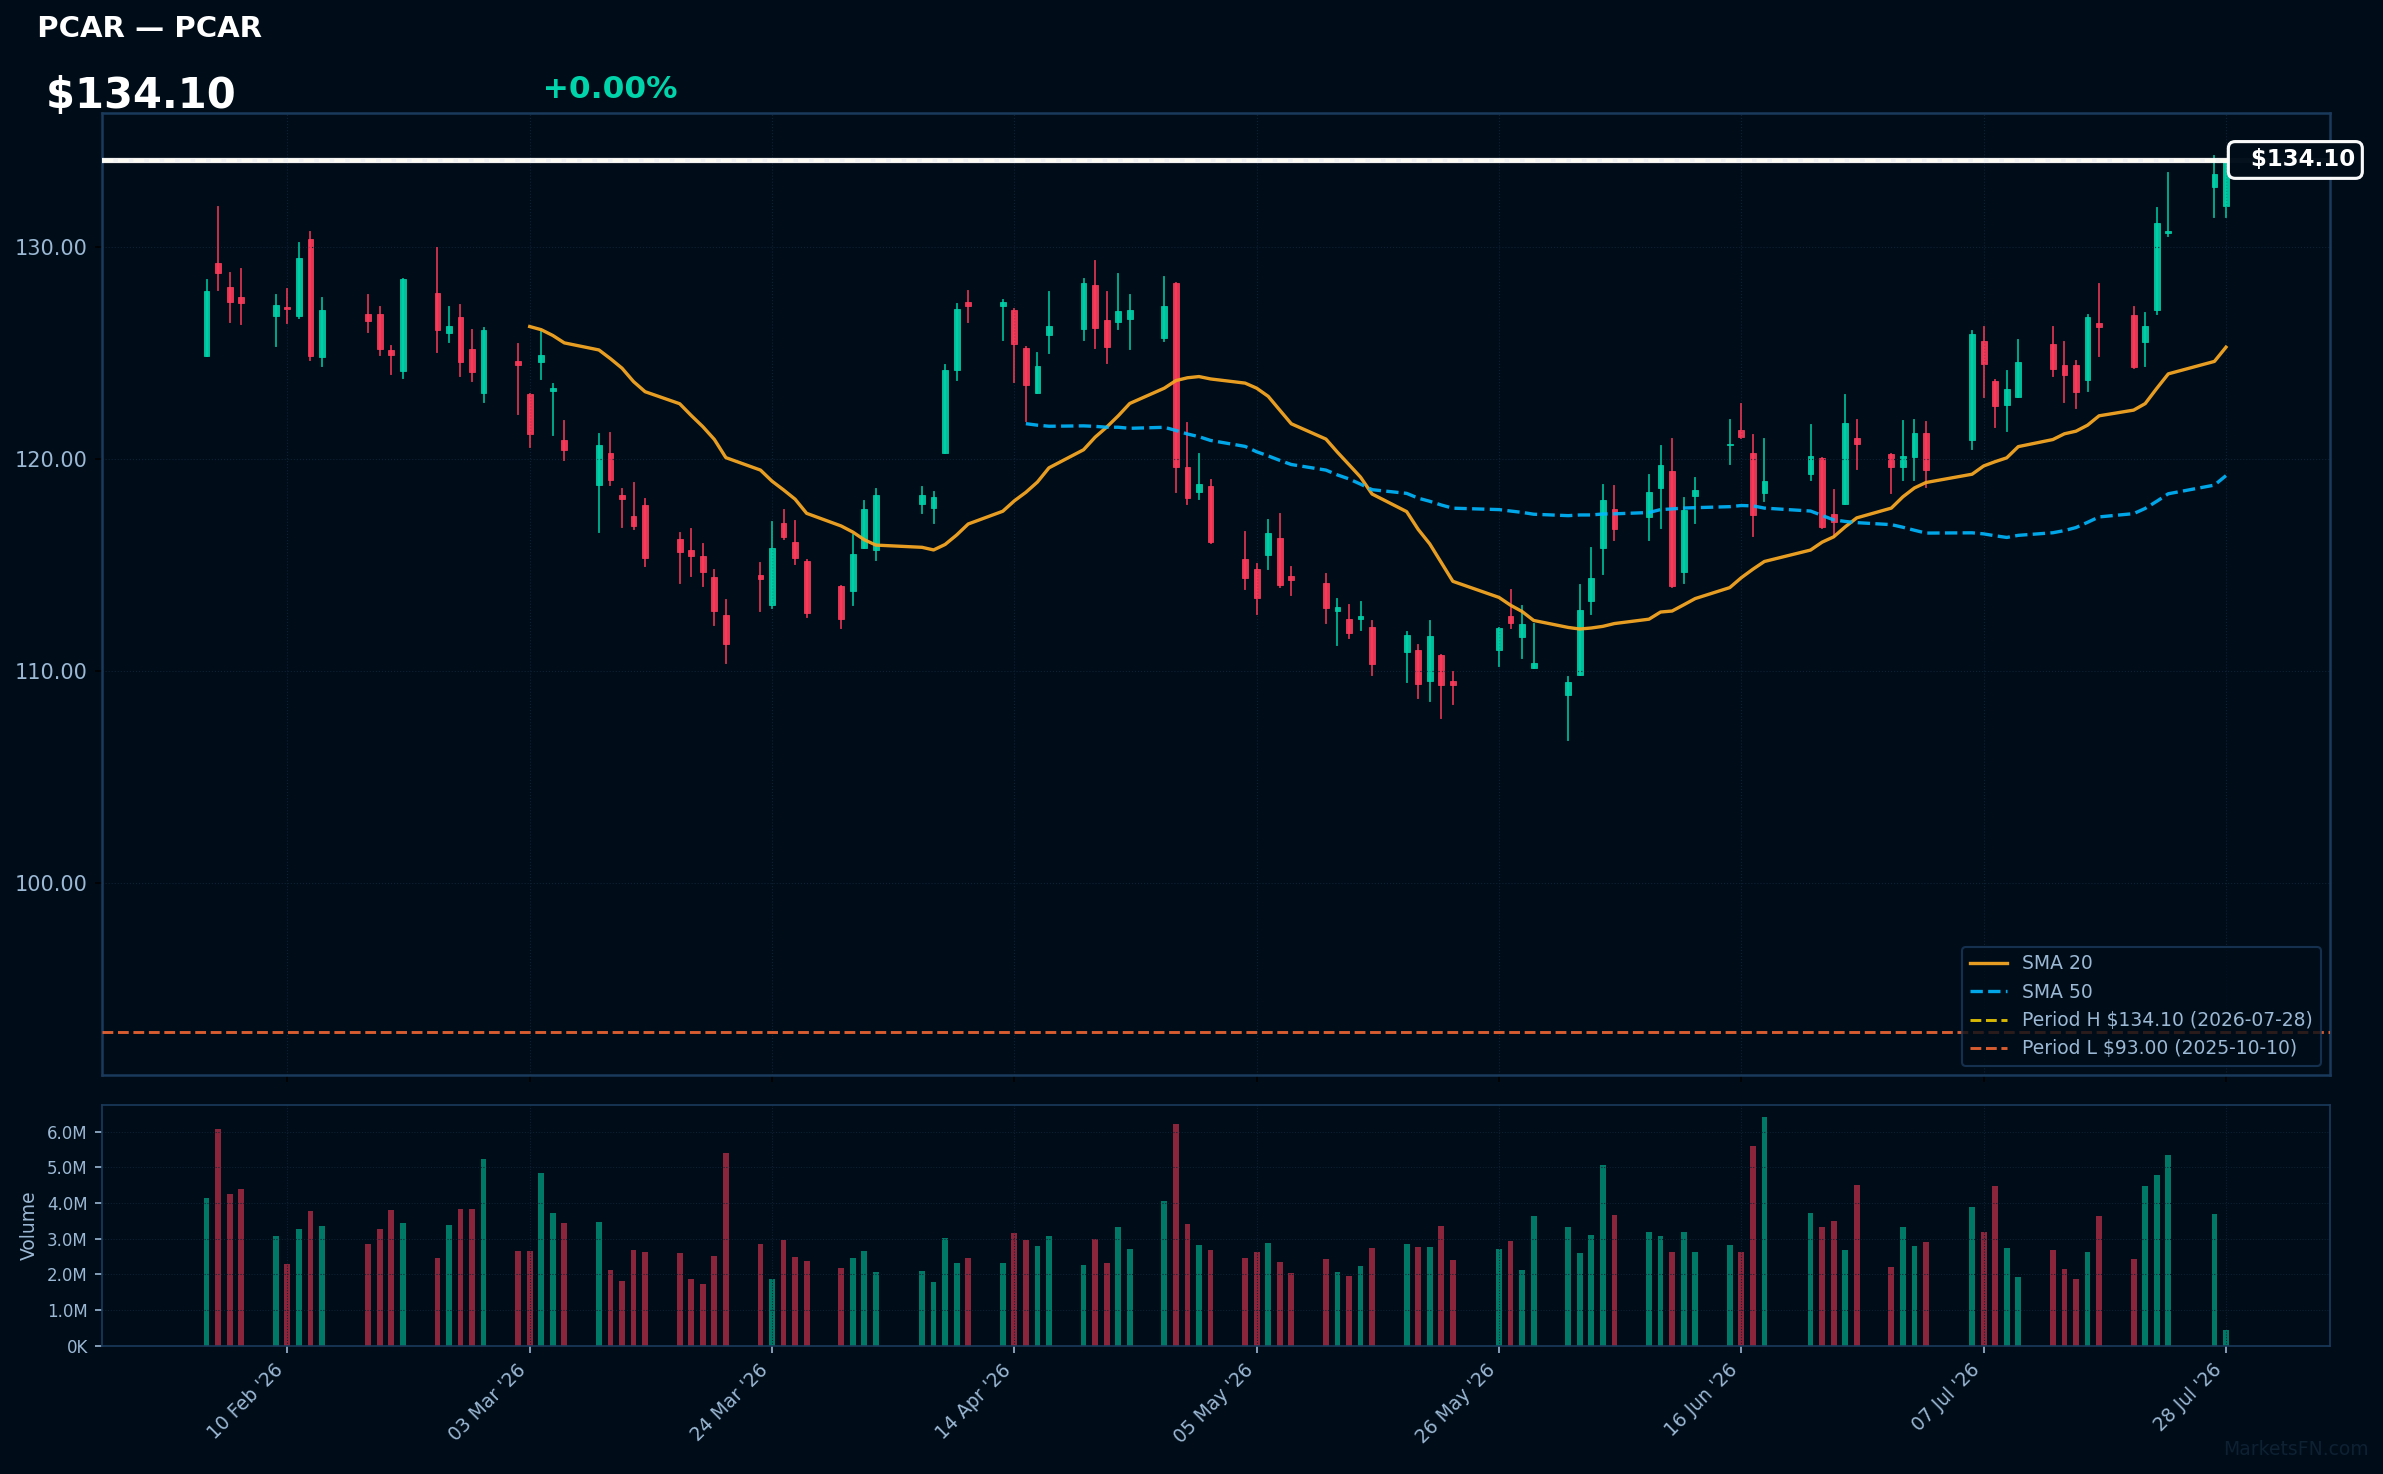
PCAR | Paccar Inc | Industrials | Price Last: $134.10 | % Realized: +33.24% | RSI: 70.1 | % above MA200: +16.5% | Trend: Above MA20, MA50, MA200
Paccar Inc designs and manufactures light-, medium-, and heavy-duty trucks under brands like Kenworth and Peterbilt. Investors should care because the company's truck sales are sensitive to economic cycles, making its performance a barometer for the overall health of the transportation sector.
Paccar Inc's RSI is 70.1, indicating strong momentum. The stock is in a sustained uptrend with price > MA20 > MA50 > MA200, and is 0.0% below its 52-Week high, suggesting a potential breakout level is near, supported by a 33.2% 52-Week return.
Related headlines
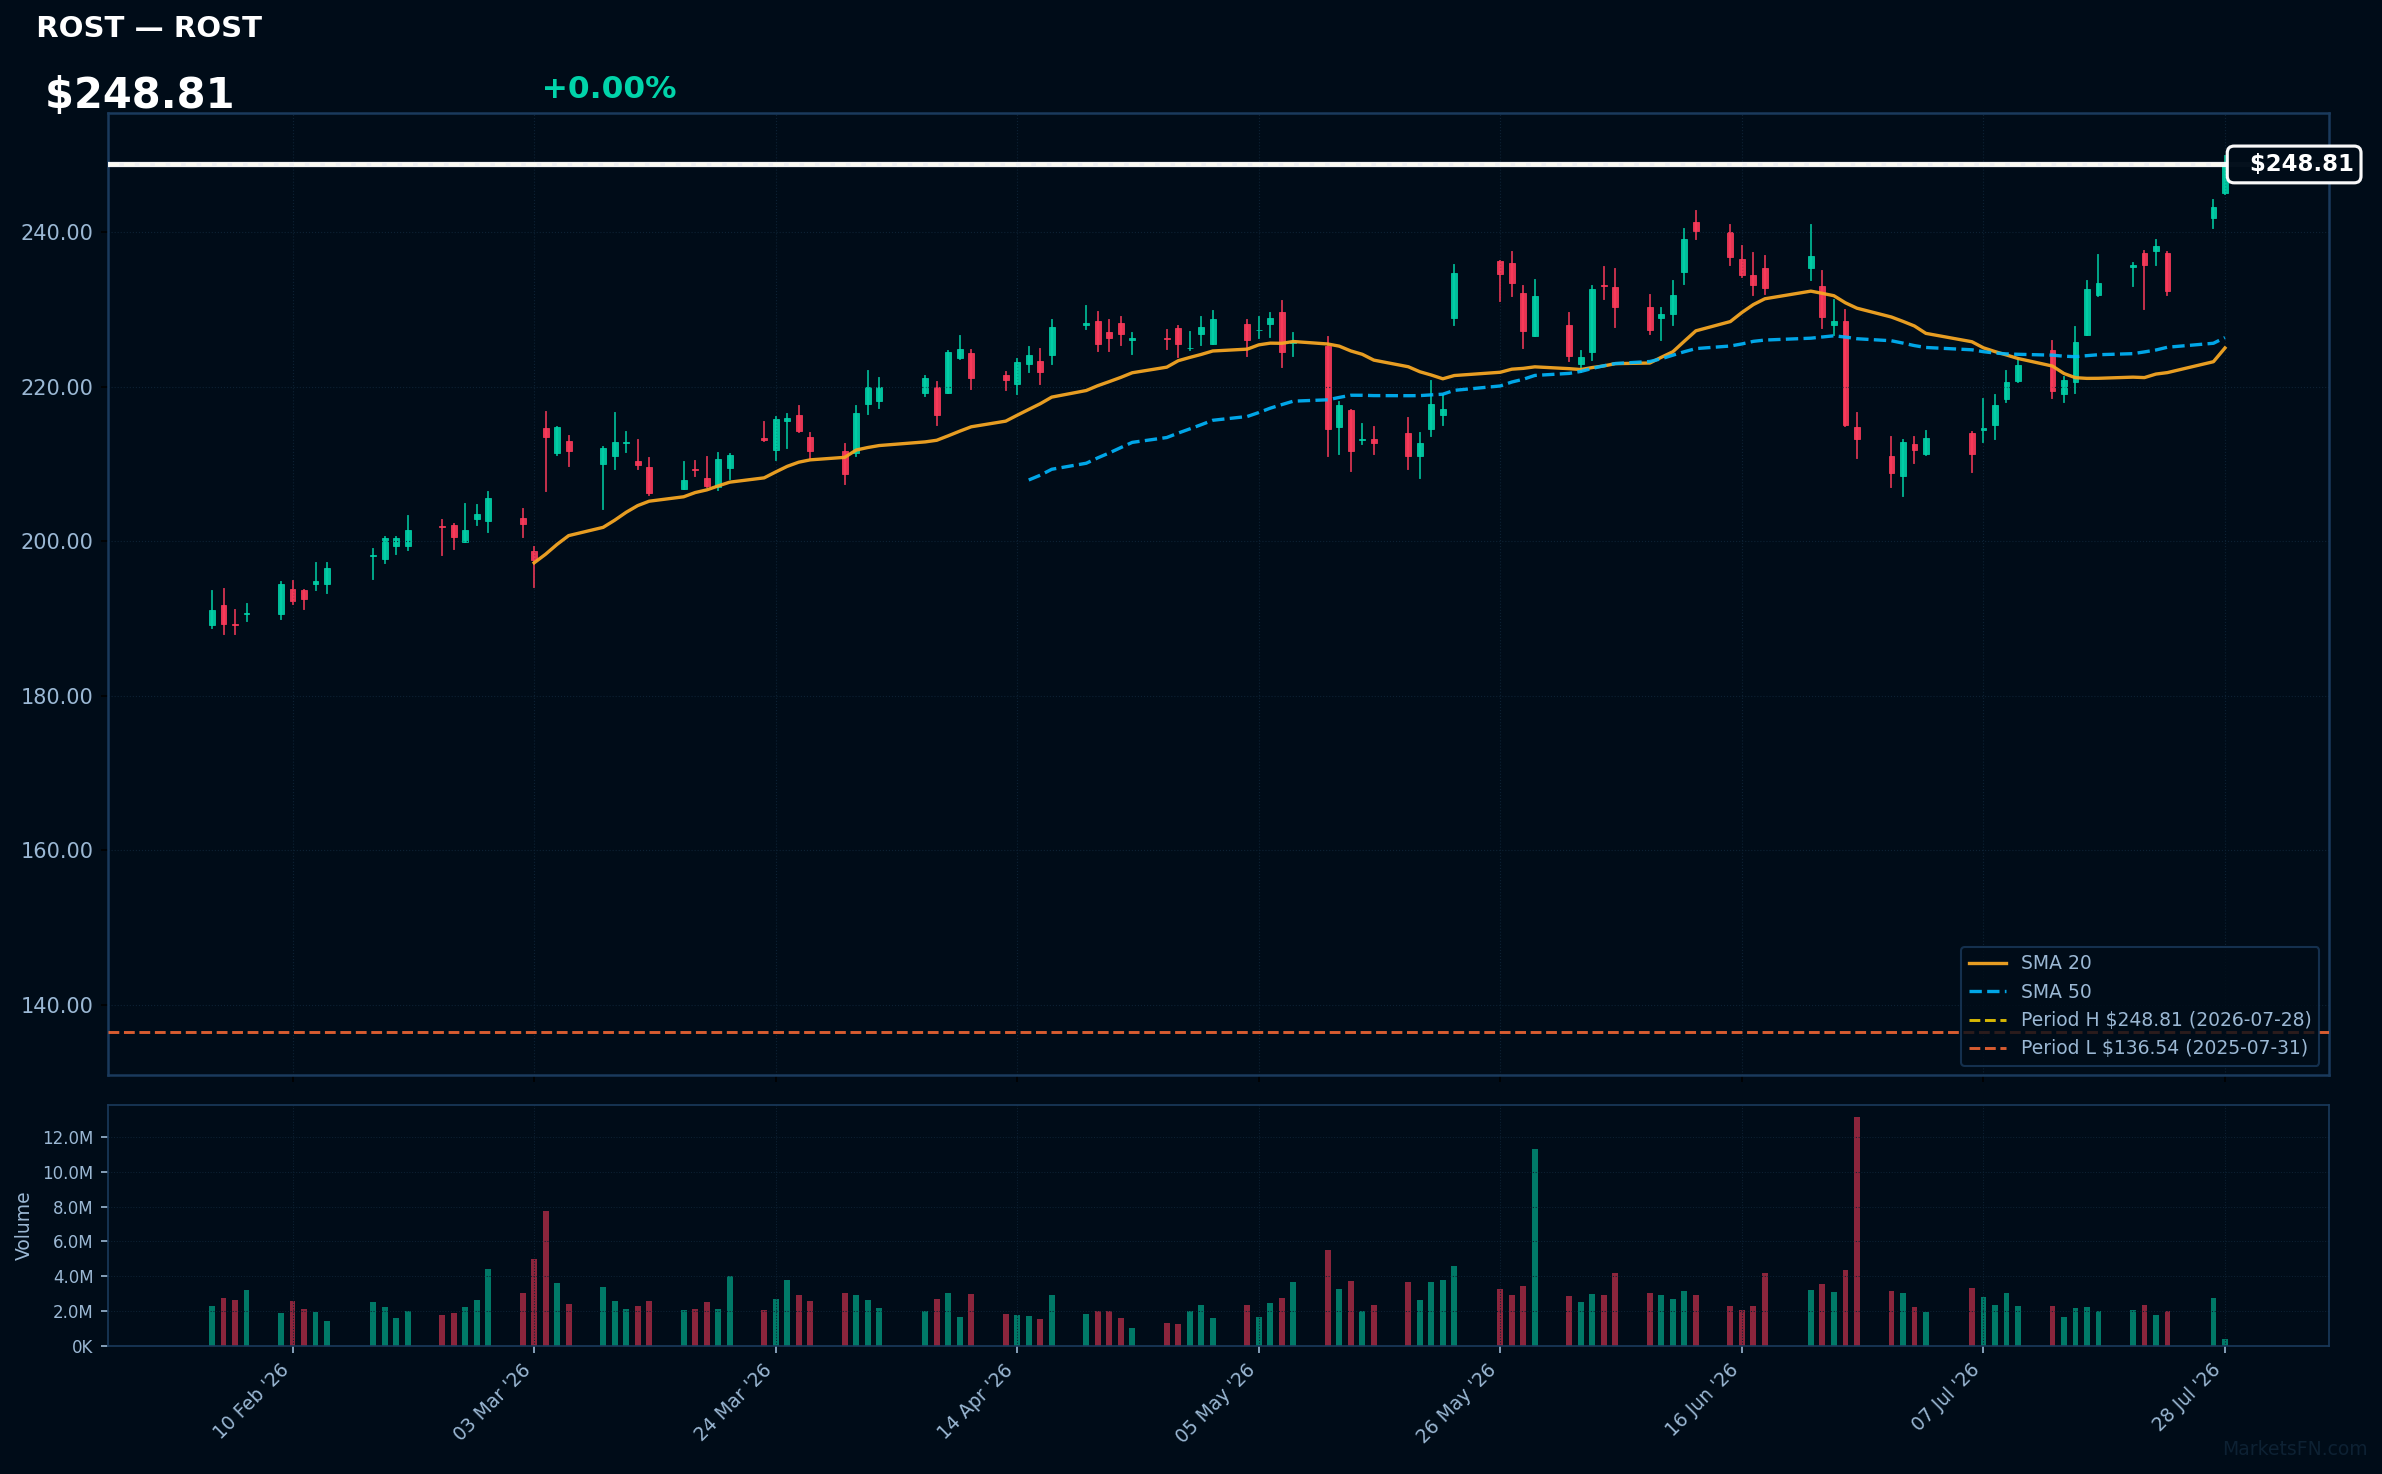
ROST | Ross Stores, Inc | Consumer Cyclical | Price Last: $248.81 | % Realized: +76.69% | RSI: 69.5 | % above MA200: +24.1% | Trend: Above MA20, MA50, MA200
Ross Stores, Inc operates an off-price retail business, offering discounted branded apparel, home furnishings, and accessories. Investors should care about its ability to source and sell products at attractive prices, driving sales growth and margin expansion.
Ross Stores shows strong technical momentum with RSI(14) at 69.5, price above MA20, MA50, and MA200, and a 52-Week return of 76.7%. The stock is 0.0% below its 52-Week high, indicating potential breakout level.
Related headlines
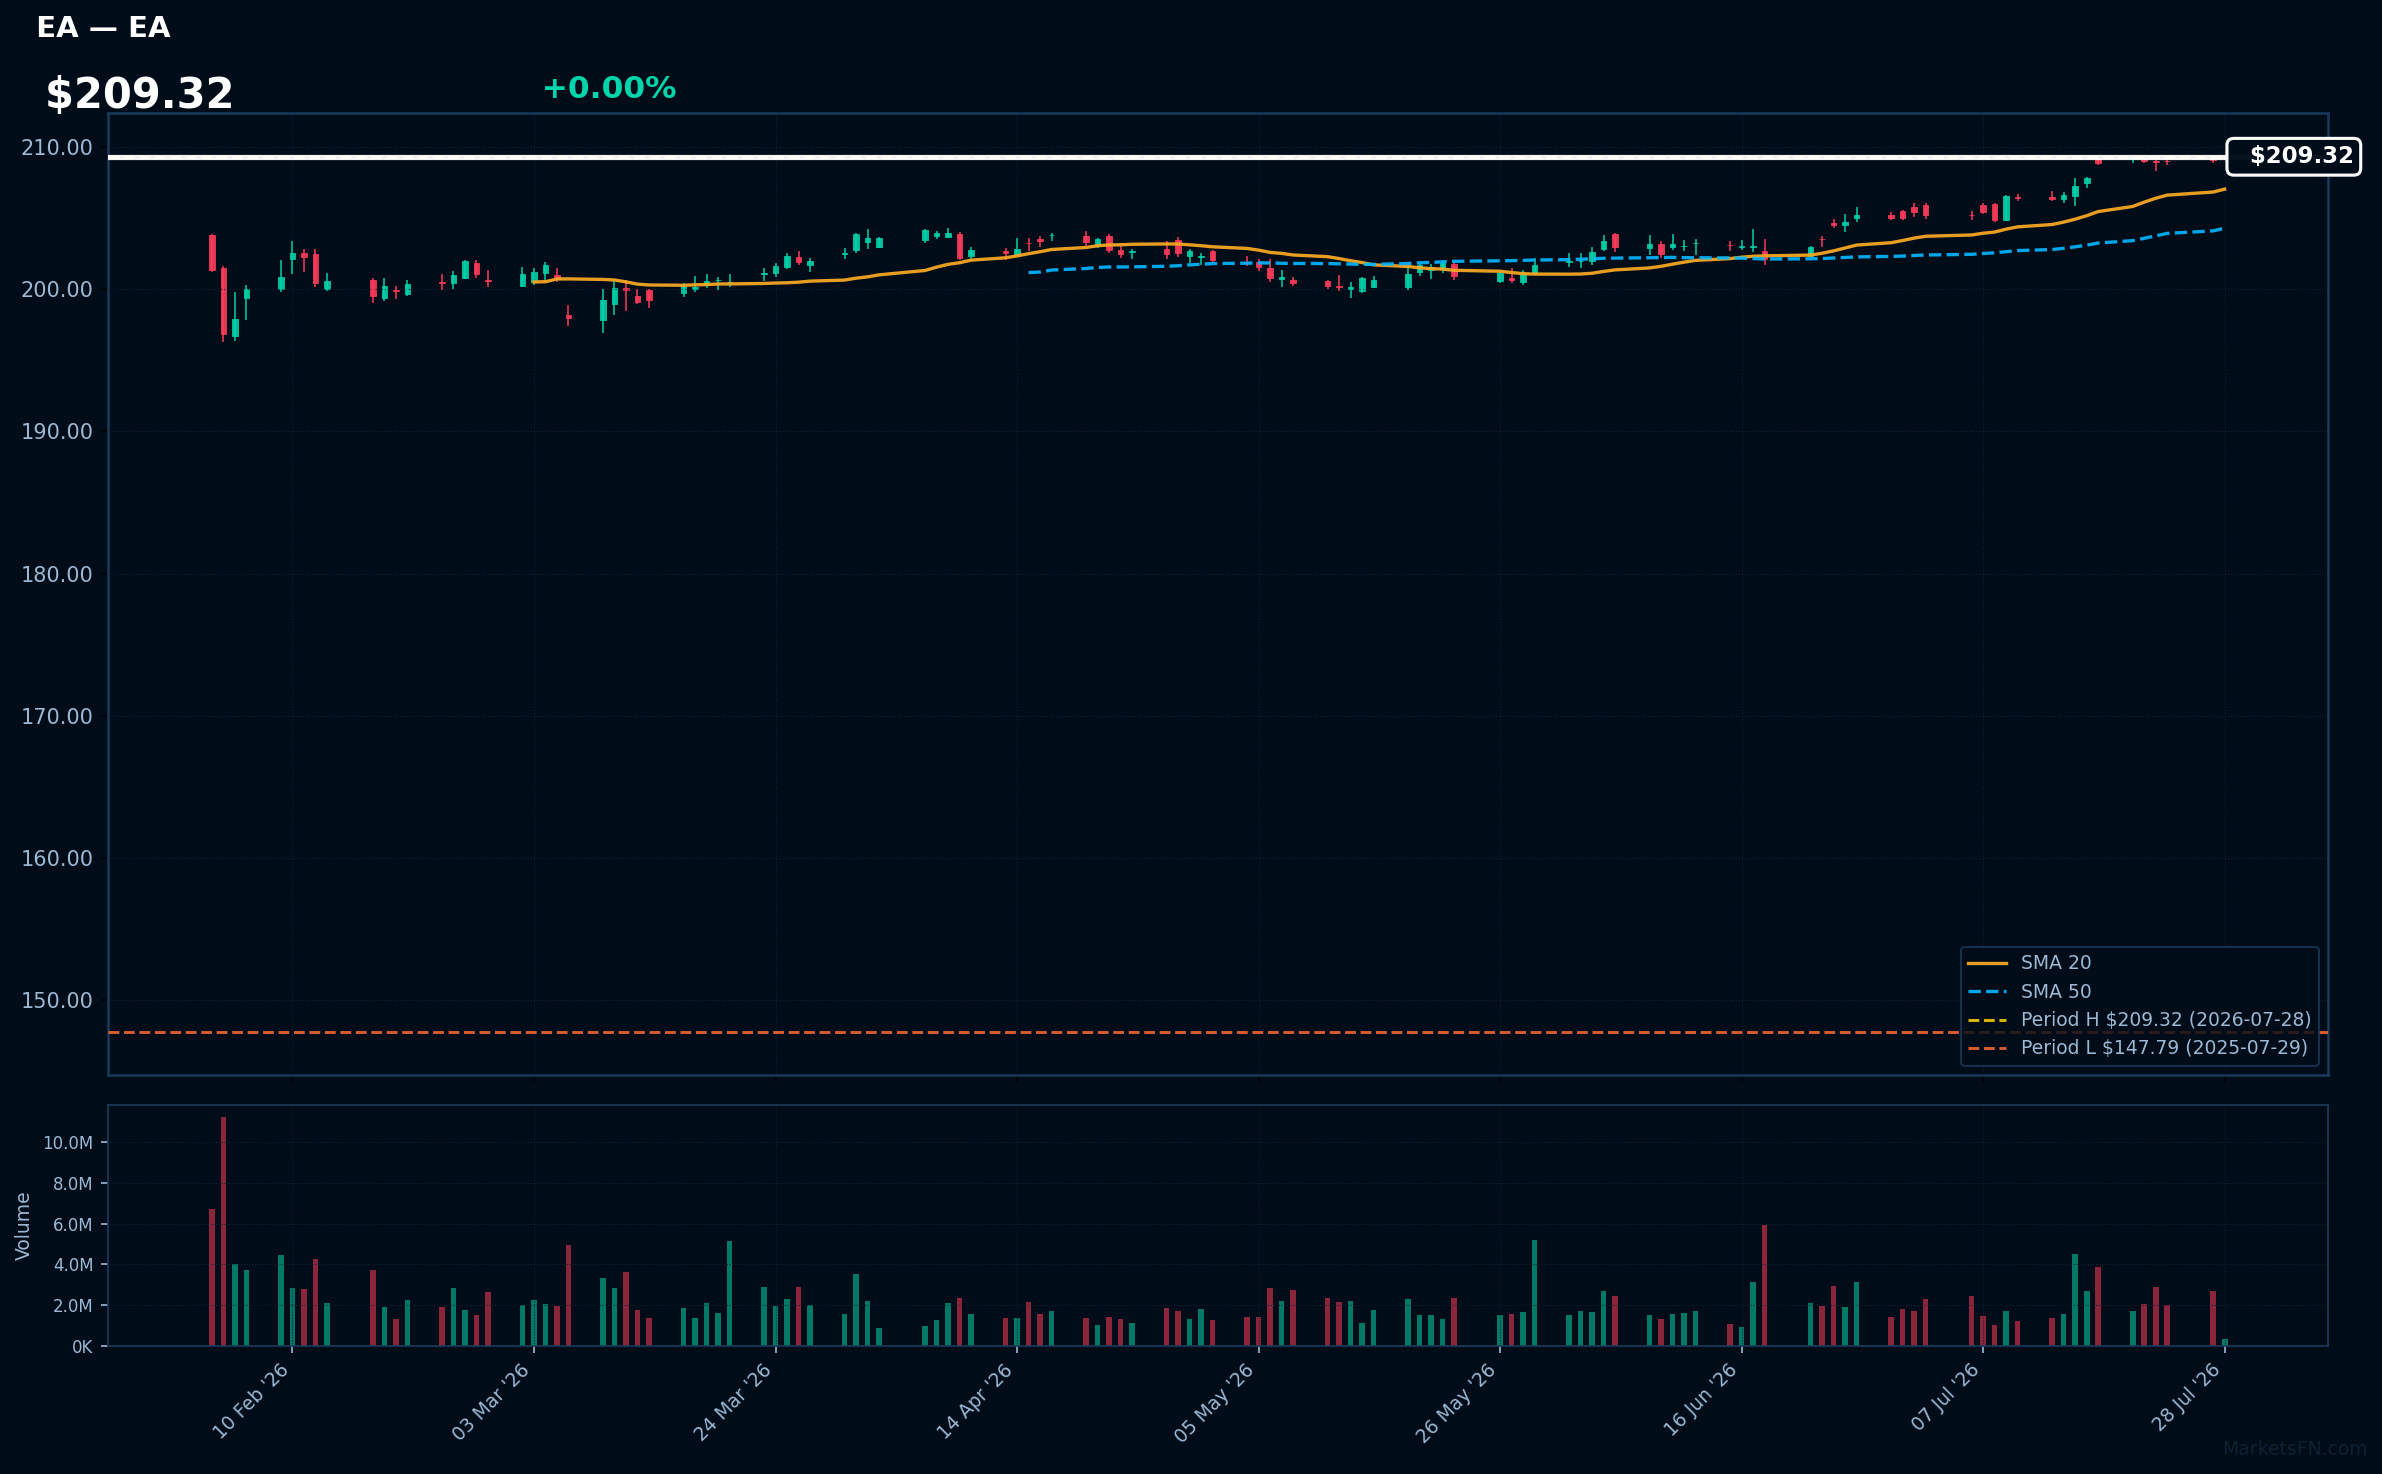
EA | Electronic Arts, Inc | Communication Services | Price Last: $209.32 | % Realized: +37.72% | RSI: 78.3 | % above MA200: +3.3% | Trend: Above MA20, MA50, MA200
Electronic Arts, Inc (EA) is a leading interactive entertainment software company that develops and publishes games such as Madden NFL, FIFA, and The Sims. Investors should care about its ability to innovate and capture gaming market share.
EA's current technical situation indicates strong momentum: RSI(14) is 78.3, and the stock is in a sustained uptrend with price > MA20 > MA50 > MA200. It's 0.0% below its 52-Week high, near a potential breakout.
Related headlines
- EU clears PIF acquisition of sole control of EA in $55bn deal
- Kylian Mbappe and Jude Bellingham Welcome You to EA SPORTS FC 27, Launching Worldwide on September 25
- Kylian Mbapp and Jude Bellingham Welcome You to EA SPORTS FC 27, Launching Worldwide on September 25
- Saudi PIF's $55 billion EA deal approved under EU merger rules
📉 Nearest to 52-Week Low
Sectors represented: Consumer Cyclical (1), Technology (1), Healthcare (1), Consumer Defensive (1), Communication Services (1)
| Ticker | Company | Sector | Price Last | % Realized | 52-Week Low Date | RSI | % above MA200 | Trend |
|---|---|---|---|---|---|---|---|---|
| TSLA | Tesla Inc | Consumer Cyclical | $303.43 | -6.80% | 2025-08-01 | 26.4 | -26.6% | Below MA20, MA50, MA200 |
| SNPS | Synopsys, Inc | Technology | $387.45 | -34.62% | 2026-07-24 | 35.0 | -14.0% | Below MA20, MA50, MA200 |
| GEHC | GE HealthCare Technologies Inc | Healthcare | $62.31 | -19.85% | 2026-04-29 | 46.7 | -14.8% | Below MA20, MA50, MA200 |
| PEP | PepsiCo Inc | Consumer Defensive | $144.32 | +1.94% | 2026-07-23 | 58.6 | -3.7% | Above MA20, MA50 · Below MA200 |
| CHTR | Charter Communications Inc | Communication Services | $134.78 | -54.81% | 2026-06-22 | 50.8 | -30.8% | Above MA20 · Below MA50, MA200 |
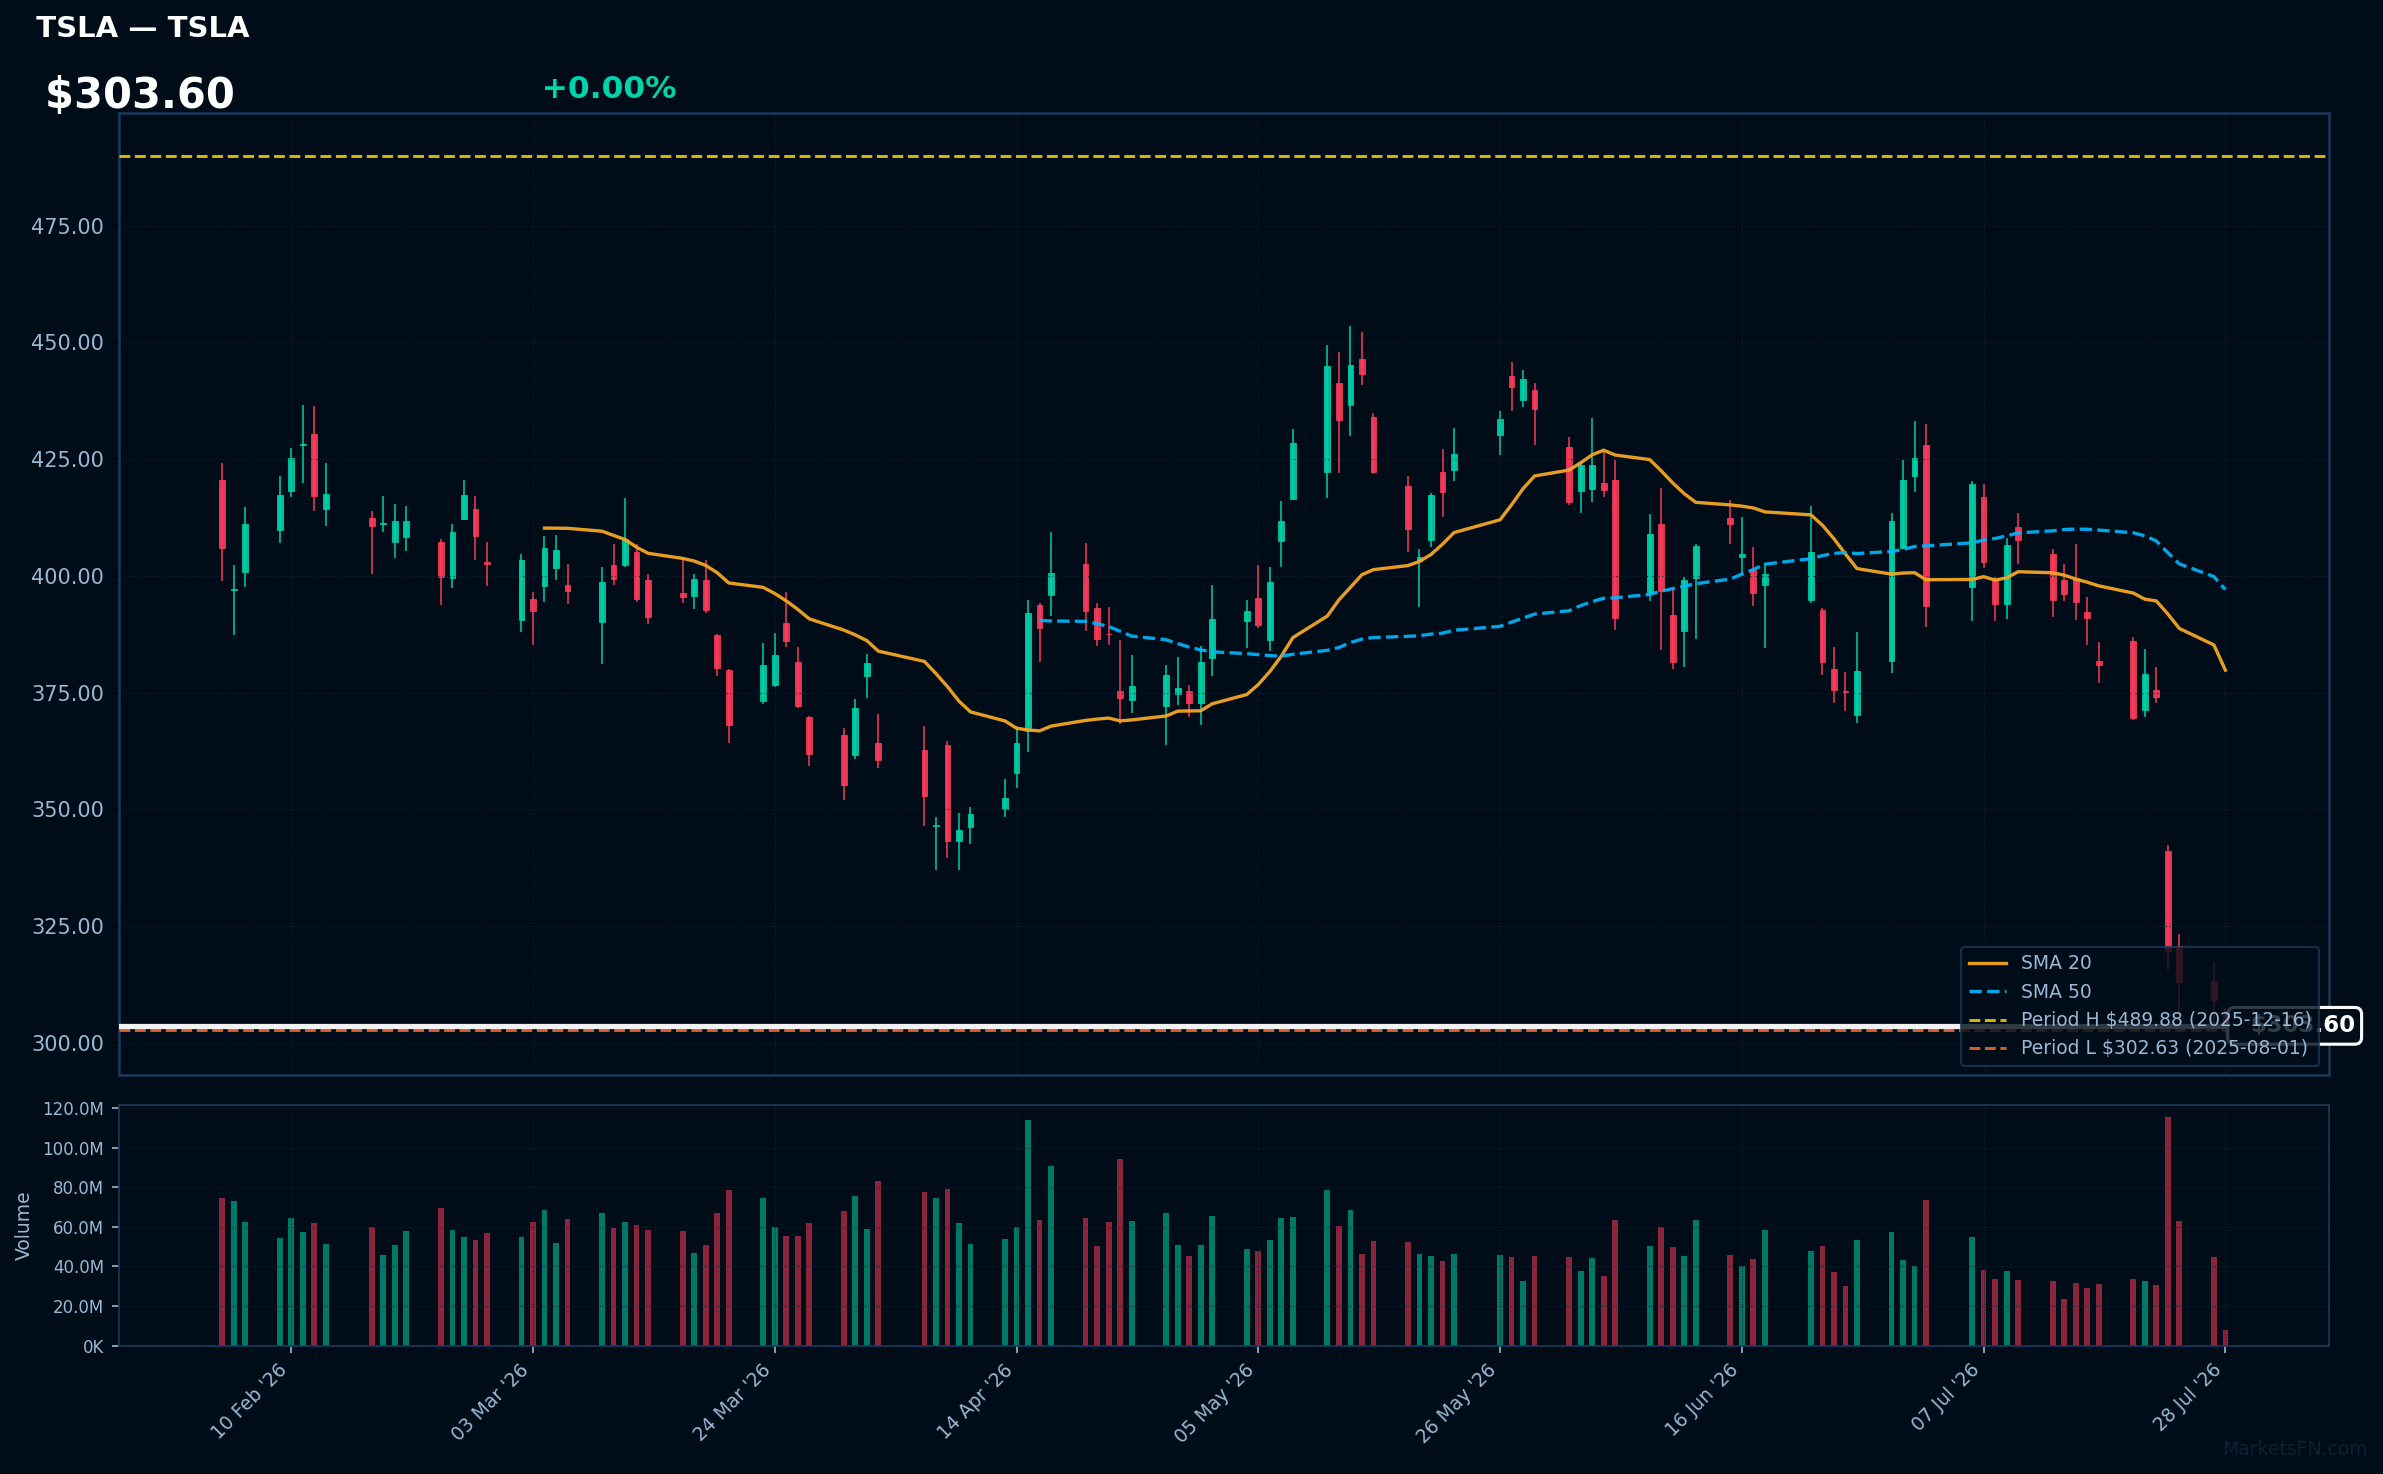
TSLA | Tesla Inc | Consumer Cyclical | Price Last: $303.43 | % Realized: -6.80% | RSI: 26.4 | % above MA200: -26.6% | Trend: Below MA20, MA50, MA200
Tesla Inc is an electric vehicle manufacturer and clean energy company. Investors care about its innovative products, market disruption potential, and leadership in the EV transition, impacting the automotive and energy sectors.
Tesla's technical situation indicates a sustained downtrend with price ($303.60) below MA20, MA50, and MA200. RSI(14) at 26.4 suggests oversold conditions, and being 0.3% above its 52-Week low tests major support, potentially a warning sign.
Related headlines
- Tesla to buy power from Arizona solar project
- SpaceX stock has shed $1.2 trillion in market cap roughly equal to all of Tesla
- Tesla to Buy Power From KKR-Backed Arizona Solar, Battery Plant
- Elon Musk calls himself former trillionaire as billions vanish amid Tesla, SpaceX crash. Why the rich laugh at losses
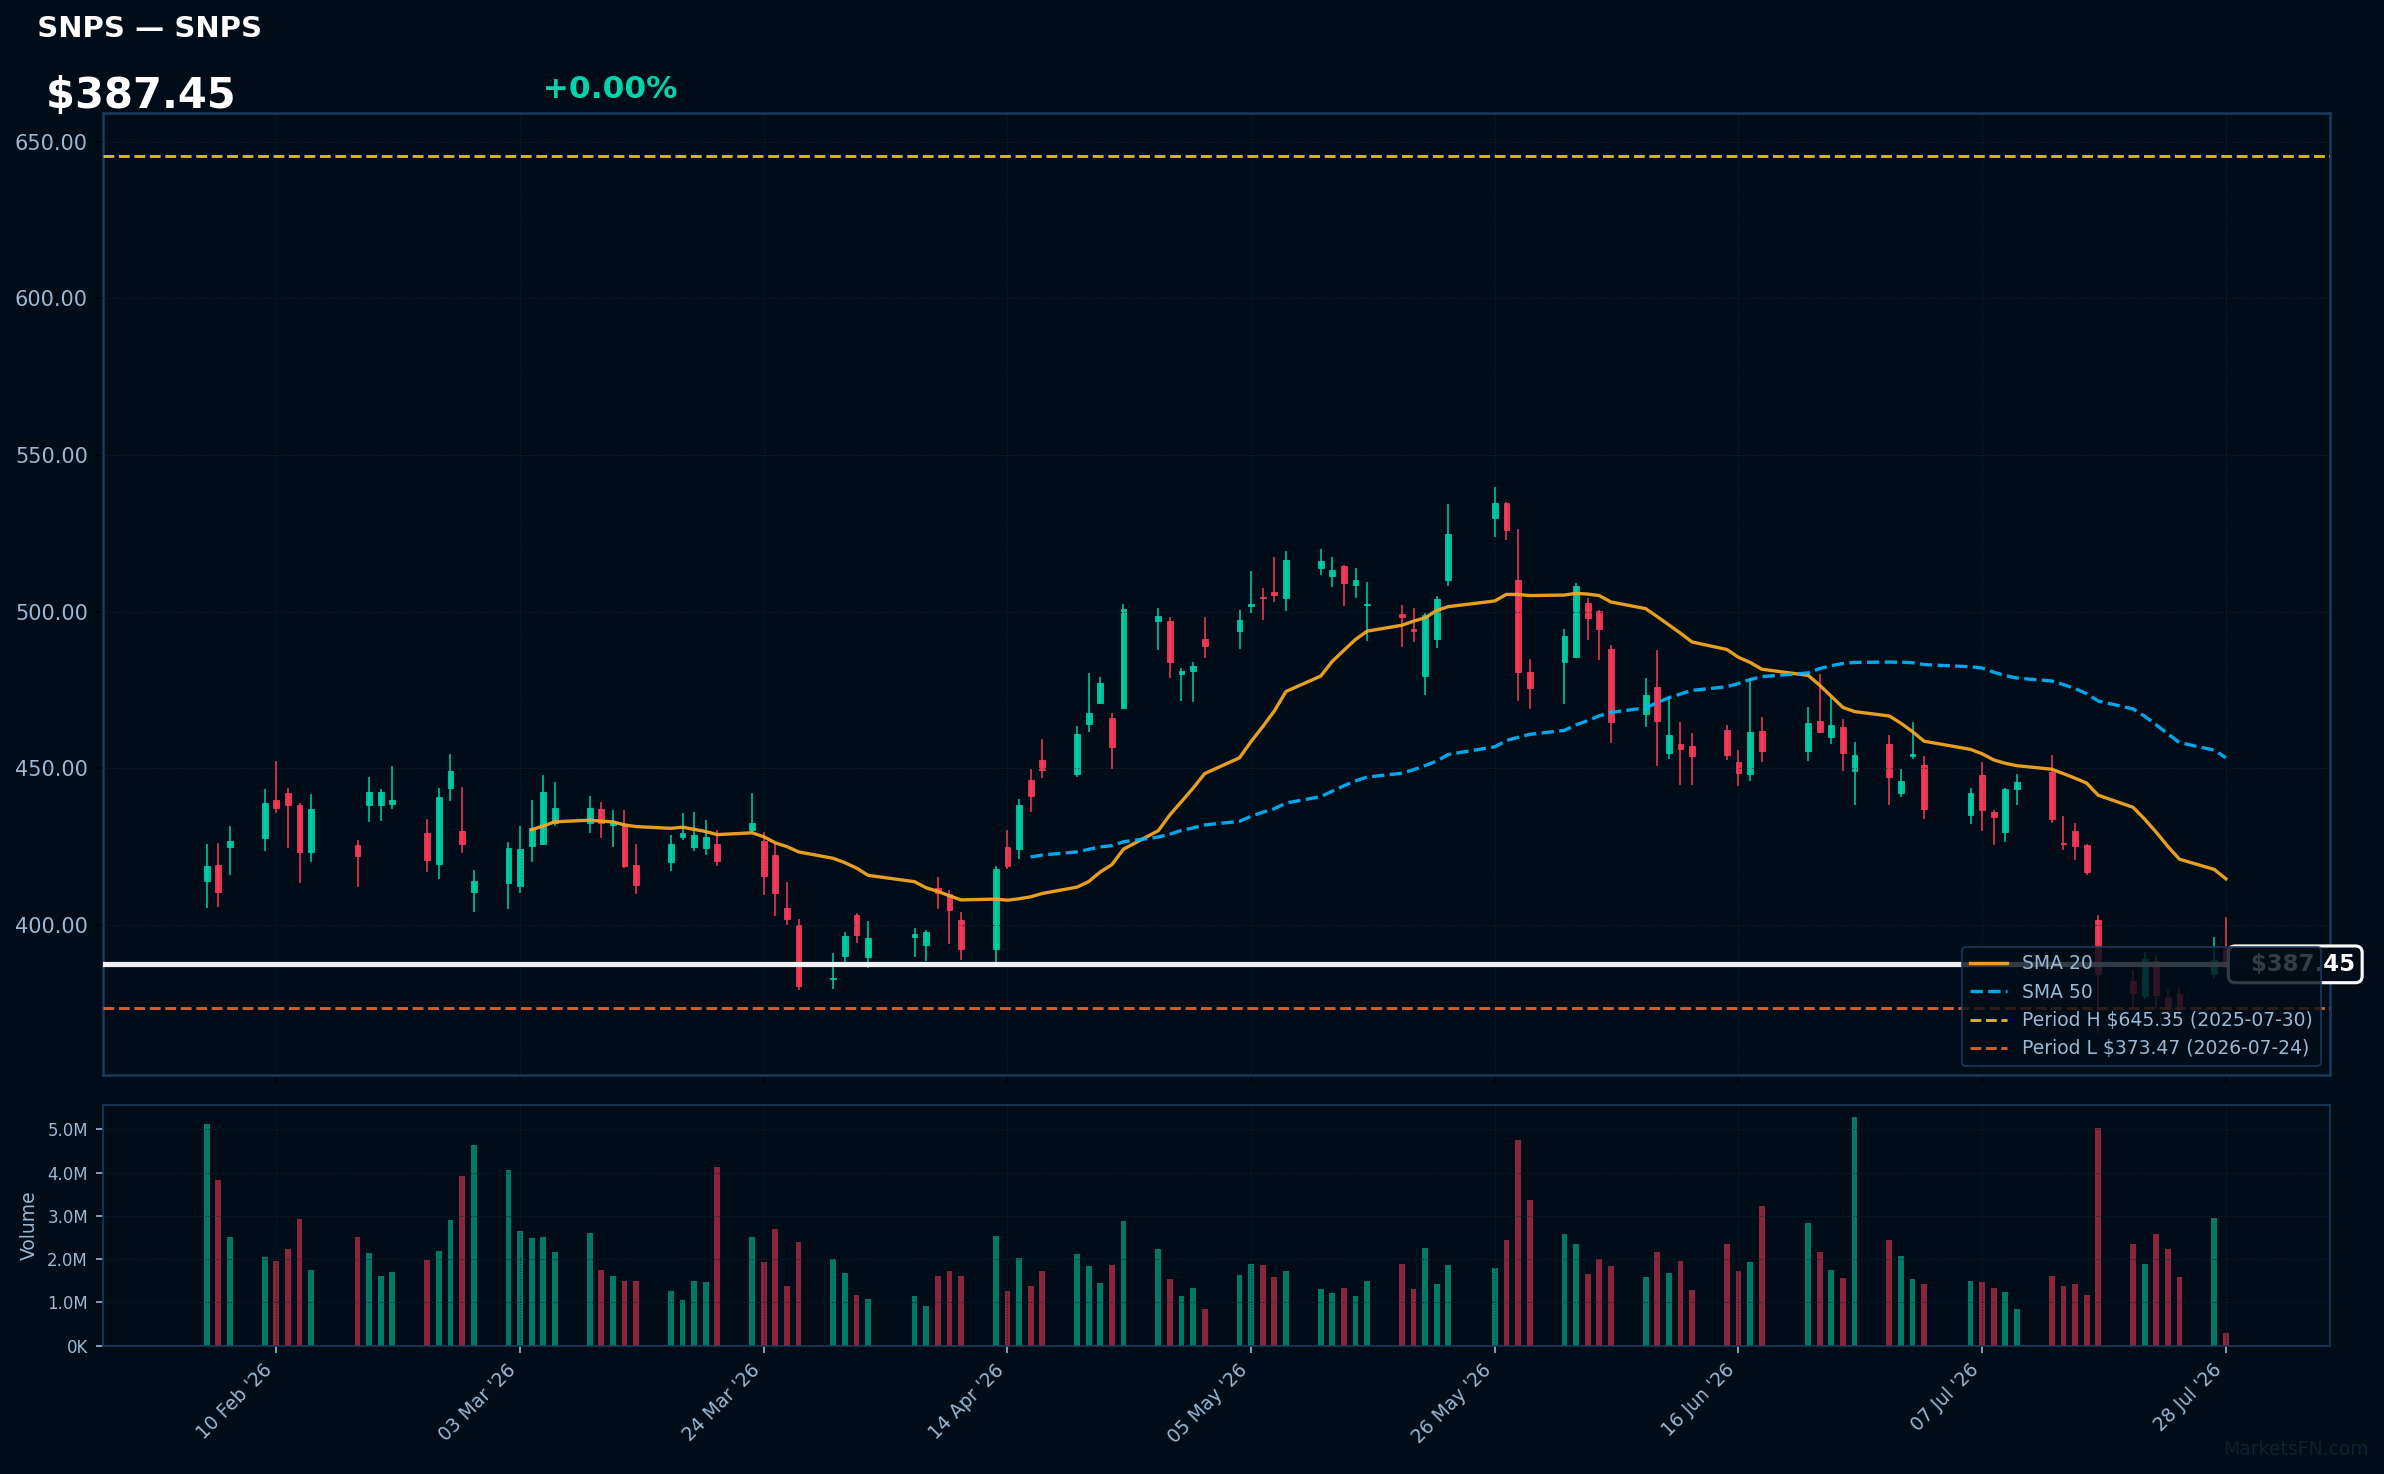
SNPS | Synopsys, Inc | Technology | Price Last: $387.45 | % Realized: -34.62% | RSI: 35.0 | % above MA200: -14.0% | Trend: Below MA20, MA50, MA200
Synopsys, Inc is a software company providing electronic design automation (EDA) tools and semiconductor IP, crucial for chip design and verification. Investors care due to its dominant position in the EDA market and exposure to semiconductor industry trends.
Synopsys' technical situation is bearish, with RSI(14) at 35.0, below MA20/MA50/MA200, and only 3.7% above its 52-Week low, indicating major support testing and potential further downside, as seen in its -34.6% 52-Week return.
Related headlines
- Synopsys unveils autonomous chip design workflows with Microsoft and AMD collaboration
- Synopsys and Intel Foundry Fast-Track Customer Readiness from Silicon to Systems on Intel 14A
- Synopsys Advances Agentic AI Chip Design with AMD and Microsoft
- Synopsys Showcases Comprehensive Autonomous Engineering Workflows from Silicon to Systems, Developed with NVIDIA Technology
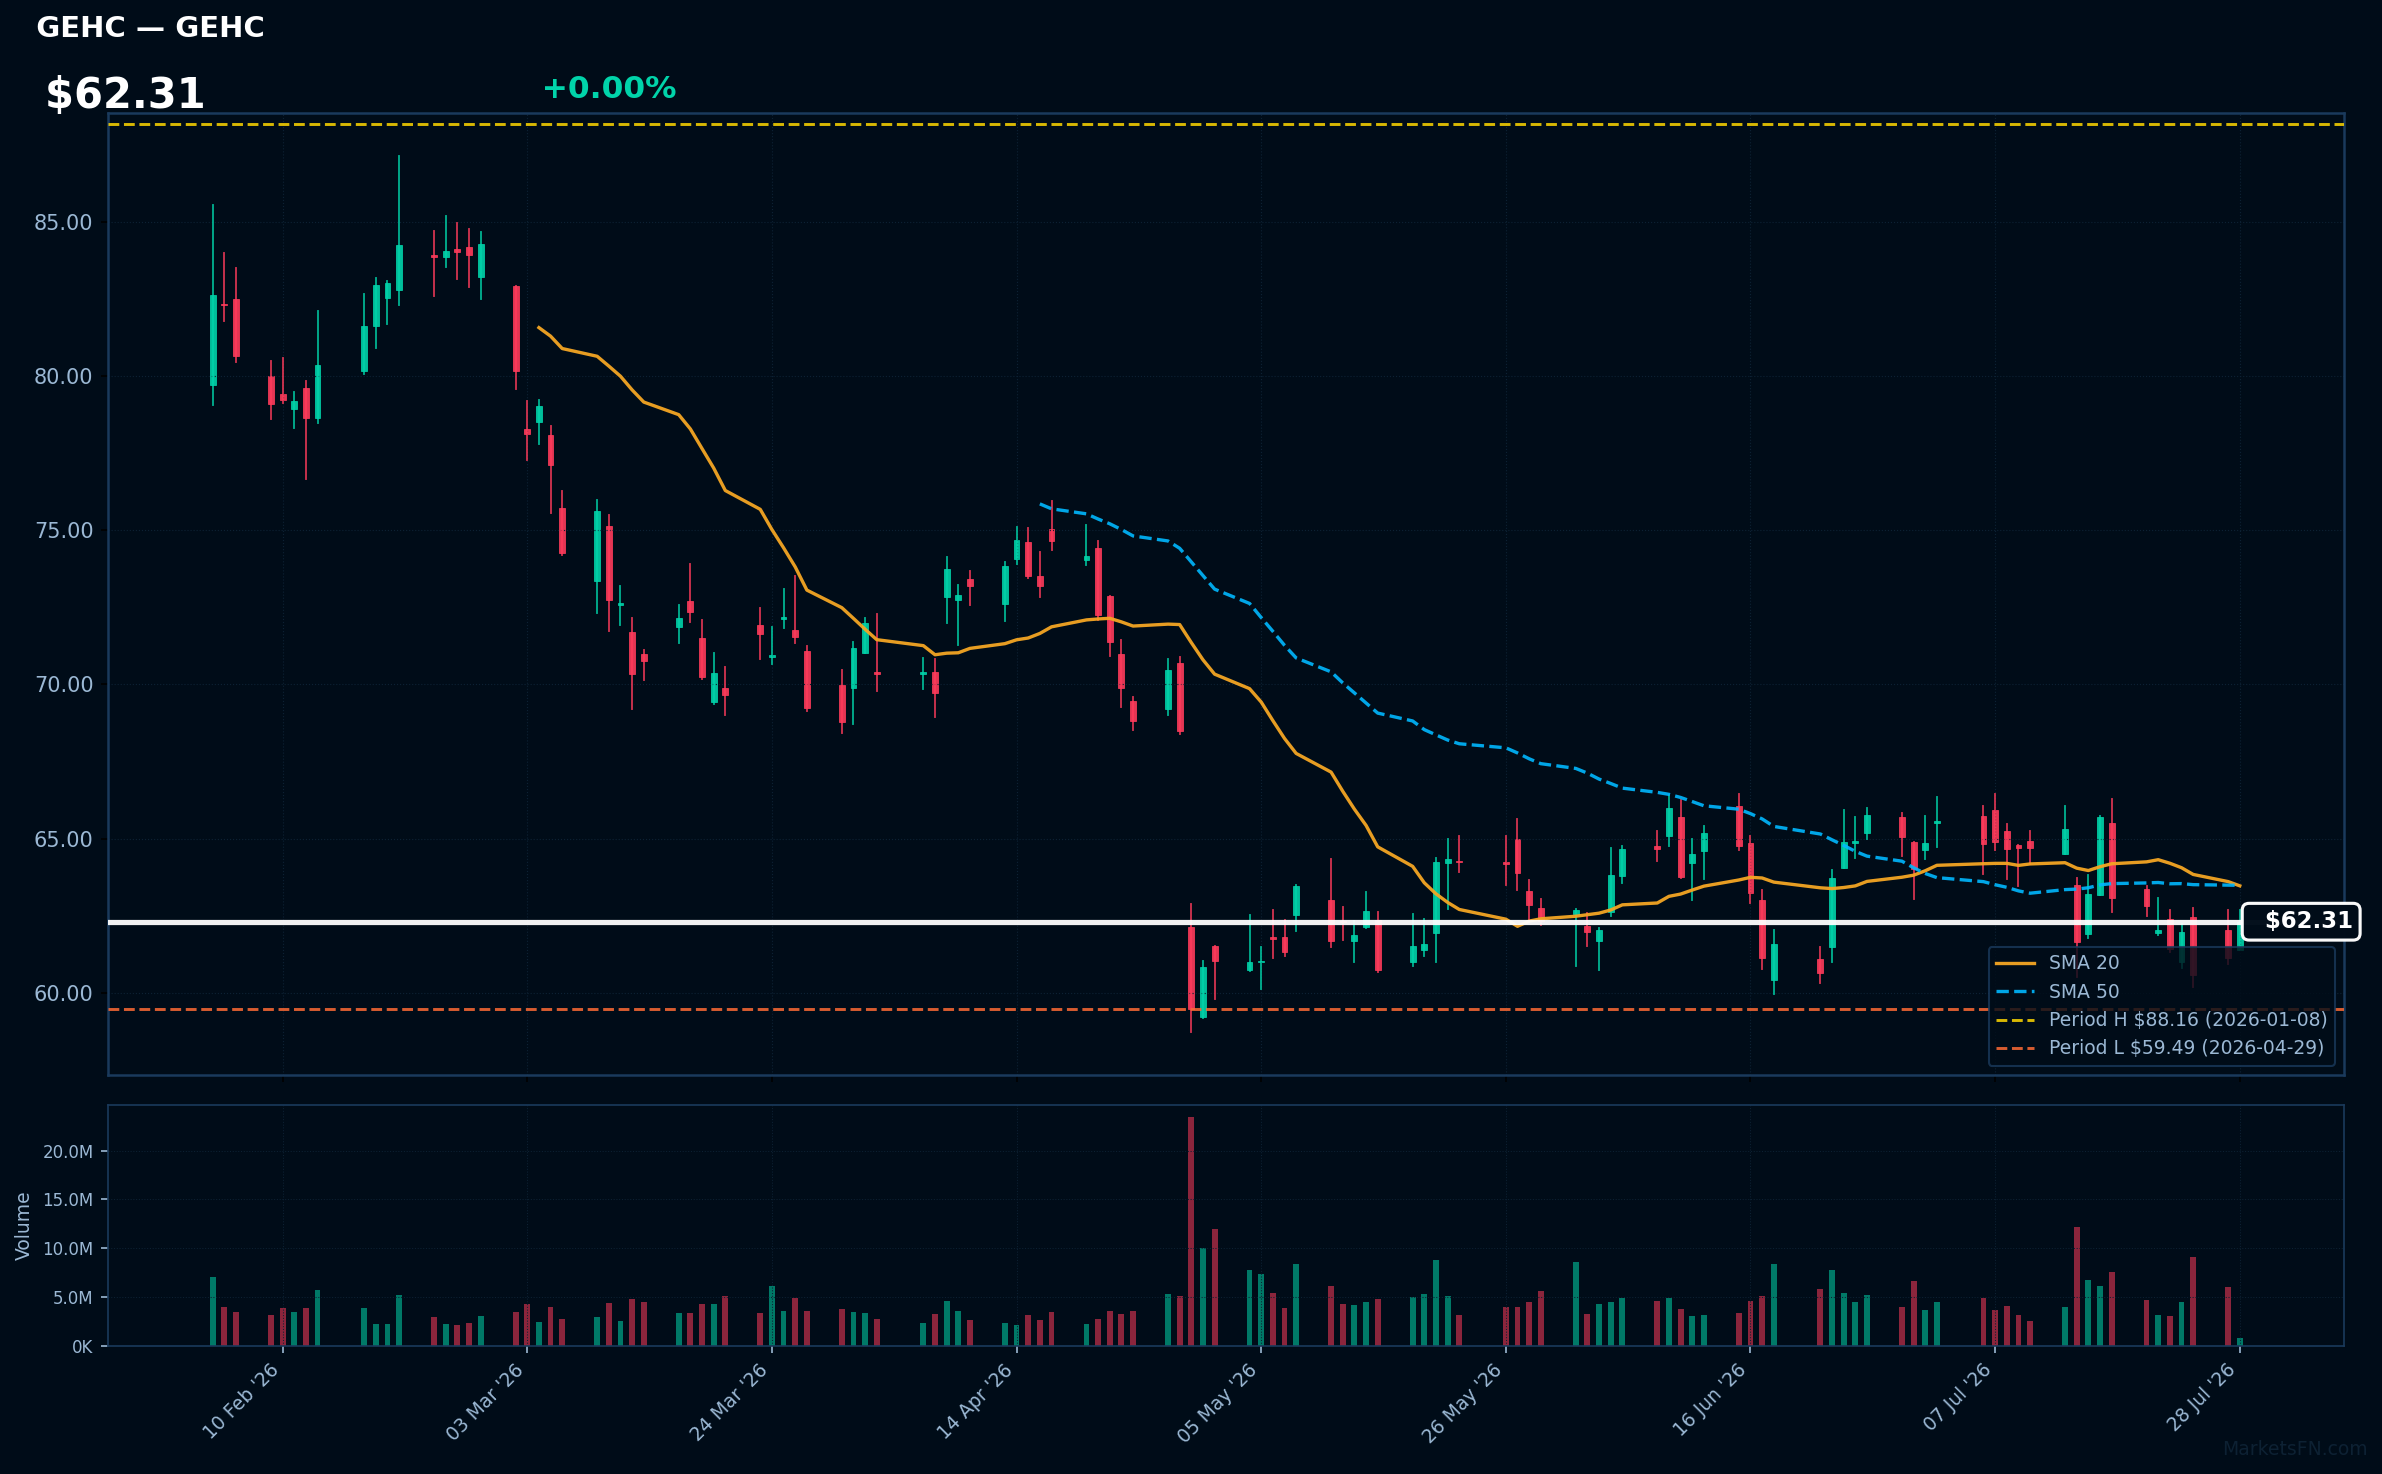
GEHC | GE HealthCare Technologies Inc | Healthcare | Price Last: $62.31 | % Realized: -19.85% | RSI: 46.7 | % above MA200: -14.8% | Trend: Below MA20, MA50, MA200
GE HealthCare Technologies Inc is a medical technology company providing diagnostic imaging, clinical decision support, and patient monitoring solutions. Investors should care about its innovation in healthcare technology and potential for growth in a large and expanding market.
GEHC's technical situation is bearish, with an RSI(14) of 46.7, price below MA20, MA50, and MA200, and a 52-Week return of -19.8%. The stock is 4.7% above its 52-Week low, testing major support, indicating a sustained downtrend and potential further decline.
Related headlines
- GE HealthCare announces CFO transition; reports preliminary second quarter 2026 financial results and reaffirms guidance reflecting business momentum
- GE HealthCare introduces MIM Anyware to extend remote access to imaging data and optimize clinical collaboration
- GE HealthCare Technologies Inc. stock falls Friday, underperforms market
- Catholic Health and GE HealthCare partner to expand patient access across Long Island
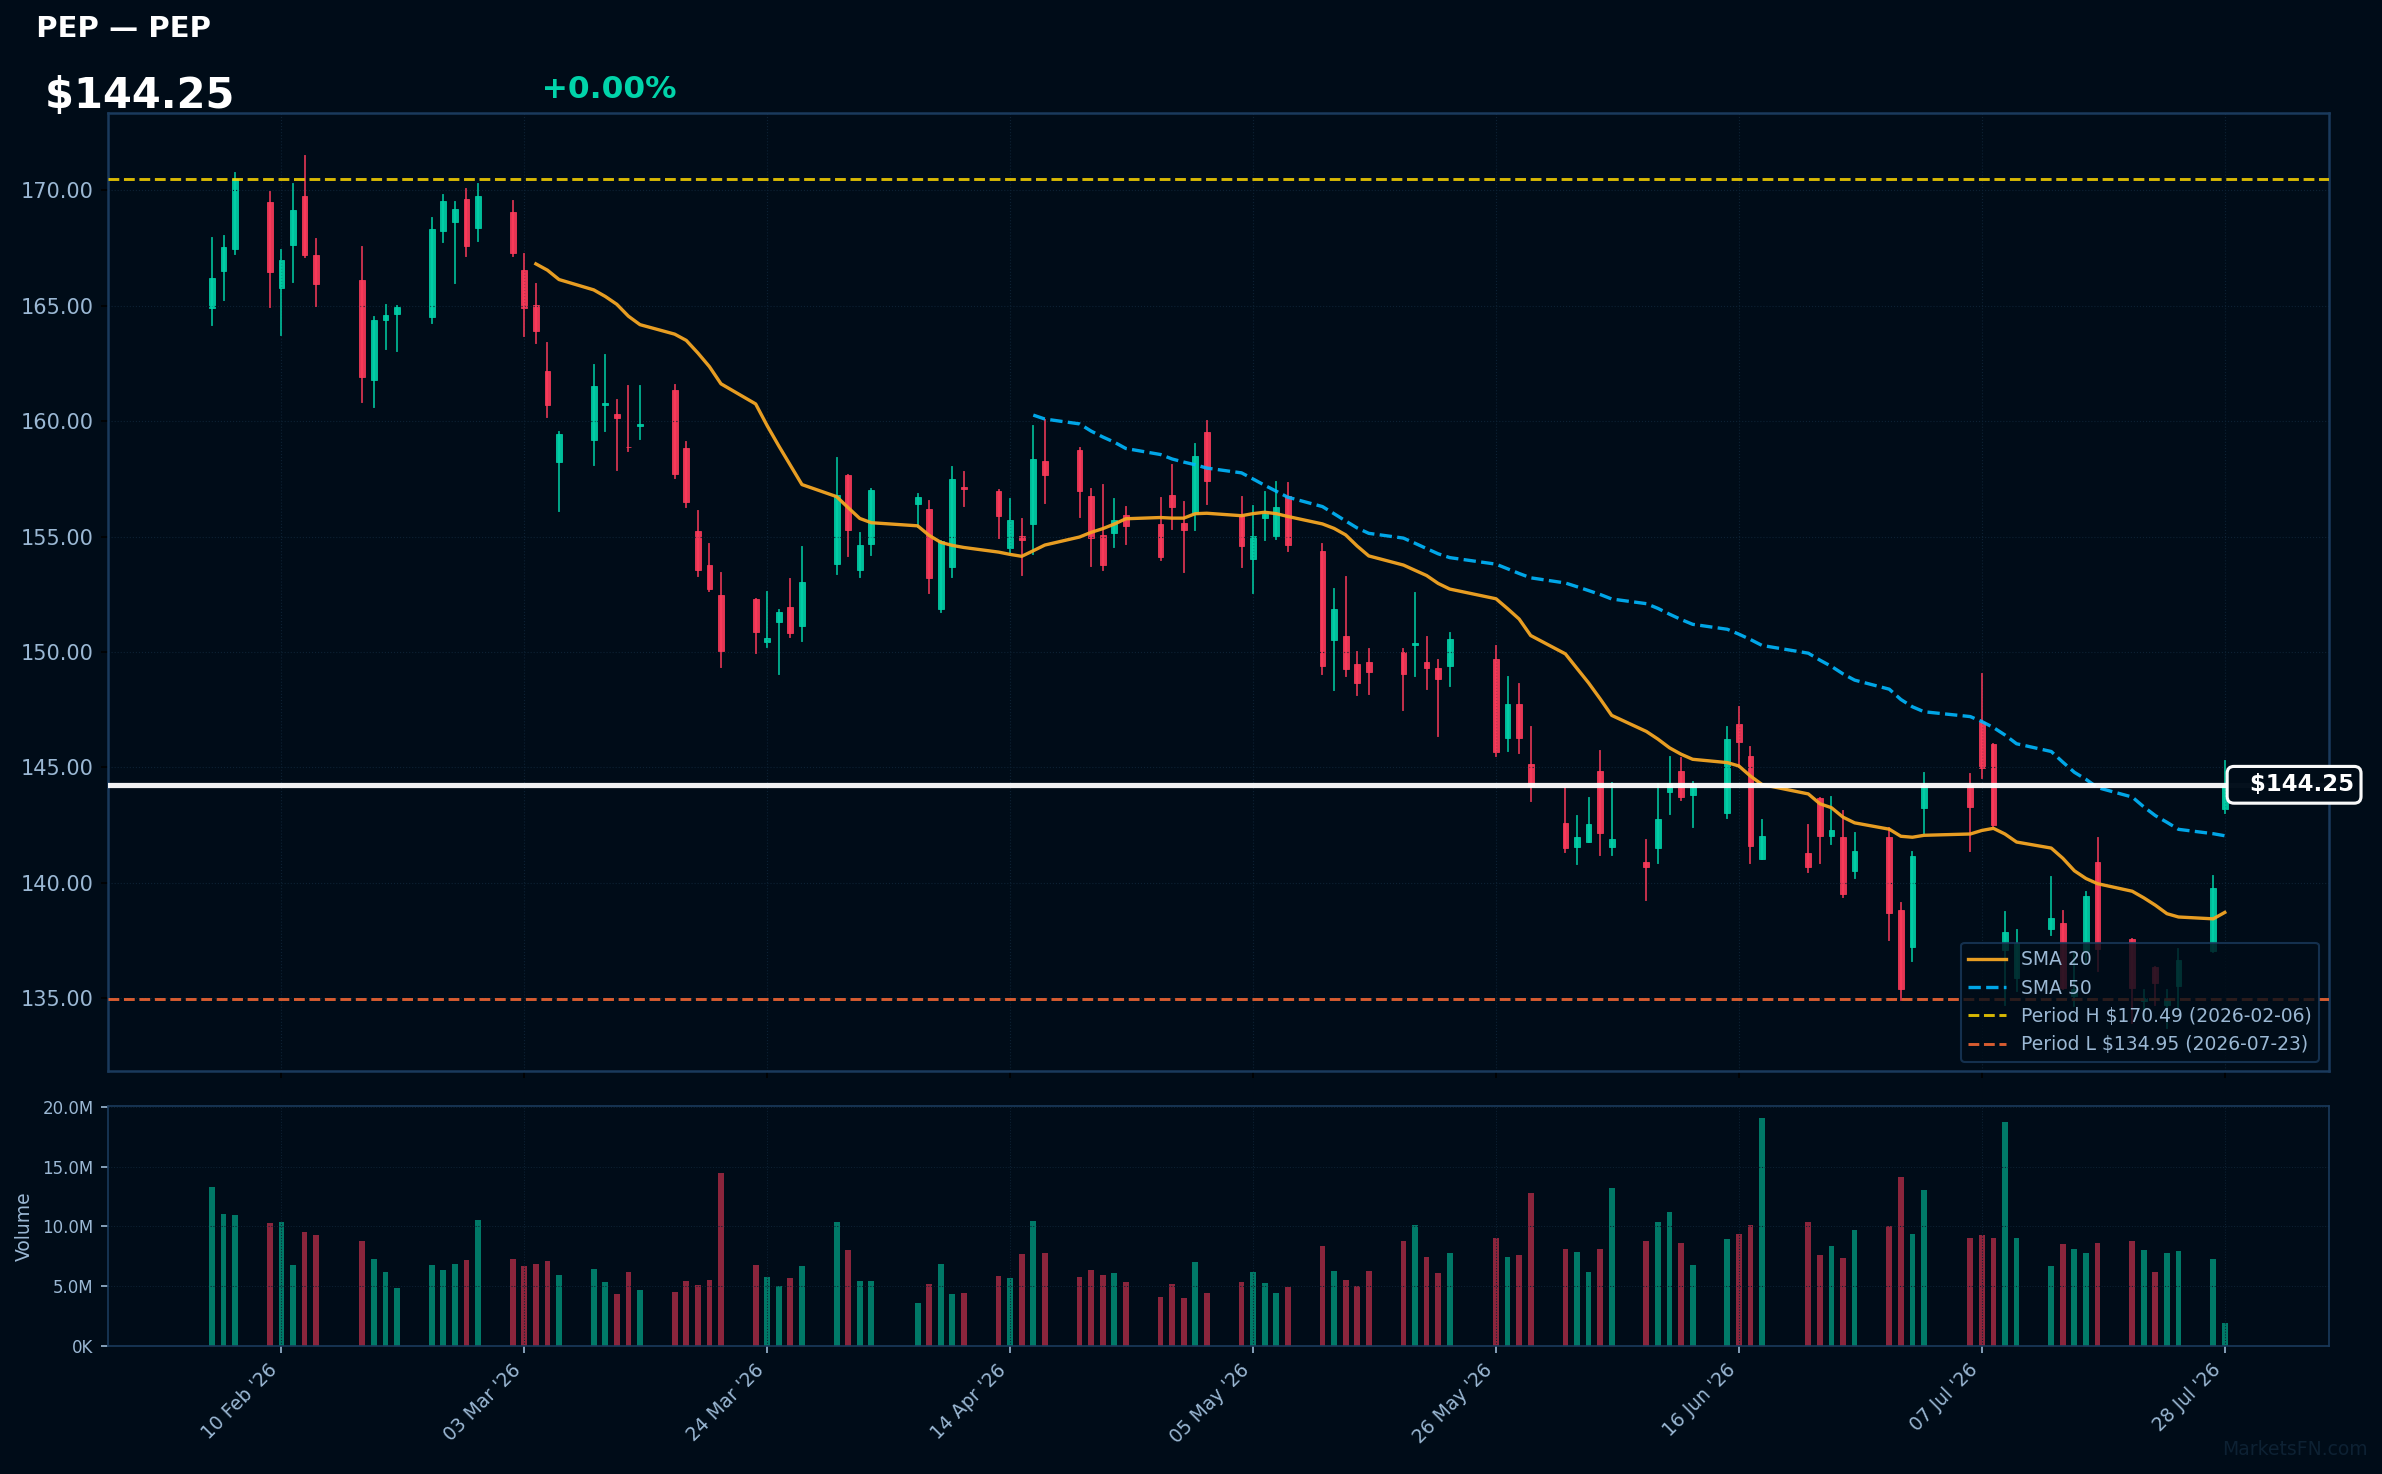
PEP | PepsiCo Inc | Consumer Defensive | Price Last: $144.32 | % Realized: +1.94% | RSI: 58.6 | % above MA200: -3.7% | Trend: Above MA20, MA50 · Below MA200
PepsiCo Inc is a diversified food and beverage company with brands like Pepsi, Lay's, and Gatorade, generating revenue through beverage sales, snack foods, and other categories, making it a significant player in the consumer staples sector.
PepsiCo's technicals show mixed signals: RSI(14) at 58.6 indicates neutral momentum, price above MA20/MA50 but below MA200; it's 6.9% above its 52-Week low, testing major support, with a 1.9% return over the 52-Week period, suggesting a lack of strong trend.
Related headlines
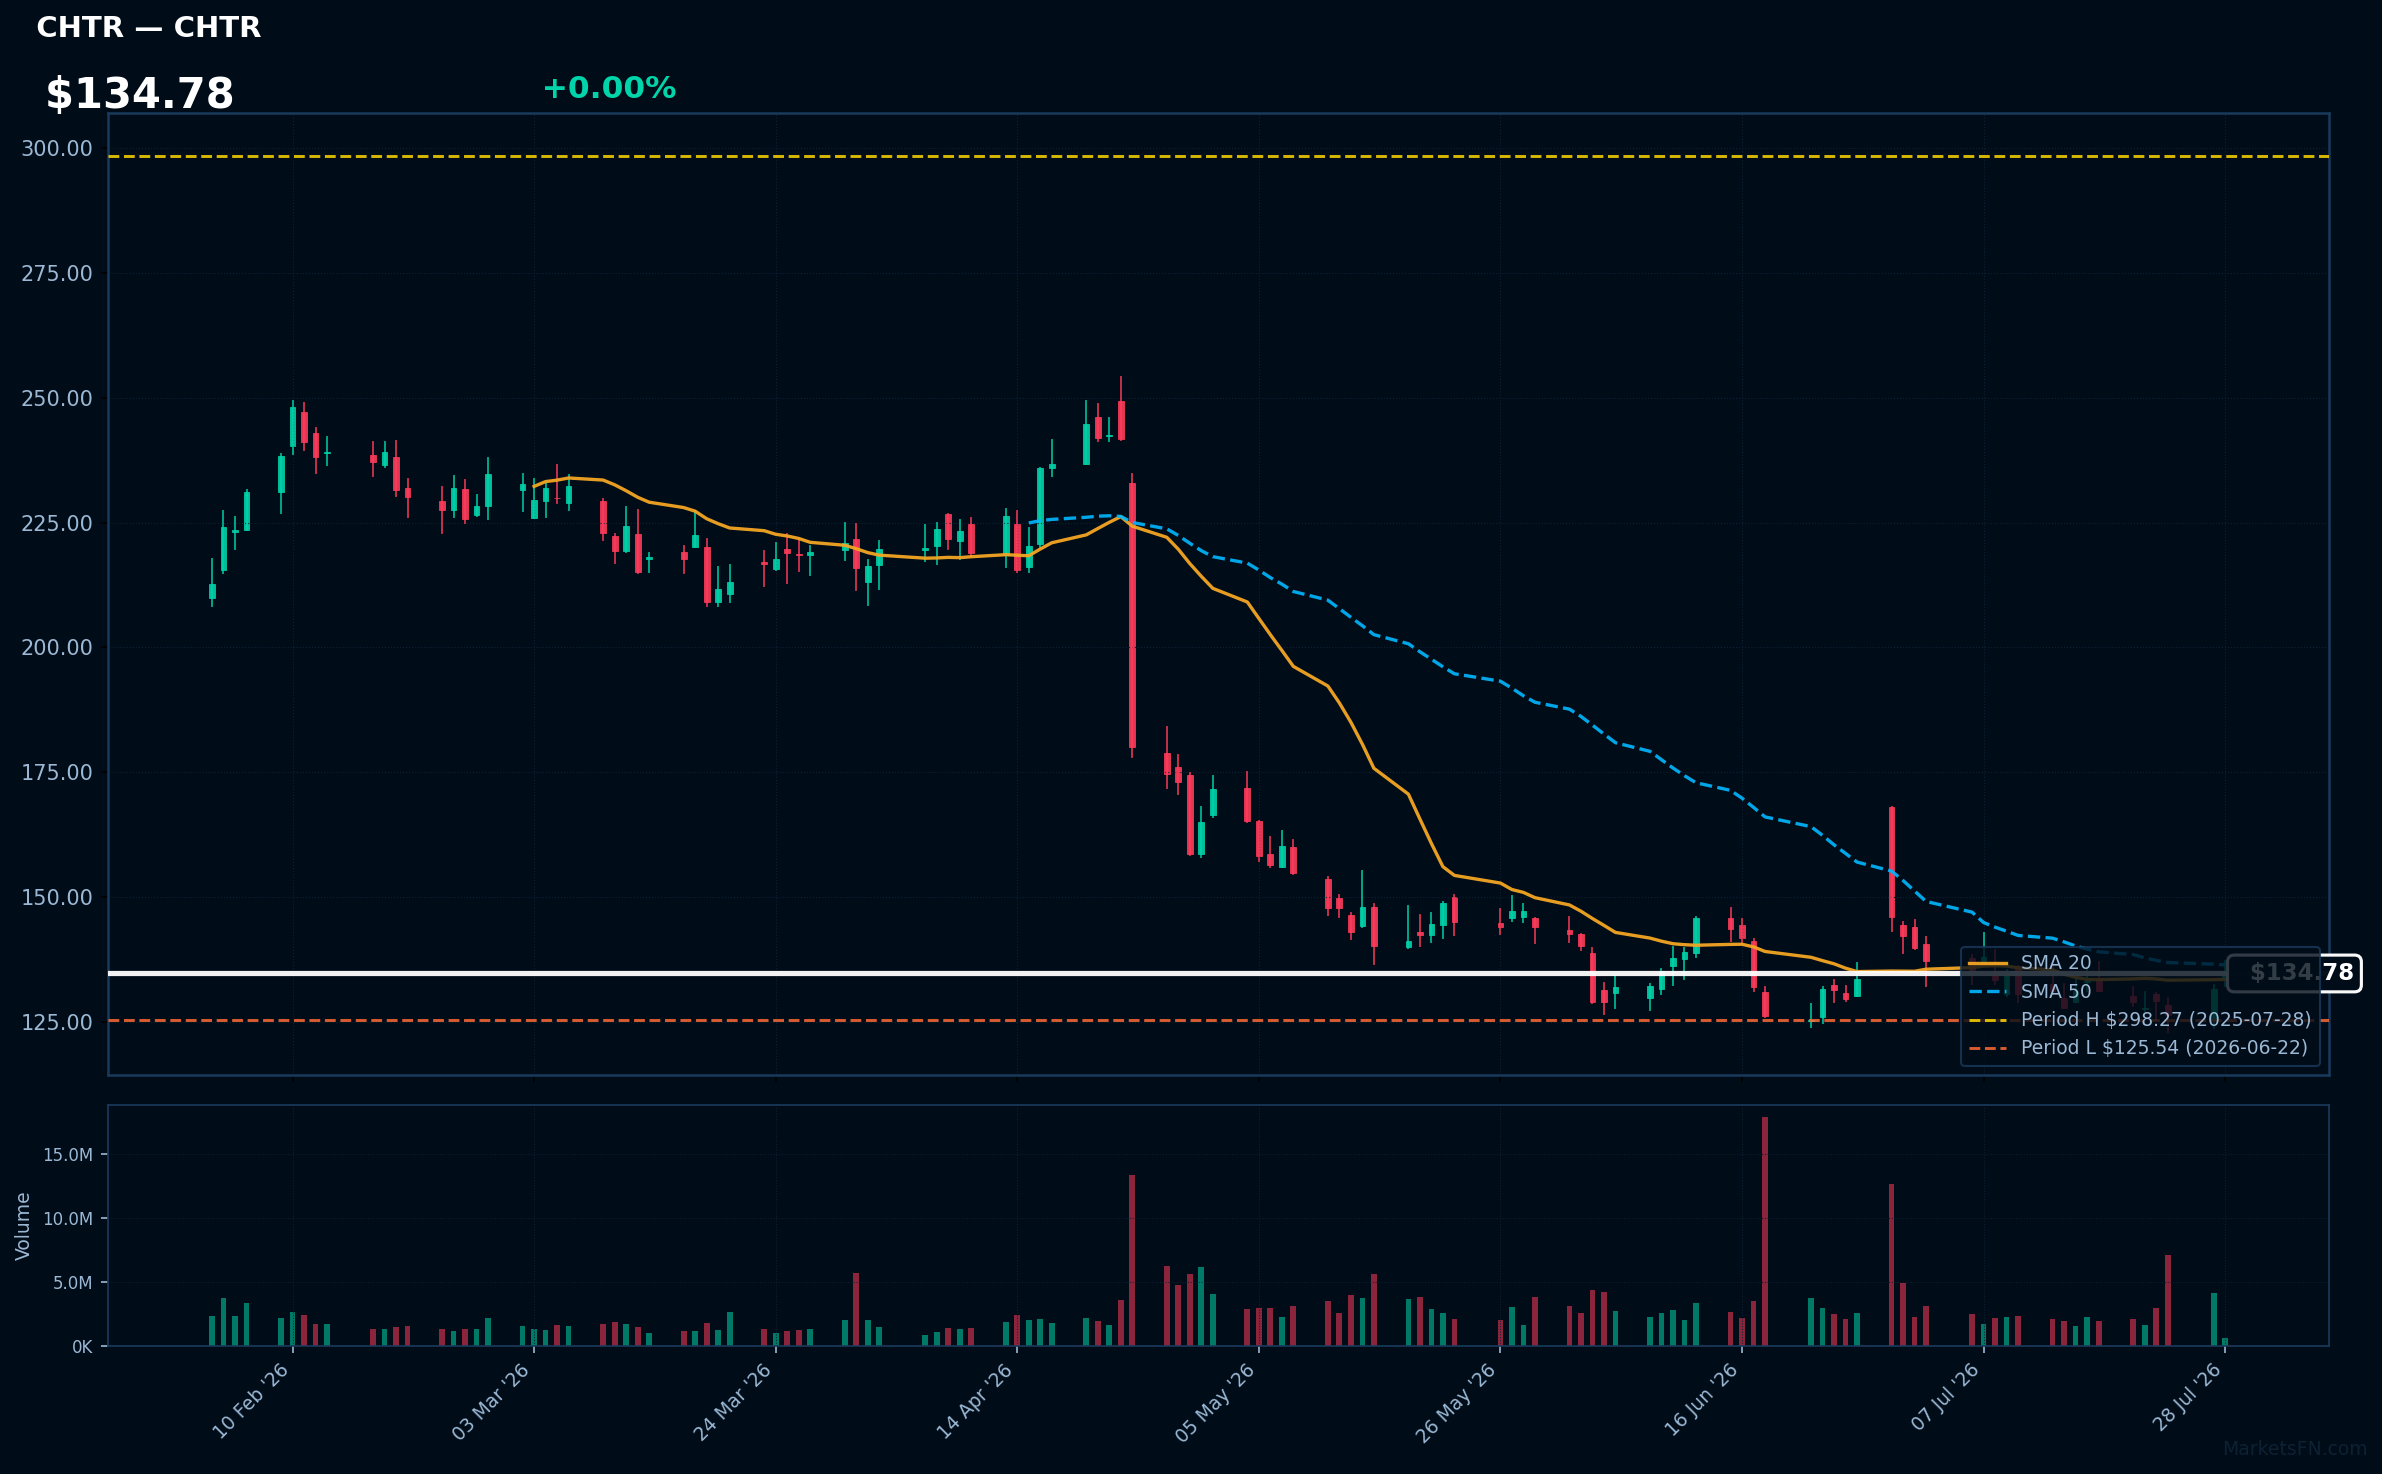
CHTR | Charter Communications Inc | Communication Services | Price Last: $134.78 | % Realized: -54.81% | RSI: 50.8 | % above MA200: -30.8% | Trend: Above MA20 · Below MA50, MA200
Charter Communications Inc is a broadband connectivity company providing internet, TV, and voice services to residential and commercial customers; investors should care about its performance as it reflects the demand for high-speed internet and streaming services.
Charter Communications Inc's technicals show mixed signals: RSI(14) is 50.8, indicating neutral momentum, with the price above MA20 but below MA50/MA200; it's 7.4% above its 52-Week low, testing major support after a -54.8% 52-Week return.
Related headlines
Market Commentary
The Nasdaq 100 stocks listed are currently near 52-week extremes, with some at all-time highs and others near their lowest levels over the past year. Stocks like AMGN, ABNB, and EA are at their 52-week highs, indicating strong performance, while TSLA and SNPS are near their 52-week lows, suggesting potential weakness.
The technology sector is driving these price levels, with companies like AMGN and EA performing well, potentially due to strong earnings and product demand. Conversely, TSLA's proximity to its 52-week low may be related to concerns over the electric vehicle market and competition. Macro themes such as interest rates and overall market sentiment may also be influencing these stock prices.
Key levels to watch include the 52-week highs and lows for these stocks, as a breakout or breakdown could signal further price movements. For stocks near their 52-week highs, a failure to break through could indicate a reversal, while stocks near their lows may see a bounce if they can hold above their current levels. Catalysts such as earnings reports and industry trends will be important to monitor for potential breakouts or breakdowns.
Methodology: All 101 Nasdaq 100 constituents screened. 52-week high = highest daily close over the past 252 trading days (approx. 1 year). 52-week low = lowest daily close over the same period. Distance = (current price / extreme − 1) × 100. Technical indicators computed on up to 1 year of daily OHLCV data.
Disclaimer: For informational purposes only. Not investment advice. Past performance is not indicative of future results.

