Nasdaq 100 52-Week Highs & Lows Radar: Apple (AAPL), Tesla (TSLA) and more
MarketsFN Team

Nasdaq 100 52-Week Highs & Lows Radar: Apple (AAPL), Tesla (TSLA) and more
Screening all 101 Nasdaq 100 constituents for stocks nearest to their 52-week high and their 52-week low. Data as of July 29, 2026. % Realized = 52-week total return.
Legend: RSI > 70 = overbought · RSI < 30 = oversold · Green % Realized = positive 52W return · Red = negative.
📈 Nearest to 52-Week High
Sectors represented: Consumer Cyclical (2), Technology (1), Healthcare (1), Industrials (1)
| Ticker | Company | Sector | Price Last | % Realized | 52-Week High Date | RSI | % above MA200 | Trend |
|---|---|---|---|---|---|---|---|---|
| AAPL | Apple Inc | Technology | $343.15 | +62.42% | 2026-07-29 | 70.3 | +24.0% | Above MA20, MA50, MA200 |
| AMGN | AMGEN Inc | Healthcare | $395.74 | +30.37% | 2026-07-29 | 73.8 | +15.7% | Above MA20, MA50, MA200 |
| ABNB | Airbnb Inc | Consumer Cyclical | $156.17 | +14.13% | 2026-07-29 | 64.4 | +18.3% | Above MA20, MA50, MA200 |
| PCAR | Paccar Inc | Industrials | $136.87 | +37.58% | 2026-07-29 | 73.1 | +18.9% | Above MA20, MA50, MA200 |
| ROST | Ross Stores, Inc | Consumer Cyclical | $250.72 | +79.65% | 2026-07-29 | 70.5 | +25.1% | Above MA20, MA50, MA200 |
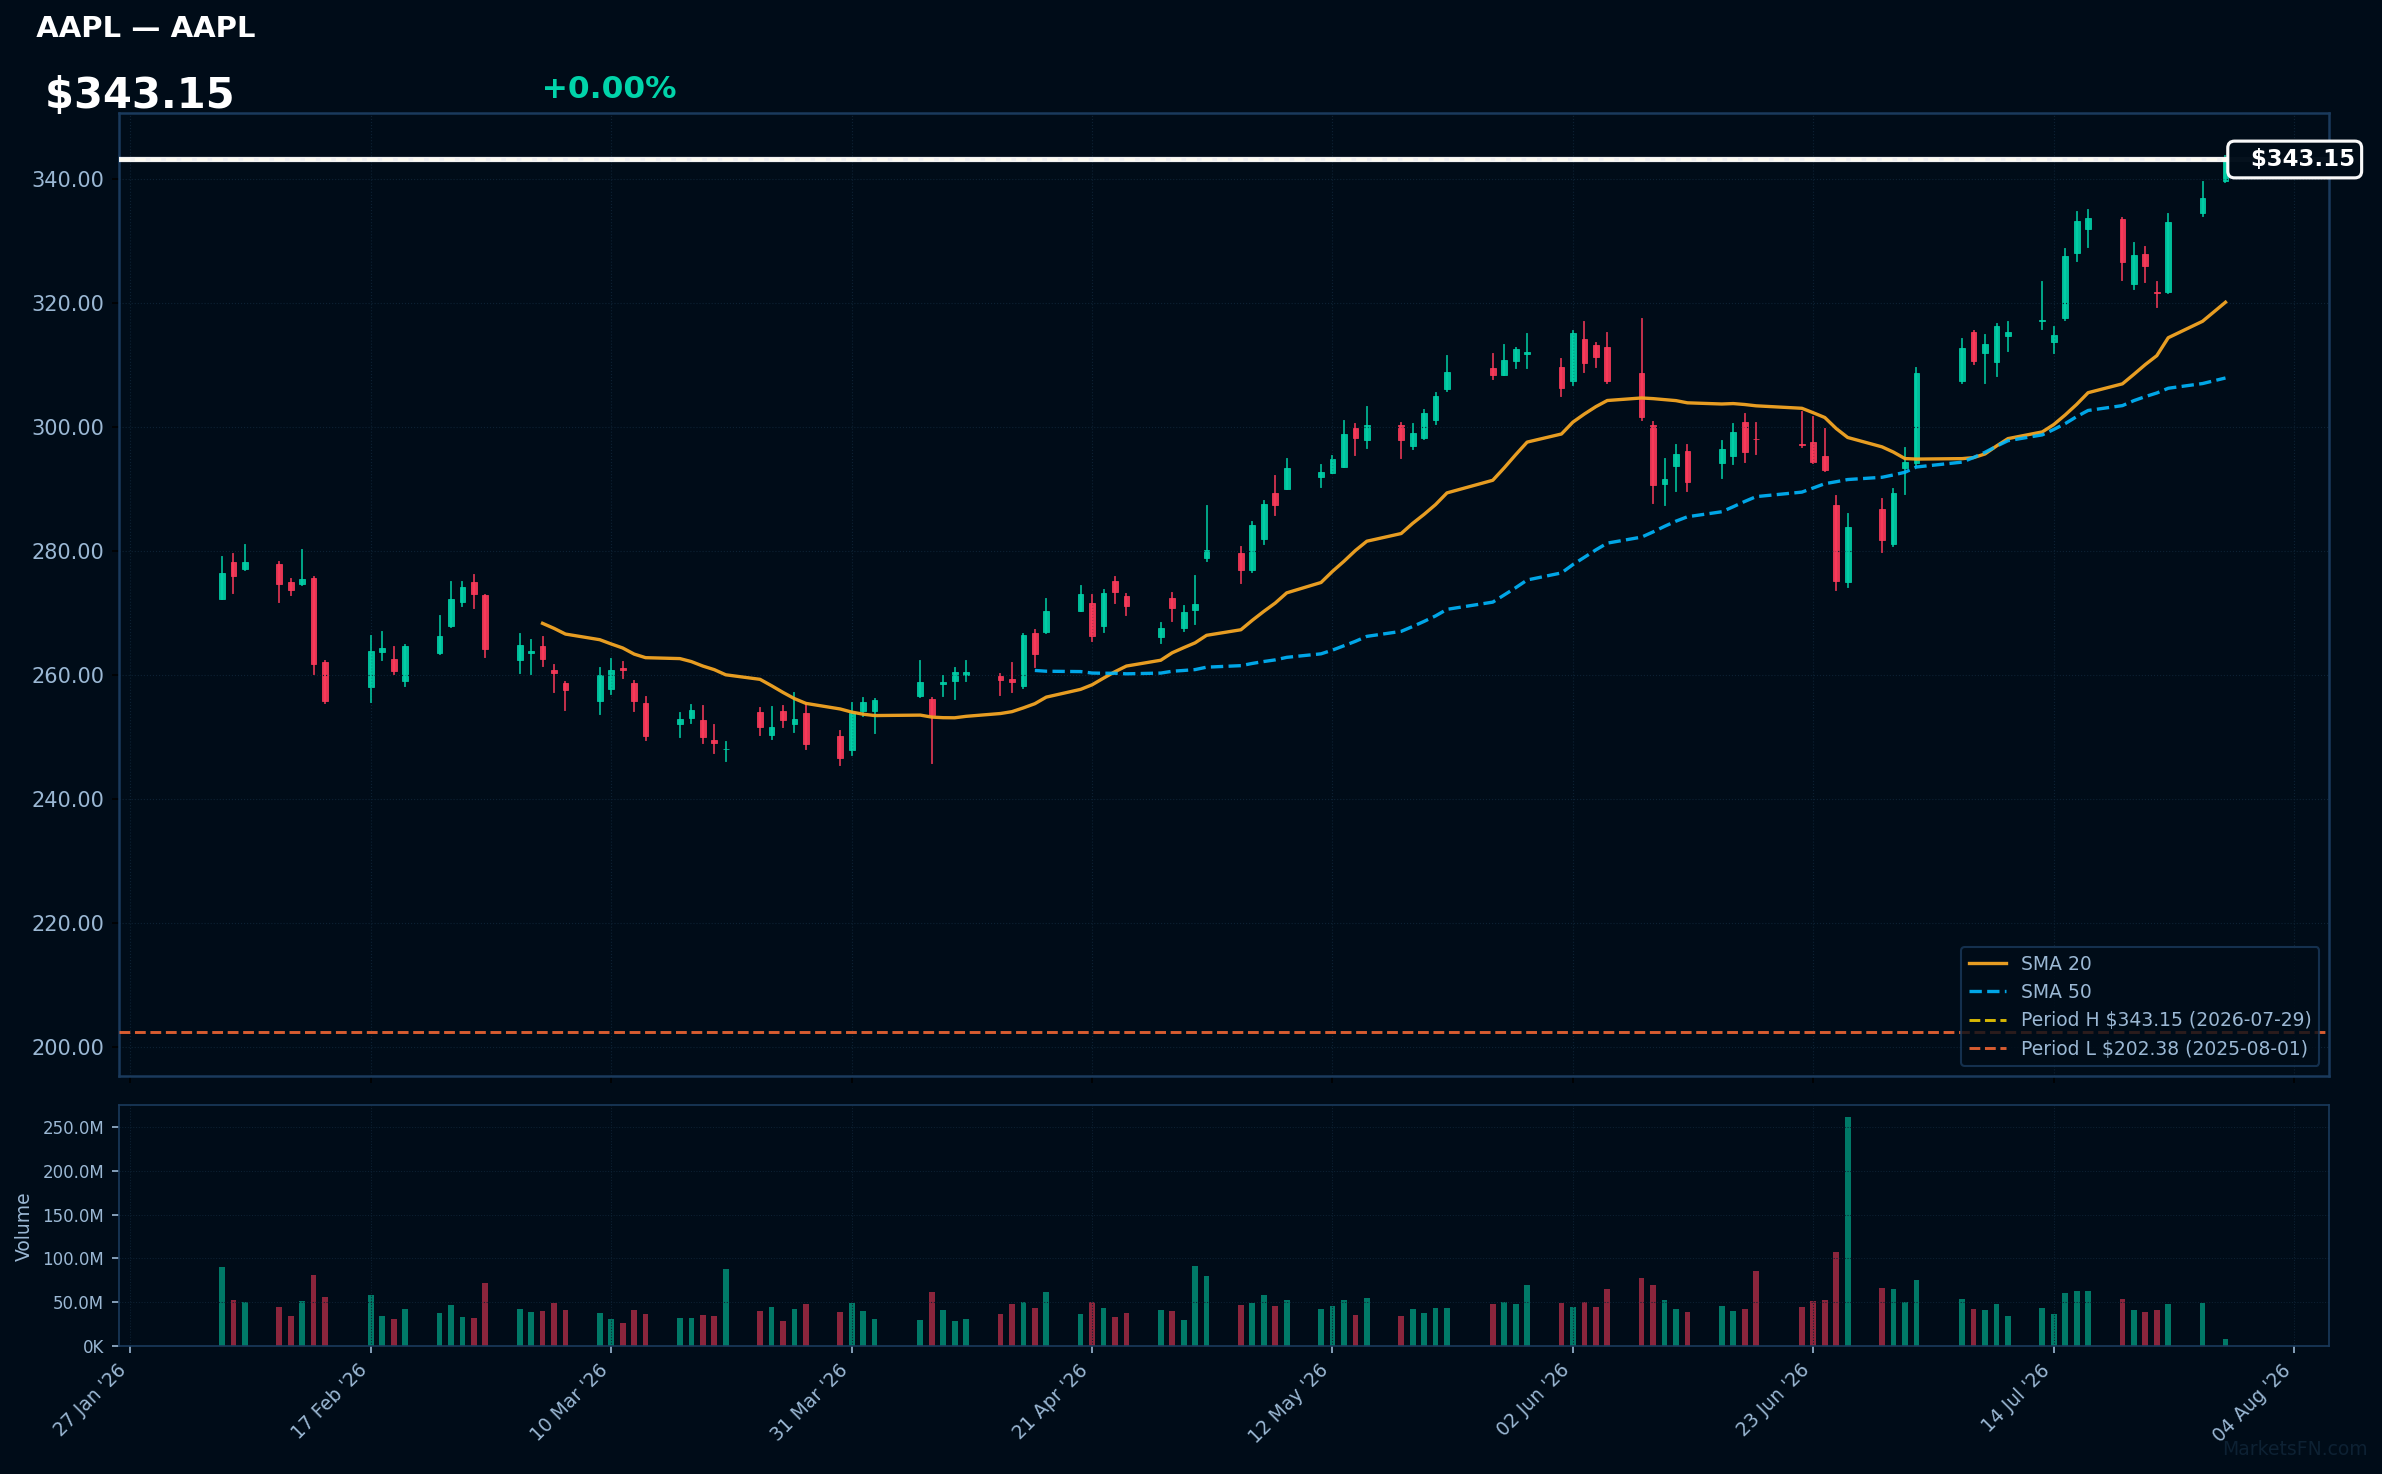
AAPL | Apple Inc | Technology | Price Last: $343.15 | % Realized: +62.42% | RSI: 70.3 | % above MA200: +24.0% | Trend: Above MA20, MA50, MA200
Apple Inc designs, manufactures, and markets consumer electronics, software, and services. Investors care about its innovative product ecosystem, including iPhones, Macs, and wearables, driving revenue growth and profitability.
AAPL's RSI(14) is 70.3, indicating strong momentum. The bullish MA alignment (price > MA20 > MA50 > MA200) and 0.0% proximity to its 52-Week high suggest a potential breakout, supported by a 62.4% 52-Week return.
Related headlines
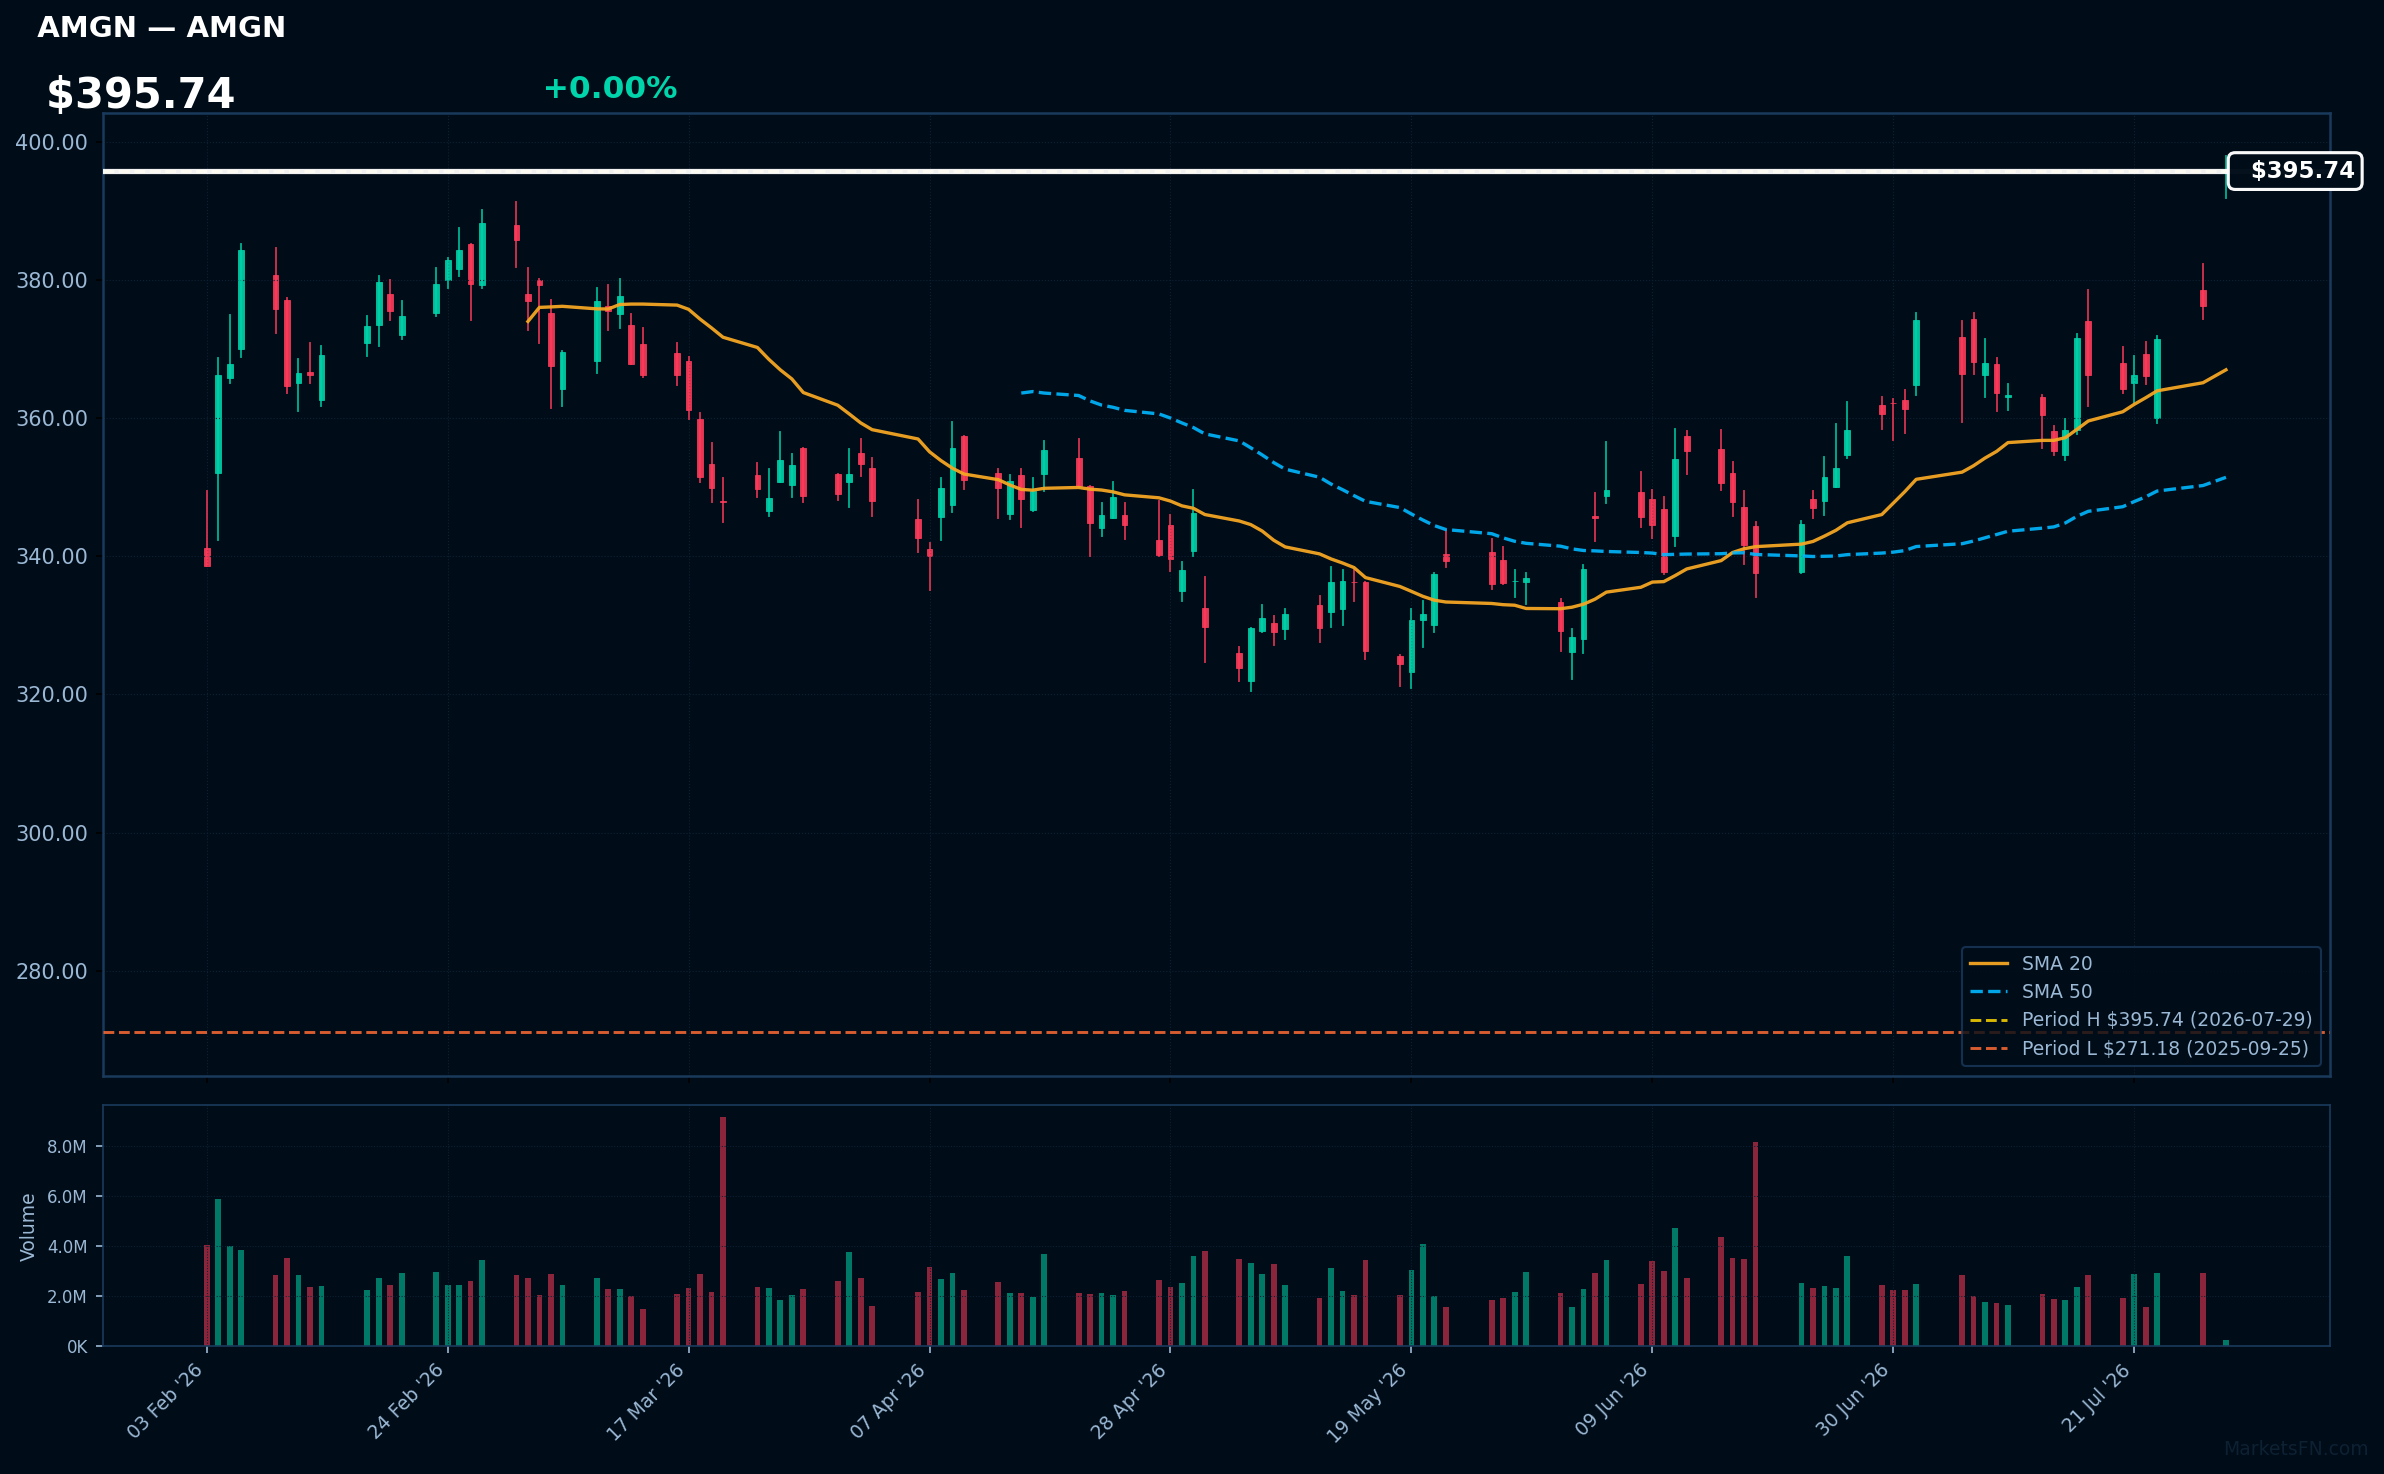
AMGN | AMGEN Inc | Healthcare | Price Last: $395.74 | % Realized: +30.37% | RSI: 73.8 | % above MA200: +15.7% | Trend: Above MA20, MA50, MA200
AMGEN Inc is a biotechnology company that develops and markets human therapeutics, focusing on innovative treatments for serious illnesses such as cancer, cardiovascular disease, and bone health conditions, making it an attractive investment for those seeking exposure to the biotech sector.
AMGN's current technical situation indicates strong momentum: RSI(14) is 73.8, nearing overbought territory, with a bullish MA alignment (price > MA20 > MA50 > MA200) and 0.0% below its 52-Week high, suggesting a potential breakout.
Related headlines
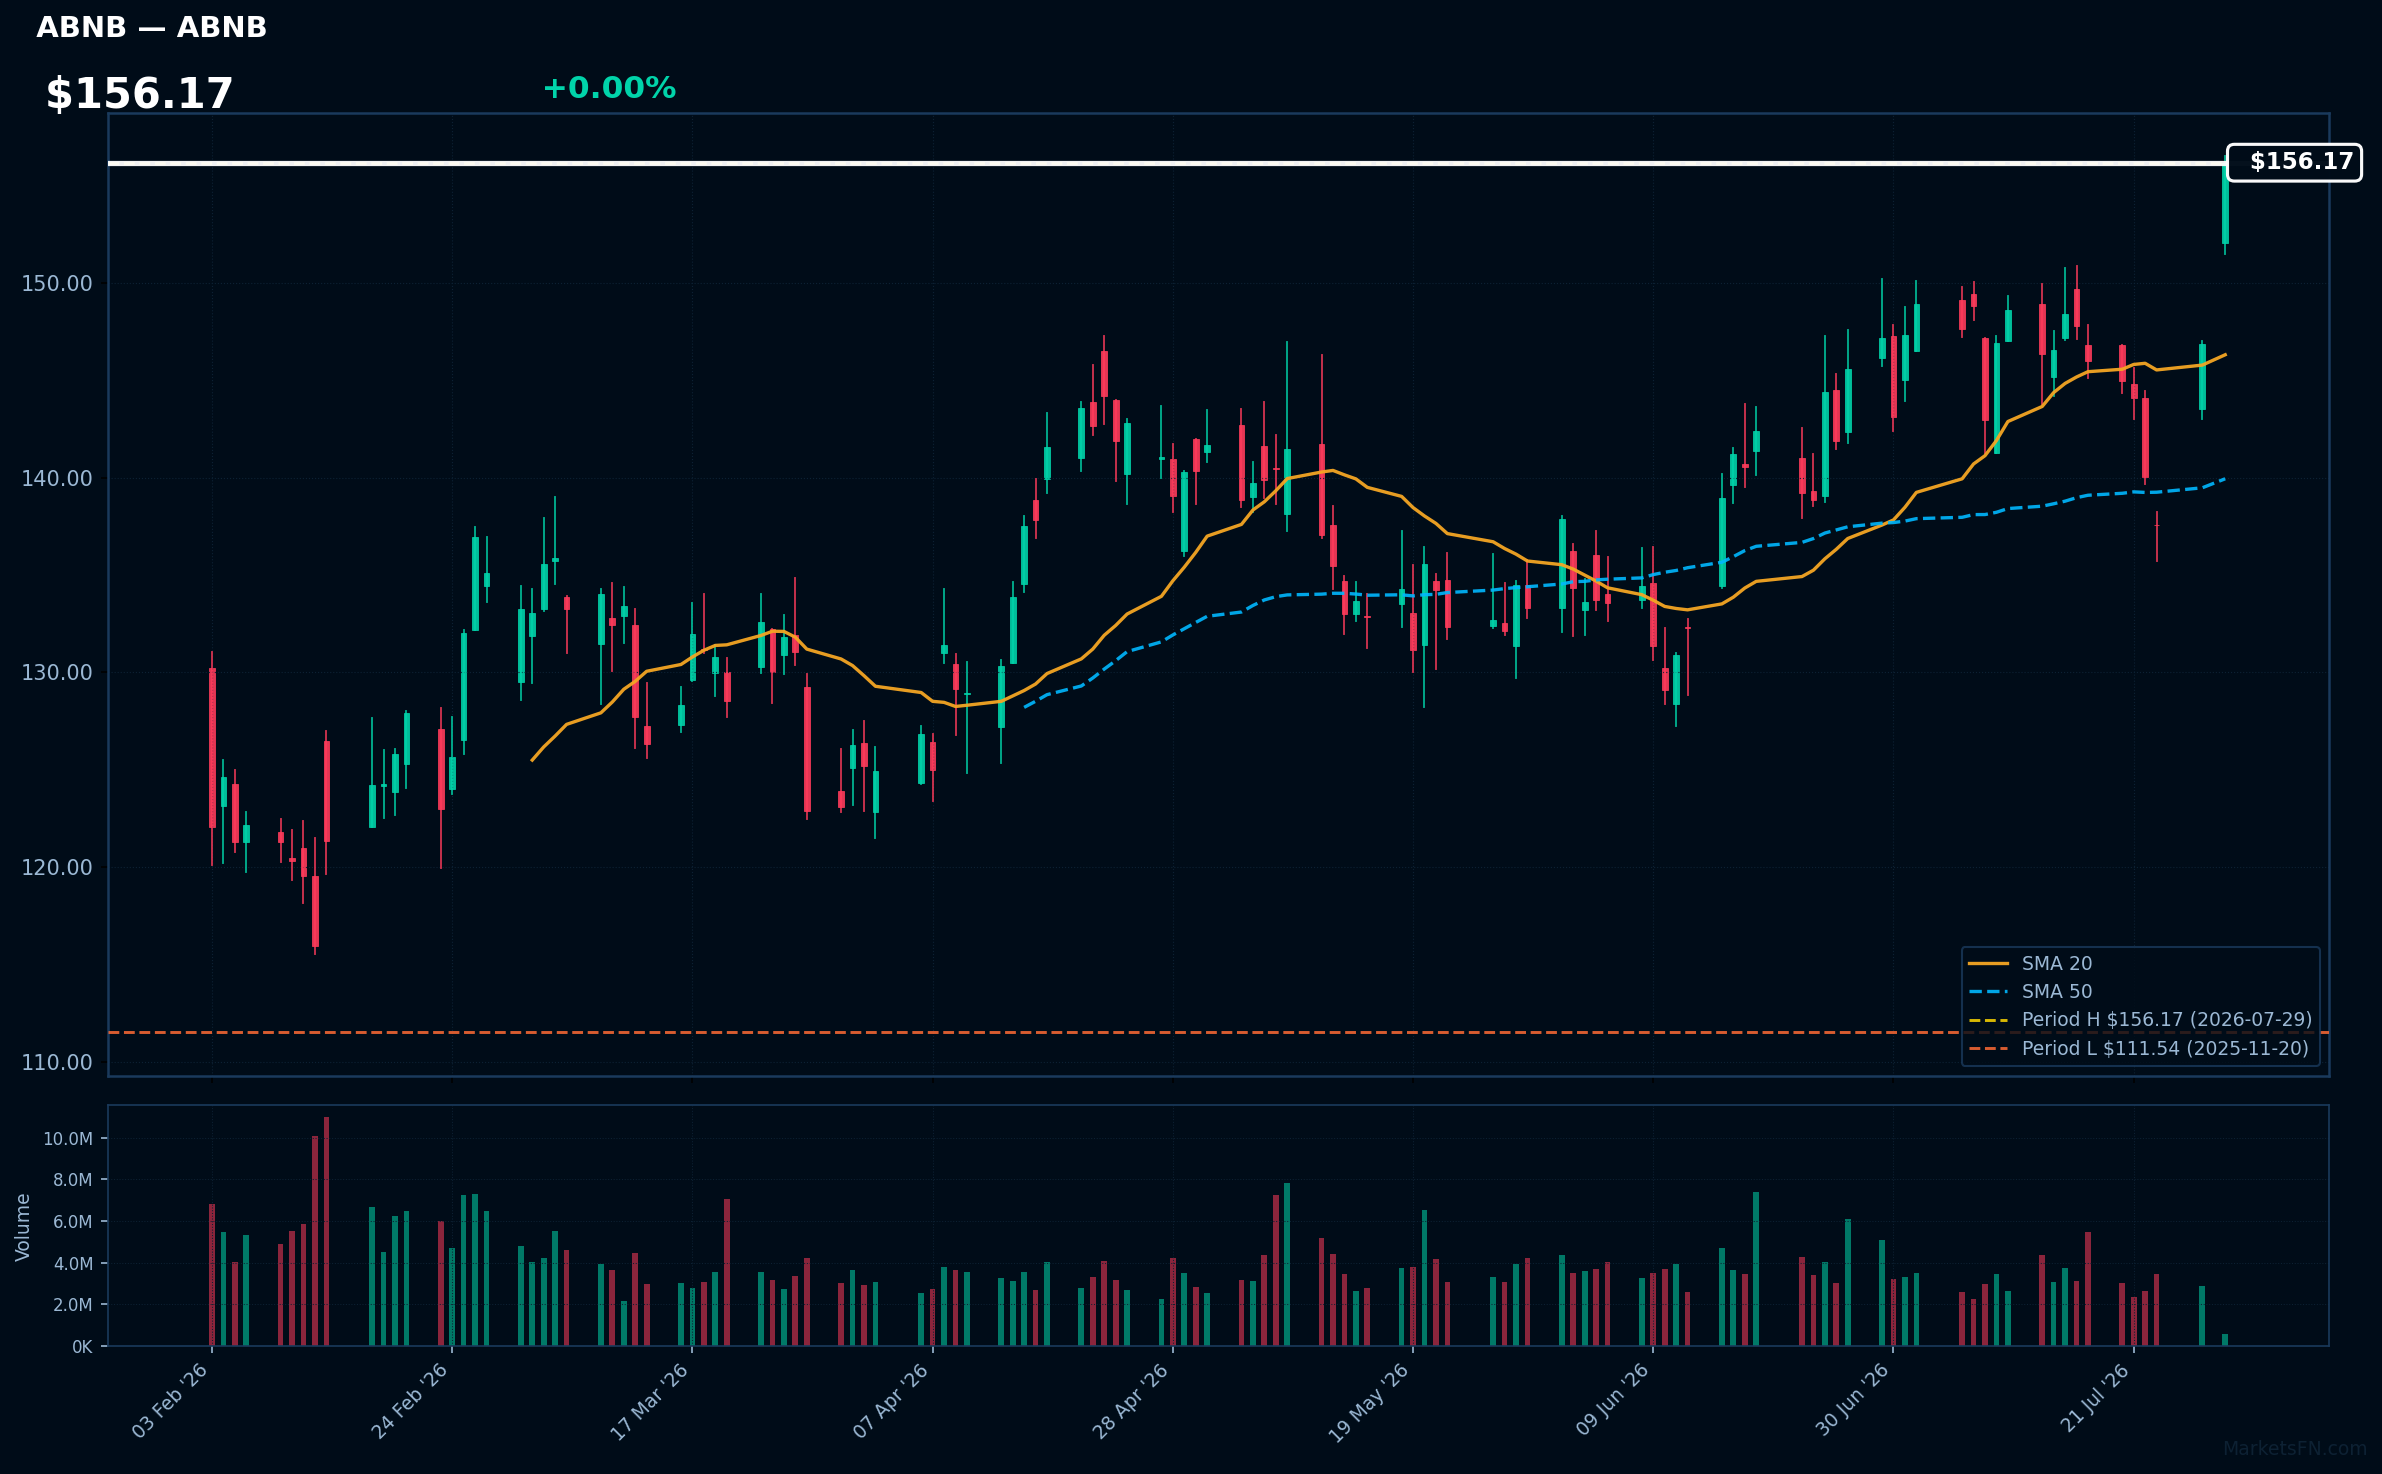
ABNB | Airbnb Inc | Consumer Cyclical | Price Last: $156.17 | % Realized: +14.13% | RSI: 64.4 | % above MA200: +18.3% | Trend: Above MA20, MA50, MA200
Airbnb Inc operates a platform connecting travelers with local hosts offering unique accommodations, allowing users to book experiences and homes. Investors should care about its growth potential in the travel and hospitality industry.
Airbnb Inc is in a sustained uptrend with price > MA20 > MA50 > MA200, RSI(14) at 64.4, near its 52-Week high. This indicates strong momentum, with no clear warning signs, as the stock is 0.0% below its 52-Week high.
Related headlines
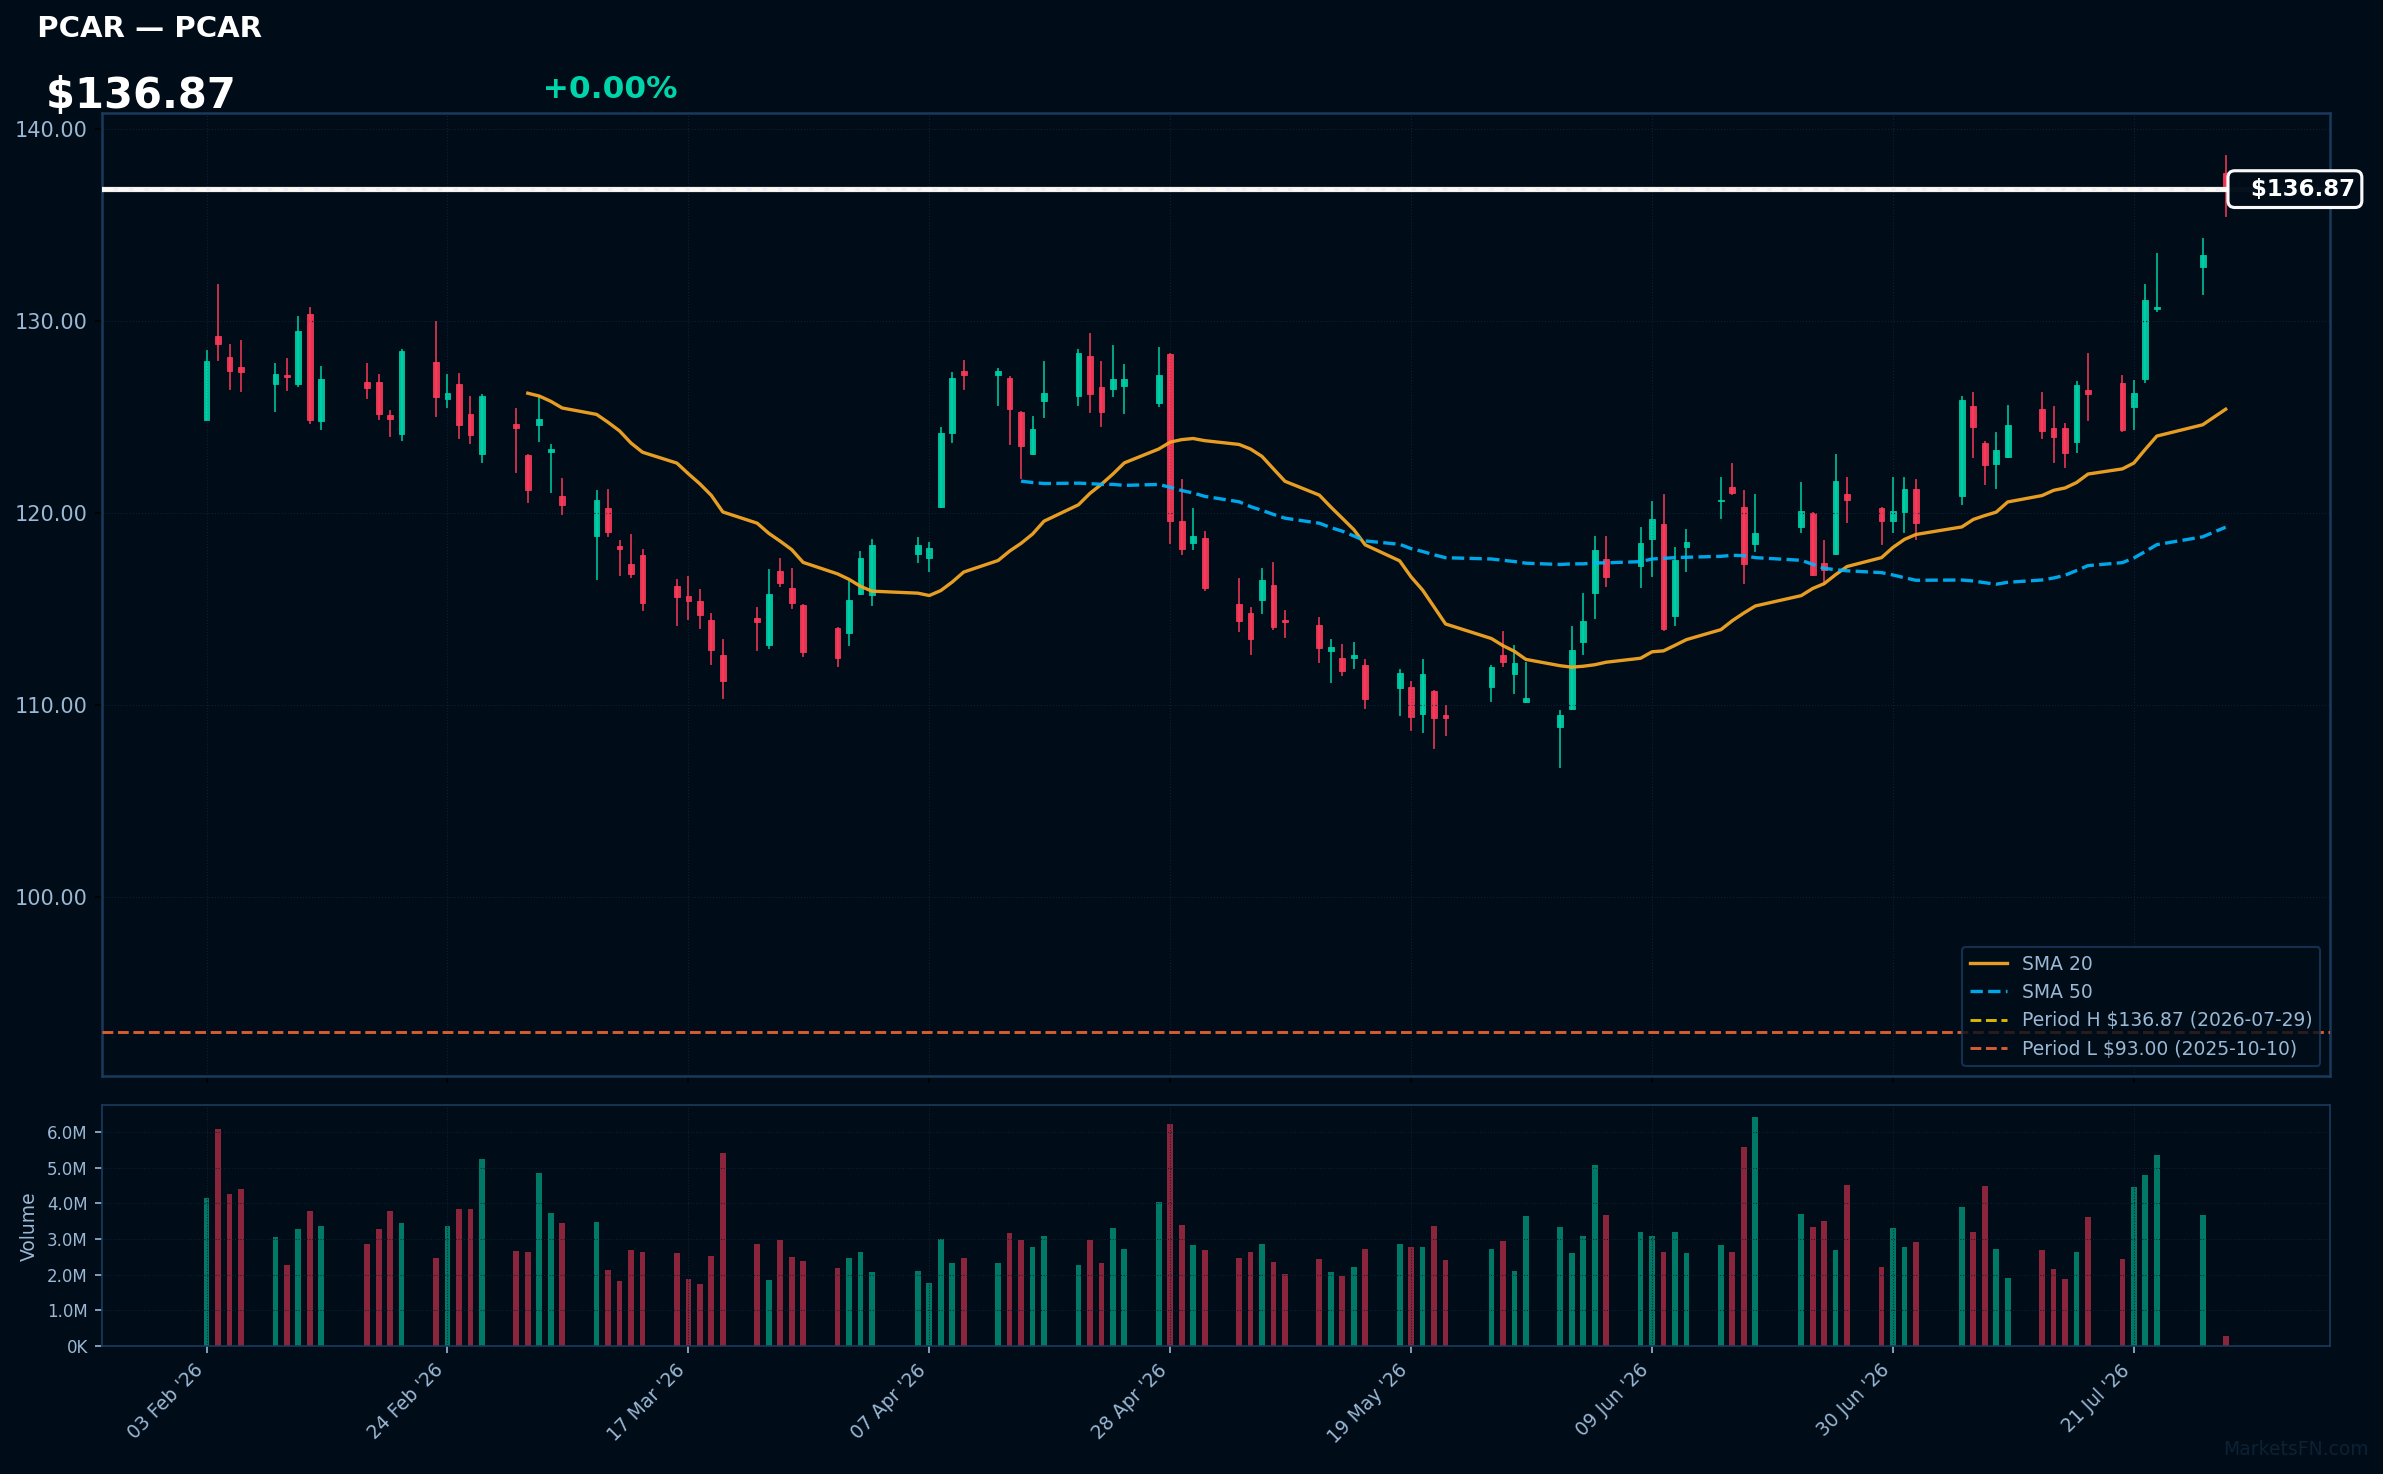
PCAR | Paccar Inc | Industrials | Price Last: $136.87 | % Realized: +37.58% | RSI: 73.1 | % above MA200: +18.9% | Trend: Above MA20, MA50, MA200
Paccar Inc designs and manufactures light-, medium-, and heavy-duty trucks, with brands including Kenworth and Peterbilt. Investors should care due to the company's significant market presence and potential for cyclical industry growth.
Paccar Inc is in a sustained uptrend with price > MA20 > MA50 > MA200, RSI(14) at 73.1, near its 52-Week high. This indicates strong momentum, potentially overbought given the high RSI.
Related headlines
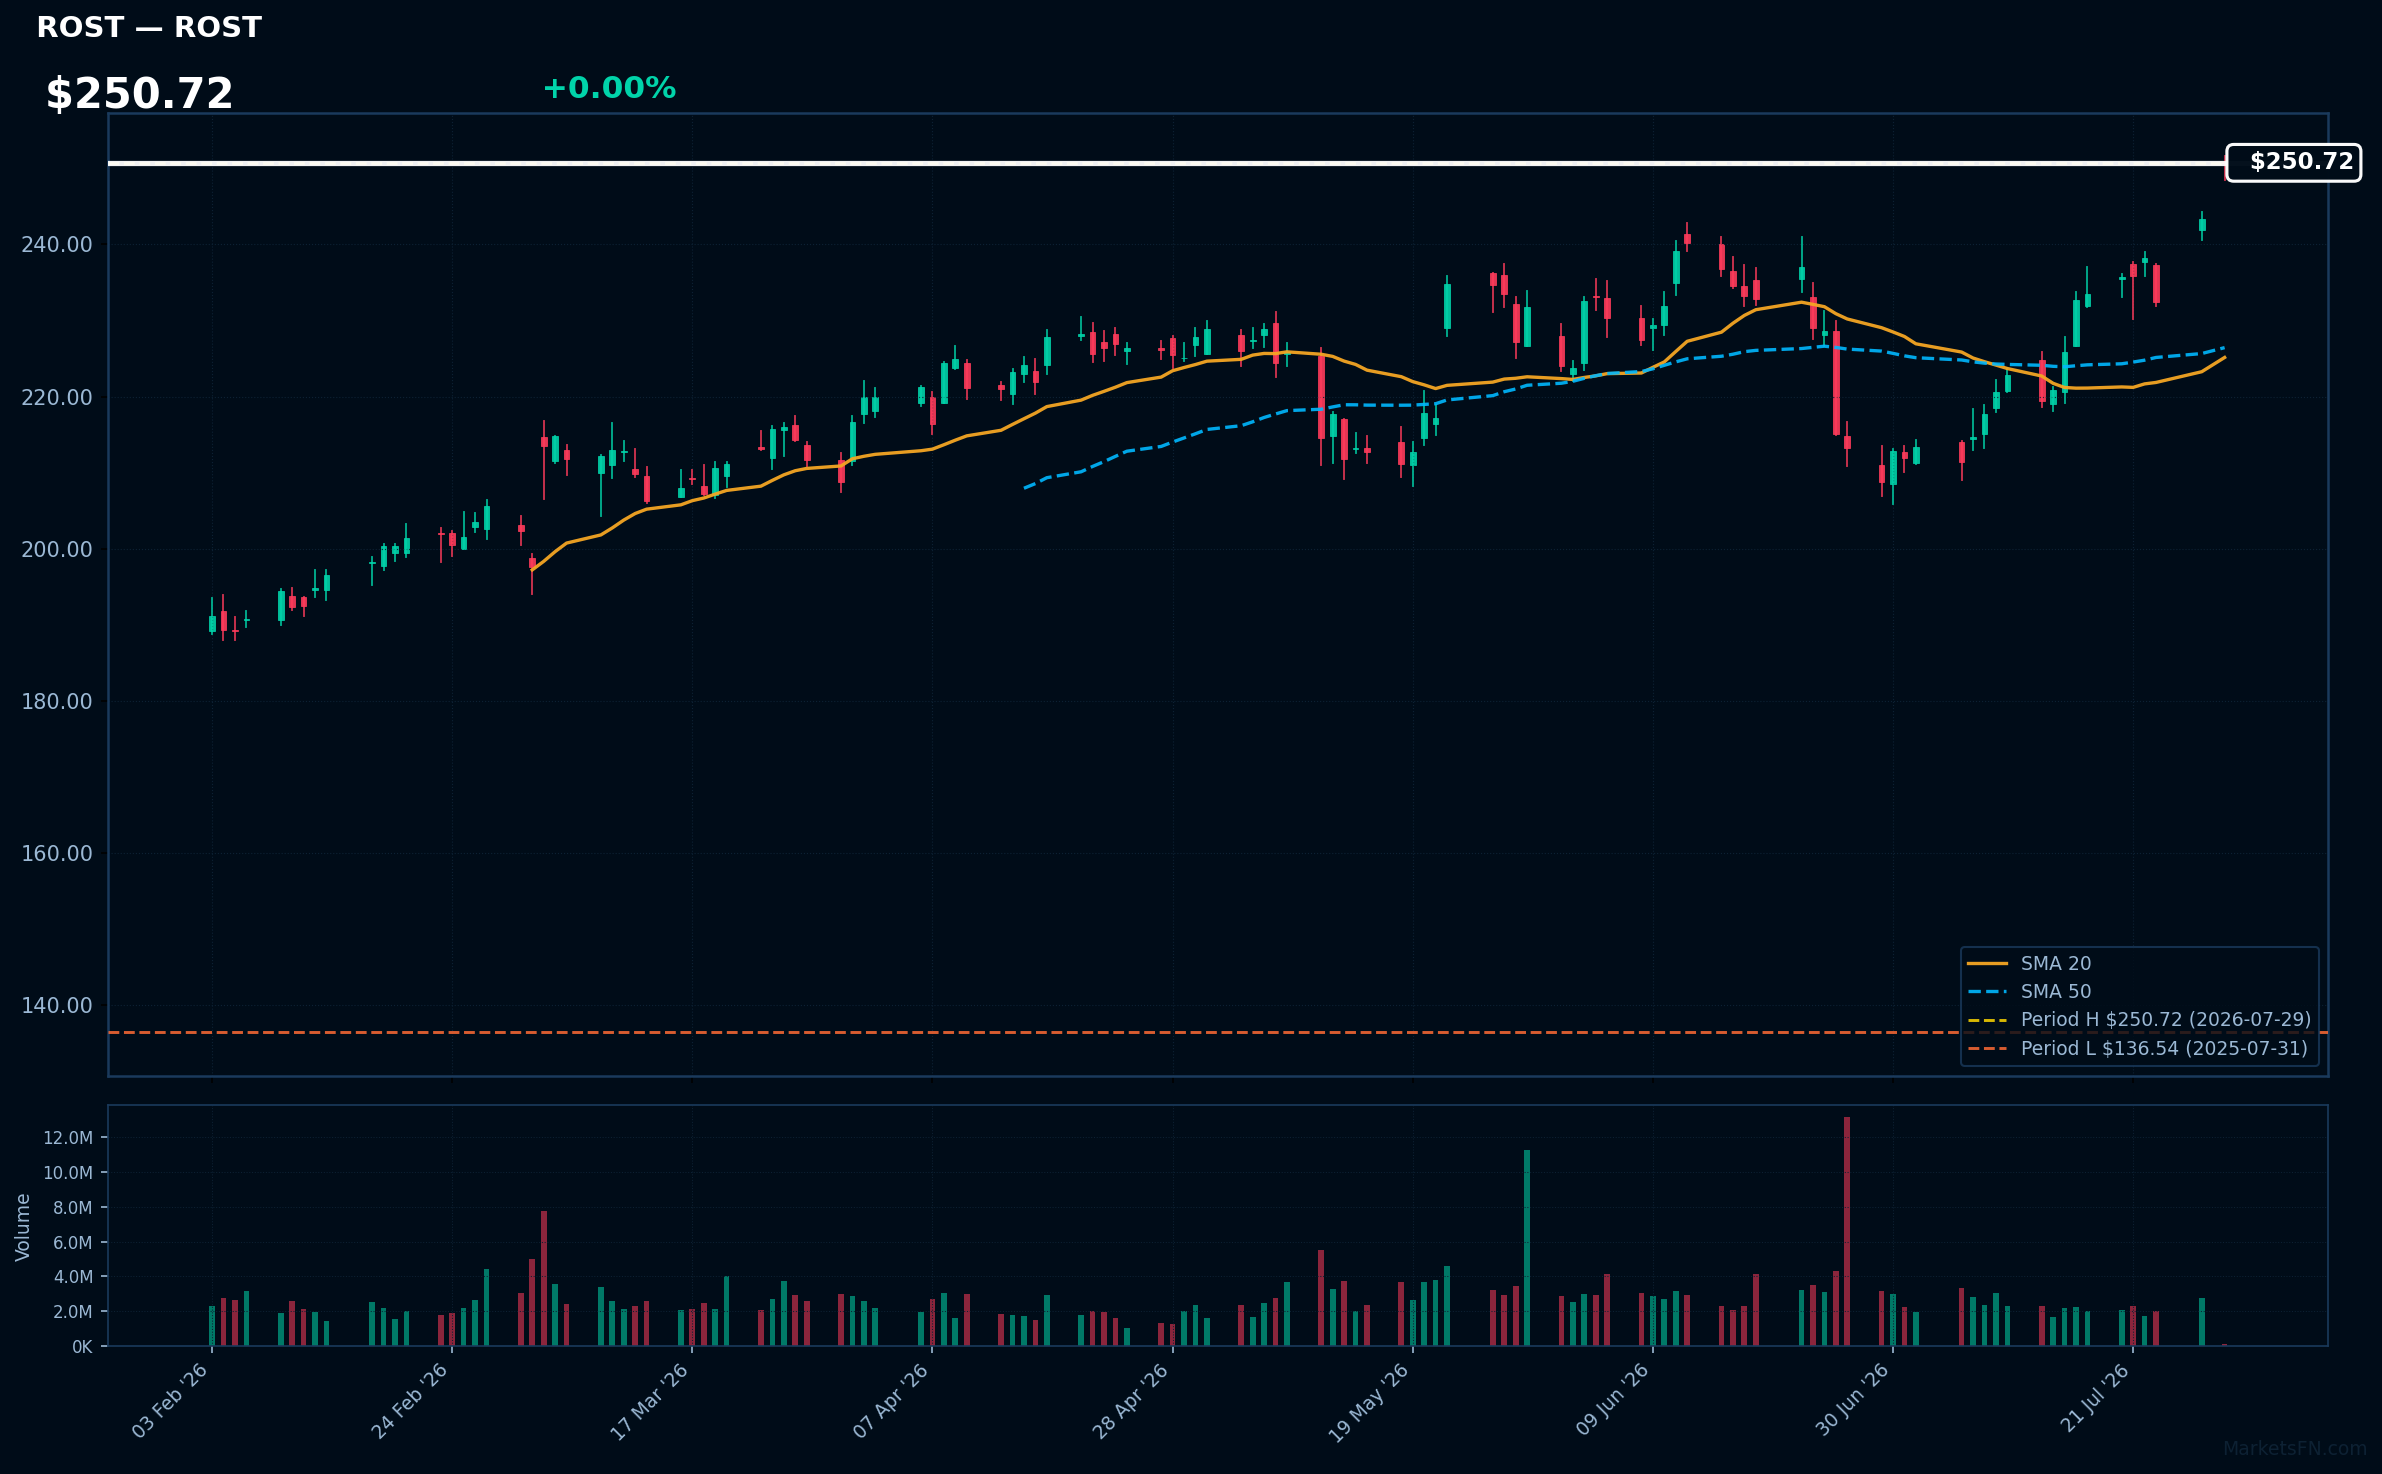
ROST | Ross Stores, Inc | Consumer Cyclical | Price Last: $250.72 | % Realized: +79.65% | RSI: 70.5 | % above MA200: +25.1% | Trend: Above MA20, MA50, MA200
Ross Stores, Inc operates an off-price retail business model, offering discounted branded apparel and home goods. Investors should care about its ability to maintain margins and same-store sales growth amidst a competitive retail landscape.
Ross Stores' technicals indicate strong momentum: RSI(14) is 70.5, with the price above MA20, MA50, and MA200. The stock is at its 52-Week high, having returned 79.7% over the period, suggesting potential for further breakout.
Related headlines
📉 Nearest to 52-Week Low
Sectors represented: Consumer Cyclical (1), Technology (1), Communication Services (1), Real Estate (1), Consumer Defensive (1)
| Ticker | Company | Sector | Price Last | % Realized | 52-Week Low Date | RSI | % above MA200 | Trend |
|---|---|---|---|---|---|---|---|---|
| TSLA | Tesla Inc | Consumer Cyclical | $305.86 | -4.78% | 2025-08-01 | 26.8 | -26.0% | Below MA20, MA50, MA200 |
| SNPS | Synopsys, Inc | Technology | $382.85 | -39.79% | 2026-07-24 | 33.6 | -15.0% | Below MA20, MA50, MA200 |
| NFLX | Netflix Inc | Communication Services | $72.25 | -38.18% | 2026-07-20 | 46.0 | -21.5% | Below MA20, MA50, MA200 |
| CSGP | Costar Group, Inc | Real Estate | $29.02 | -69.64% | 2026-07-23 | 47.4 | -41.7% | Above MA20 · Below MA50, MA200 |
| PEP | PepsiCo Inc | Consumer Defensive | $144.48 | +0.41% | 2026-07-23 | 59.0 | -3.6% | Above MA20, MA50 · Below MA200 |
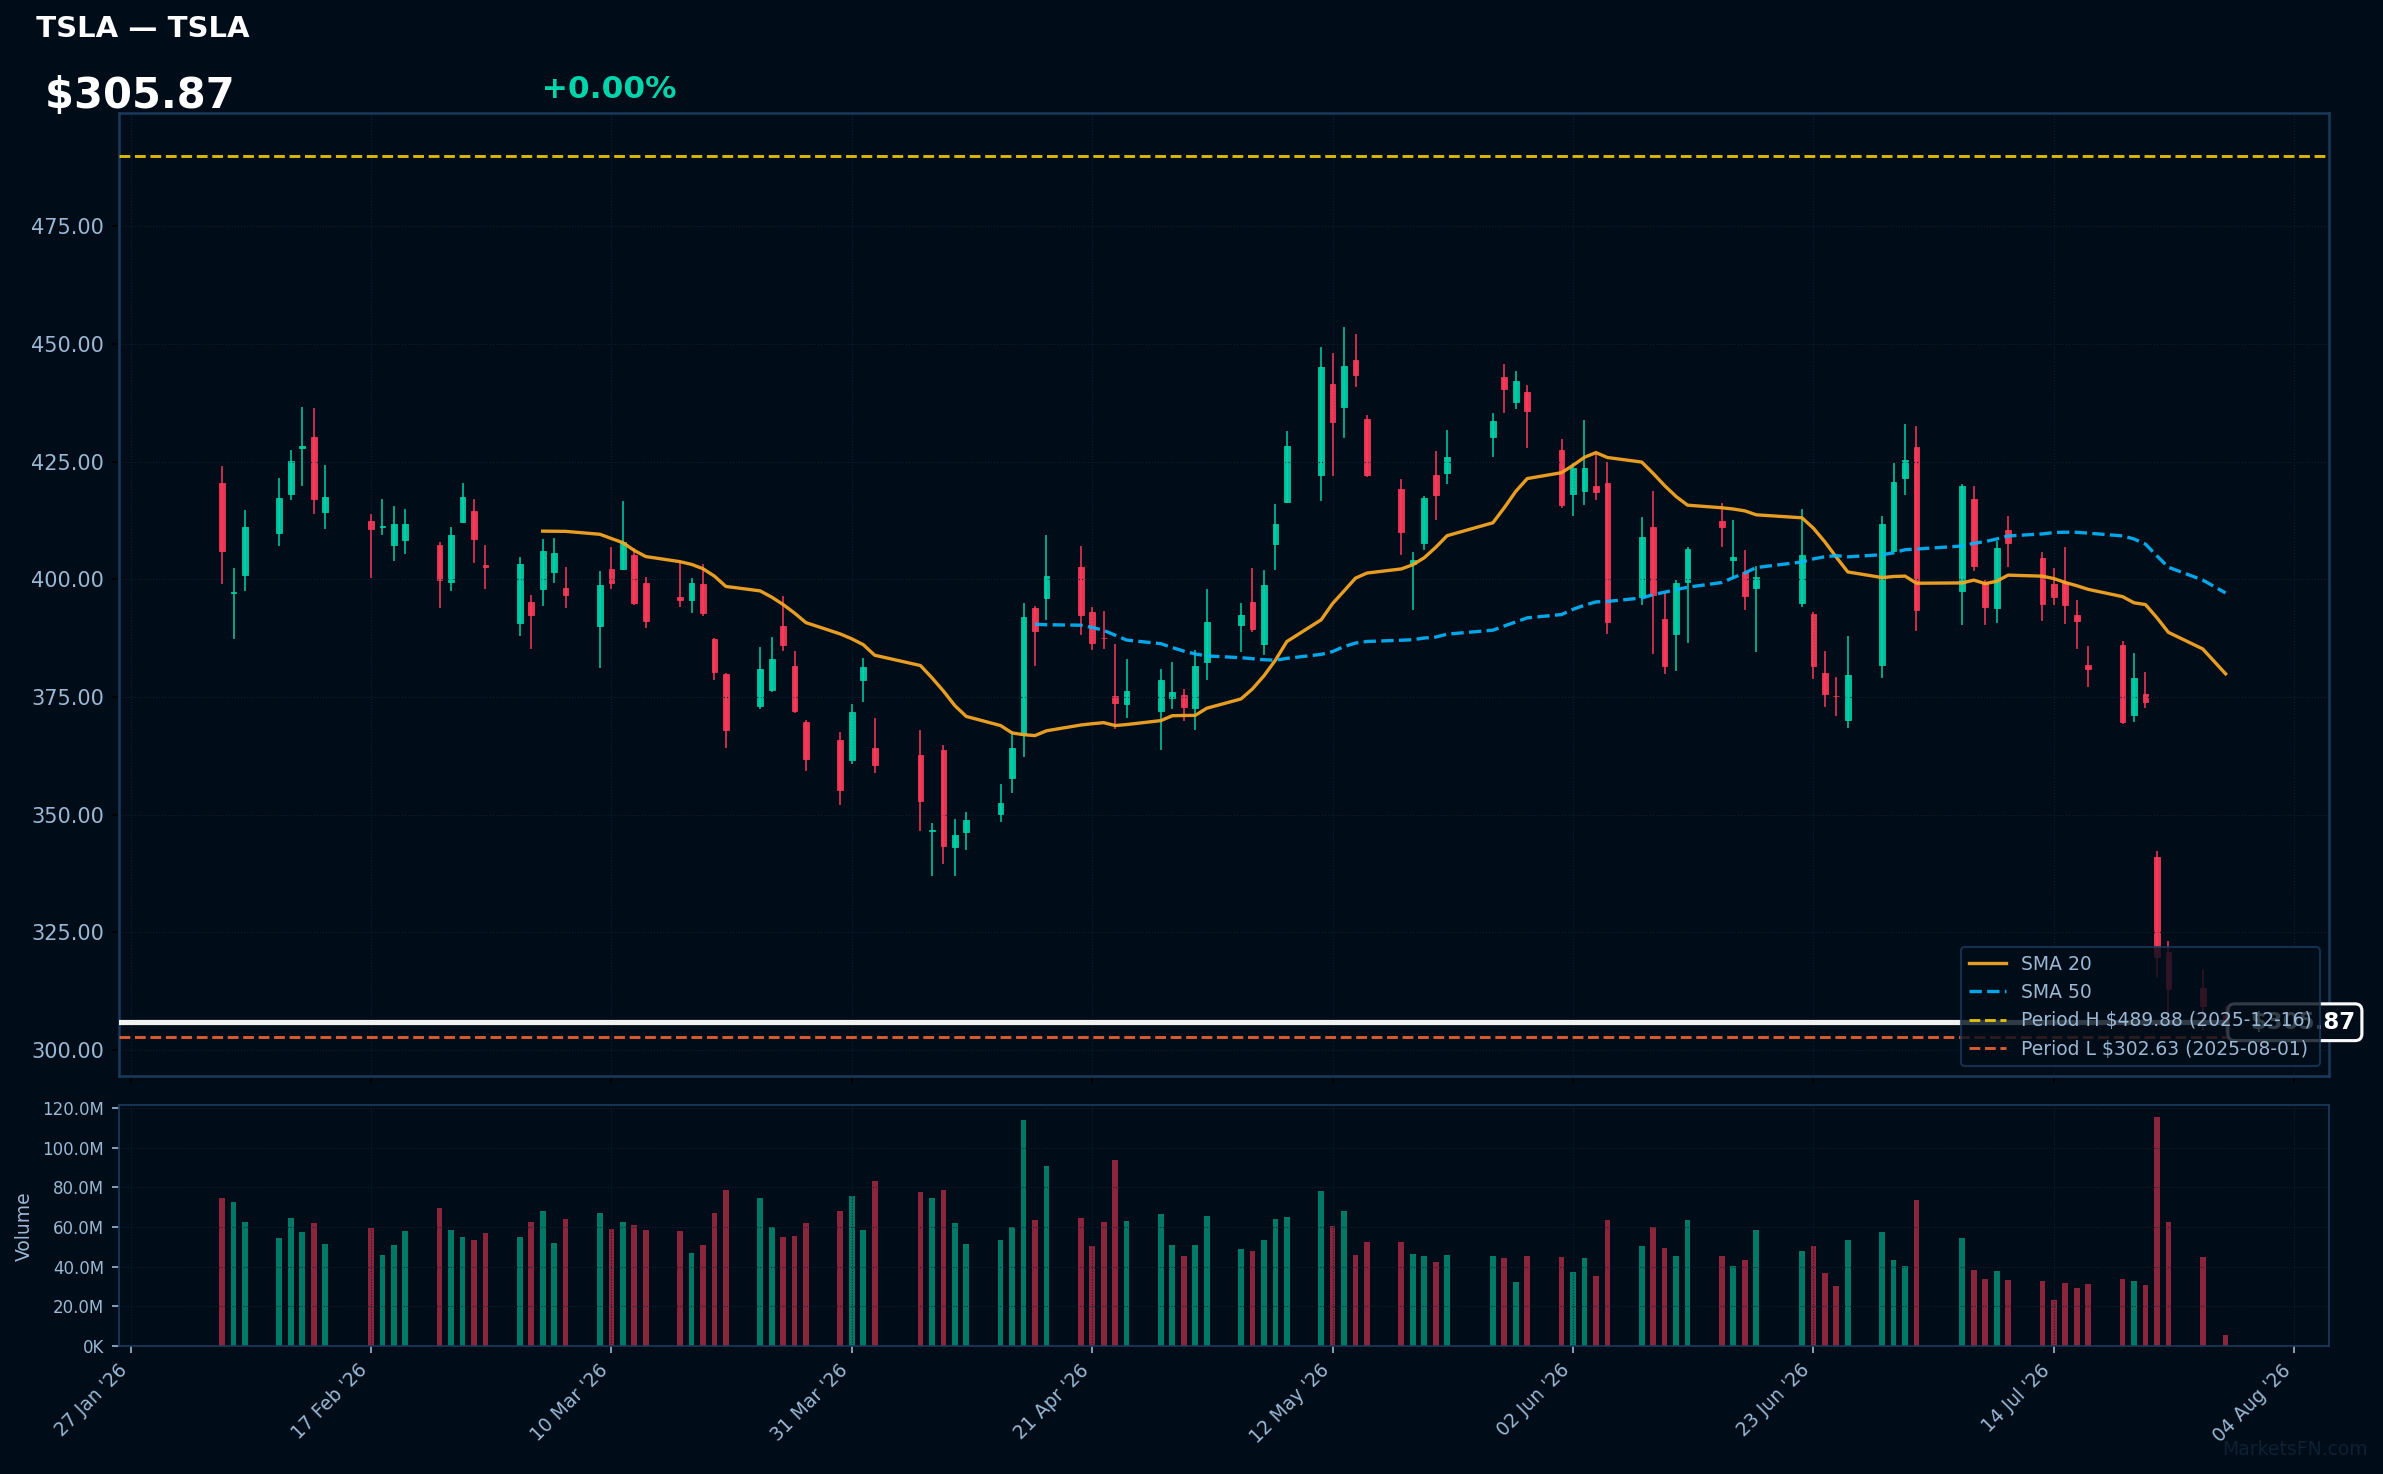
TSLA | Tesla Inc | Consumer Cyclical | Price Last: $305.86 | % Realized: -4.78% | RSI: 26.8 | % above MA200: -26.0% | Trend: Below MA20, MA50, MA200
Tesla Inc is an electric vehicle manufacturer and clean energy company. Investors should care because it's a leader in the EV market and has been disrupting the automotive industry with its innovative products and business model.
Tesla's current technical situation is bearish, with an RSI(14) of 26.8 indicating oversold conditions, and a bearish MA alignment: price ($305.87) < MA20 < MA50 < MA200, suggesting a sustained downtrend, and trading only 1.1% above its 52-Week low.
Related headlines
- Direxion unveils options income ETF suite tied to Nvidia, Tesla and other megacap
- Tesla Stock Falls Again, Putting Trillion-Dollar Status at Risk
- Tesla, ContourGlobal sign 1TWh/year PPA for Project Sterling in Arizona
- A Potential Tesla-SpaceX Merger Could Create Orbit-To-Ground AI Powerhouse With Over $1 Trillion In Chip Savings, Says Analyst
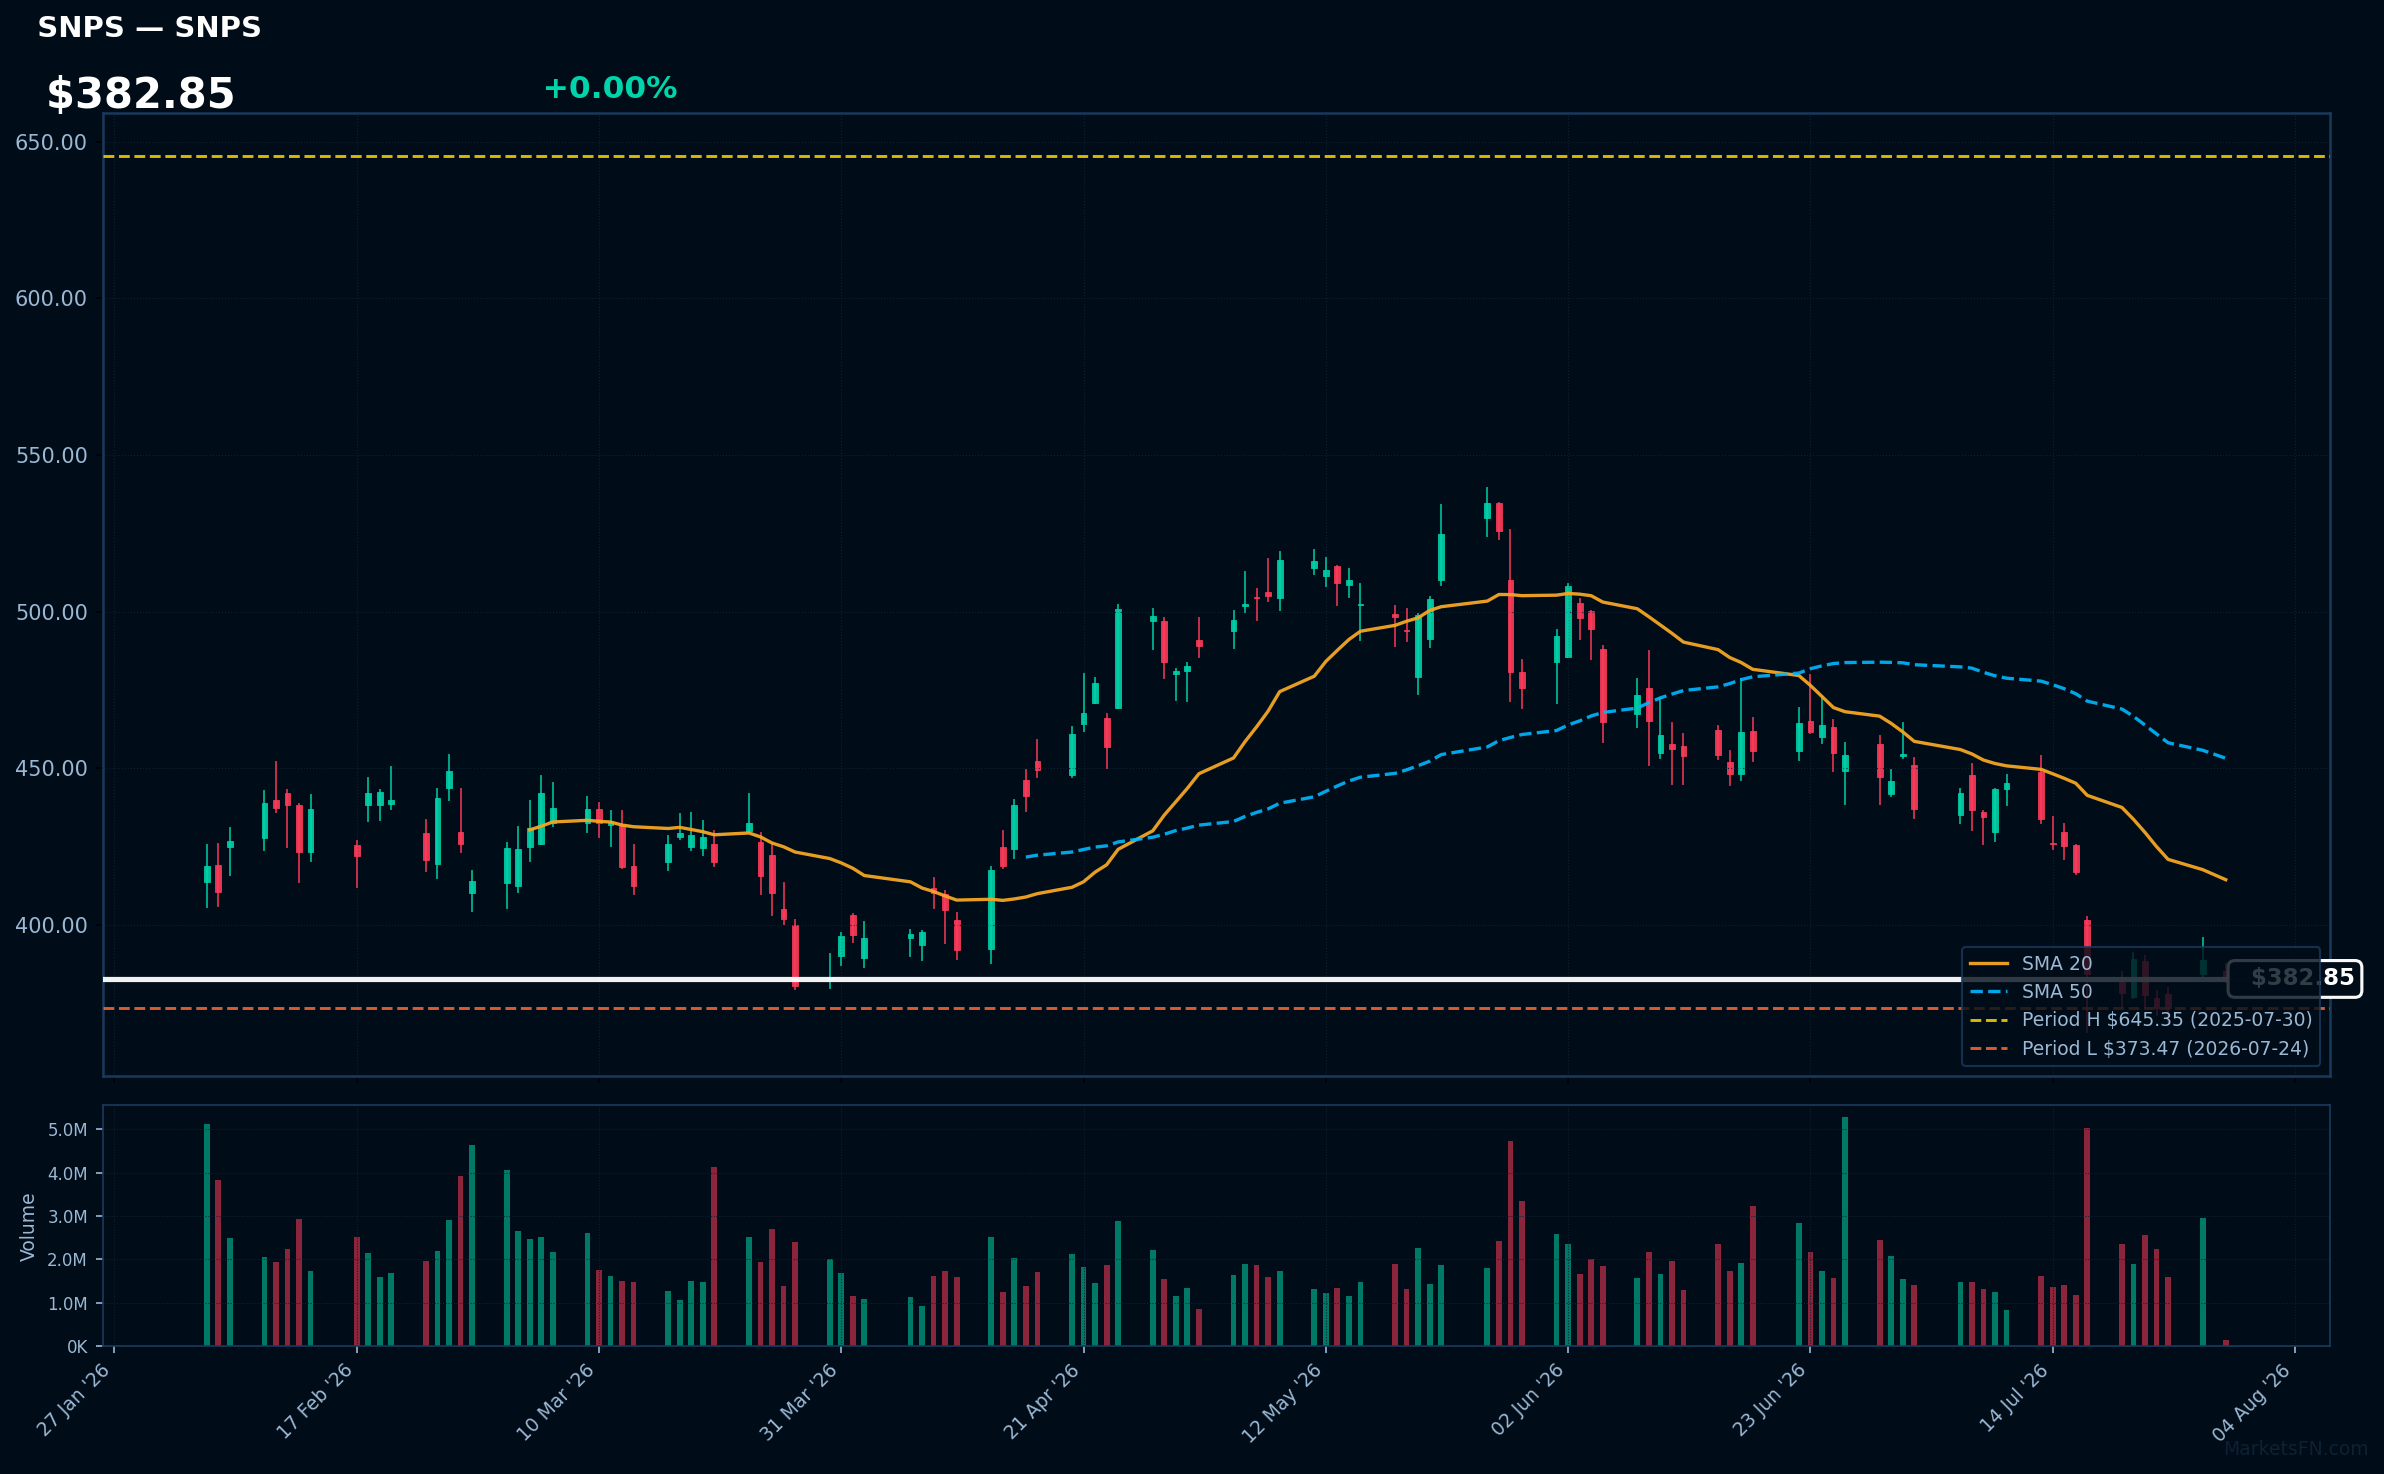
SNPS | Synopsys, Inc | Technology | Price Last: $382.85 | % Realized: -39.79% | RSI: 33.6 | % above MA200: -15.0% | Trend: Below MA20, MA50, MA200
Synopsys, Inc is a software company providing electronic design automation (EDA) tools and semiconductor IP, crucial for chip design and manufacturing. Investors care due to its dominant position in the EDA market and exposure to semiconductor industry trends.
Synopsys' technical situation is bearish: RSI(14) is 33.6, indicating oversold conditions, and the stock is below MA20, MA50, and MA200 with a 52-Week low proximity of 2.5%, suggesting major support testing after a -39.8% 52-Week return.
Related headlines
- Synopsys unveils autonomous chip design workflows with Microsoft and AMD collaboration
- Synopsys and Intel Foundry Fast-Track Customer Readiness from Silicon to Systems on Intel 14A
- Synopsys Advances Agentic AI Chip Design with AMD and Microsoft
- Synopsys Showcases Comprehensive Autonomous Engineering Workflows from Silicon to Systems, Developed with NVIDIA Technology
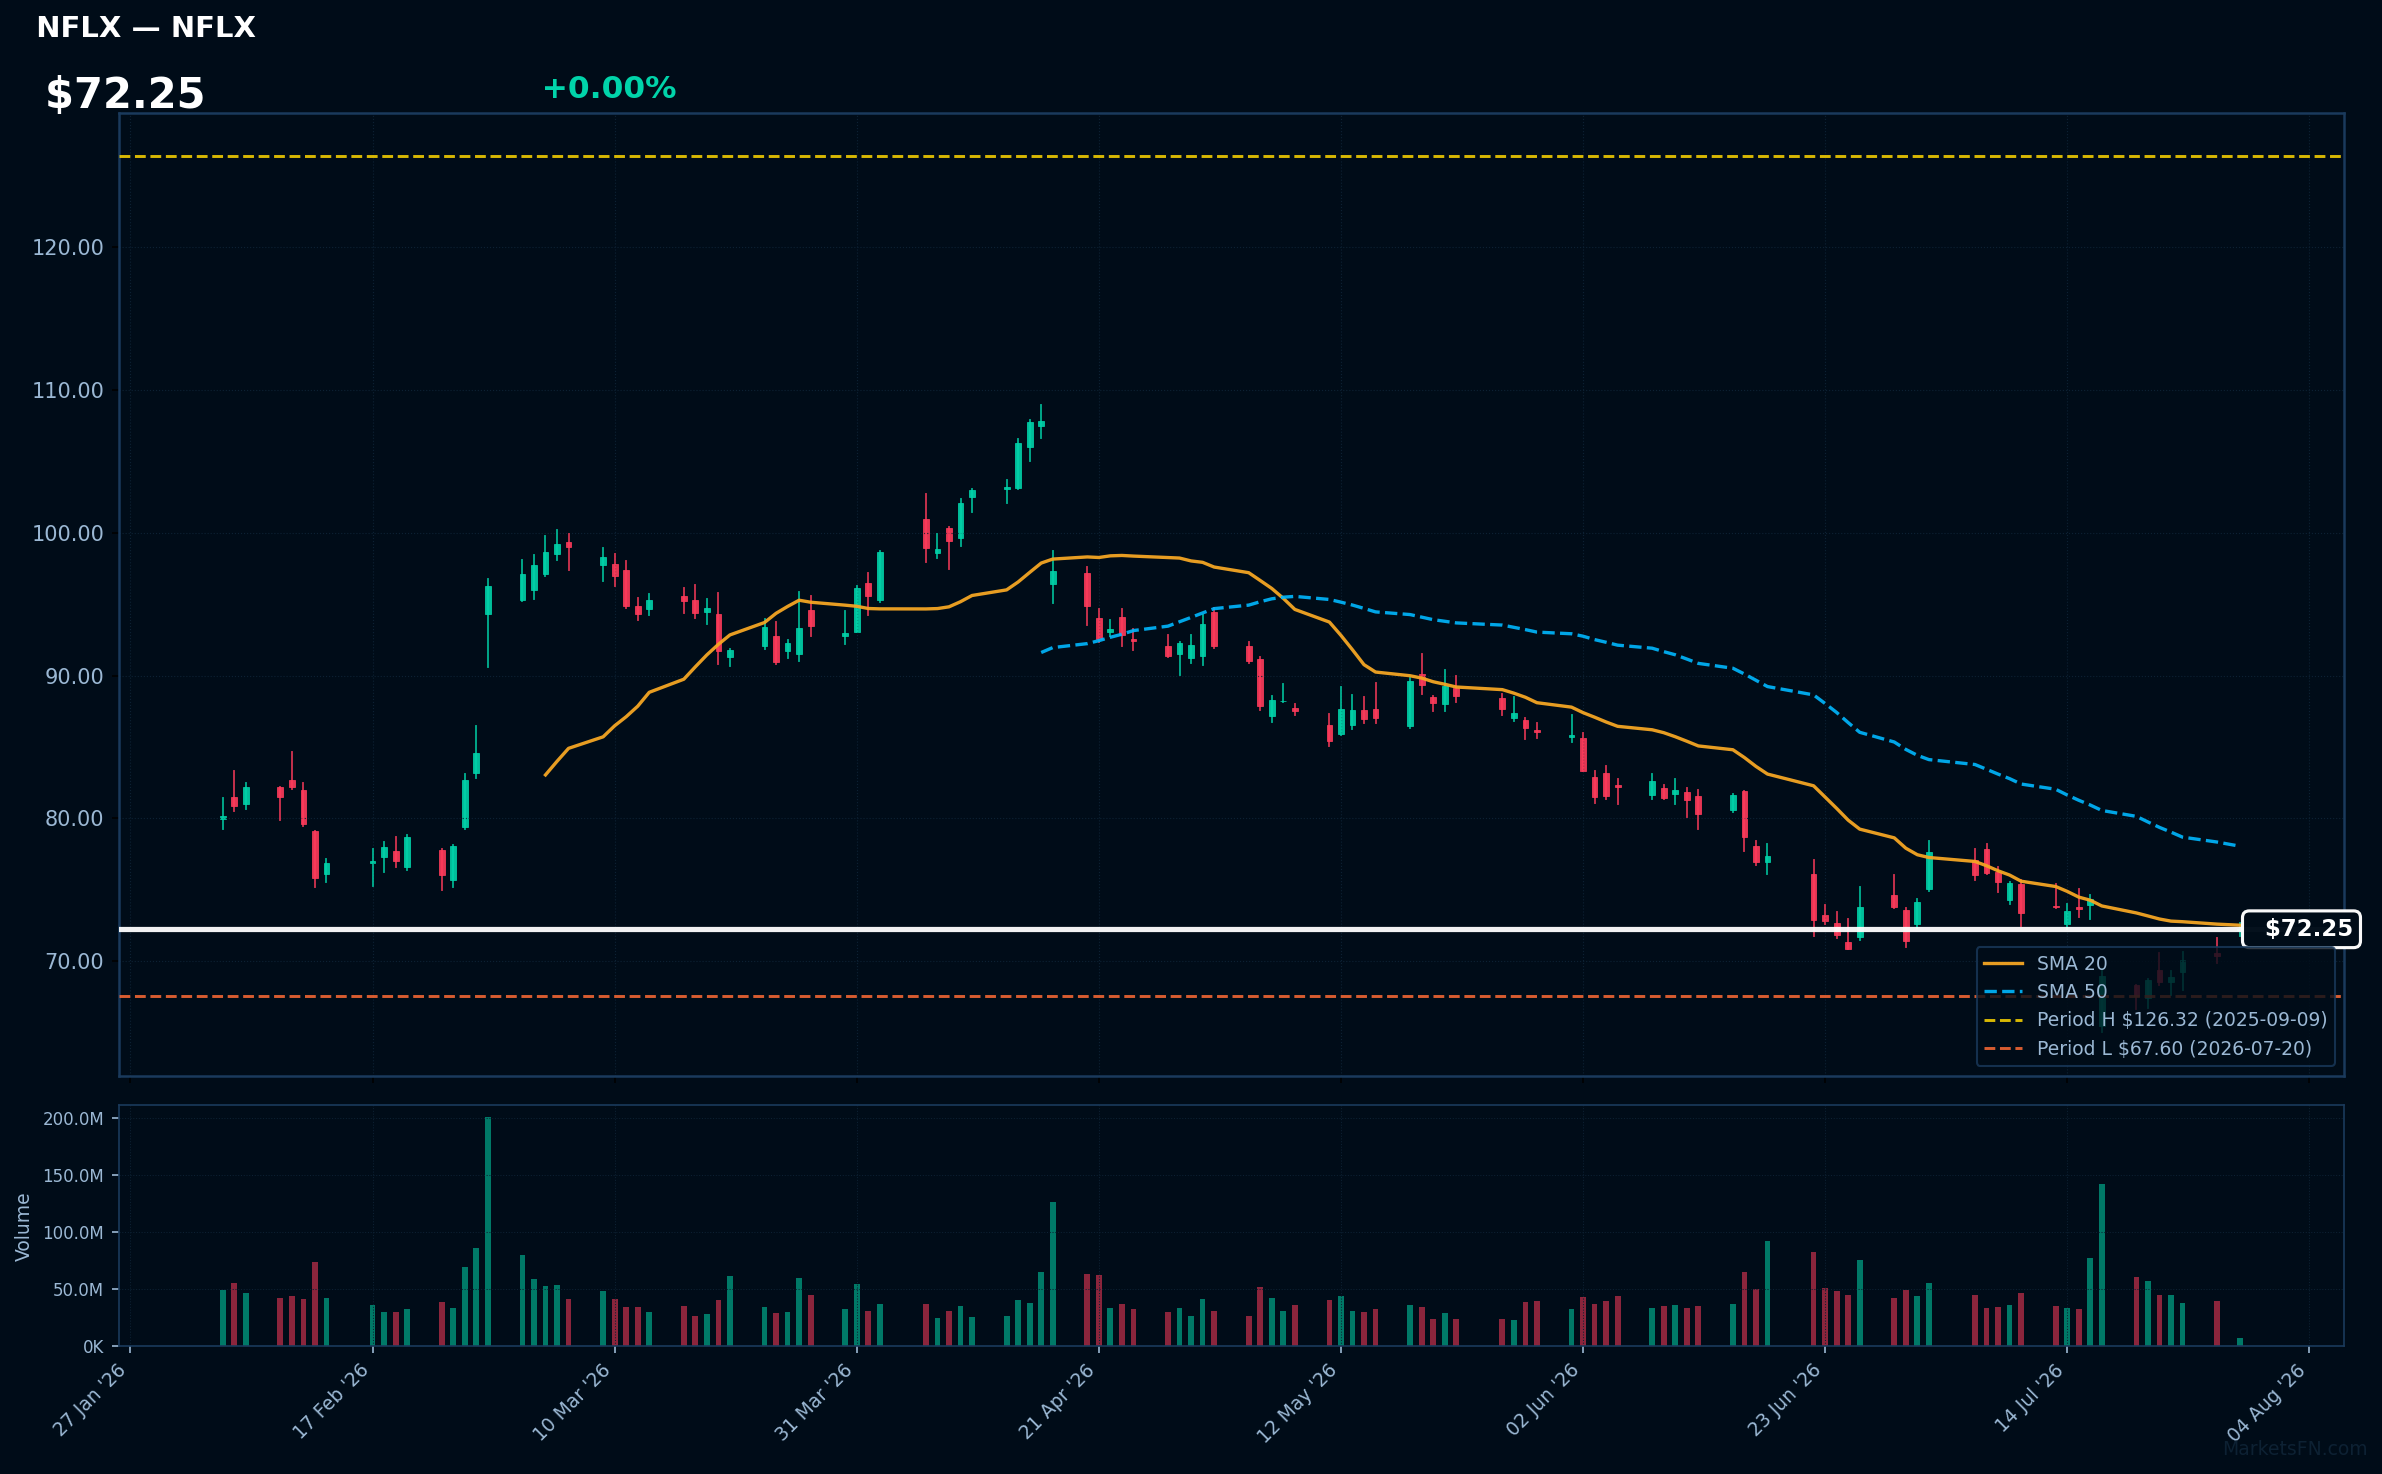
NFLX | Netflix Inc | Communication Services | Price Last: $72.25 | % Realized: -38.18% | RSI: 46.0 | % above MA200: -21.5% | Trend: Below MA20, MA50, MA200
Netflix Inc is a global streaming entertainment service offering a wide variety of TV series, documentaries, and feature films. Investors care about its subscriber growth, content pipeline, and pricing power, which drive revenue and profitability.
NFLX is in a sustained downtrend with price ($72.25) below MA20, MA50, and MA200. RSI(14) is 46.0, nearing oversold territory. The stock is 6.9% above its 52-Week low, testing major support, indicating a warning sign.
Related headlines
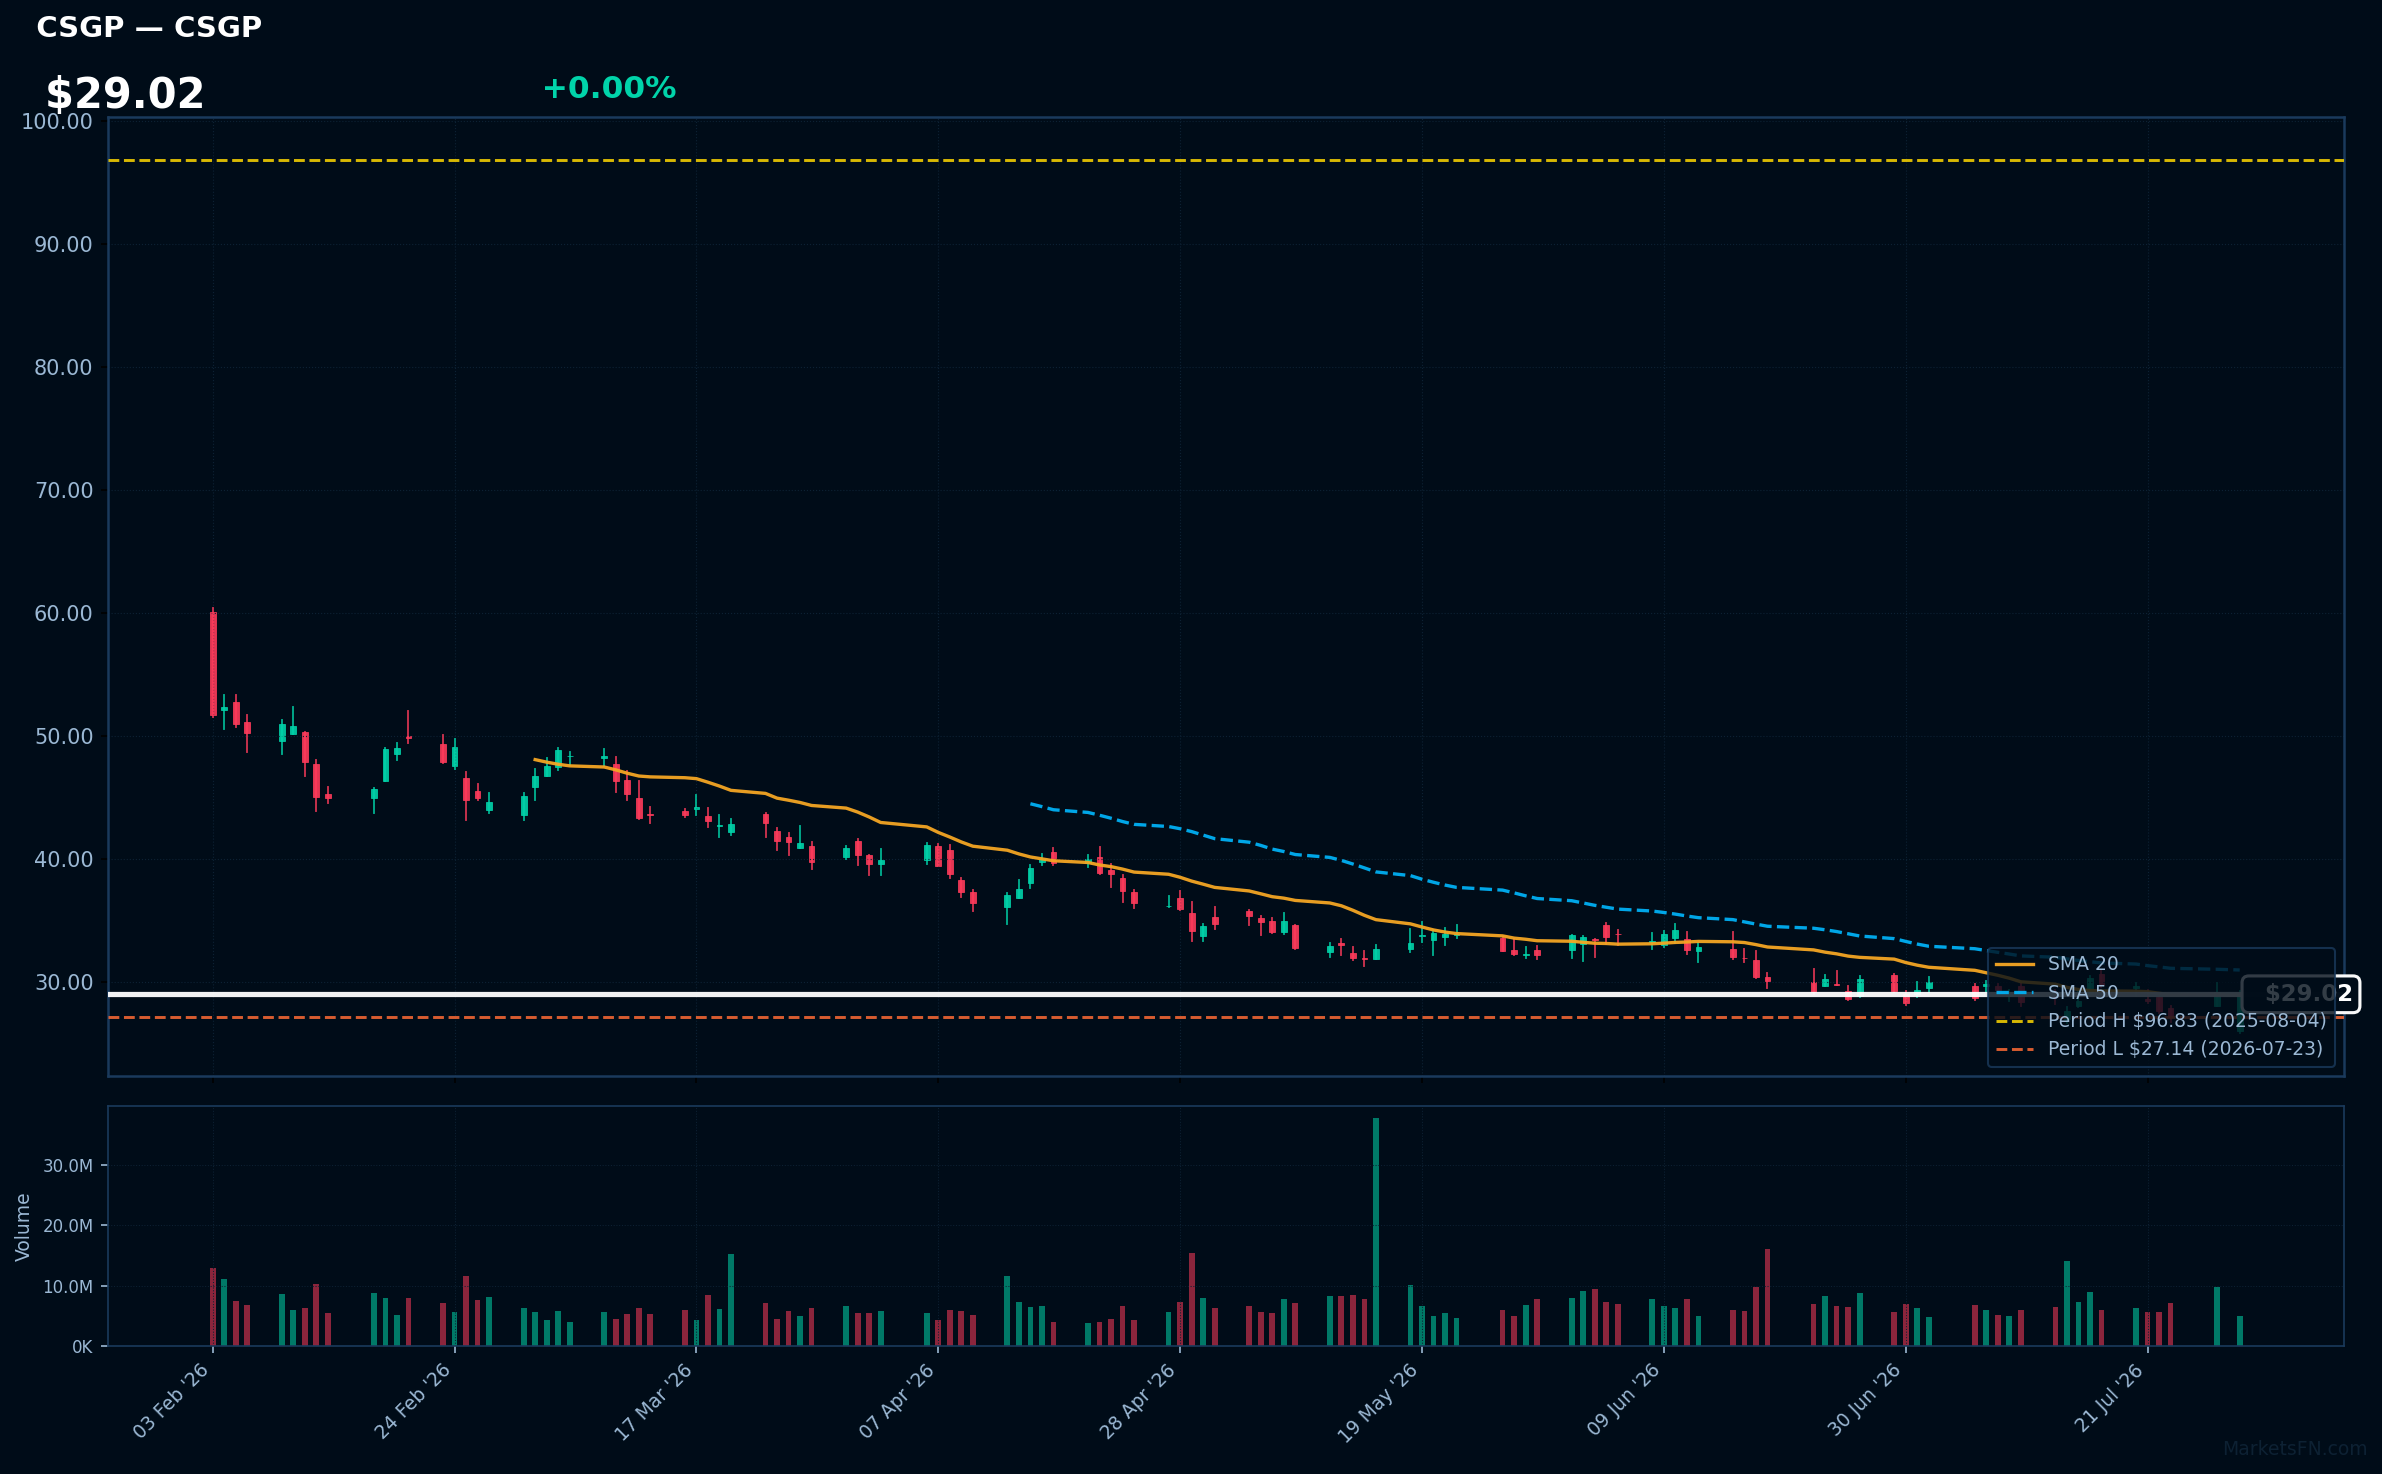
CSGP | Costar Group, Inc | Real Estate | Price Last: $29.02 | % Realized: -69.64% | RSI: 47.4 | % above MA200: -41.7% | Trend: Above MA20 · Below MA50, MA200
Costar Group, Inc provides commercial real estate information, analytics, and online marketplaces, enabling investors to assess market trends and make informed decisions. Its data-driven insights are crucial for investors to navigate the commercial real estate market.
The stock's RSI(14) is 47.4, indicating neutral momentum. With the price above MA20 but below MA50/MA200, it shows mixed signals. Being only 6.9% above its 52-Week low, it is testing major support, potentially a warning sign.
Related headlines
- CoStar Shares Slide After Revenue Guidance Overshadows Strong Profit Growth
- CoStar Group Inc (CSGP) Q2 2026 Earnings Call Highlights: Record Revenue Growth and Strategic ...
- CoStar: Q2 Earnings Snapshot
- CoStar Group Q2 2026 Results Mark a Profitability Inflection with Revenue Up 18%, Net Income Increasing 817%, and Adjusted EBITDA More Than Doubling Year-over-Year
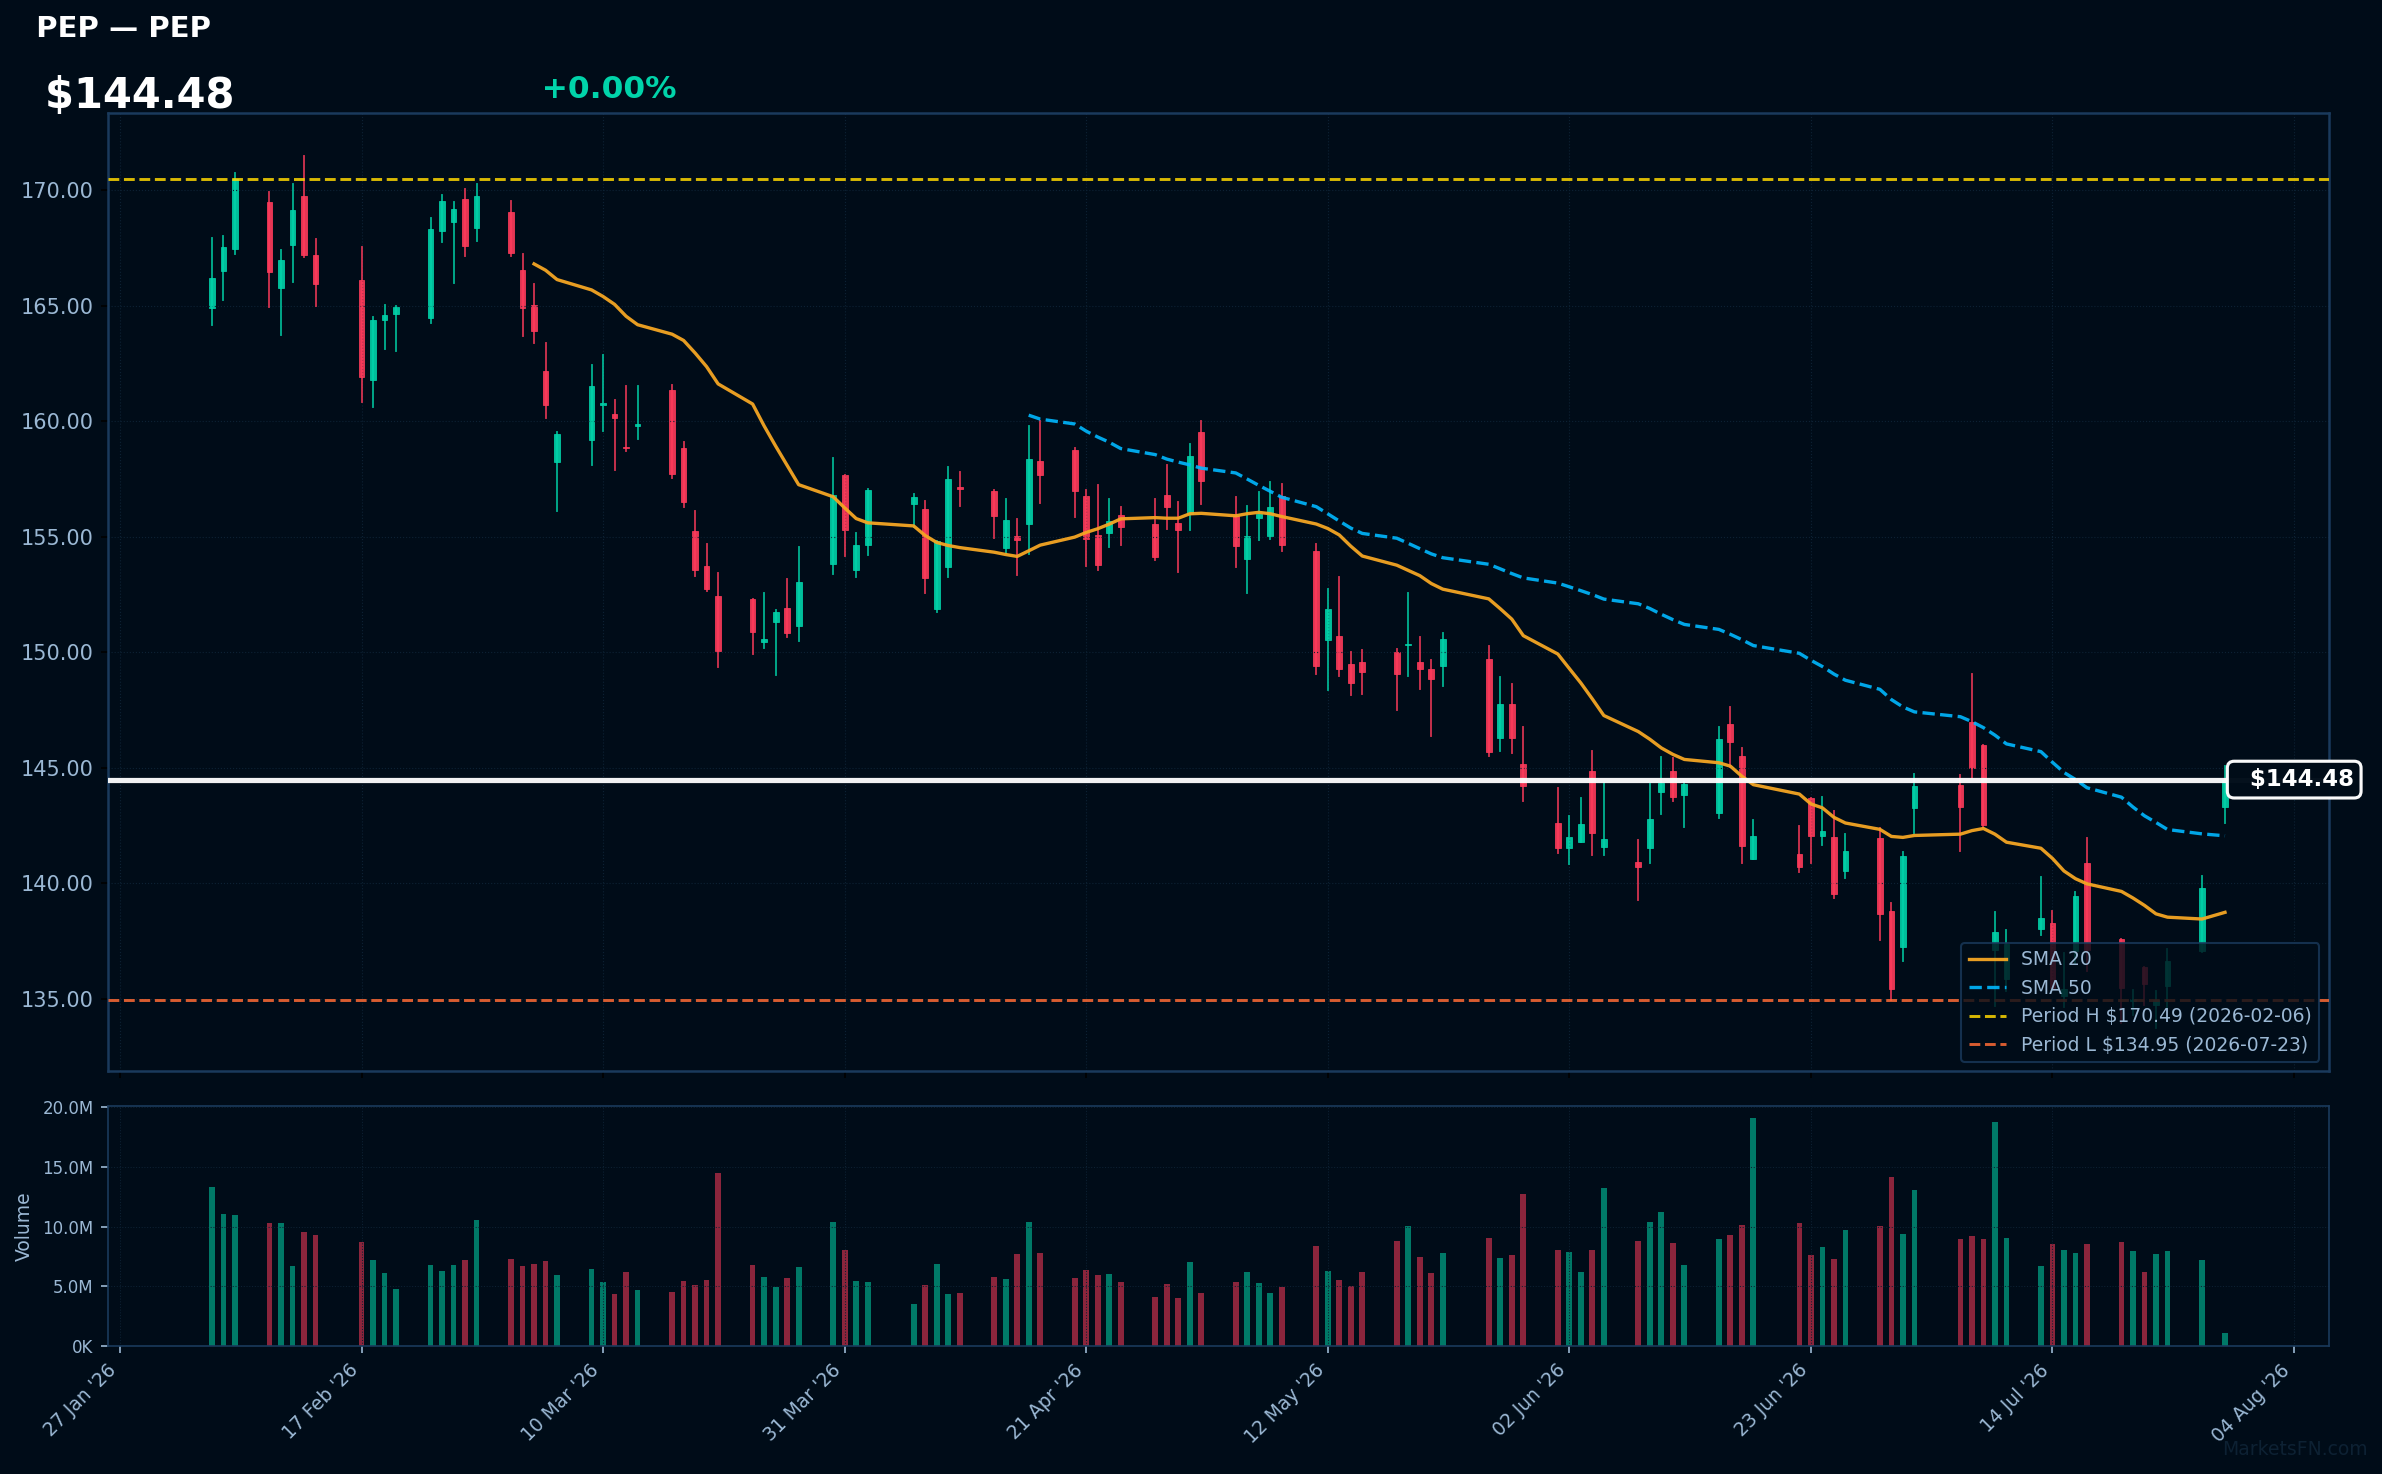
PEP | PepsiCo Inc | Consumer Defensive | Price Last: $144.48 | % Realized: +0.41% | RSI: 59.0 | % above MA200: -3.6% | Trend: Above MA20, MA50 · Below MA200
PepsiCo Inc is a diversified food and beverage company with brands like Pepsi, Lay's, and Gatorade, generating revenue through beverage sales, snack foods, and other categories, making it a significant player in the consumer staples sector.
PepsiCo's technicals show mixed signals: RSI(14) at 59.0 indicates neutral momentum, price above MA20/MA50 but below MA200; it's 7.1% above its 52-Week low, testing major support, with a 0.4% return over the 52-Week period, suggesting a lack of strong trend.
Related headlines
Market Commentary
The Nasdaq 100 stocks are currently trading near 52-week extremes, with some stocks at all-time highs and others near their lowest levels. Stocks like AAPL, AMGN, ABNB, PCAR, and ROST are at 0.0% from their 52-week highs, while TSLA, SNPS, NFLX, CSGP, and PEP are above their 52-week lows, indicating a divergence in performance within the index.
The technology sector is a significant component of the Nasdaq 100, and the current price levels may be driven by various macro themes and sector-specific trends. The stocks at 52-week highs are largely from diverse sectors, including technology (AAPL), healthcare (AMGN), and consumer discretionary (ABNB), while those near 52-week lows include technology (TSLA, SNPS, NFLX, CSGP) and consumer staples (PEP).
Key levels to watch include the 52-week extremes, as a breakout or breakdown could signal further direction. For stocks near 52-week highs, a failure to sustain these levels could indicate a potential reversal, while stocks near 52-week lows may face resistance if they attempt to rally. Catalysts such as earnings reports and macroeconomic data releases could drive price movements and determine the next direction for these stocks.
Methodology: All 101 Nasdaq 100 constituents screened. 52-week high = highest daily close over the past 252 trading days (approx. 1 year). 52-week low = lowest daily close over the same period. Distance = (current price / extreme − 1) × 100. Technical indicators computed on up to 1 year of daily OHLCV data.
Disclaimer: For informational purposes only. Not investment advice. Past performance is not indicative of future results.

