Nasdaq 100 52-Week Highs & Lows Radar: Crowdstrike (CRWD), Copart, (CPRT) and more
MarketsFN Team

Nasdaq 100 52-Week Highs & Lows Radar: Crowdstrike (CRWD), Copart, (CPRT) and more
Screening all 101 Nasdaq 100 constituents for stocks nearest to their 52-week high and their 52-week low. Data as of September 30, 2026. % Realized = 52-week total return.
Legend: RSI > 70 = overbought · RSI < 30 = oversold · Green % Realized = positive 52W return · Red = negative.
📈 Nearest to 52-Week High
Sectors represented: Technology (4), Communication Services (1)
| Ticker | Company | Sector | Price Last | % Realized | 52-Week High Date | RSI | % above MA200 | Trend |
|---|---|---|---|---|---|---|---|---|
| CRWD | Crowdstrike Holdings Inc | Technology | $263.96 | +115.31% | 2026-09-30 | 66.5 | +73.5% | Above MA20, MA50, MA200 |
| PANW | Palo Alto Networks Inc | Technology | $395.65 | +94.31% | 2026-08-13 | 60.5 | +59.4% | Above MA20, MA50, MA200 |
| WBD | Warner Bros. Discovery Inc | Communication Services | $30.83 | +57.86% | 2026-09-28 | 74.2 | +11.4% | Above MA20, MA50, MA200 |
| AAPL | Apple Inc | Technology | $338.34 | +32.88% | 2026-09-25 | 58.7 | +17.2% | Above MA20, MA50, MA200 |
| FTNT | Fortinet Inc | Technology | $177.14 | +110.68% | 2026-09-23 | 60.7 | +50.6% | Above MA20, MA50, MA200 |
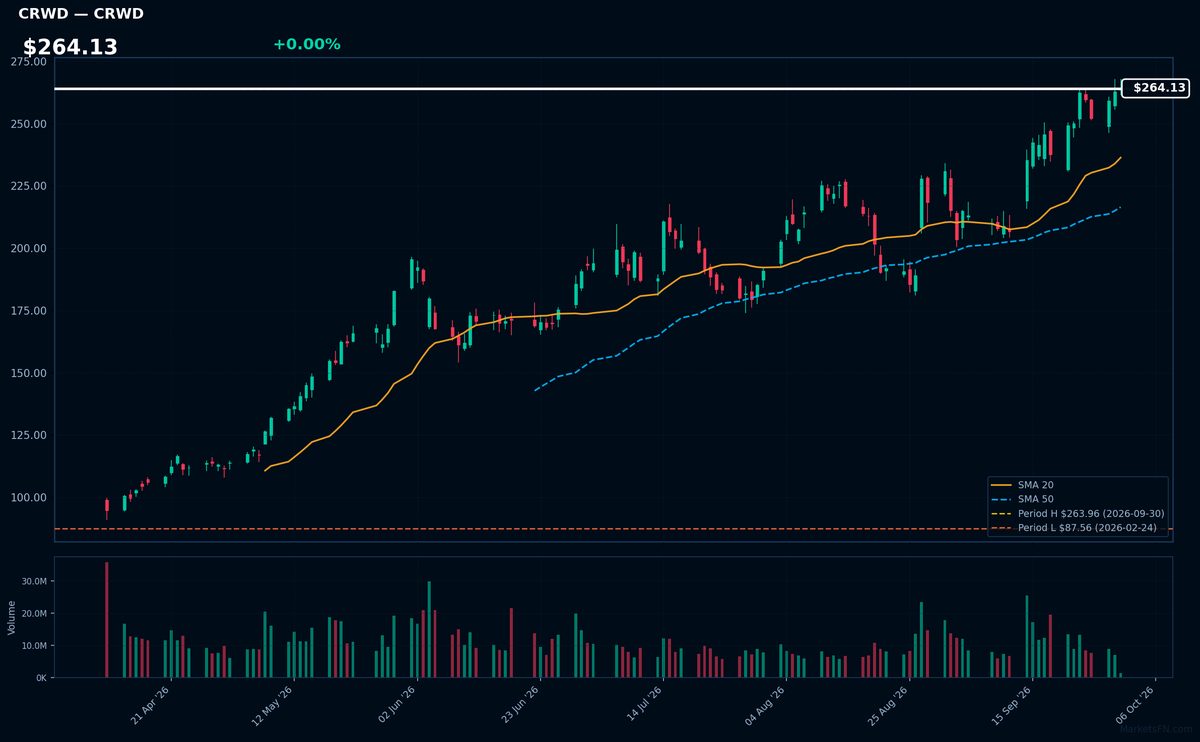
CRWD | Crowdstrike Holdings Inc | Technology | Price Last: $263.96 | % Realized: +115.31% | RSI: 66.5 | % above MA200: +73.5% | Trend: Above MA20, MA50, MA200
Crowdstrike Holdings Inc is a cybersecurity company providing cloud-delivered protection for endpoints, cloud workloads, and identities. Investors should care because its innovative Falcon platform has driven significant growth, making it a key player in the rapidly expanding cybersecurity market.
Crowdstrike's technicals indicate sustained uptrend with price > MA20 > MA50 > MA200. RSI(14) is 66.5, nearing overbought territory. The stock is 0.0% below its 52-Week high, suggesting potential breakout momentum, not a warning sign, with a 115.3% 52-Week return.
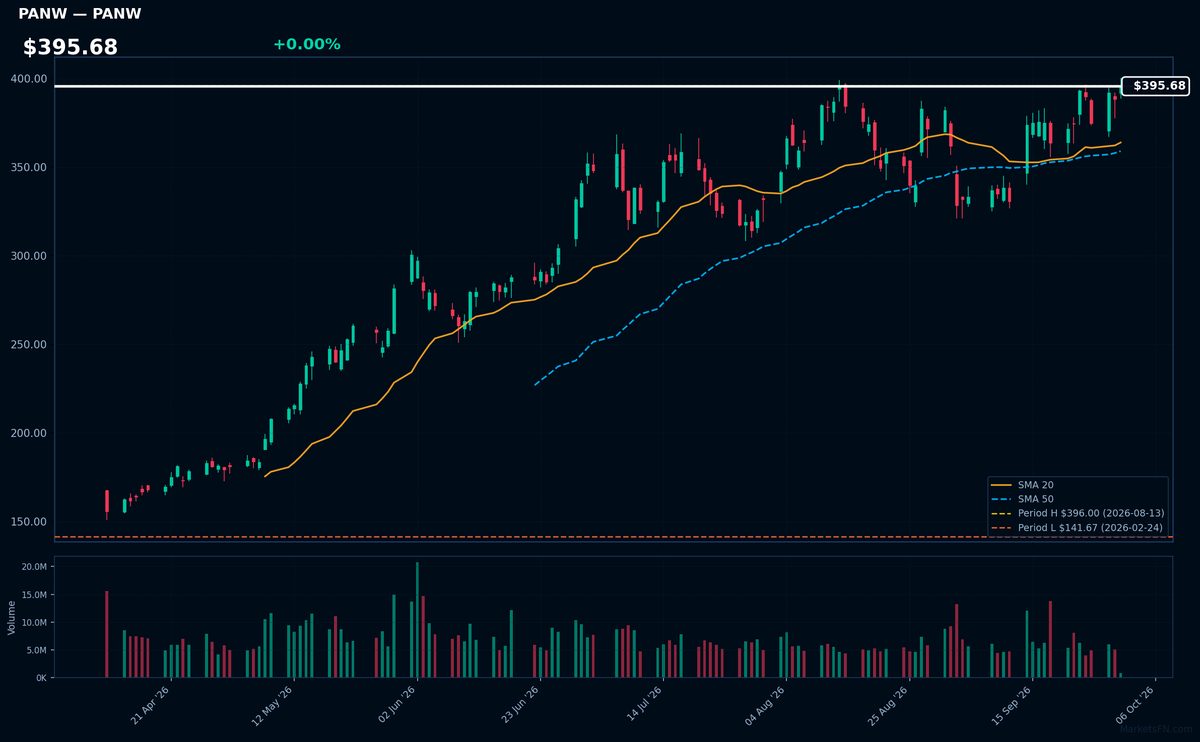
PANW | Palo Alto Networks Inc | Technology | Price Last: $395.65 | % Realized: +94.31% | RSI: 60.5 | % above MA200: +59.4% | Trend: Above MA20, MA50, MA200
Palo Alto Networks Inc is a cybersecurity company providing advanced threat prevention and security solutions. Investors should care due to its strong market position and innovative products that address evolving cyber threats, driving growth.
Palo Alto Networks Inc is near a breakout at $396.42 (0.1% away from 52-Week high), with RSI(14) at 60.5, indicating rising momentum. Bullish MA alignment (price > MA20 > MA50 > MA200) confirms sustained uptrend, suggesting continued strength.
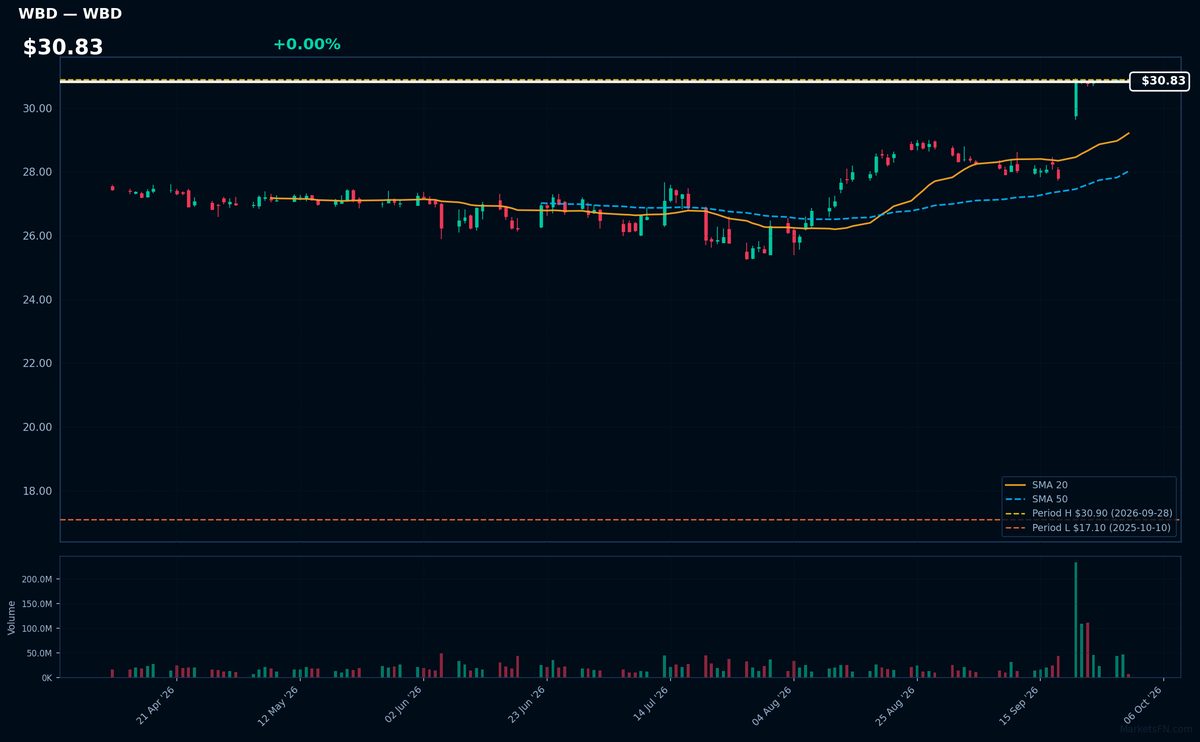
WBD | Warner Bros. Discovery Inc | Communication Services | Price Last: $30.83 | % Realized: +57.86% | RSI: 74.2 | % above MA200: +11.4% | Trend: Above MA20, MA50, MA200
Warner Bros. Discovery Inc is a media conglomerate with a diverse portfolio of entertainment and news assets, including HBO, Warner Bros., and Discovery Channel, making it a significant player in content creation and distribution, which is crucial for investors due to its influence on the global media landscape.
Warner Bros. Discovery Inc is near a potential breakout, 0.2% below its 52-Week high, with an RSI(14) of 74.2, indicating strong momentum. The MA alignment is bullish (price > MA20 > MA50 > MA200), suggesting a sustained uptrend, with a 57.9% return over the 52-Week period.
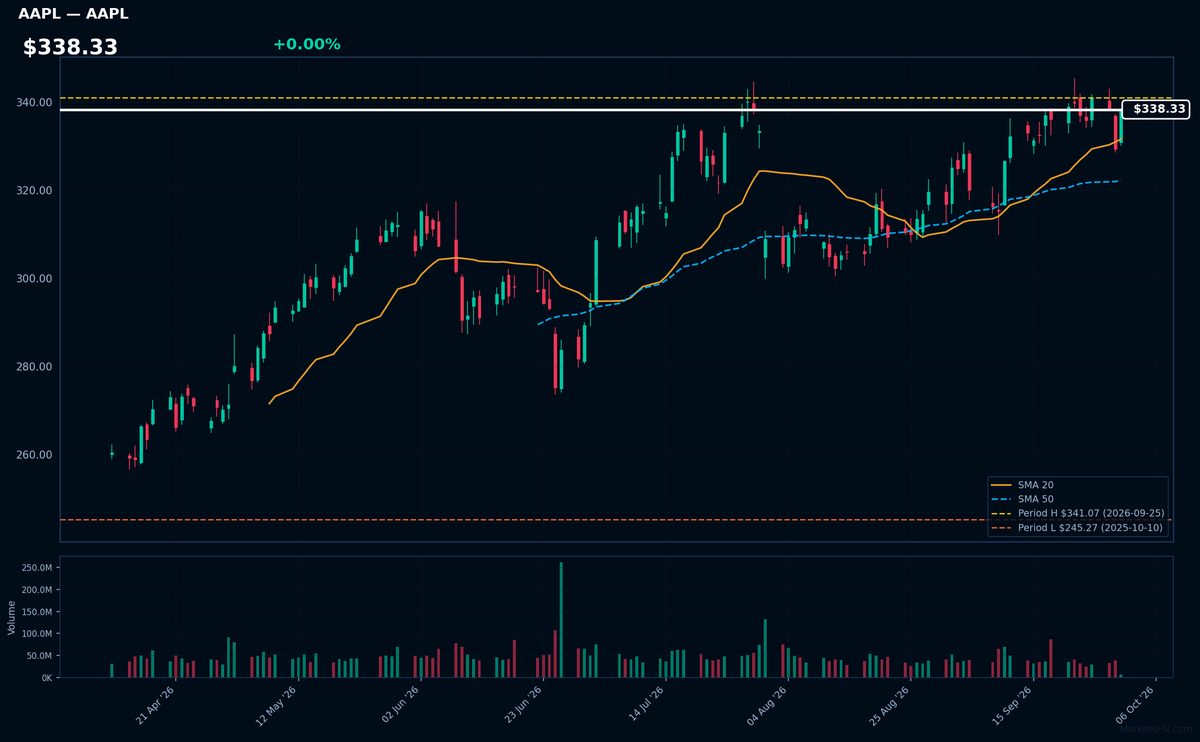
AAPL | Apple Inc | Technology | Price Last: $338.34 | % Realized: +32.88% | RSI: 58.7 | % above MA200: +17.2% | Trend: Above MA20, MA50, MA200
Apple Inc designs, manufactures, and markets consumer electronics, software, and services. Investors care about its innovative product ecosystem, services growth, and profitability. Its flagship products like iPhones drive revenue, while services like Apple Music and iCloud contribute to profitability.
AAPL is in a sustained uptrend with price > MA20 > MA50 > MA200. The RSI(14) is 58.7, indicating moderate momentum. Being 0.8% below its 52-Week high suggests a potential breakout, supported by a 32.9% 52-Week return, signaling strong recent performance.
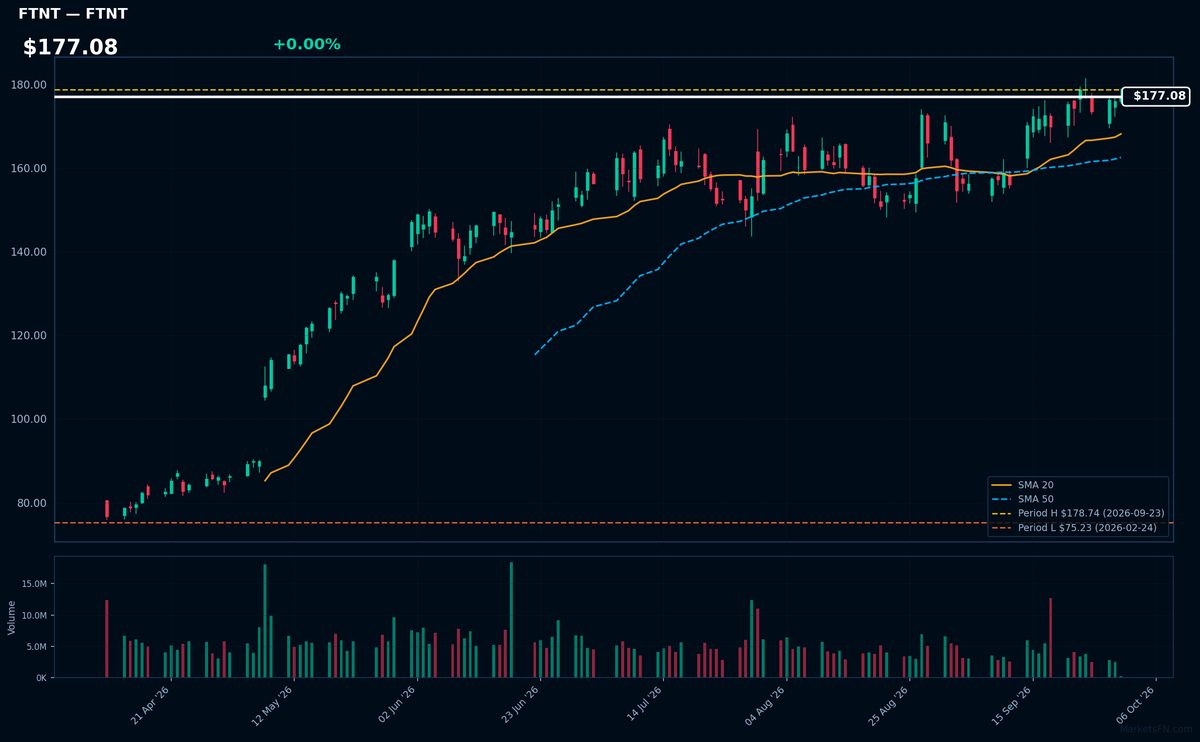
FTNT | Fortinet Inc | Technology | Price Last: $177.14 | % Realized: +110.68% | RSI: 60.7 | % above MA200: +50.6% | Trend: Above MA20, MA50, MA200
Fortinet Inc is a cybersecurity company that provides security solutions such as firewalls and intrusion detection/prevention systems. Investors should care because its products protect networks from threats, and its growth reflects increasing demand for cybersecurity.
Fortinet Inc is in a sustained uptrend with price > MA20 > MA50 > MA200, RSI(14) at 60.7, and is 0.9% below its 52-Week high, indicating strong momentum with potential for breakout.
📉 Nearest to 52-Week Low
Sectors represented: Communication Services (2), Industrials (1), Consumer Cyclical (1), Consumer Defensive (1)
| Ticker | Company | Sector | Price Last | % Realized | 52-Week Low Date | RSI | % above MA200 | Trend |
|---|---|---|---|---|---|---|---|---|
| CPRT | Copart, Inc | Industrials | $27.22 | -39.47% | 2026-09-29 | 30.8 | -19.0% | Below MA20, MA50, MA200 |
| APP | Applovin Corp | Communication Services | $300.59 | -58.17% | 2026-08-24 | 38.5 | -34.7% | Below MA20, MA50, MA200 |
| LULU | Lululemon Athletica inc | Consumer Cyclical | $96.65 | -45.68% | 2026-09-16 | 36.5 | -33.8% | Below MA20, MA50, MA200 |
| PEP | PepsiCo Inc | Consumer Defensive | $129.06 | -8.10% | 2026-09-24 | 31.4 | -12.5% | Below MA20, MA50, MA200 |
| TMUS | T-Mobile US Inc | Communication Services | $163.74 | -31.60% | 2026-09-22 | 36.2 | -14.5% | Below MA20, MA50, MA200 |
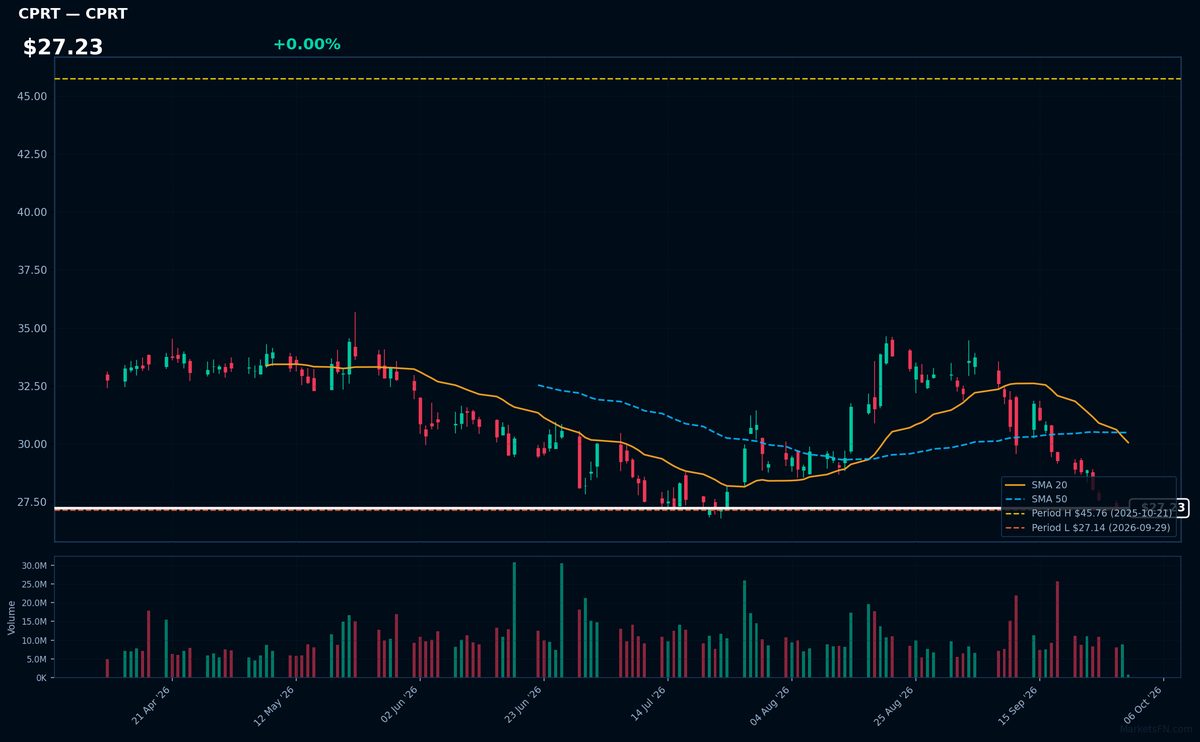
CPRT | Copart, Inc | Industrials | Price Last: $27.22 | % Realized: -39.47% | RSI: 30.8 | % above MA200: -19.0% | Trend: Below MA20, MA50, MA200
Copart, Inc operates online vehicle auction platforms and provides remarketing services for salvage and used vehicles to insurance companies, charities, and other organizations, making it a key player in the vehicle disposition market.
Copart's technicals indicate a sustained downtrend with price ($27.23) below MA20, MA50, and MA200. RSI(14) at 30.8 suggests oversold conditions, and the stock is 0.3% above its 52-Week low, testing major support, potentially a warning sign.
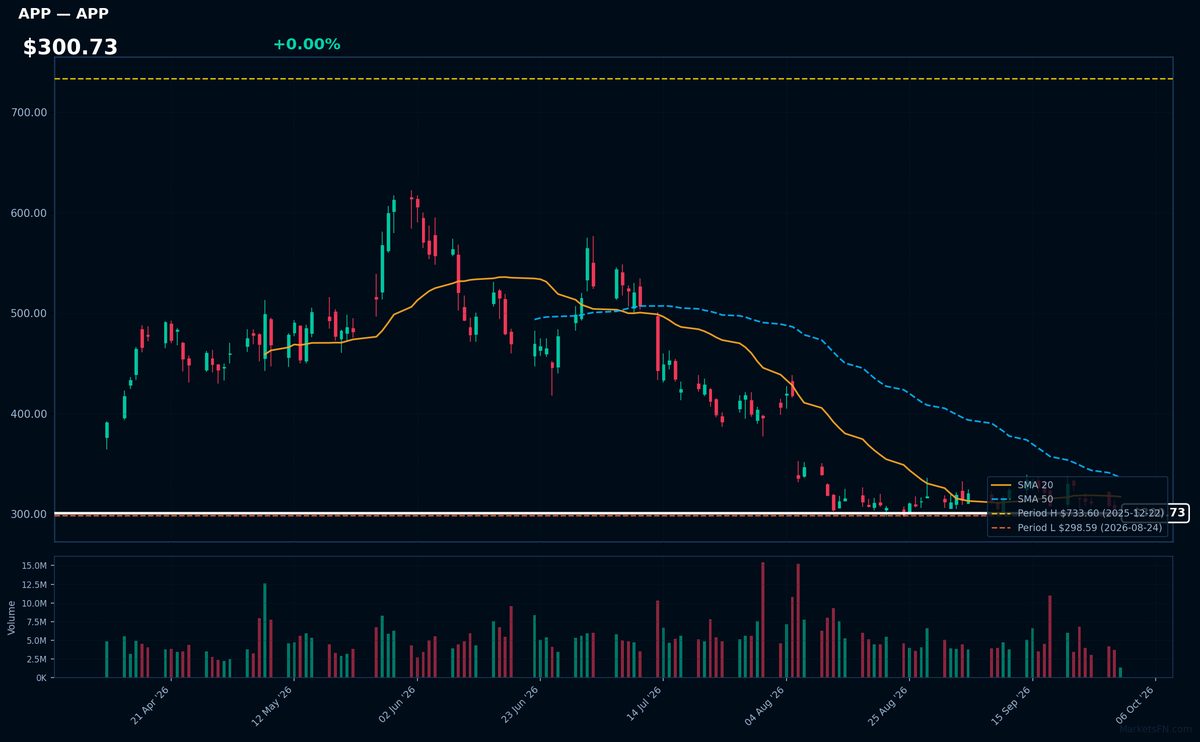
APP | Applovin Corp | Communication Services | Price Last: $300.59 | % Realized: -58.17% | RSI: 38.5 | % above MA200: -34.7% | Trend: Below MA20, MA50, MA200
Applovin Corp operates a mobile app development and marketing platform, enabling developers to grow their businesses through user acquisition and monetization. Investors should care about its performance as it reflects trends in mobile gaming and advertising.
Applovin Corp's technical situation is bearish, with an RSI(14) of 38.5 indicating oversold conditions, and a sustained downtrend as price ($300.73) remains below MA20, MA50, and MA200, with the stock 0.7% above its 52-Week low.
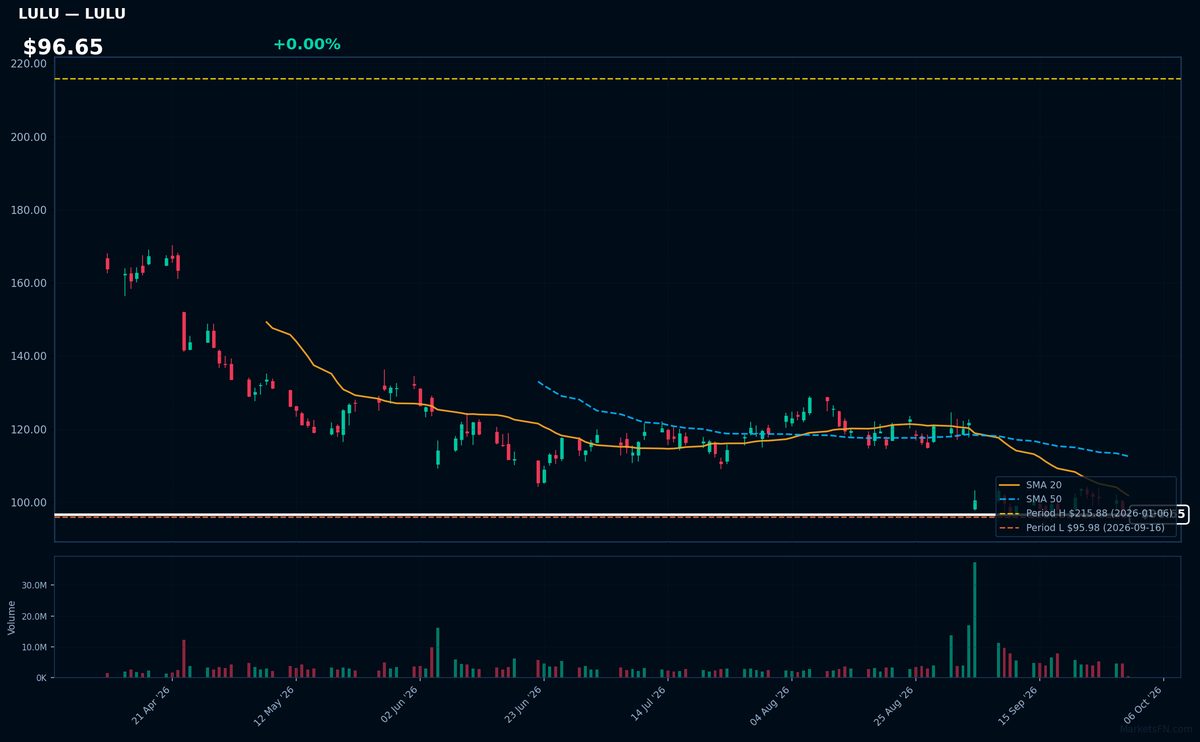
LULU | Lululemon Athletica inc | Consumer Cyclical | Price Last: $96.65 | % Realized: -45.68% | RSI: 36.5 | % above MA200: -33.8% | Trend: Below MA20, MA50, MA200
Lululemon Athletica inc designs and sells yoga and athletic wear. Investors should care because its performance reflects consumer spending on premium activewear, indicating broader retail health and lifestyle trends.
Lululemon's technicals indicate a sustained downtrend with price ($96.65) below MA20, MA50, and MA200. RSI(14) is 36.5, nearing oversold territory. The stock is 0.7% above its 52-Week low, testing major support after a -45.7% 52-Week return, a warning sign.
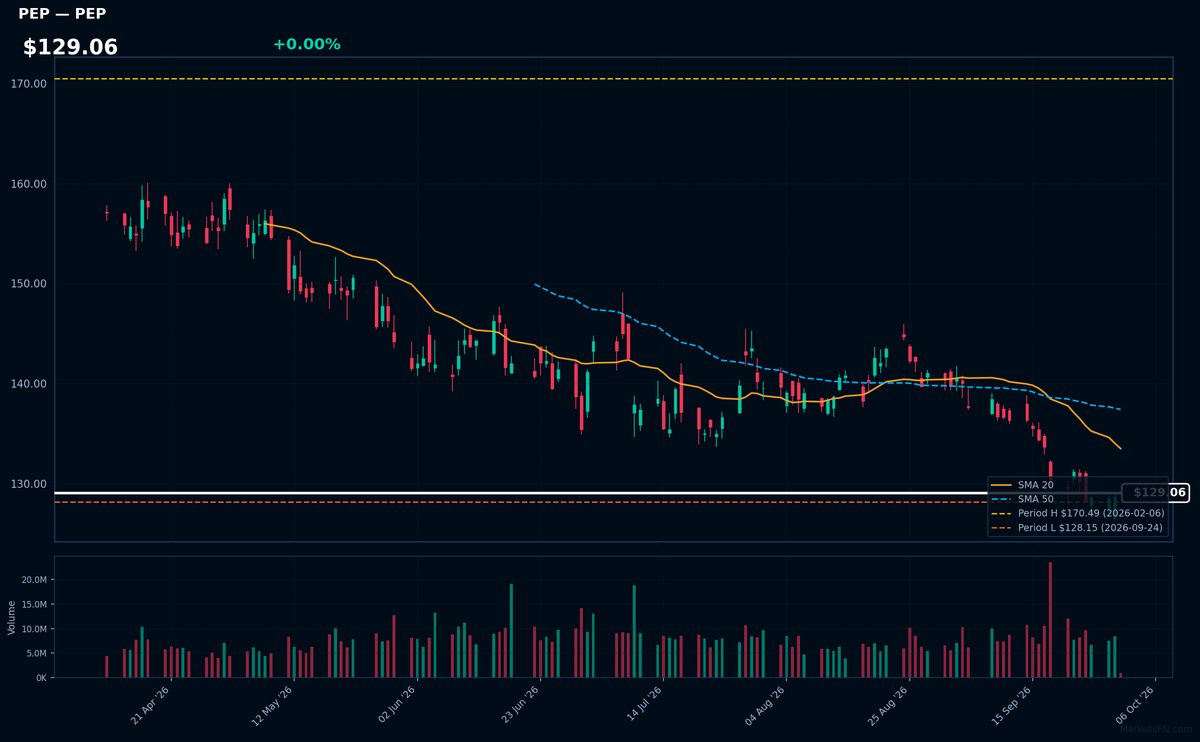
PEP | PepsiCo Inc | Consumer Defensive | Price Last: $129.06 | % Realized: -8.10% | RSI: 31.4 | % above MA200: -12.5% | Trend: Below MA20, MA50, MA200
PepsiCo Inc is a diversified food and beverage company with brands like Pepsi, Lay's, and Gatorade, generating revenue through beverage sales, snack foods, and other categories. Investors care about its performance due to its market leadership and consumer staples exposure.
PepsiCo Inc's technical situation is bearish, with an RSI(14) of 31.4 indicating oversold conditions, price below all MAs (MA20, MA50, MA200), and proximity to its 52-Week low (0.7% above), warning of potential further downside; sustained downtrend is evident with price < MA20 < MA50 < MA200.
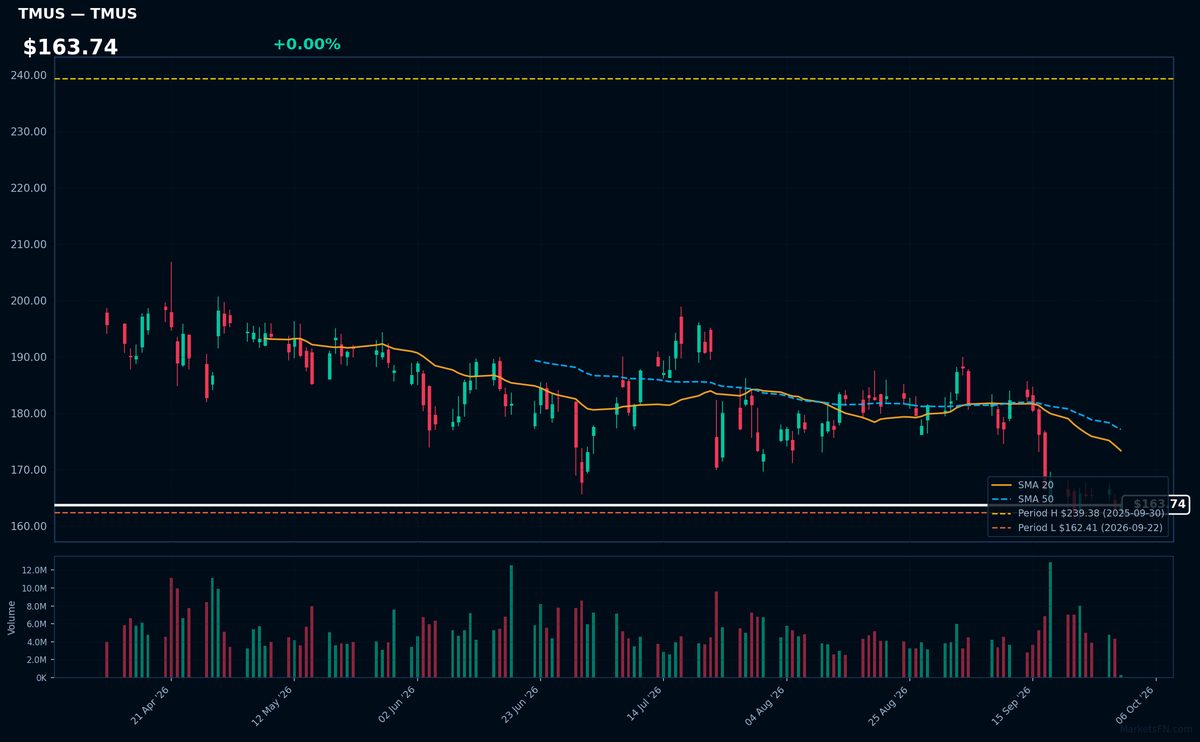
TMUS | T-Mobile US Inc | Communication Services | Price Last: $163.74 | % Realized: -31.60% | RSI: 36.2 | % above MA200: -14.5% | Trend: Below MA20, MA50, MA200
T-Mobile US Inc is a wireless network operator providing mobile services. Investors should care about its competitive positioning and growth prospects in the US telecom market.
T-Mobile US Inc is in a sustained downtrend with price ($163.74) below MA20, MA50, and MA200. RSI(14) is 36.2, nearing oversold territory, and the stock is 0.8% above its 52-Week low, indicating potential support testing.
Market Commentary
The Nasdaq 100 stocks are currently trading near 52-week extremes, with some stocks near highs and others near lows. Stocks like CRWD, PANW, and AAPL are near their 52-week highs, while CPRT, APP, and LULU are near their 52-week lows. This indicates a significant divergence in performance within the Nasdaq 100.
The technology sector is driving the price action of these stocks, with cybersecurity names like CRWD, PANW, and FTNT near 52-week highs. This could be attributed to the ongoing demand for security solutions. On the other hand, stocks like CPRT and LULU are near their lows, potentially due to concerns around consumer spending and economic growth.
Key levels to watch include the 52-week highs and lows for these stocks. A breakout above the 52-week high for CRWD, PANW, and AAPL could signal further upside, while a breakdown below the 52-week low for CPRT, APP, and LULU could indicate additional downside. Catalysts to watch include earnings reports and macroeconomic data releases that could impact the technology sector and broader market sentiment.
Methodology: All 101 Nasdaq 100 constituents screened. 52-week high = highest daily close over the past 252 trading days (approx. 1 year). 52-week low = lowest daily close over the same period. Distance = (current price / extreme − 1) × 100. Technical indicators computed on up to 1 year of daily OHLCV data.
Disclaimer: For informational purposes only. Not investment advice. Past performance is not indicative of future results.

