S&P 500 52-Week Highs & Lows Radar: Palo Alto Networks (PANW), Home Depot, (HD) and more
MarketsFN Team

S&P 500 52-Week Highs & Lows Radar: Palo Alto Networks (PANW), Home Depot, (HD) and more
Screening all 503 S&P 500 constituents for stocks nearest to their 52-week high and their 52-week low. Data as of September 30, 2026. % Realized = 52-week total return.
Legend: RSI > 70 = overbought · RSI < 30 = oversold · Green % Realized = positive 52W return · Red = negative.
📈 Nearest to 52-Week High
Sectors represented: Technology (4), Healthcare (1)
| Ticker | Company | Sector | Price Last | % Realized | 52-Week High Date | RSI | % above MA200 | Trend |
|---|---|---|---|---|---|---|---|---|
| PANW | Palo Alto Networks Inc | Technology | $397.88 | +95.40% | 2026-09-30 | 60.8 | +60.3% | Above MA20, MA50, MA200 |
| CRWD | Crowdstrike Holdings Inc | Technology | $266.56 | +117.43% | 2026-09-30 | 67.4 | +75.2% | Above MA20, MA50, MA200 |
| HPE | Hewlett Packard Enterprise Co | Technology | $64.38 | +162.13% | 2026-09-30 | 62.4 | +76.5% | Above MA20, MA50, MA200 |
| NTAP | Netapp Inc | Technology | $213.58 | +80.30% | 2026-09-30 | 69.1 | +55.1% | Above MA20, MA50, MA200 |
| WAT | Waters Corp | Healthcare | $445.71 | +48.66% | 2026-09-30 | 69.9 | +22.7% | Above MA20, MA50, MA200 |
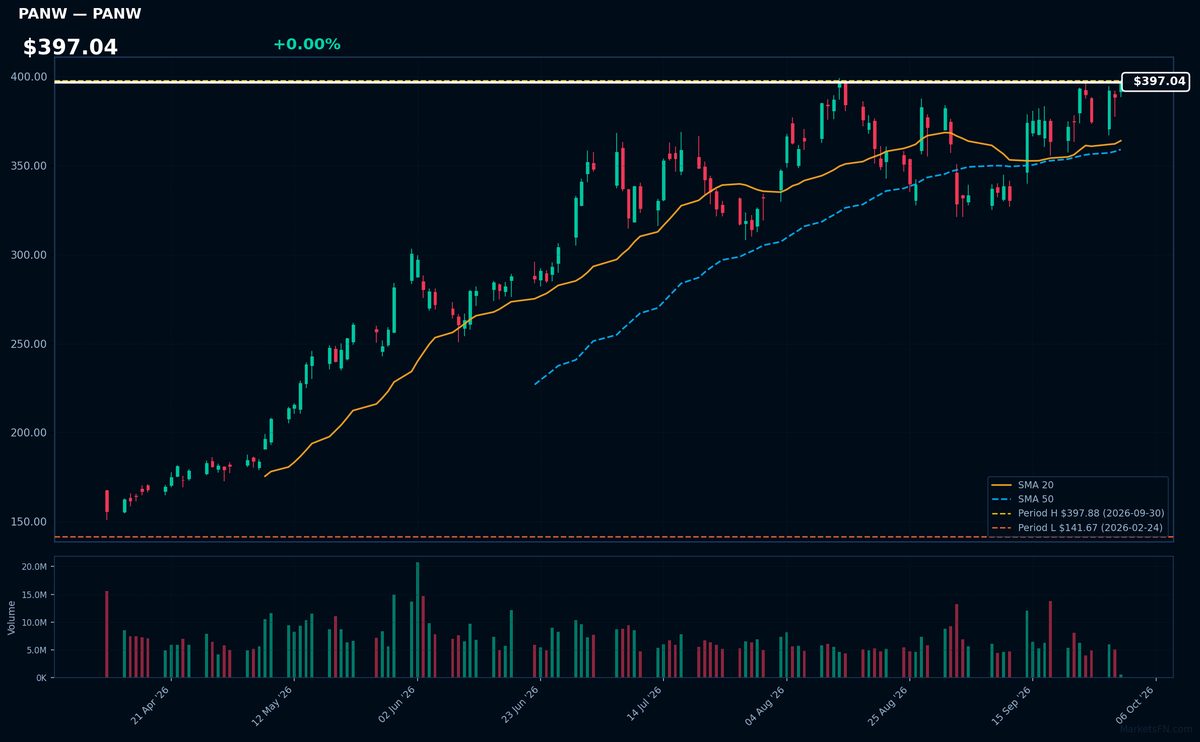
PANW | Palo Alto Networks Inc | Technology | Price Last: $397.88 | % Realized: +95.40% | RSI: 60.8 | % above MA200: +60.3% | Trend: Above MA20, MA50, MA200
Palo Alto Networks Inc is a cybersecurity company providing advanced threat prevention and security solutions. Investors should care due to its strong market position and innovative products that address evolving cyber threats, potentially driving growth.
Palo Alto Networks Inc is in a sustained uptrend with price at $397.04, RSI(14) at 60.04 is not available but 60.8 is, above MA20 > MA50 > MA200. The stock is 0.0% below its 52-Week high with an RSI(14) of 60.8, indicating strong momentum.
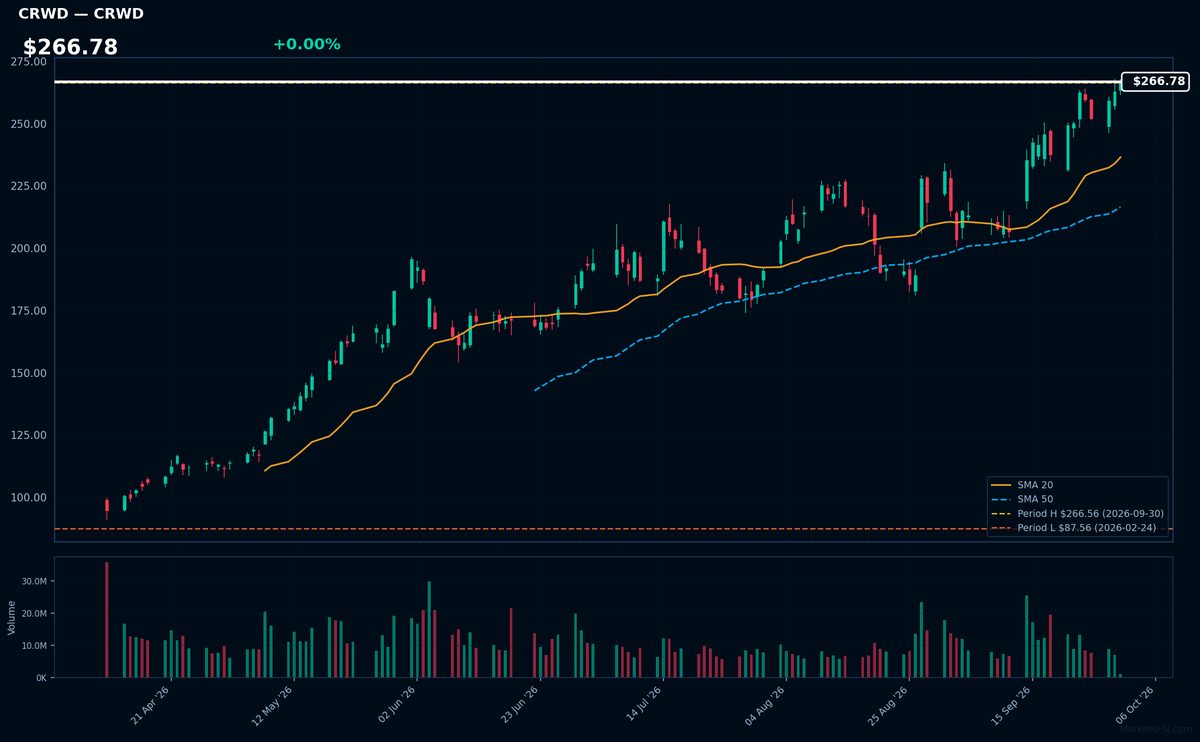
CRWD | Crowdstrike Holdings Inc | Technology | Price Last: $266.56 | % Realized: +117.43% | RSI: 67.4 | % above MA200: +75.2% | Trend: Above MA20, MA50, MA200
Crowdstrike Holdings Inc is a cybersecurity company providing cloud-delivered endpoint protection. Investors should care because its innovative Falcon platform has driven significant growth, making it a key player in the rapidly expanding cybersecurity market.
Crowdstrike's technicals indicate strong momentum: RSI(14) is 67.4, nearing overbought territory. The MA alignment is bullish with price > MA20 > MA50 > MA200, and the stock is 0.0% below its 52-Week high, suggesting a potential breakout.
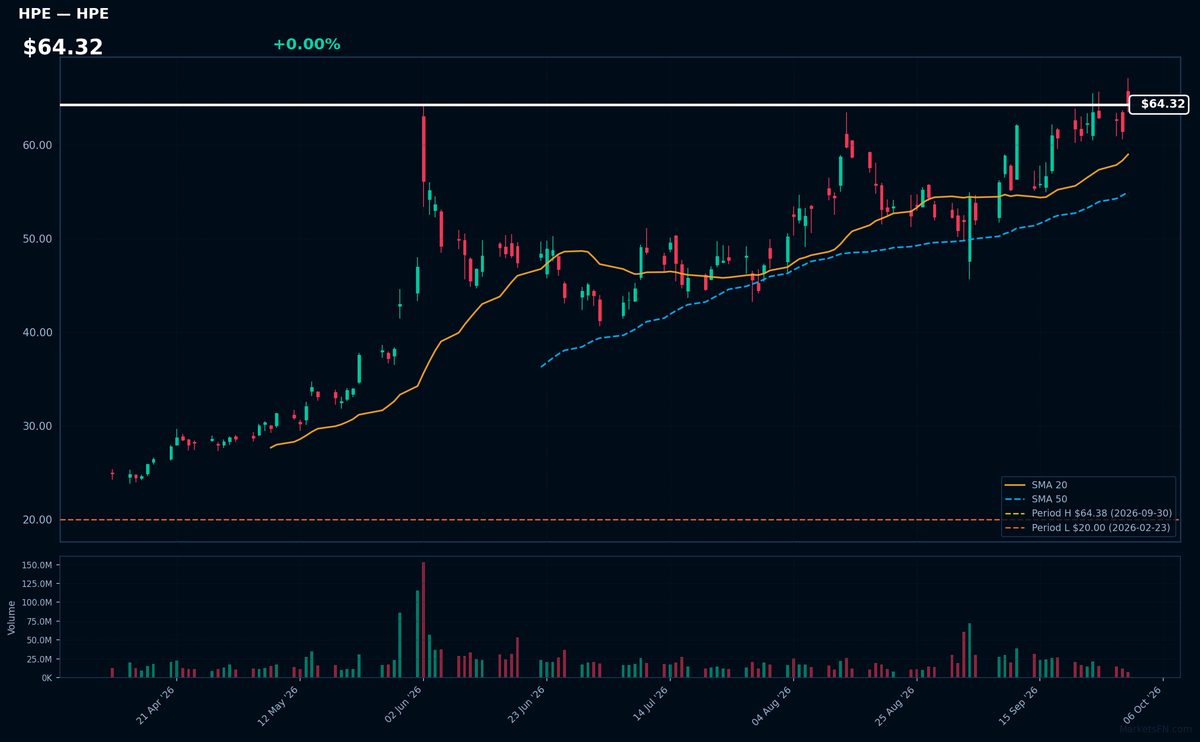
HPE | Hewlett Packard Enterprise Co | Technology | Price Last: $64.38 | % Realized: +162.13% | RSI: 62.4 | % above MA200: +76.5% | Trend: Above MA20, MA50, MA200
Hewlett Packard Enterprise Co is a technology company providing products and services for enterprise IT, cloud, and intelligent edge. Investors should care about its transition to a more focused IT infrastructure and services provider, potentially driving growth.
HPE's RSI(14) is 62.4, nearing overbought territory. With price > MA20 > MA50 > MA200 and being 0.0% below its 52-Week high, it indicates sustained uptrend and potential breakout, suggesting momentum.
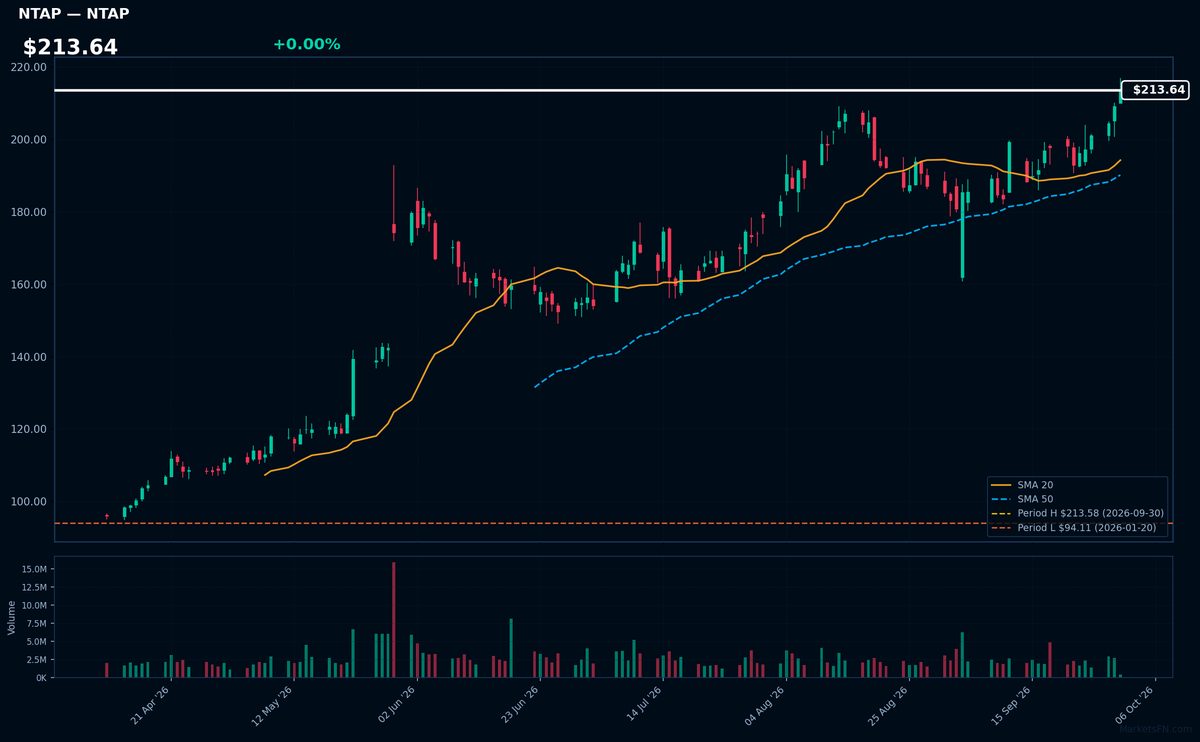
NTAP | Netapp Inc | Technology | Price Last: $213.58 | % Realized: +80.30% | RSI: 69.1 | % above MA200: +55.1% | Trend: Above MA20, MA50, MA200
Netapp Inc (NTAP) provides data storage and management solutions, helping organizations manage and optimize their data infrastructure. Investors should care as the company's performance reflects demand for cloud and data management services.
NTAP's RSI(14) is 69.1, nearing overbought territory, with a bullish MA alignment (price > MA20 > MA50 > MA200) and 0.0% below its 52-Week high, indicating strong momentum; the 80.3% 52-Week return reinforces this trend.
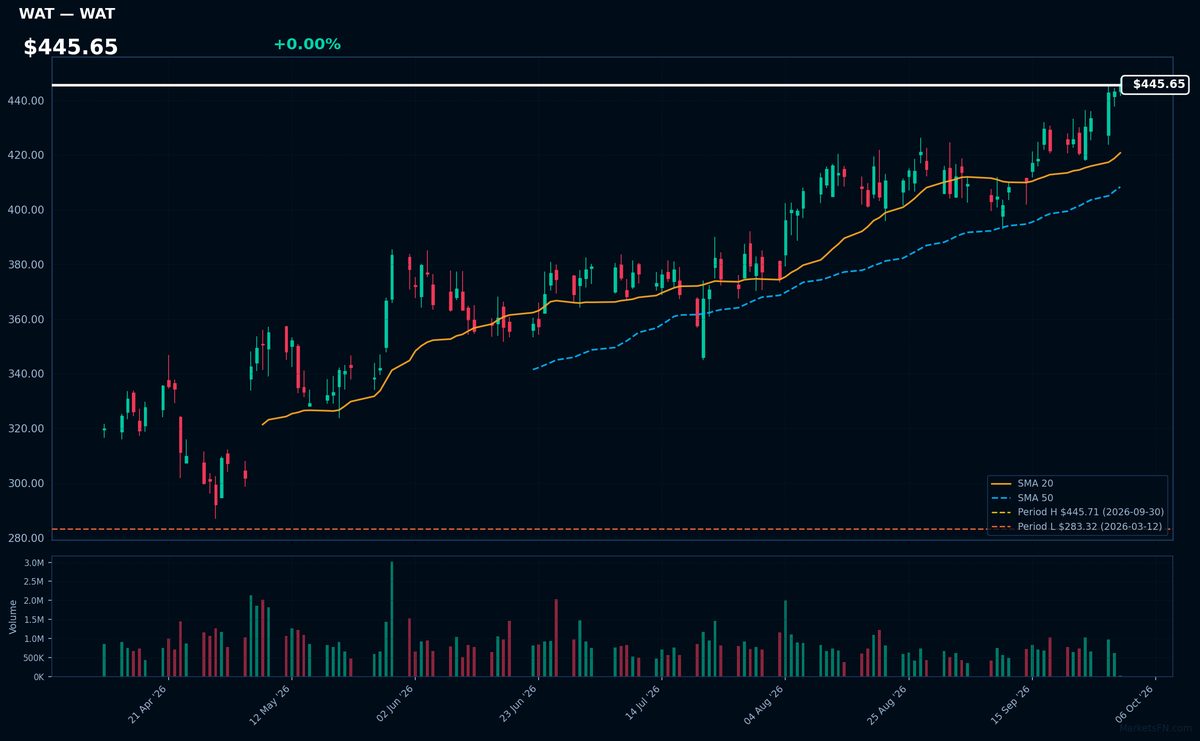
WAT | Waters Corp | Healthcare | Price Last: $445.71 | % Realized: +48.66% | RSI: 69.9 | % above MA200: +22.7% | Trend: Above MA20, MA50, MA200
Waters Corp is a leading manufacturer of analytical instruments used in pharmaceutical, biotech, and food industries. Investors should care because its products are essential for quality control and R&D, driving demand and revenue growth.
Waters Corp is near a breakout with a 52-Week high proximity of 0.0%, RSI(14) at 69.9, and a bullish MA alignment (price > MA20 > MA50 > MA200), indicating strong momentum; however, the high RSI may be a warning sign of overbought conditions.
📉 Nearest to 52-Week Low
Sectors represented: Consumer Cyclical (3), Industrials (1), Real Estate (1)
| Ticker | Company | Sector | Price Last | % Realized | 52-Week Low Date | RSI | % above MA200 | Trend |
|---|---|---|---|---|---|---|---|---|
| HD | Home Depot, Inc | Consumer Cyclical | $287.22 | -29.11% | 2026-09-30 | 27.6 | -15.5% | Below MA20, MA50, MA200 |
| MCD | McDonald's Corp | Consumer Cyclical | $233.29 | -23.23% | 2026-09-30 | 23.0 | -19.7% | Below MA20, MA50, MA200 |
| LOW | Lowe's Cos., Inc | Consumer Cyclical | $186.31 | -25.86% | 2026-09-30 | 30.4 | -19.8% | Below MA20, MA50, MA200 |
| NOC | Northrop Grumman Corp | Industrials | $484.98 | -20.41% | 2026-09-30 | 27.0 | -19.1% | Below MA20, MA50, MA200 |
| O | Realty Income Corp | Real Estate | $54.53 | -10.30% | 2026-09-30 | 14.2 | -11.8% | Below MA20, MA50, MA200 |
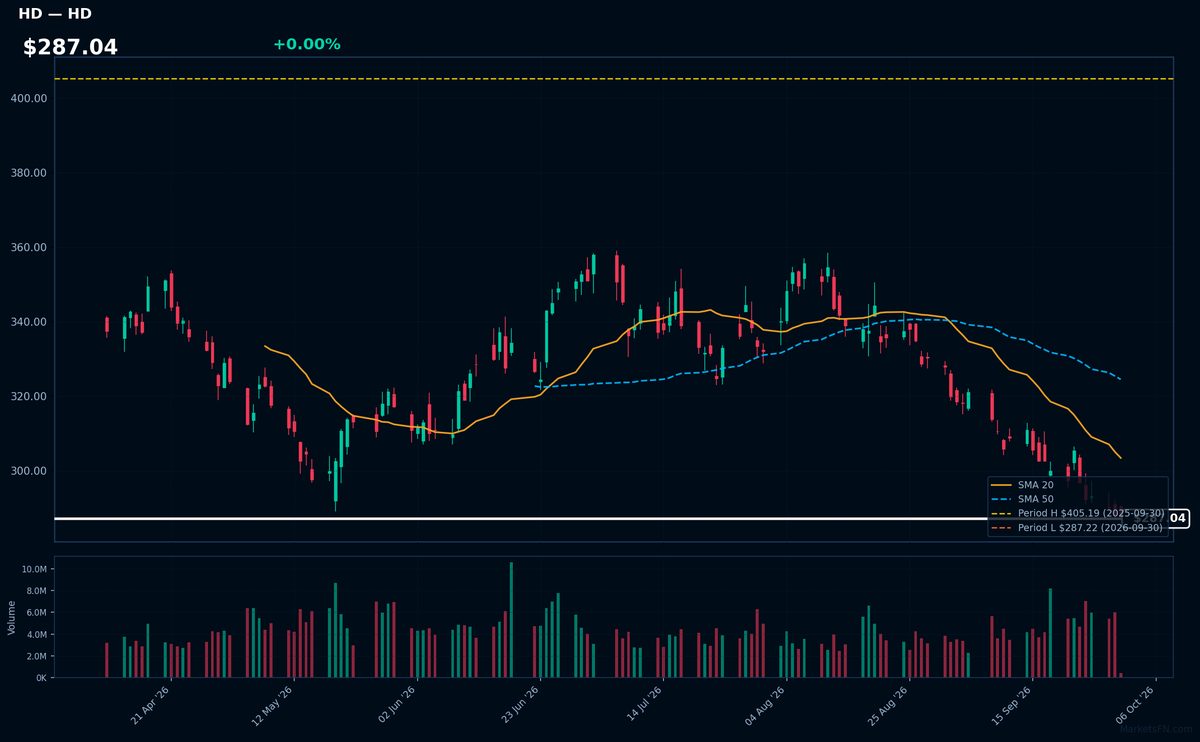
HD | Home Depot, Inc | Consumer Cyclical | Price Last: $287.22 | % Realized: -29.11% | RSI: 27.6 | % above MA200: -15.5% | Trend: Below MA20, MA50, MA200
Home Depot, Inc (HD) operates home improvement retail stores, offering a wide range of products for construction, renovation, and decoration. Investors care about its performance as it reflects housing market trends and consumer spending habits.
HD's technical situation is bearish, with an RSI(14) of 27.6 indicating oversold conditions, and a sustained downtrend as price ($287.04) remains below MA20, MA50, and MA200, with the stock testing its 52-Week low.
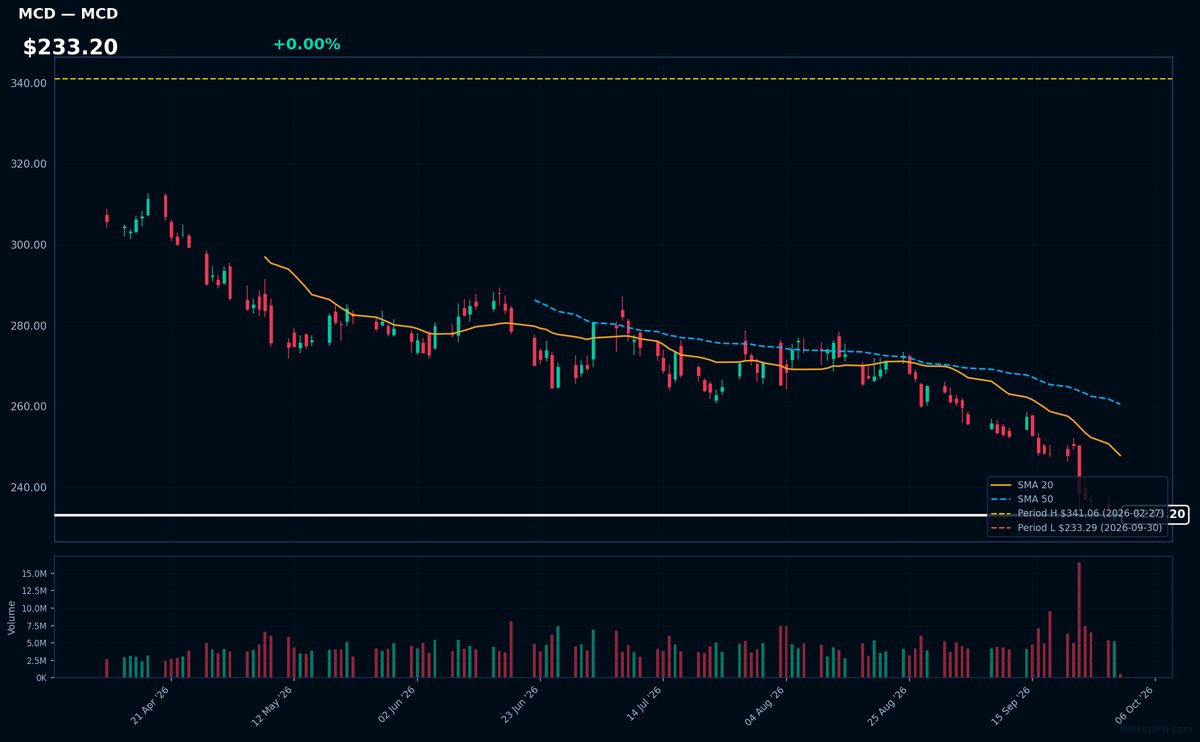
MCD | McDonald's Corp | Consumer Cyclical | Price Last: $233.29 | % Realized: -23.23% | RSI: 23.0 | % above MA200: -19.7% | Trend: Below MA20, MA50, MA200
McDonald's Corp operates a global fast-food chain, serving burgers, fries, and beverages. Investors care about its brand strength, franchise model, and operational efficiency, which drive revenue and profitability.
McDonald's Corp is in a sustained downtrend with price ($233.20) below MA20, MA50, and MA200. RSI(14) is 23.0, near oversold territory. The stock is 0.0% above its 52-Week low, testing major support, indicating a potential warning sign.
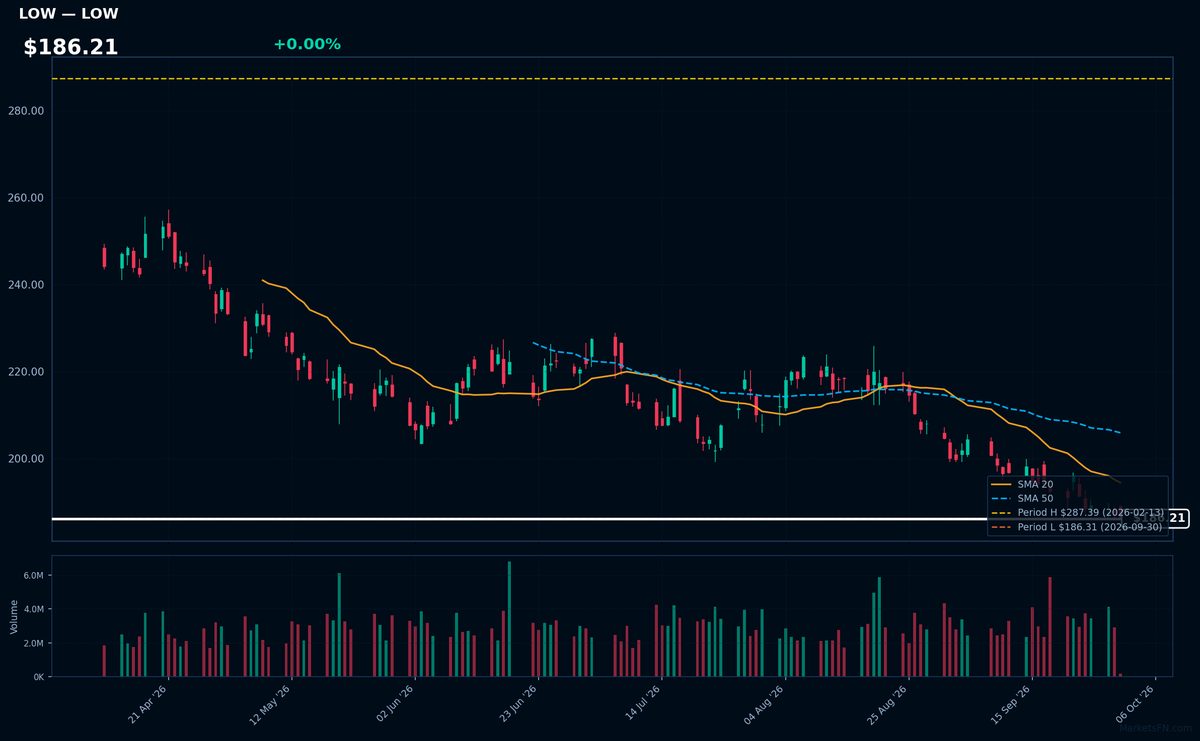
LOW | Lowe's Cos., Inc | Consumer Cyclical | Price Last: $186.31 | % Realized: -25.86% | RSI: 30.4 | % above MA200: -19.8% | Trend: Below MA20, MA50, MA200
Lowe's Cos., Inc operates as a home improvement retailer, selling products such as building materials, tools, and appliances. Investors care about its performance as it reflects housing market trends and consumer spending habits.
Lowe's is in a sustained downtrend with price ($186.21) below MA20, MA50, and MA200. RSI(14) is 30.4, near oversold territory, and the stock is at its 52-Week low, indicating potential support testing.
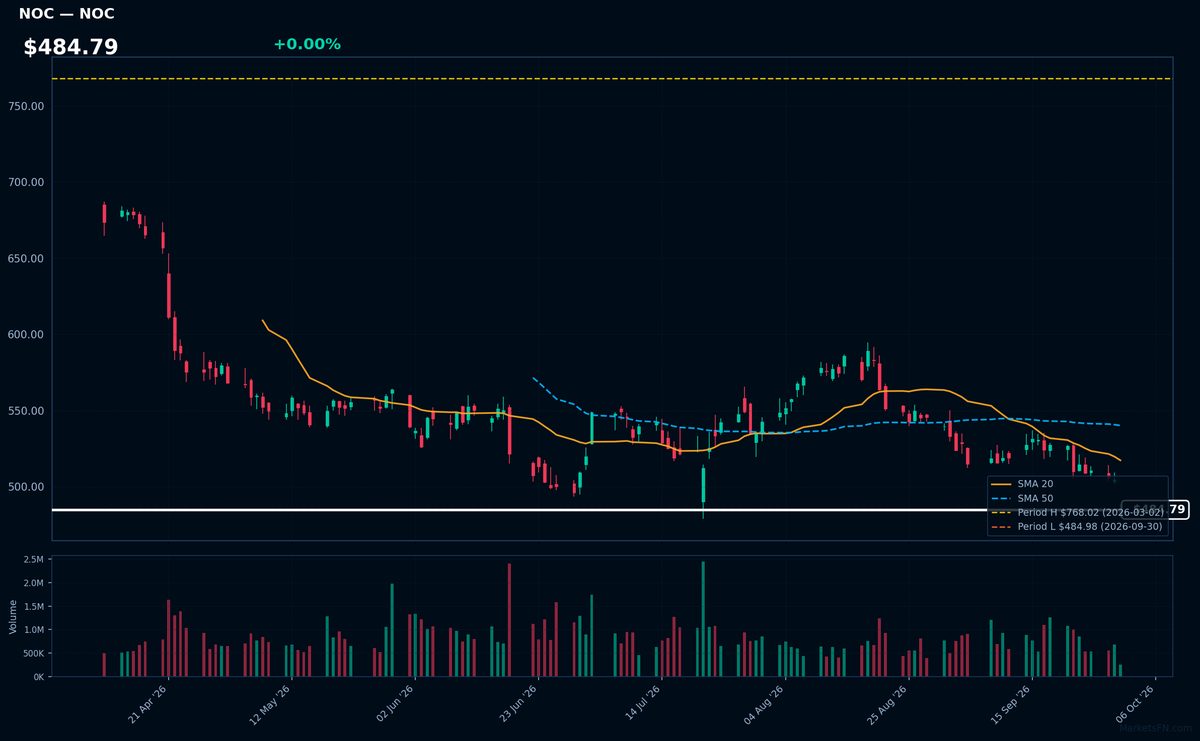
NOC | Northrop Grumman Corp | Industrials | Price Last: $484.98 | % Realized: -20.41% | RSI: 27.0 | % above MA200: -19.1% | Trend: Below MA20, MA50, MA200
Northrop Grumman Corp is a leading global aerospace and defense company, providing innovative systems and solutions in autonomous systems, cyber, space, and strike capabilities. Investors care due to its significant role in defense contracting and technological advancements.
The stock is in a sustained downtrend with price ($484.79) below MA20, MA50, and MA200. RSI(14) is 27.0, nearing oversold territory. The stock is 0.0% above its 52-Week low, testing major support, indicating a potential warning sign.
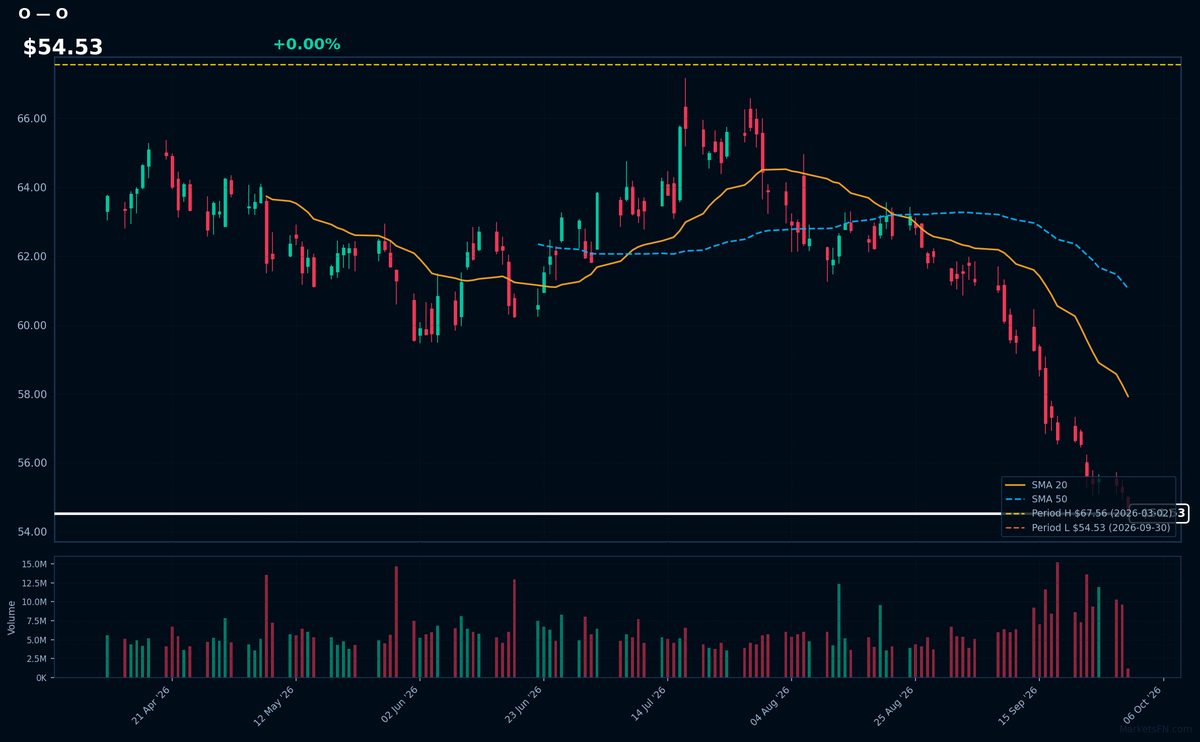
O | Realty Income Corp | Real Estate | Price Last: $54.53 | % Realized: -10.30% | RSI: 14.2 | % above MA200: -11.8% | Trend: Below MA20, MA50, MA200
Realty Income Corp is a real estate investment trust that owns and manages commercial properties, providing monthly dividend distributions to shareholders; investors care about its stable income stream and property portfolio performance.
The stock's RSI(14) is 14.2, indicating oversold conditions, with a bearish MA alignment (price < MA20 < MA50 < MA200) and trading 0.0% above its 52-Week low, suggesting a sustained downtrend and testing major support.
Market Commentary
The S&P 500 stocks listed are currently trading near their 52-week extremes, with some at highs and others at lows. Stocks like PANW, CRWD, HPE, NTAP, and WAT are at their 52-week highs, while HD, MCD, LOW, NOC, and O are at their 52-week lows. This indicates a significant price movement, potentially driven by fundamental factors or market sentiment.
The stocks near 52-week highs are primarily from the technology and industrials sectors, suggesting a potential rotation towards these areas. The presence of cybersecurity firms like PANW and CRWD at 52-week highs may indicate investor interest in technology stocks with strong growth prospects. Conversely, the stocks near 52-week lows are from consumer staples and industrials, potentially signaling a shift away from these sectors or concerns about their current valuations.
Key levels to watch include the current prices of these stocks, as a break above or below their 52-week extremes could signal further price movements. Potential catalysts include earnings reports, macroeconomic data releases, and sector-specific news that could influence investor sentiment and drive price action.
Methodology: All 503 S&P 500 constituents screened. 52-week high = highest daily close over the past 252 trading days (approx. 1 year). 52-week low = lowest daily close over the same period. Distance = (current price / extreme − 1) × 100. Technical indicators computed on up to 1 year of daily OHLCV data.
Disclaimer: For informational purposes only. Not investment advice. Past performance is not indicative of future results.

