Nasdaq 100 52-Week Highs & Lows Radar: Paccar (PCAR), PepsiCo (PEP) and more
MarketsFN Team

Nasdaq 100 52-Week Highs & Lows Radar: Paccar (PCAR), PepsiCo (PEP) and more
Screening all 101 Nasdaq 100 constituents for stocks nearest to their 52-week high and their 52-week low. Data as of July 22, 2026. % Realized = 52-week total return.
Legend: RSI > 70 = overbought · RSI < 30 = oversold · Green % Realized = positive 52W return · Red = negative.
📈 Nearest to 52-Week High
Sectors represented: Industrials (2), Communication Services (1), Consumer Cyclical (1), Technology (1)
| Ticker | Company | Sector | Price Last | % Realized | 52-Week High Date | RSI | % above MA200 | Trend |
|---|---|---|---|---|---|---|---|---|
| PCAR | Paccar Inc | Industrials | $129.99 | +31.86% | 2026-07-22 | 65.4 | +13.4% | Above MA20, MA50, MA200 |
| EA | Electronic Arts, Inc | Communication Services | $208.98 | +33.09% | 2026-07-20 | 76.9 | +3.2% | Above MA20, MA50, MA200 |
| ROST | Ross Stores, Inc | Consumer Cyclical | $237.20 | +74.72% | 2026-06-12 | 64.8 | +19.1% | Above MA20, MA50, MA200 |
| CSX | CSX Corp | Industrials | $50.03 | +42.01% | 2026-07-16 | 62.1 | +22.7% | Above MA20, MA50, MA200 |
| AAPL | Apple Inc | Technology | $325.56 | +51.85% | 2026-07-17 | 62.3 | +18.3% | Above MA20, MA50, MA200 |
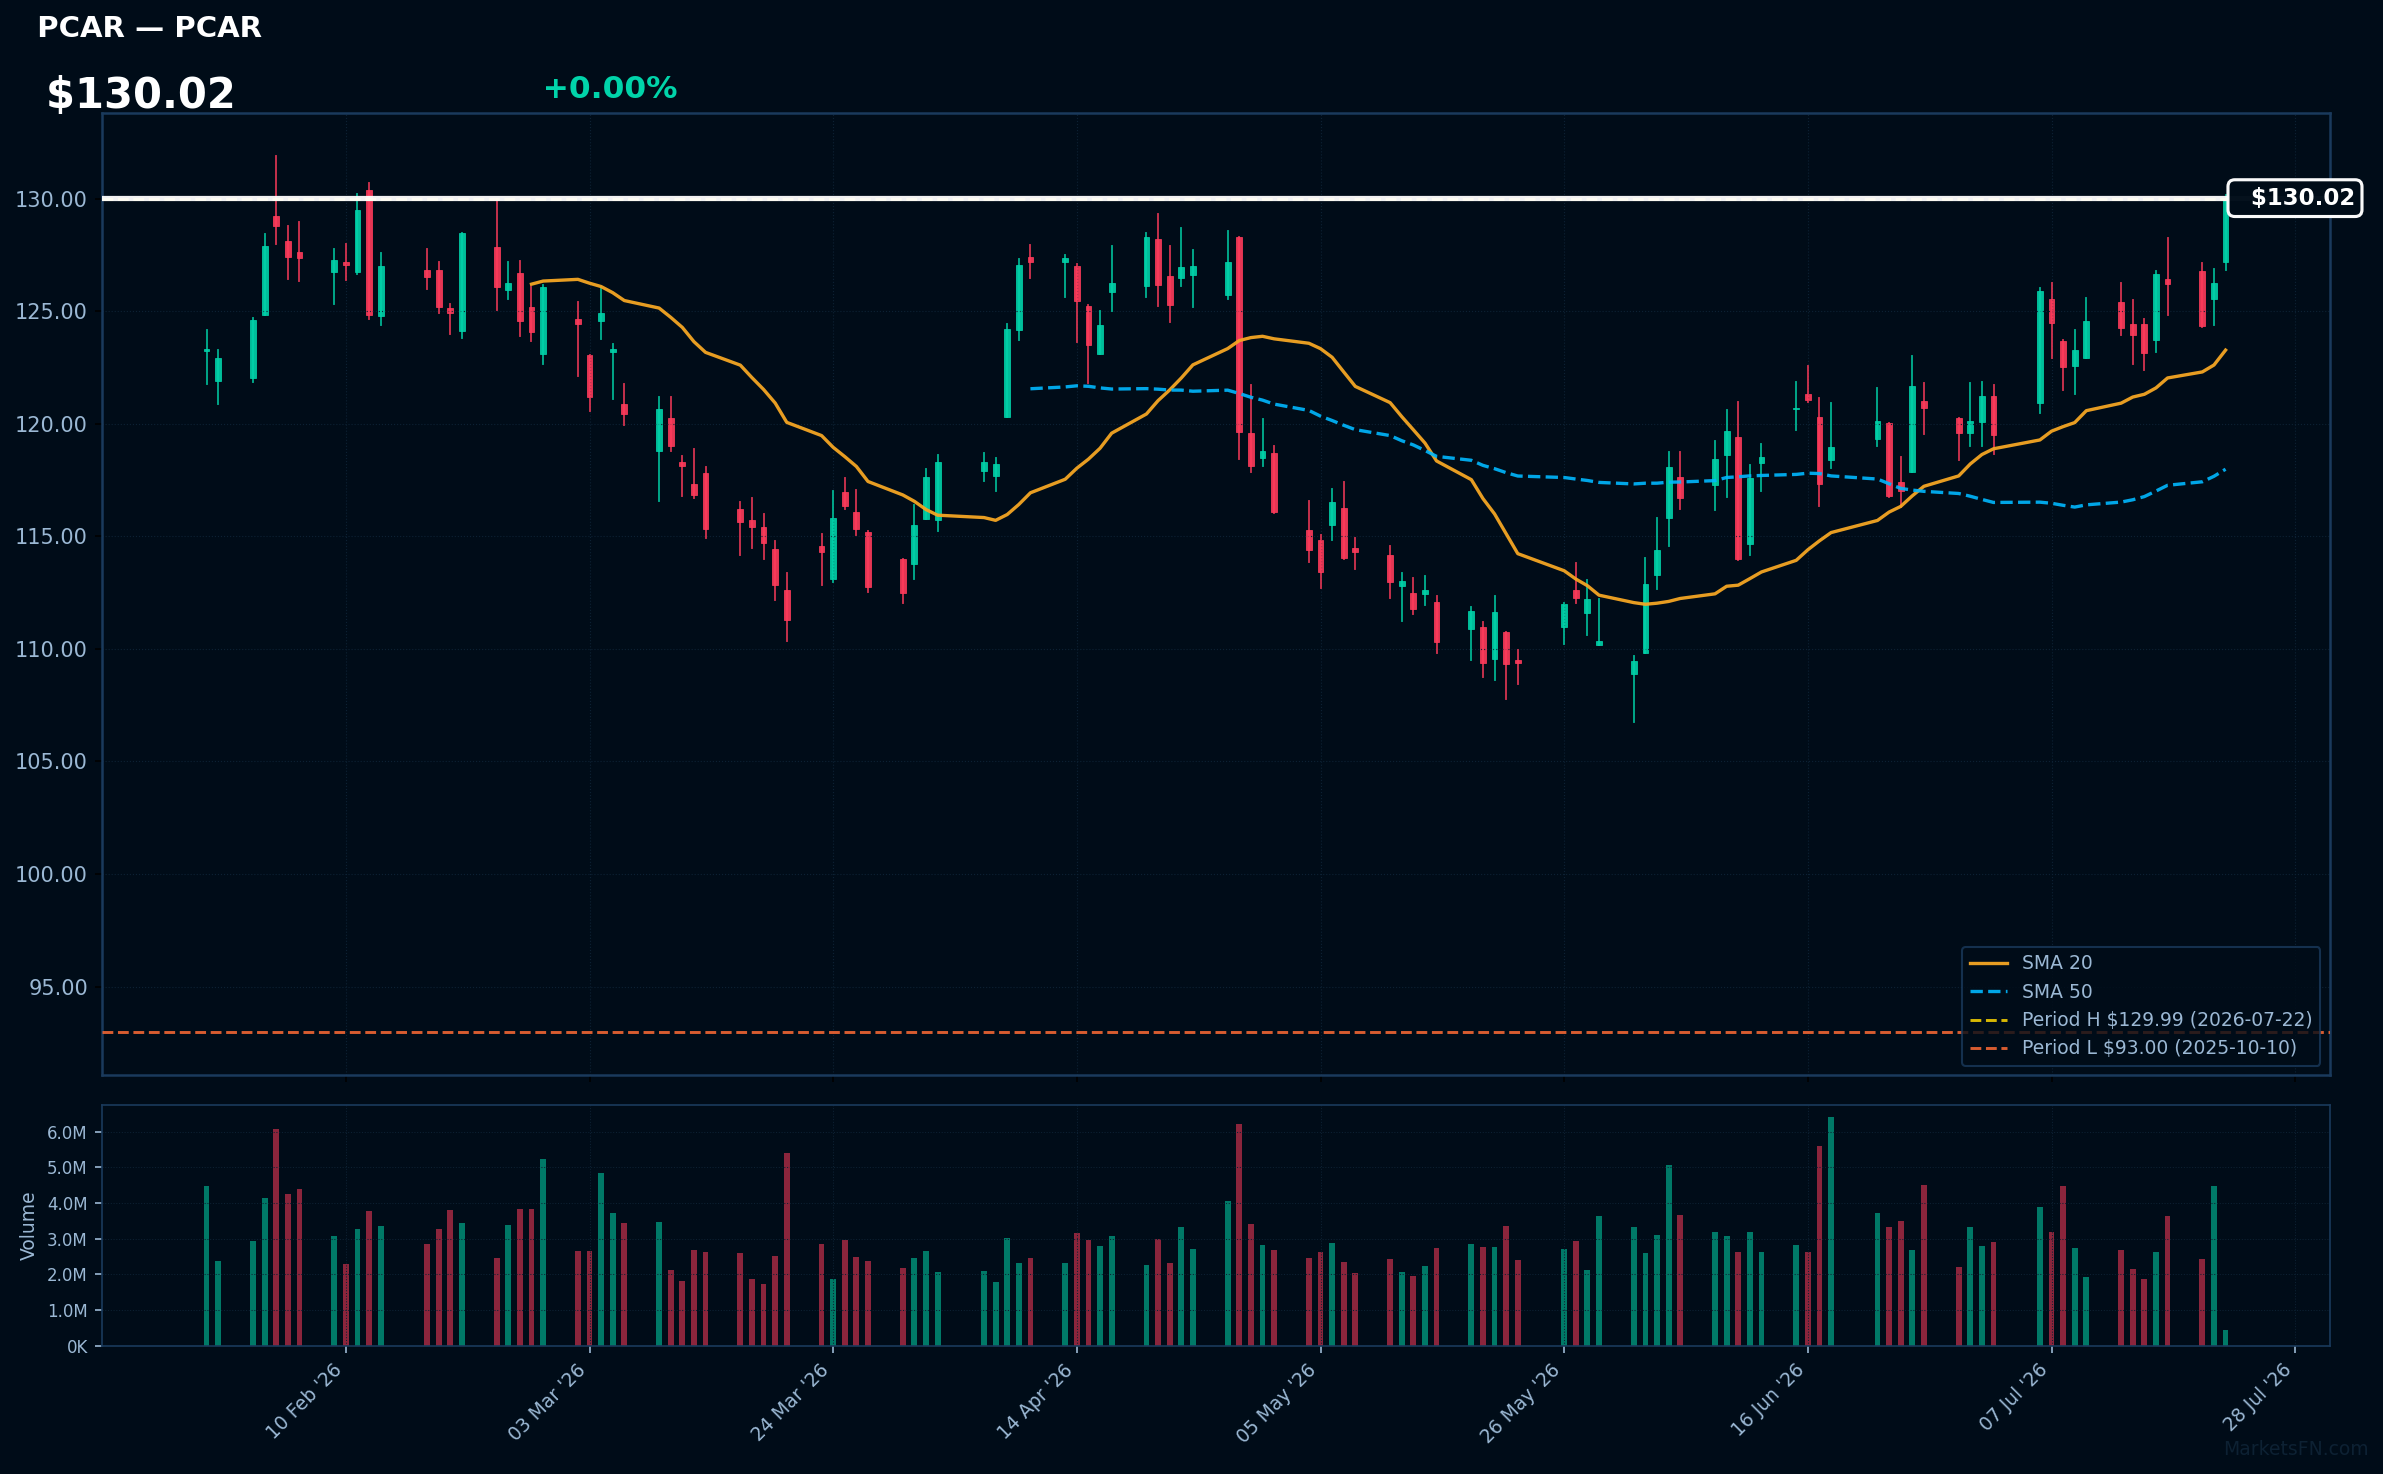
PCAR | Paccar Inc | Industrials | Price Last: $129.99 | % Realized: +31.86% | RSI: 65.4 | % above MA200: +13.4% | Trend: Above MA20, MA50, MA200
Paccar Inc designs and manufactures light-, medium-, and heavy-duty trucks under brands like Kenworth and Peterbilt. Investors should care because the company's truck sales are sensitive to economic cycles, making its performance a barometer for global freight and logistics activity.
Paccar Inc is in a sustained uptrend with price > MA20 > MA50 > MA200, RSI(14) at 65.4, and is 0.0% below its 52-Week high, indicating strong momentum with no clear warning signs; the stock has returned 31.9% over the 52-Week period.
Related headlines
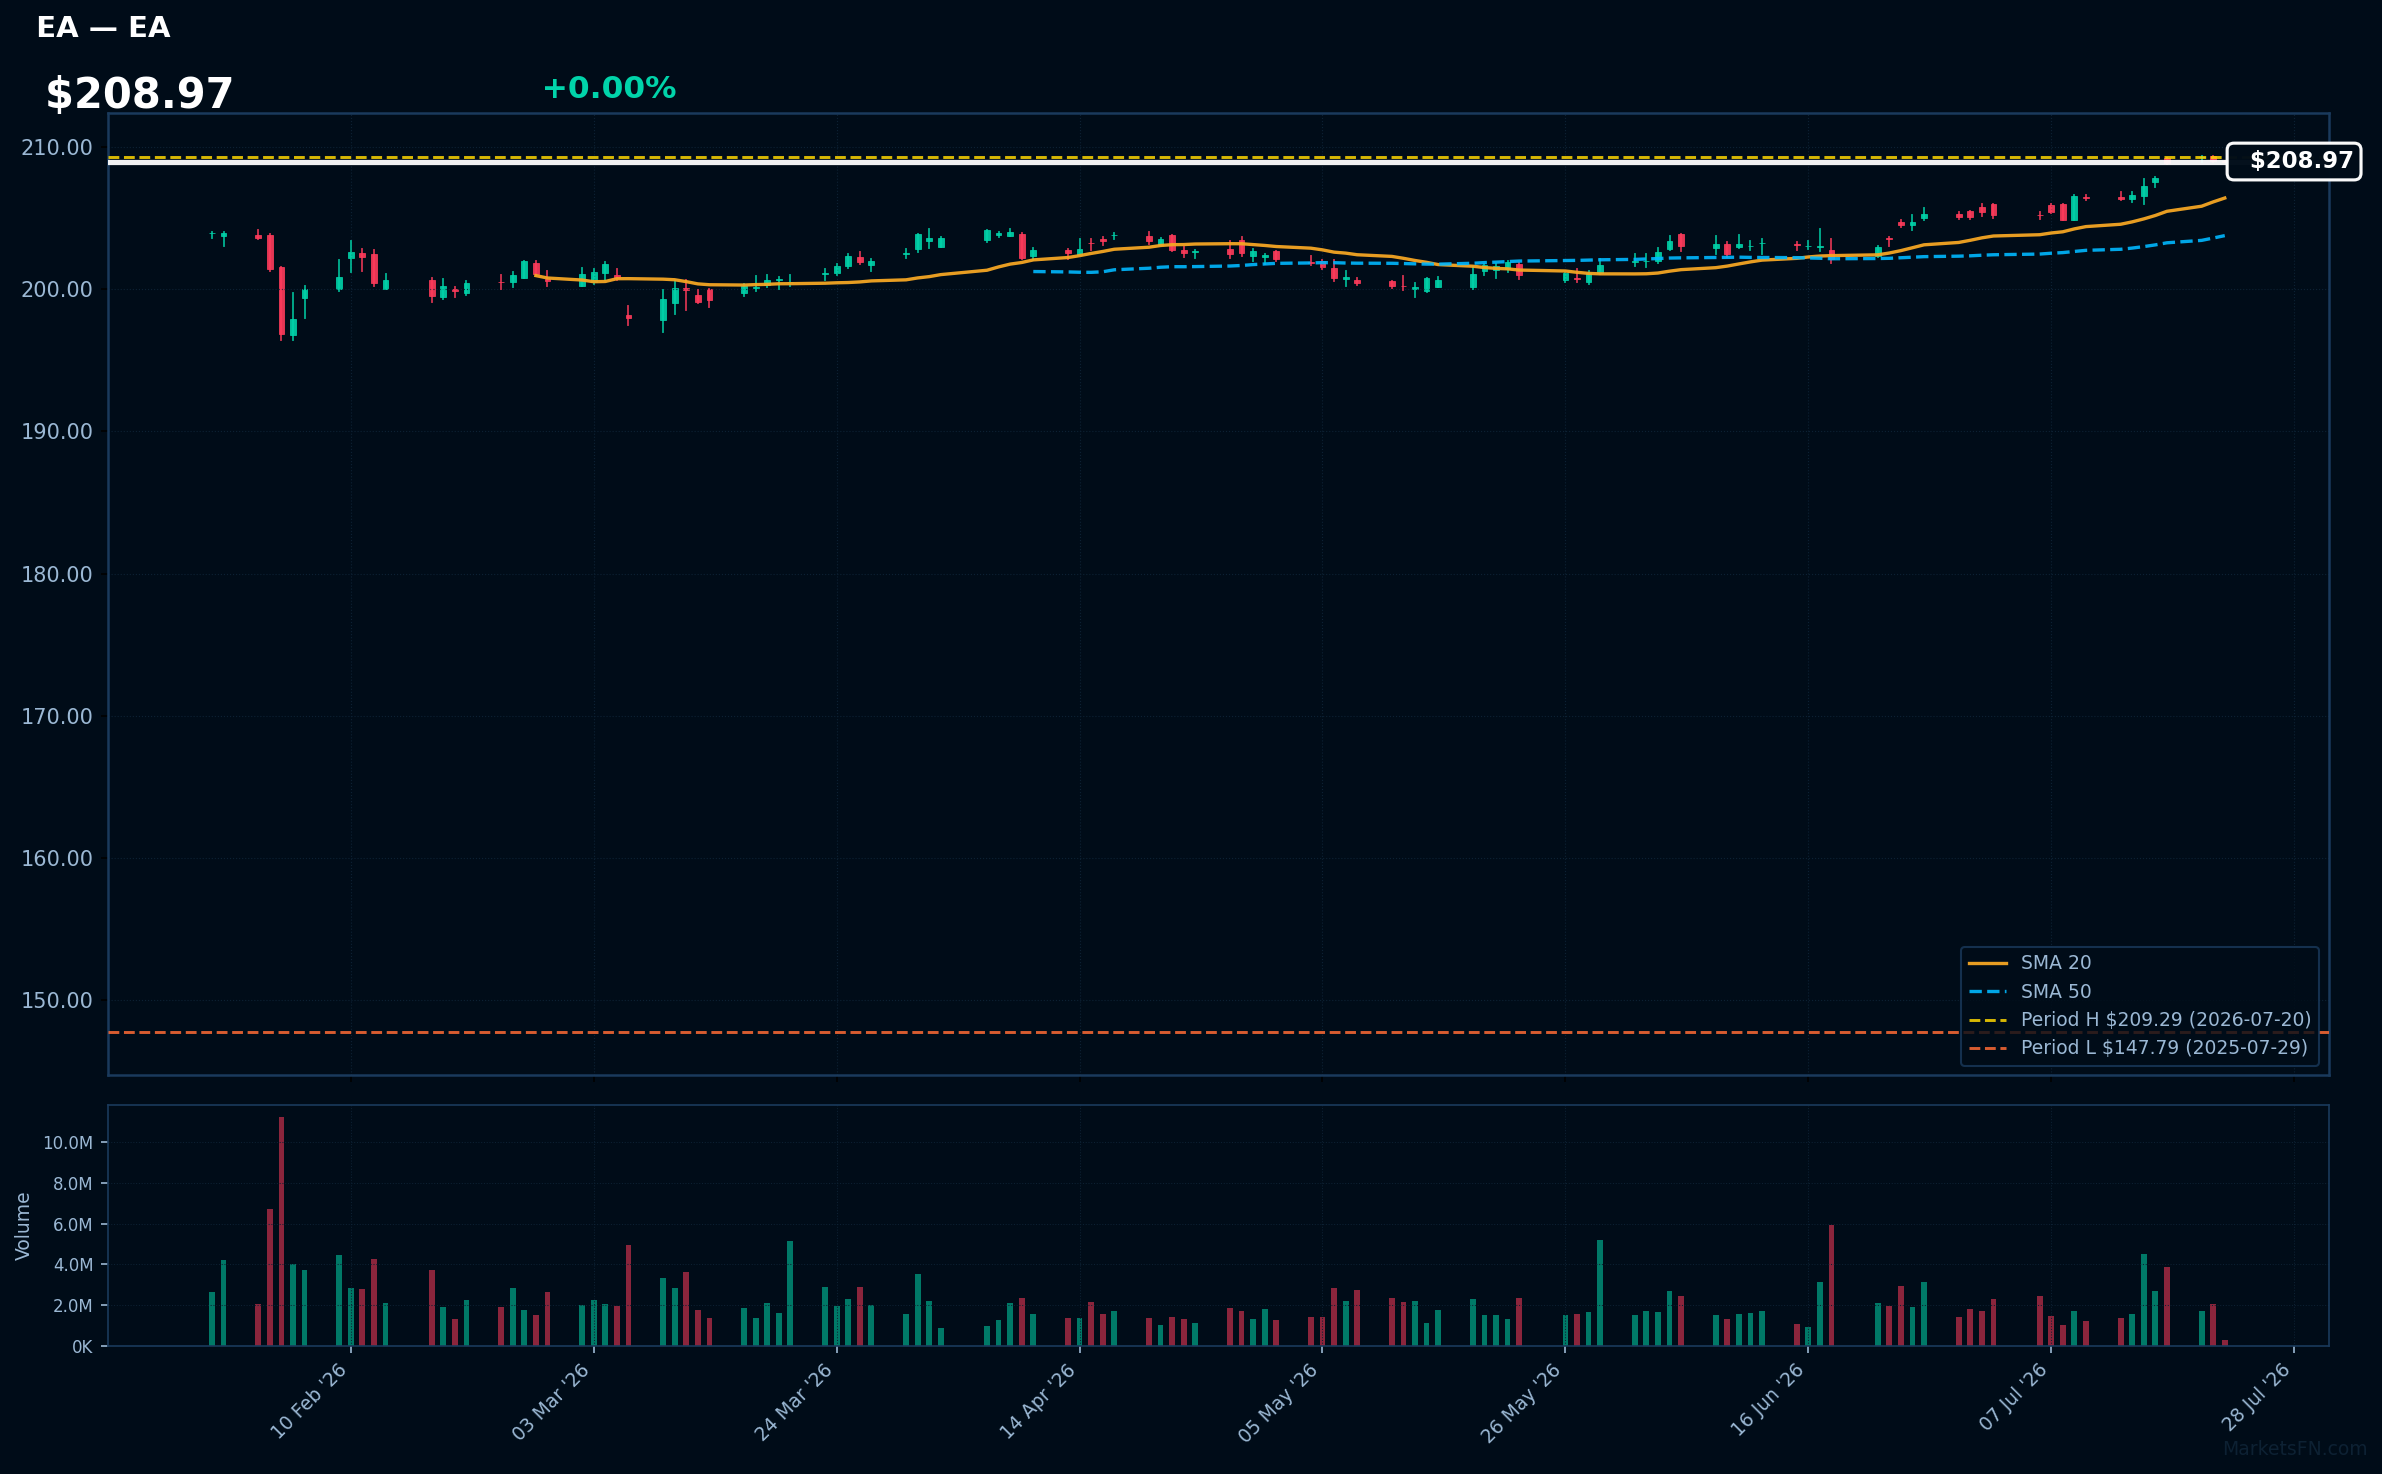
EA | Electronic Arts, Inc | Communication Services | Price Last: $208.98 | % Realized: +33.09% | RSI: 76.9 | % above MA200: +3.2% | Trend: Above MA20, MA50, MA200
Electronic Arts, Inc (EA) is a leading interactive entertainment software company that develops and publishes games such as FIFA, Madden NFL, and The Sims. Investors should care about its performance in the gaming market and its ability to innovate and release hit titles.
EA's current technical situation indicates strong momentum: RSI(14) is 76.9, indicating overbought conditions, and the stock is in a sustained uptrend with price > MA20 > MA50 > MA200. It's 0.1% below its 52-Week high, near a potential breakout level.
Related headlines
- Battlefield 6 and Top Gun Join Forces for Biggest Blockbuster Season Yet
- Exclusive-Saudi PIF set to win EU nod for Electronic Arts deal under subsidy rules, sources say
- Every Team Has an Edge: EA SPORTS NHL 27 Overhauls All 32 Arena Atmospheres and Presentation for Total Immersion
- Oak-Eagle AcquireCo, Inc. Announces Extension of the Expiration Time and Settlement Date for the Previously Announced Tender Offers and Consent Solicitations for Any and All of Electronic Arts Inc.'s 1.850% Senior Notes Due 2031 and 2.950% Senior Notes Due 2051
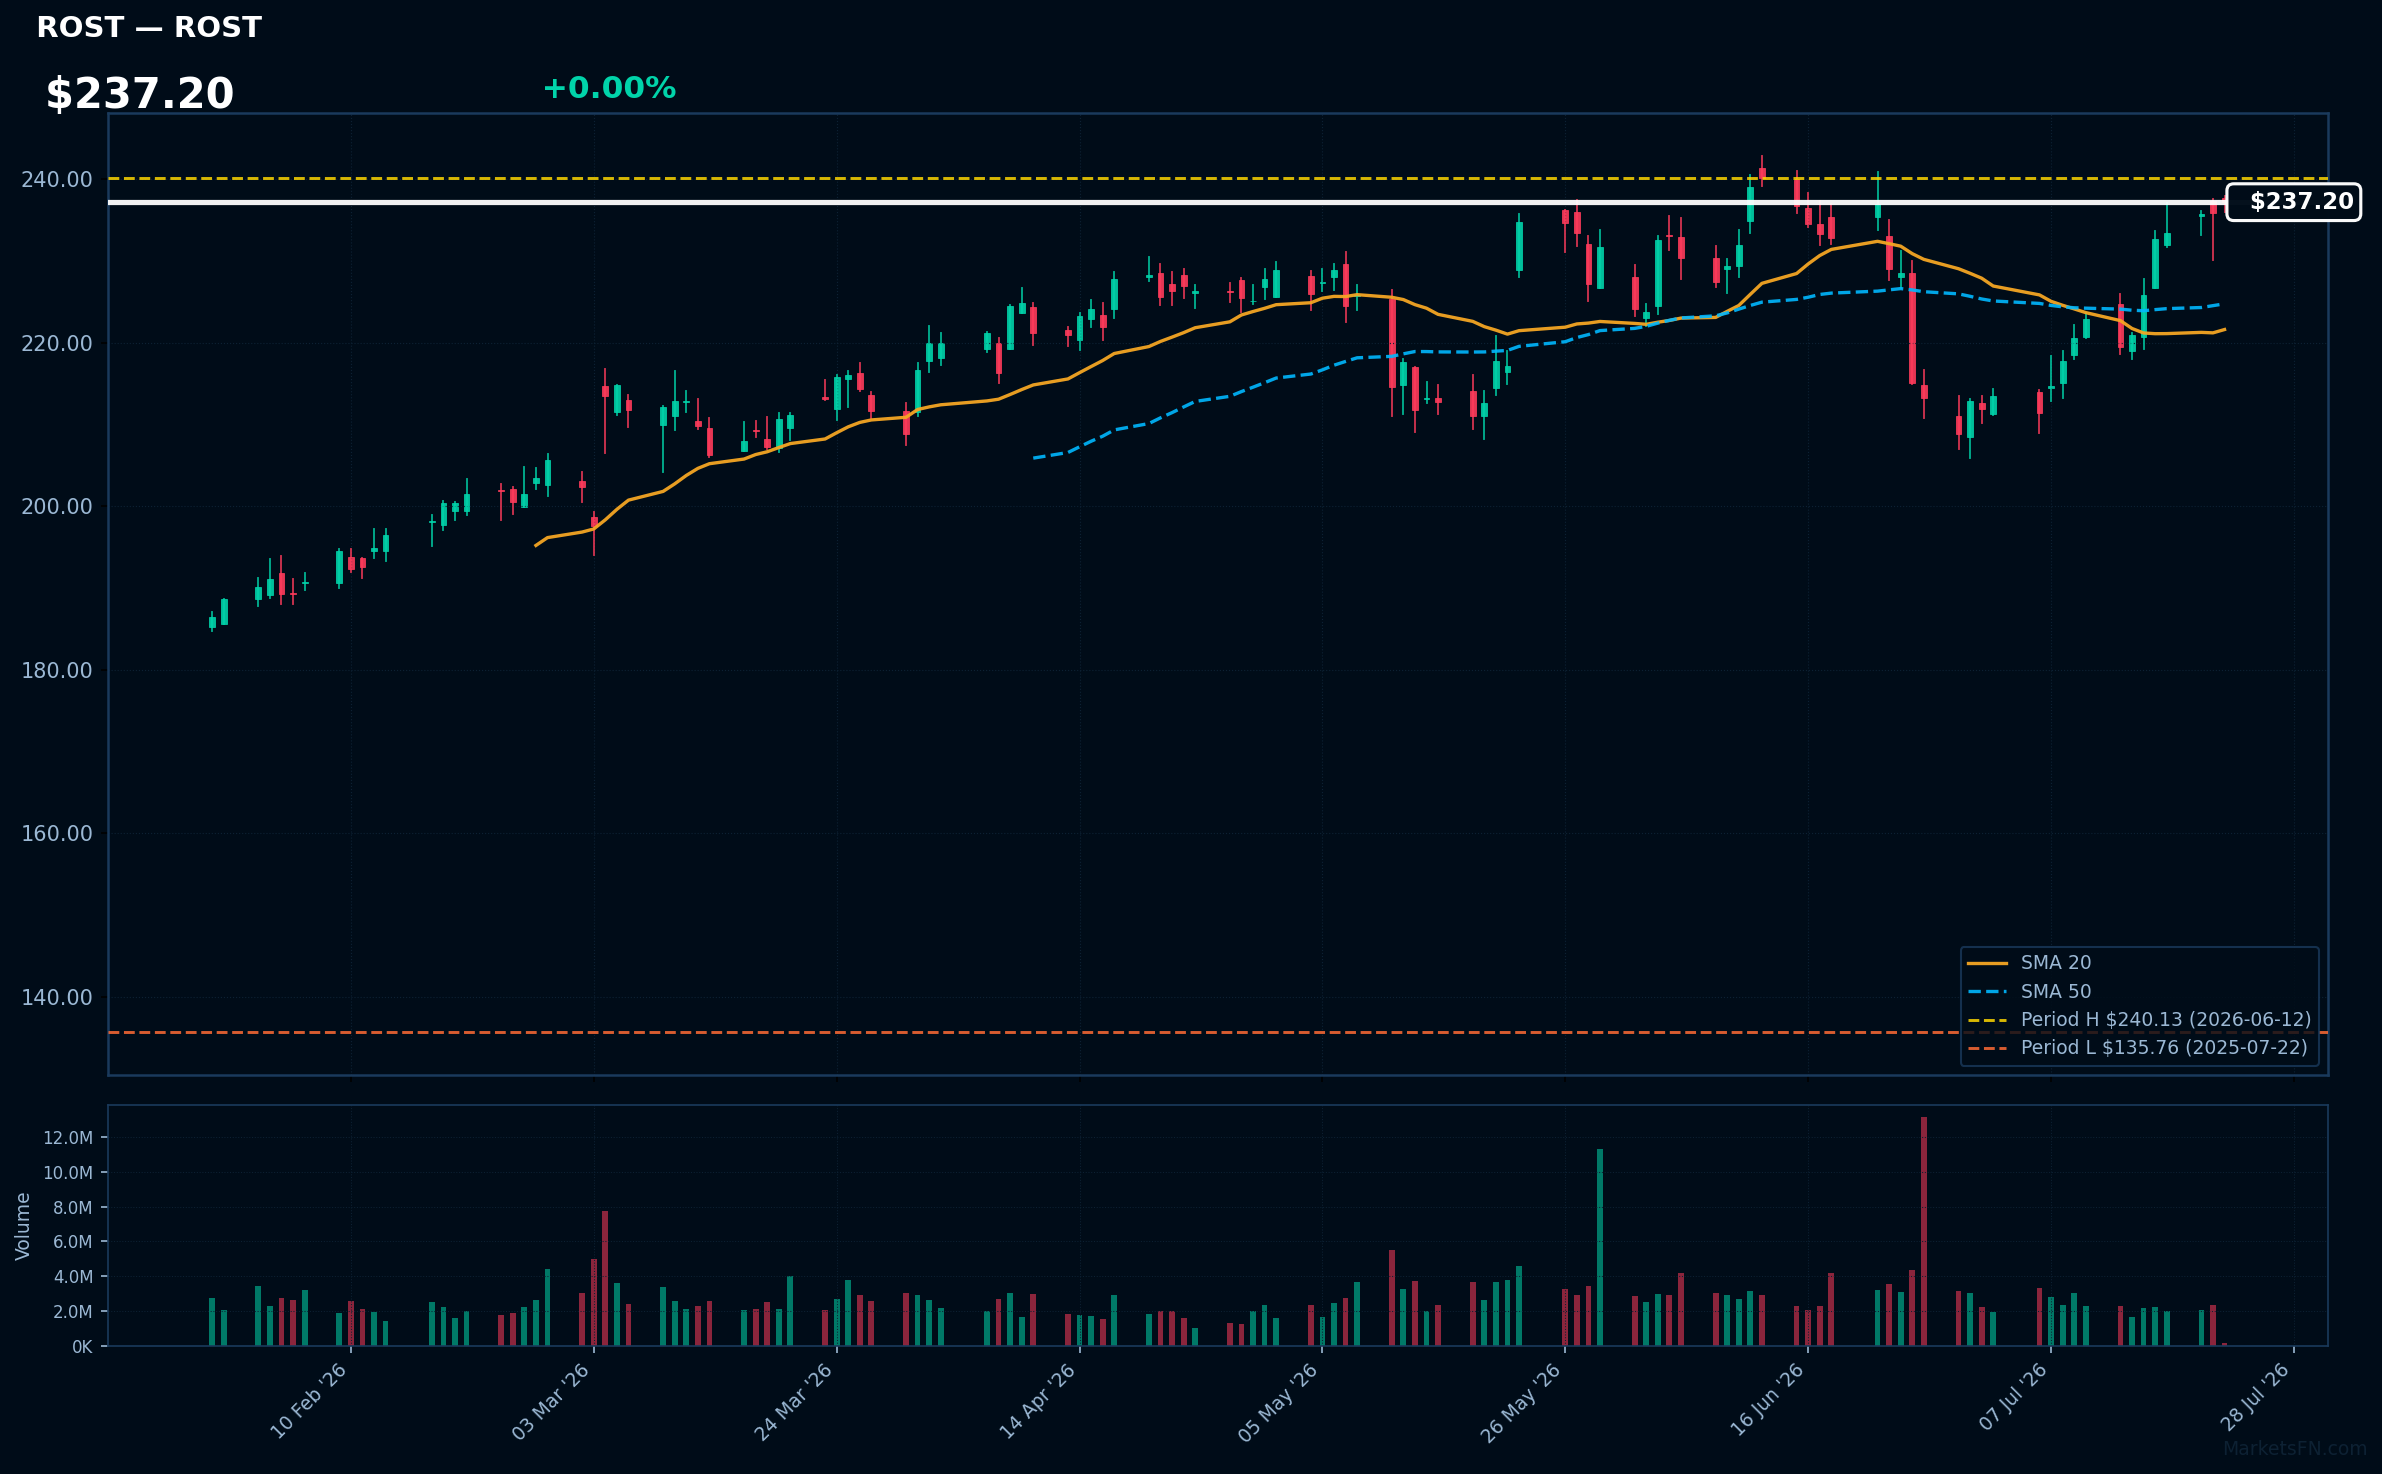
ROST | Ross Stores, Inc | Consumer Cyclical | Price Last: $237.20 | % Realized: +74.72% | RSI: 64.8 | % above MA200: +19.1% | Trend: Above MA20, MA50, MA200
Ross Stores, Inc operates an off-price retail model, offering discounted branded apparel and home goods. Investors should care about its ability to maintain margins and same-store sales growth amidst a competitive retail landscape.
Ross Stores shows a bullish technical setup with RSI(14) at 64.8, price above MA20/MA50/MA200, and is 1.2% below its 52-Week high, indicating potential momentum; the stock has gained 74.7% over the 52-Week period.
Related headlines
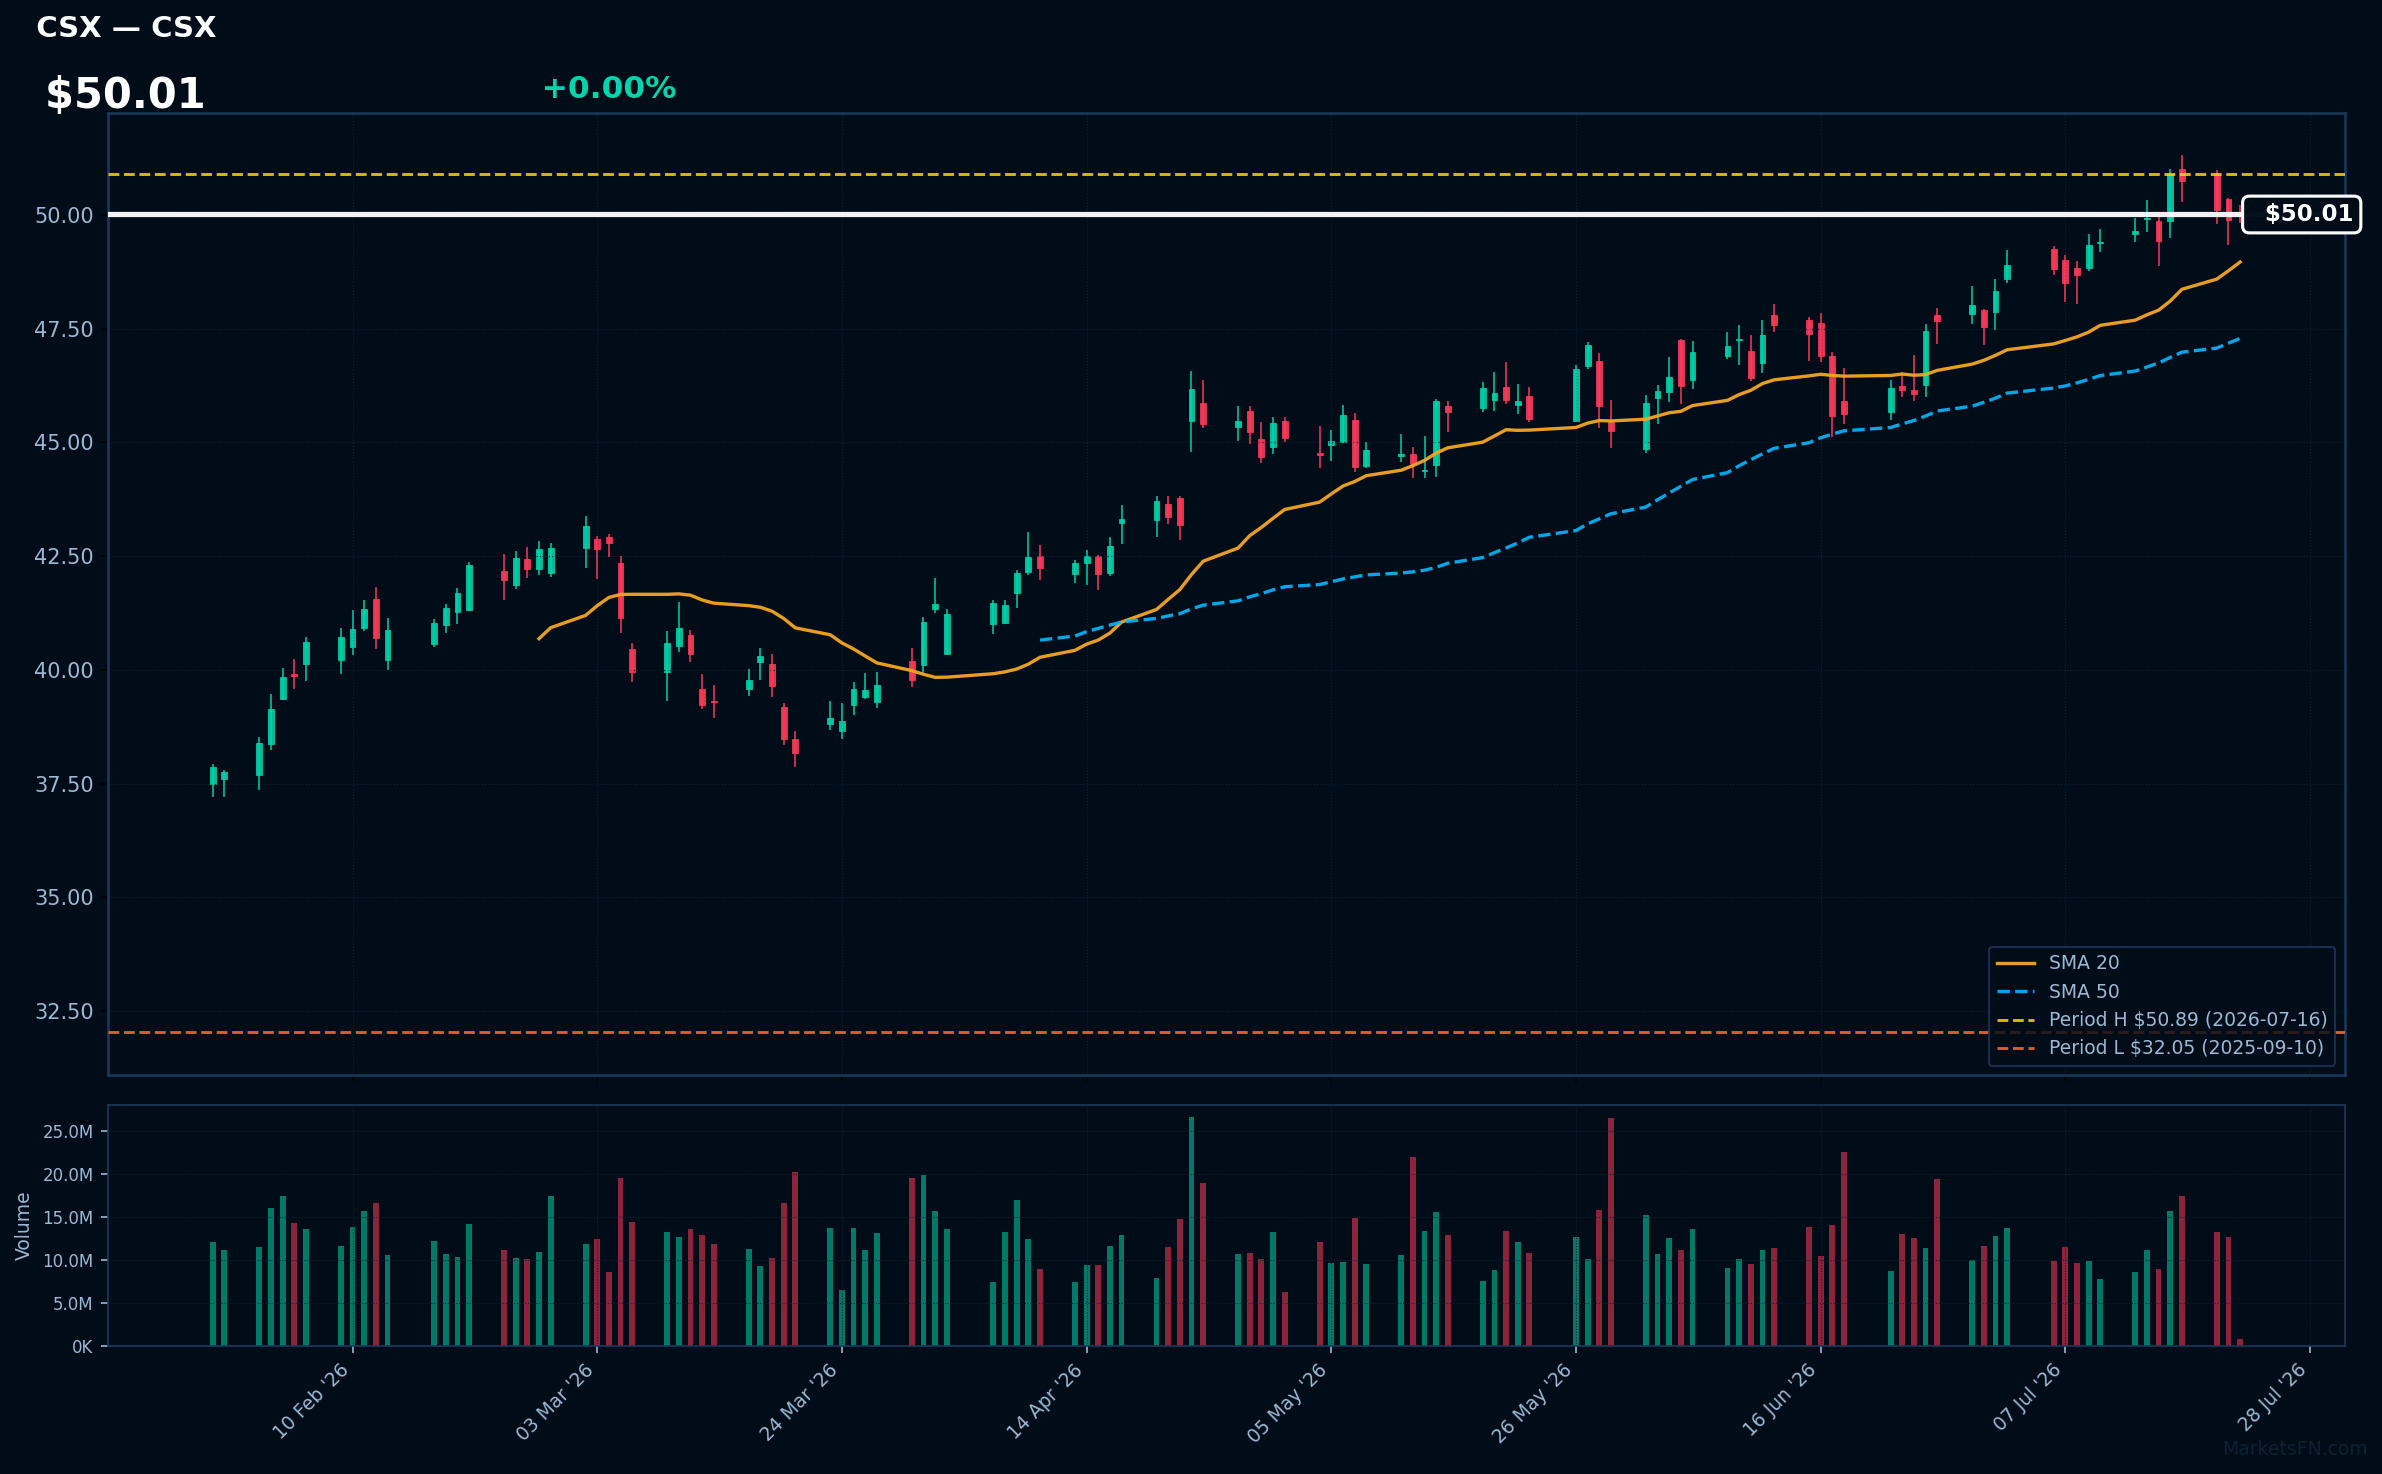
CSX | CSX Corp | Industrials | Price Last: $50.03 | % Realized: +42.01% | RSI: 62.1 | % above MA200: +22.7% | Trend: Above MA20, MA50, MA200
CSX Corp operates a rail network transporting coal, intermodal containers, and automotive goods, making it a key player in North American freight. Investors care due to its exposure to economic growth and commodity demand fluctuations.
CSX is in a sustained uptrend with price > MA20 > MA50 > MA200, RSI(14) at 62.1, and is 1.7% below its 52-Week high, indicating strong momentum with potential for a breakout.
Related headlines
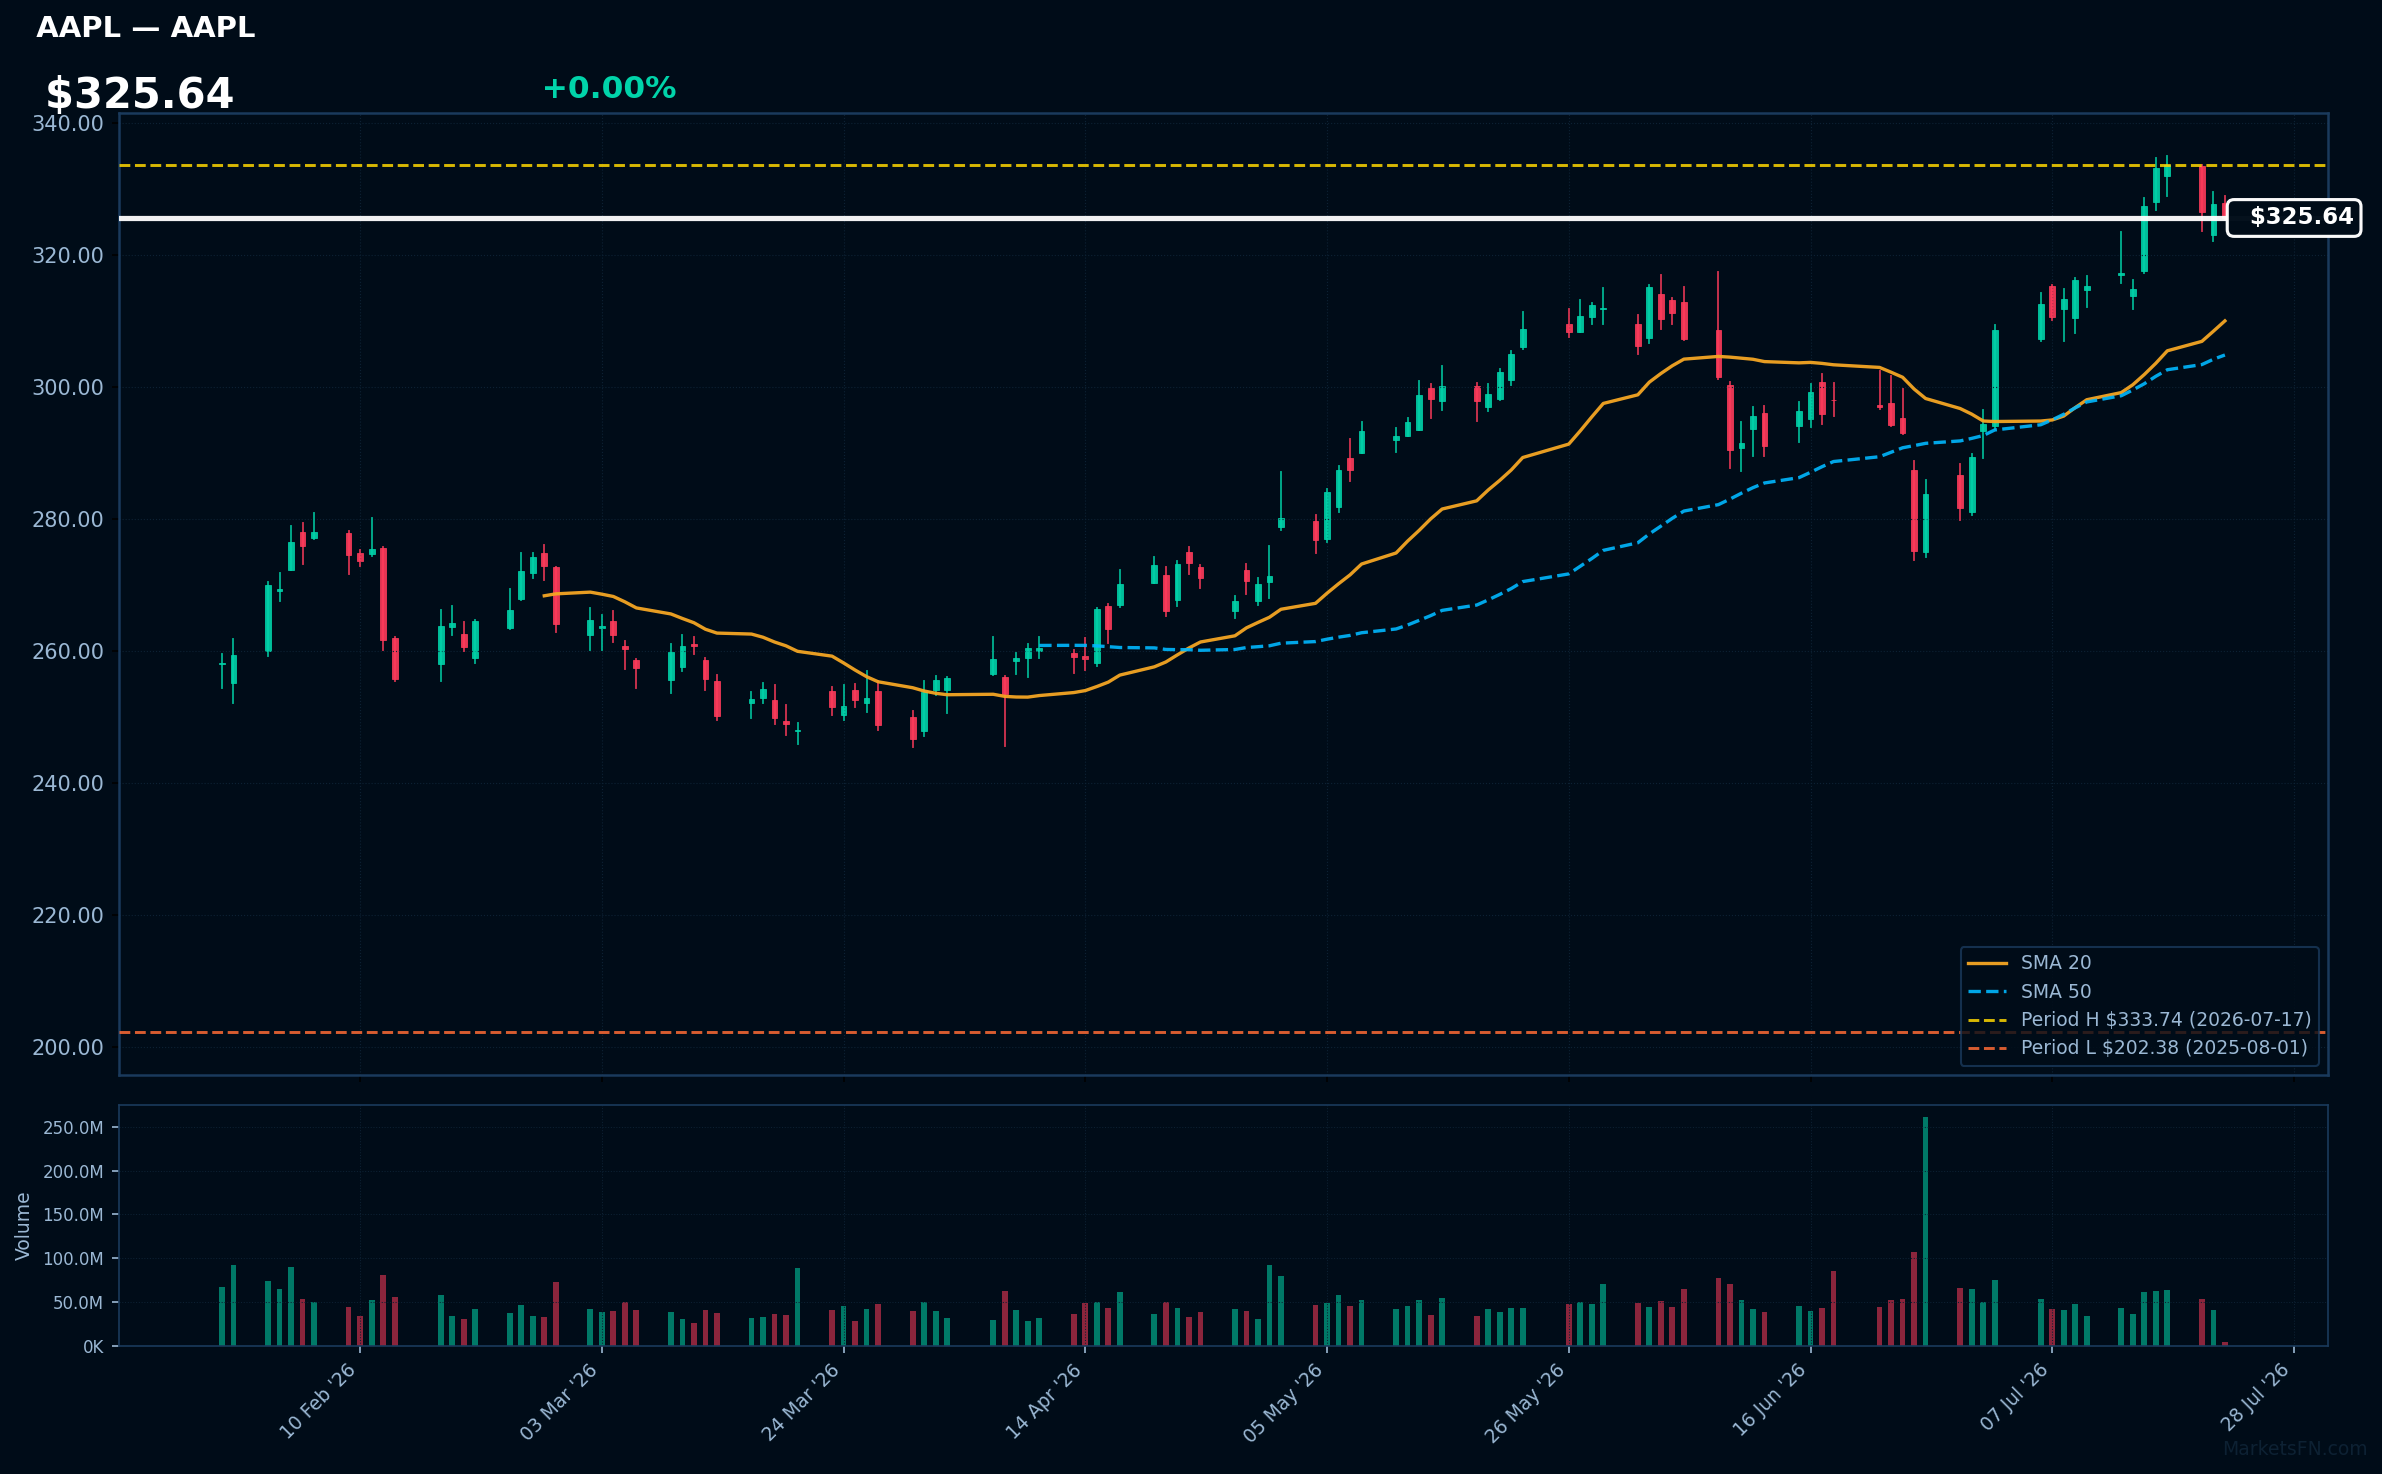
AAPL | Apple Inc | Technology | Price Last: $325.56 | % Realized: +51.85% | RSI: 62.3 | % above MA200: +18.3% | Trend: Above MA20, MA50, MA200
Apple Inc designs, manufactures, and markets consumer electronics, software, and services. Investors care about its innovative product ecosystem, services growth, and profitability. Its flagship products, like iPhones, drive revenue, while services like Apple Music and iCloud contribute to profitability.
AAPL's RSI(14) is 62.3, indicating rising momentum. The MA alignment (price > MA20 > MA50 > MA200) suggests a sustained uptrend. Being 2.5% below its 52-Week high, it nears a potential breakout, with a 51.8% 52-Week return, reinforcing its strong upward trajectory.
Related headlines
📉 Nearest to 52-Week Low
Sectors represented: Consumer Defensive (1), Real Estate (1), Industrials (1), Healthcare (1), Technology (1)
| Ticker | Company | Sector | Price Last | % Realized | 52-Week Low Date | RSI | % above MA200 | Trend |
|---|---|---|---|---|---|---|---|---|
| PEP | PepsiCo Inc | Consumer Defensive | $135.13 | -7.47% | 2026-07-21 | 40.2 | -9.8% | Below MA20, MA50, MA200 |
| CSGP | Costar Group, Inc | Real Estate | $27.84 | -67.31% | 2026-07-14 | 40.3 | -44.9% | Below MA20, MA50, MA200 |
| CPRT | Copart, Inc | Industrials | $27.42 | -40.90% | 2026-07-21 | 38.7 | -24.7% | Below MA20, MA50, MA200 |
| ISRG | Intuitive Surgical Inc | Healthcare | $348.73 | -31.75% | 2026-07-17 | 32.5 | -28.1% | Below MA20, MA50, MA200 |
| SNPS | Synopsys, Inc | Technology | $388.23 | -36.89% | 2026-07-20 | 29.1 | -14.2% | Below MA20, MA50, MA200 |
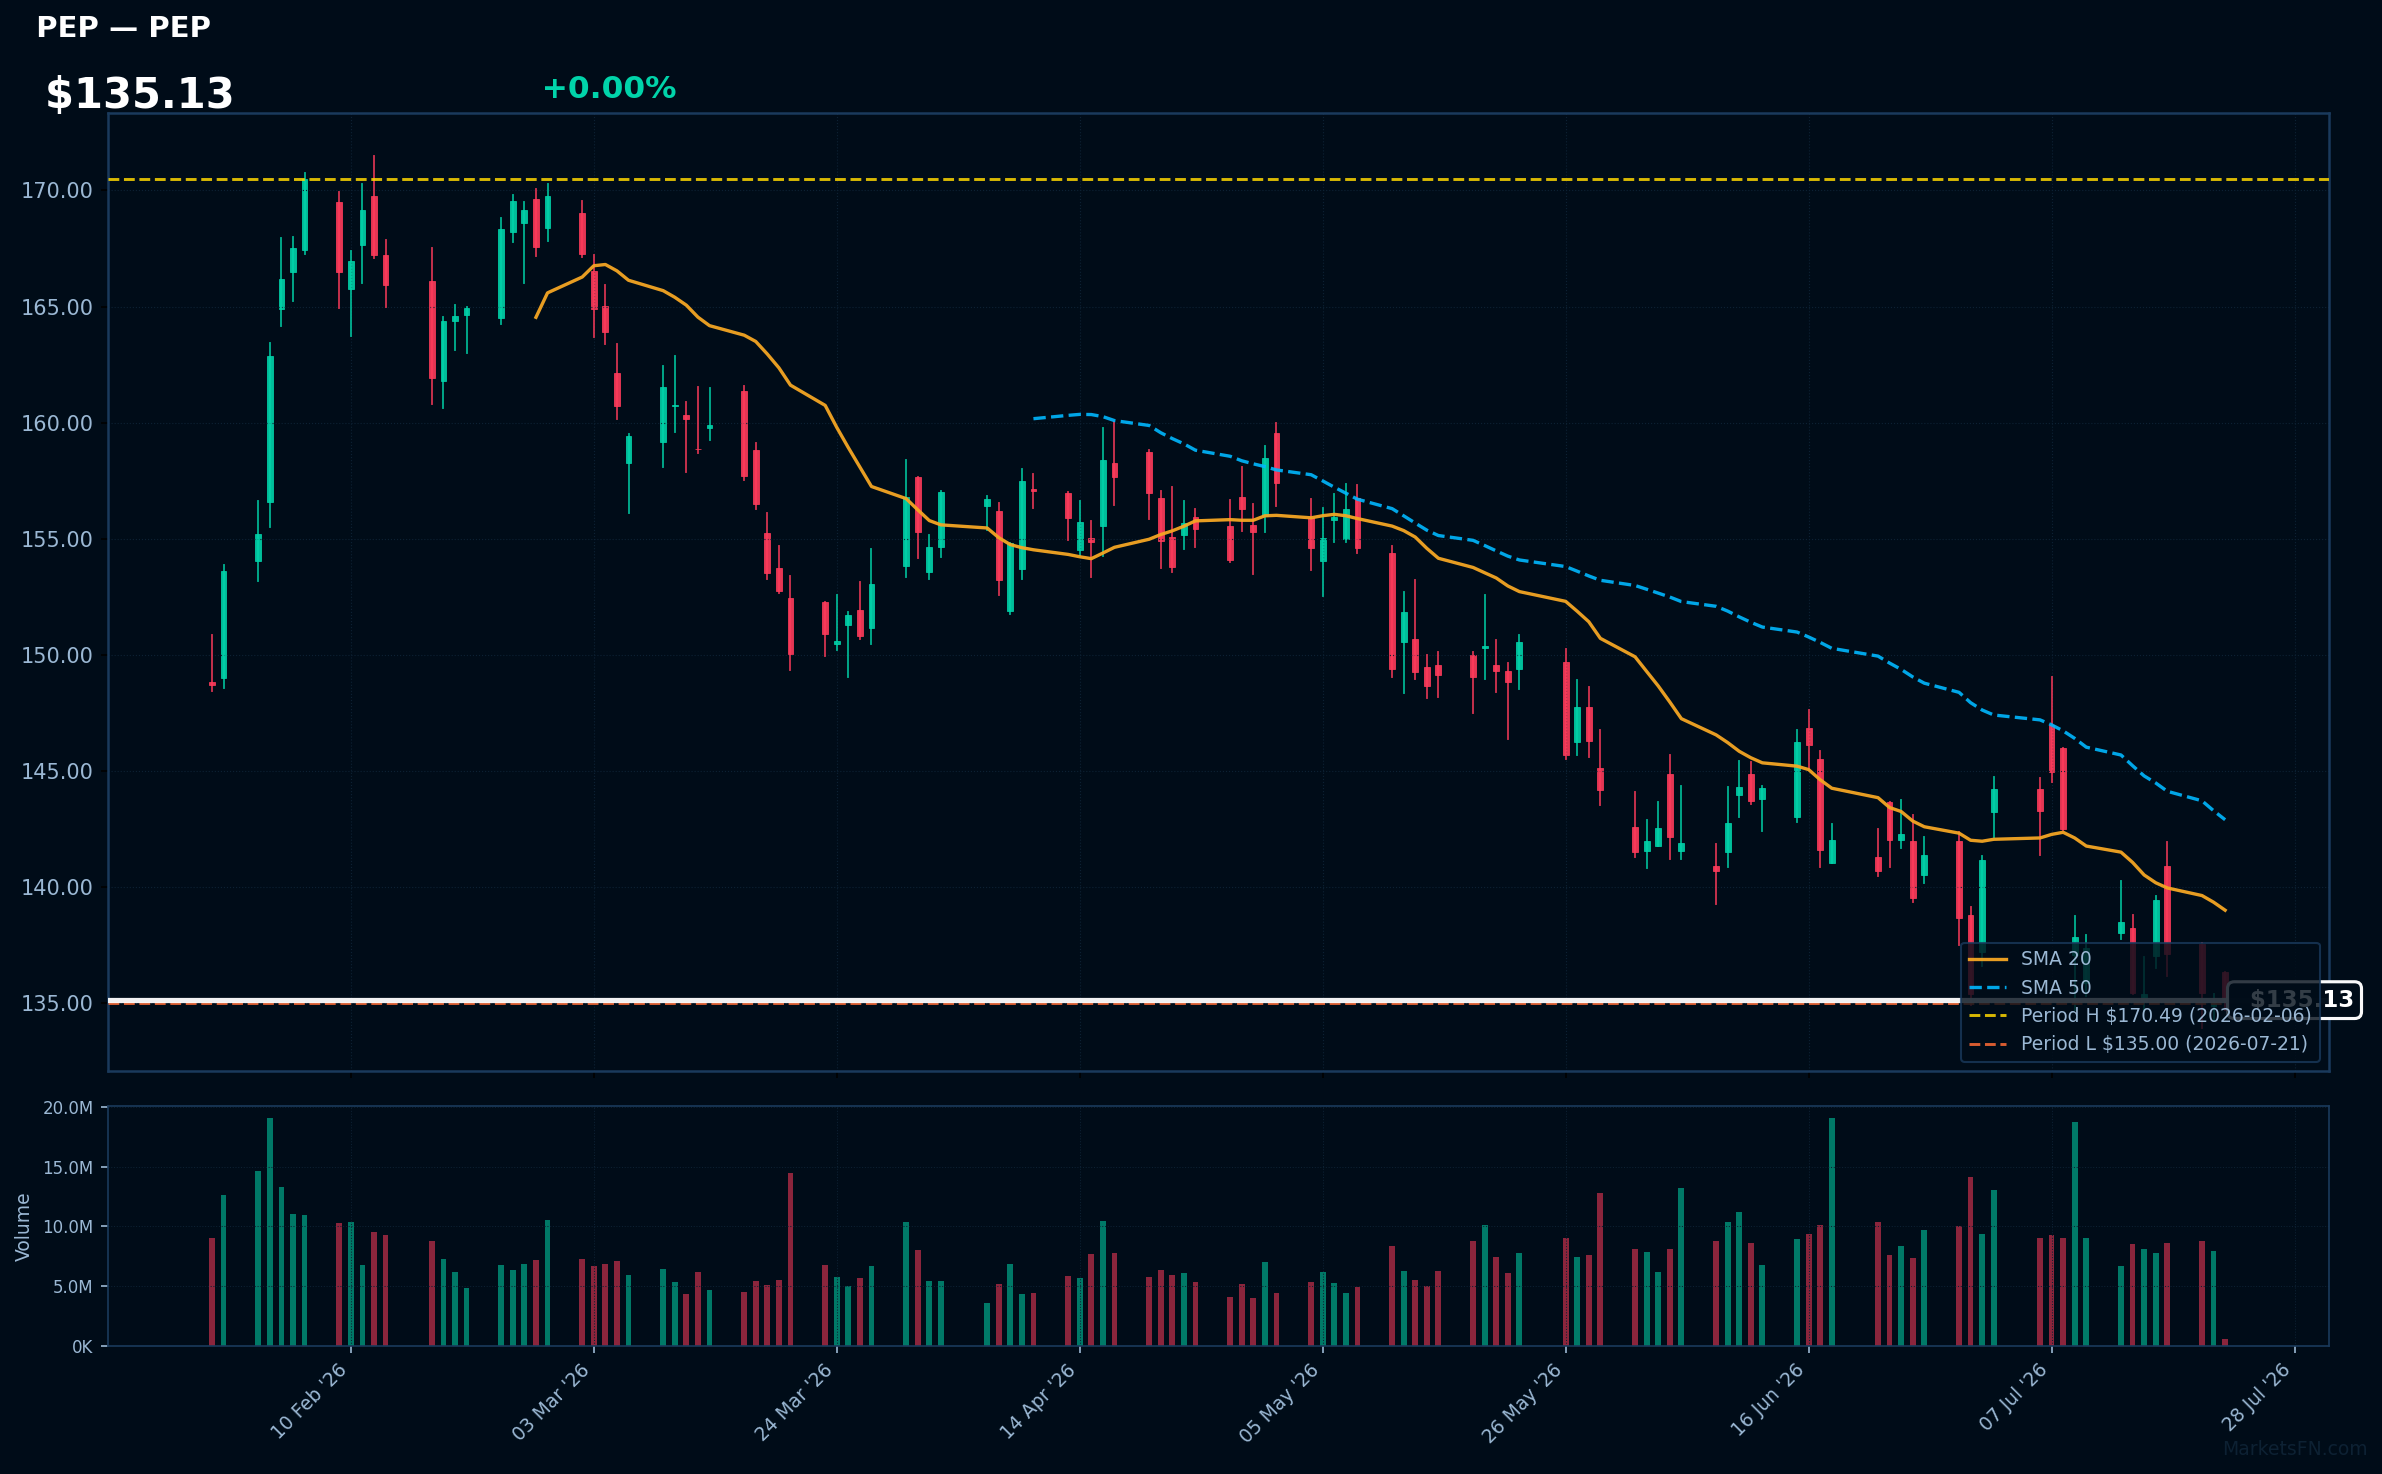
PEP | PepsiCo Inc | Consumer Defensive | Price Last: $135.13 | % Realized: -7.47% | RSI: 40.2 | % above MA200: -9.8% | Trend: Below MA20, MA50, MA200
PepsiCo Inc is a diversified food and beverage company with brands like Pepsi, Lay's, and Gatorade, generating revenue through beverage sales, snack foods, and other categories, making it a significant player in the consumer staples sector.
PepsiCo's current technical situation is bearish, with an RSI(14) of 40.2, price below MA20, MA50, and MA200, and a 52-Week return of -7.5%, indicating a sustained downtrend and testing major support at its 52-Week low.
Related headlines
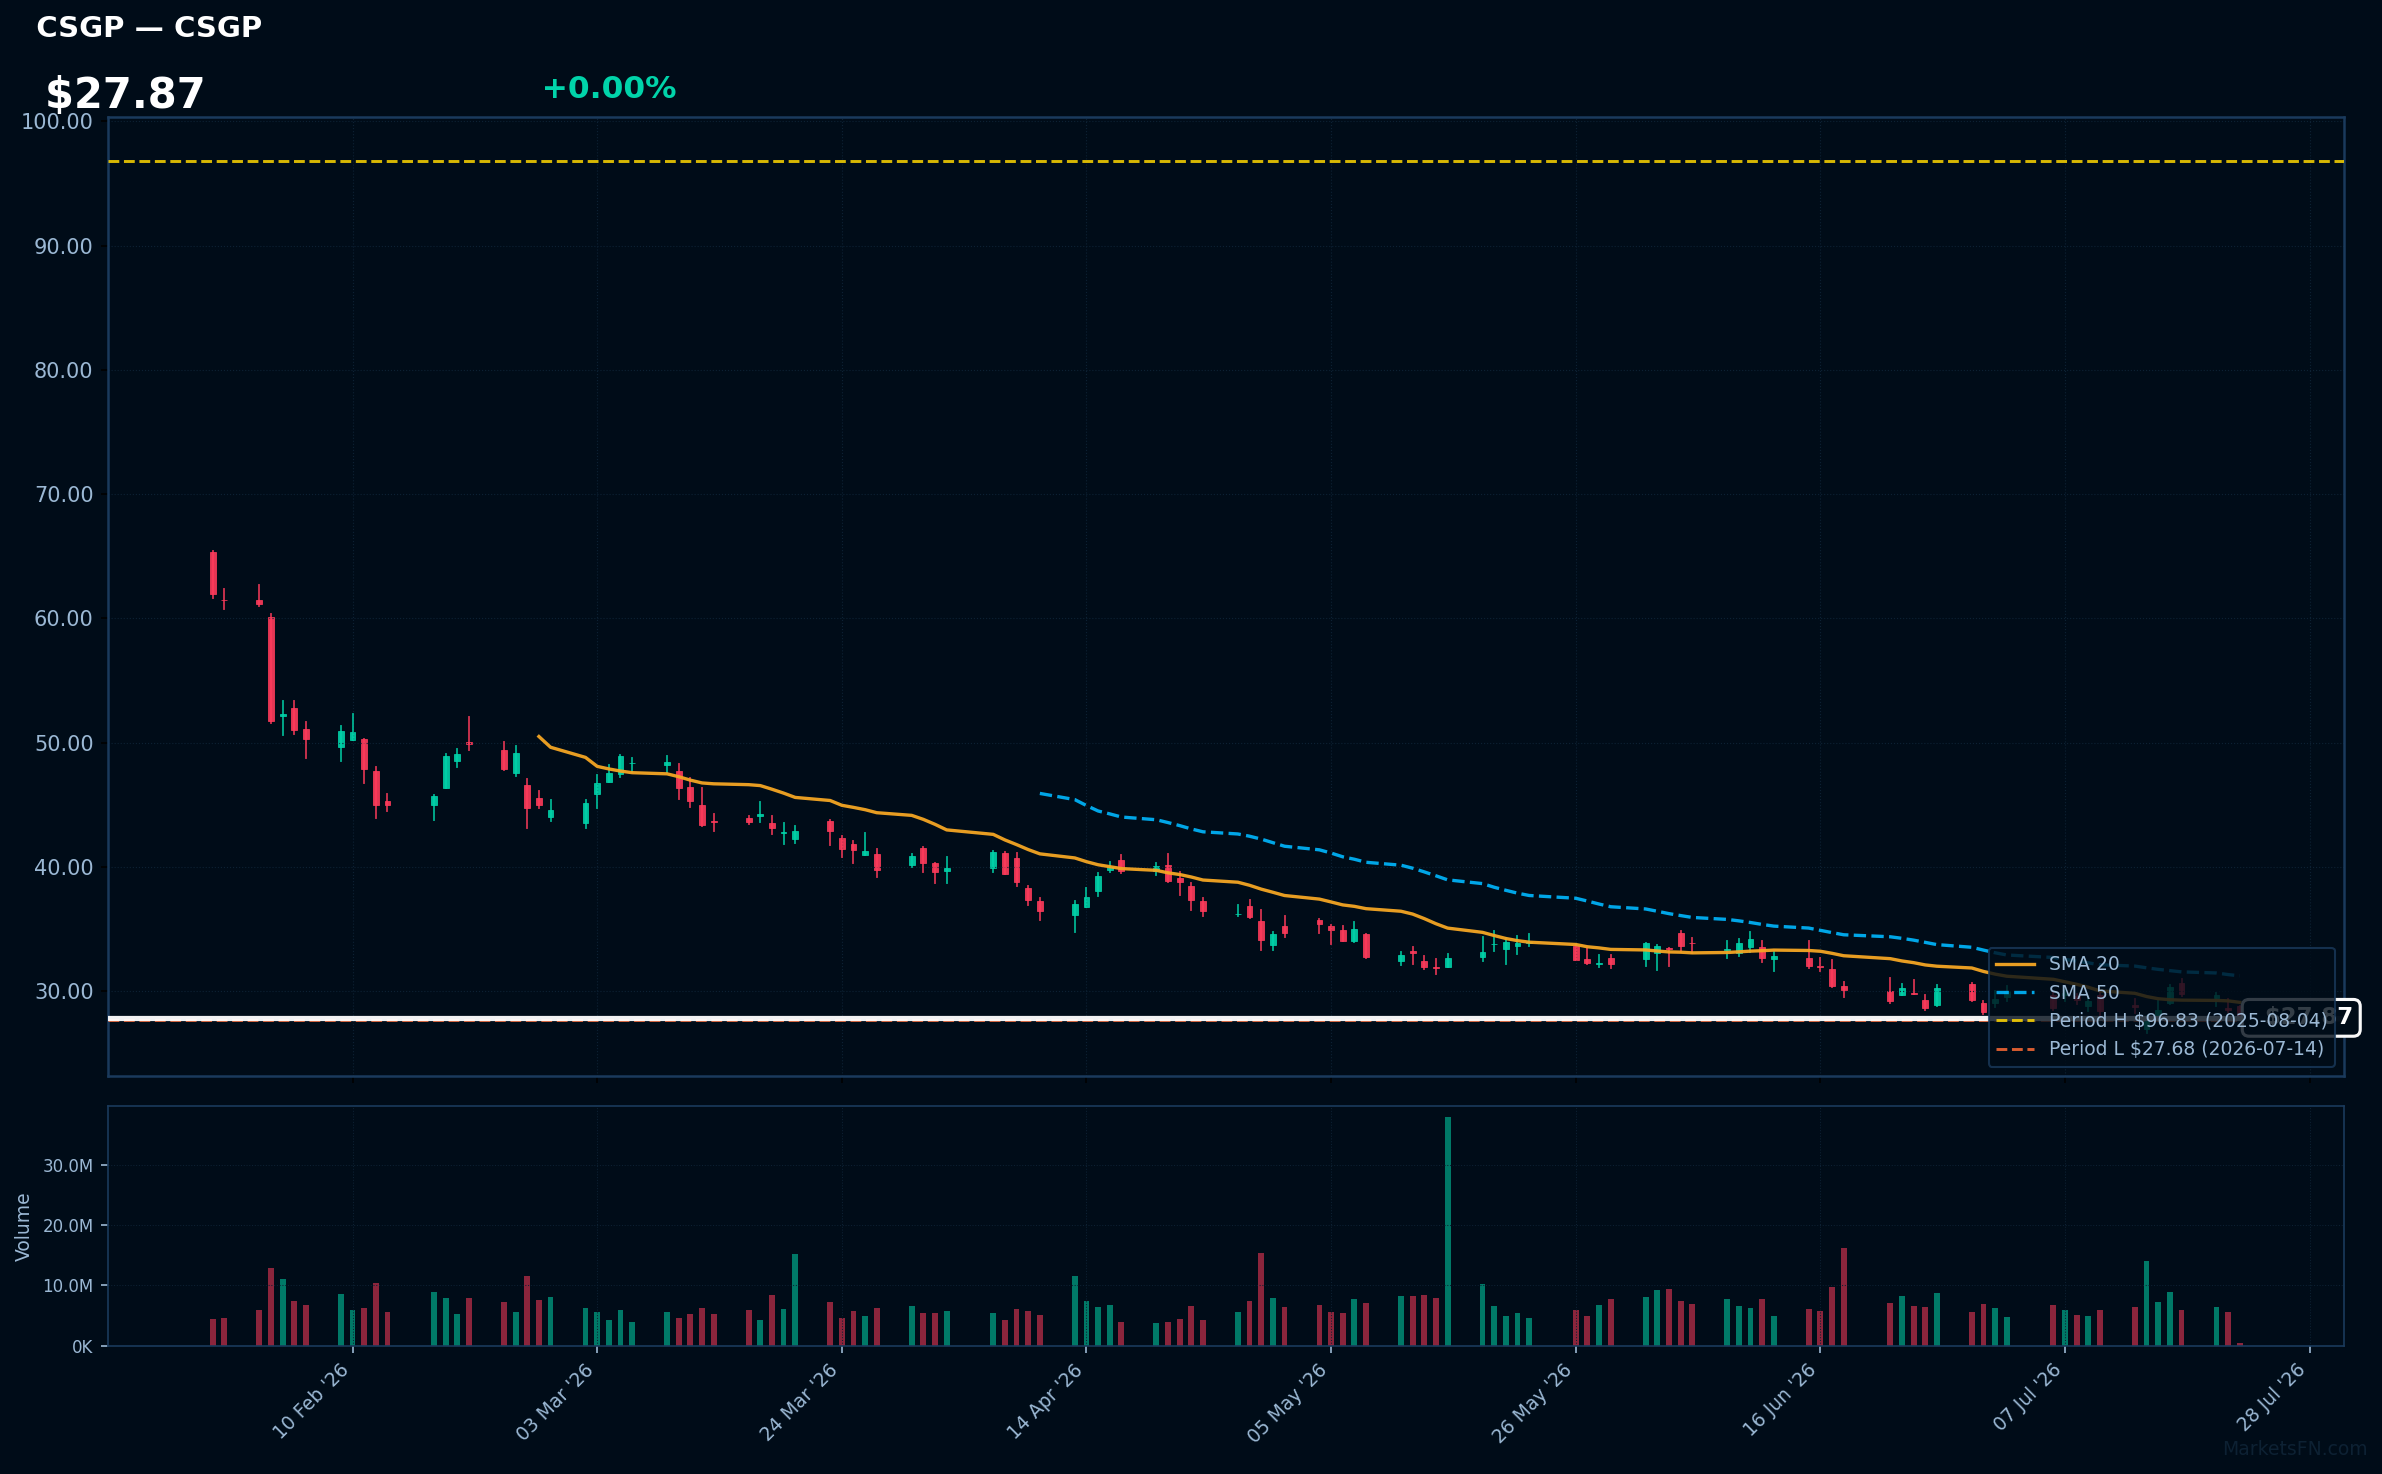
CSGP | Costar Group, Inc | Real Estate | Price Last: $27.84 | % Realized: -67.31% | RSI: 40.3 | % above MA200: -44.9% | Trend: Below MA20, MA50, MA200
Costar Group, Inc provides commercial real estate information, analytics, and marketplace services, enabling clients to make informed decisions. Investors should care as it dominates the commercial real estate data space, generating revenue through subscription-based services.
The stock exhibits a sustained downtrend with price ($27.87) below MA20, MA50, and MA200, RSI(14) at 40.3 indicating bearish momentum, and is 0.6% above its 52-Week low, testing major support, warning of potential further decline.
Related headlines
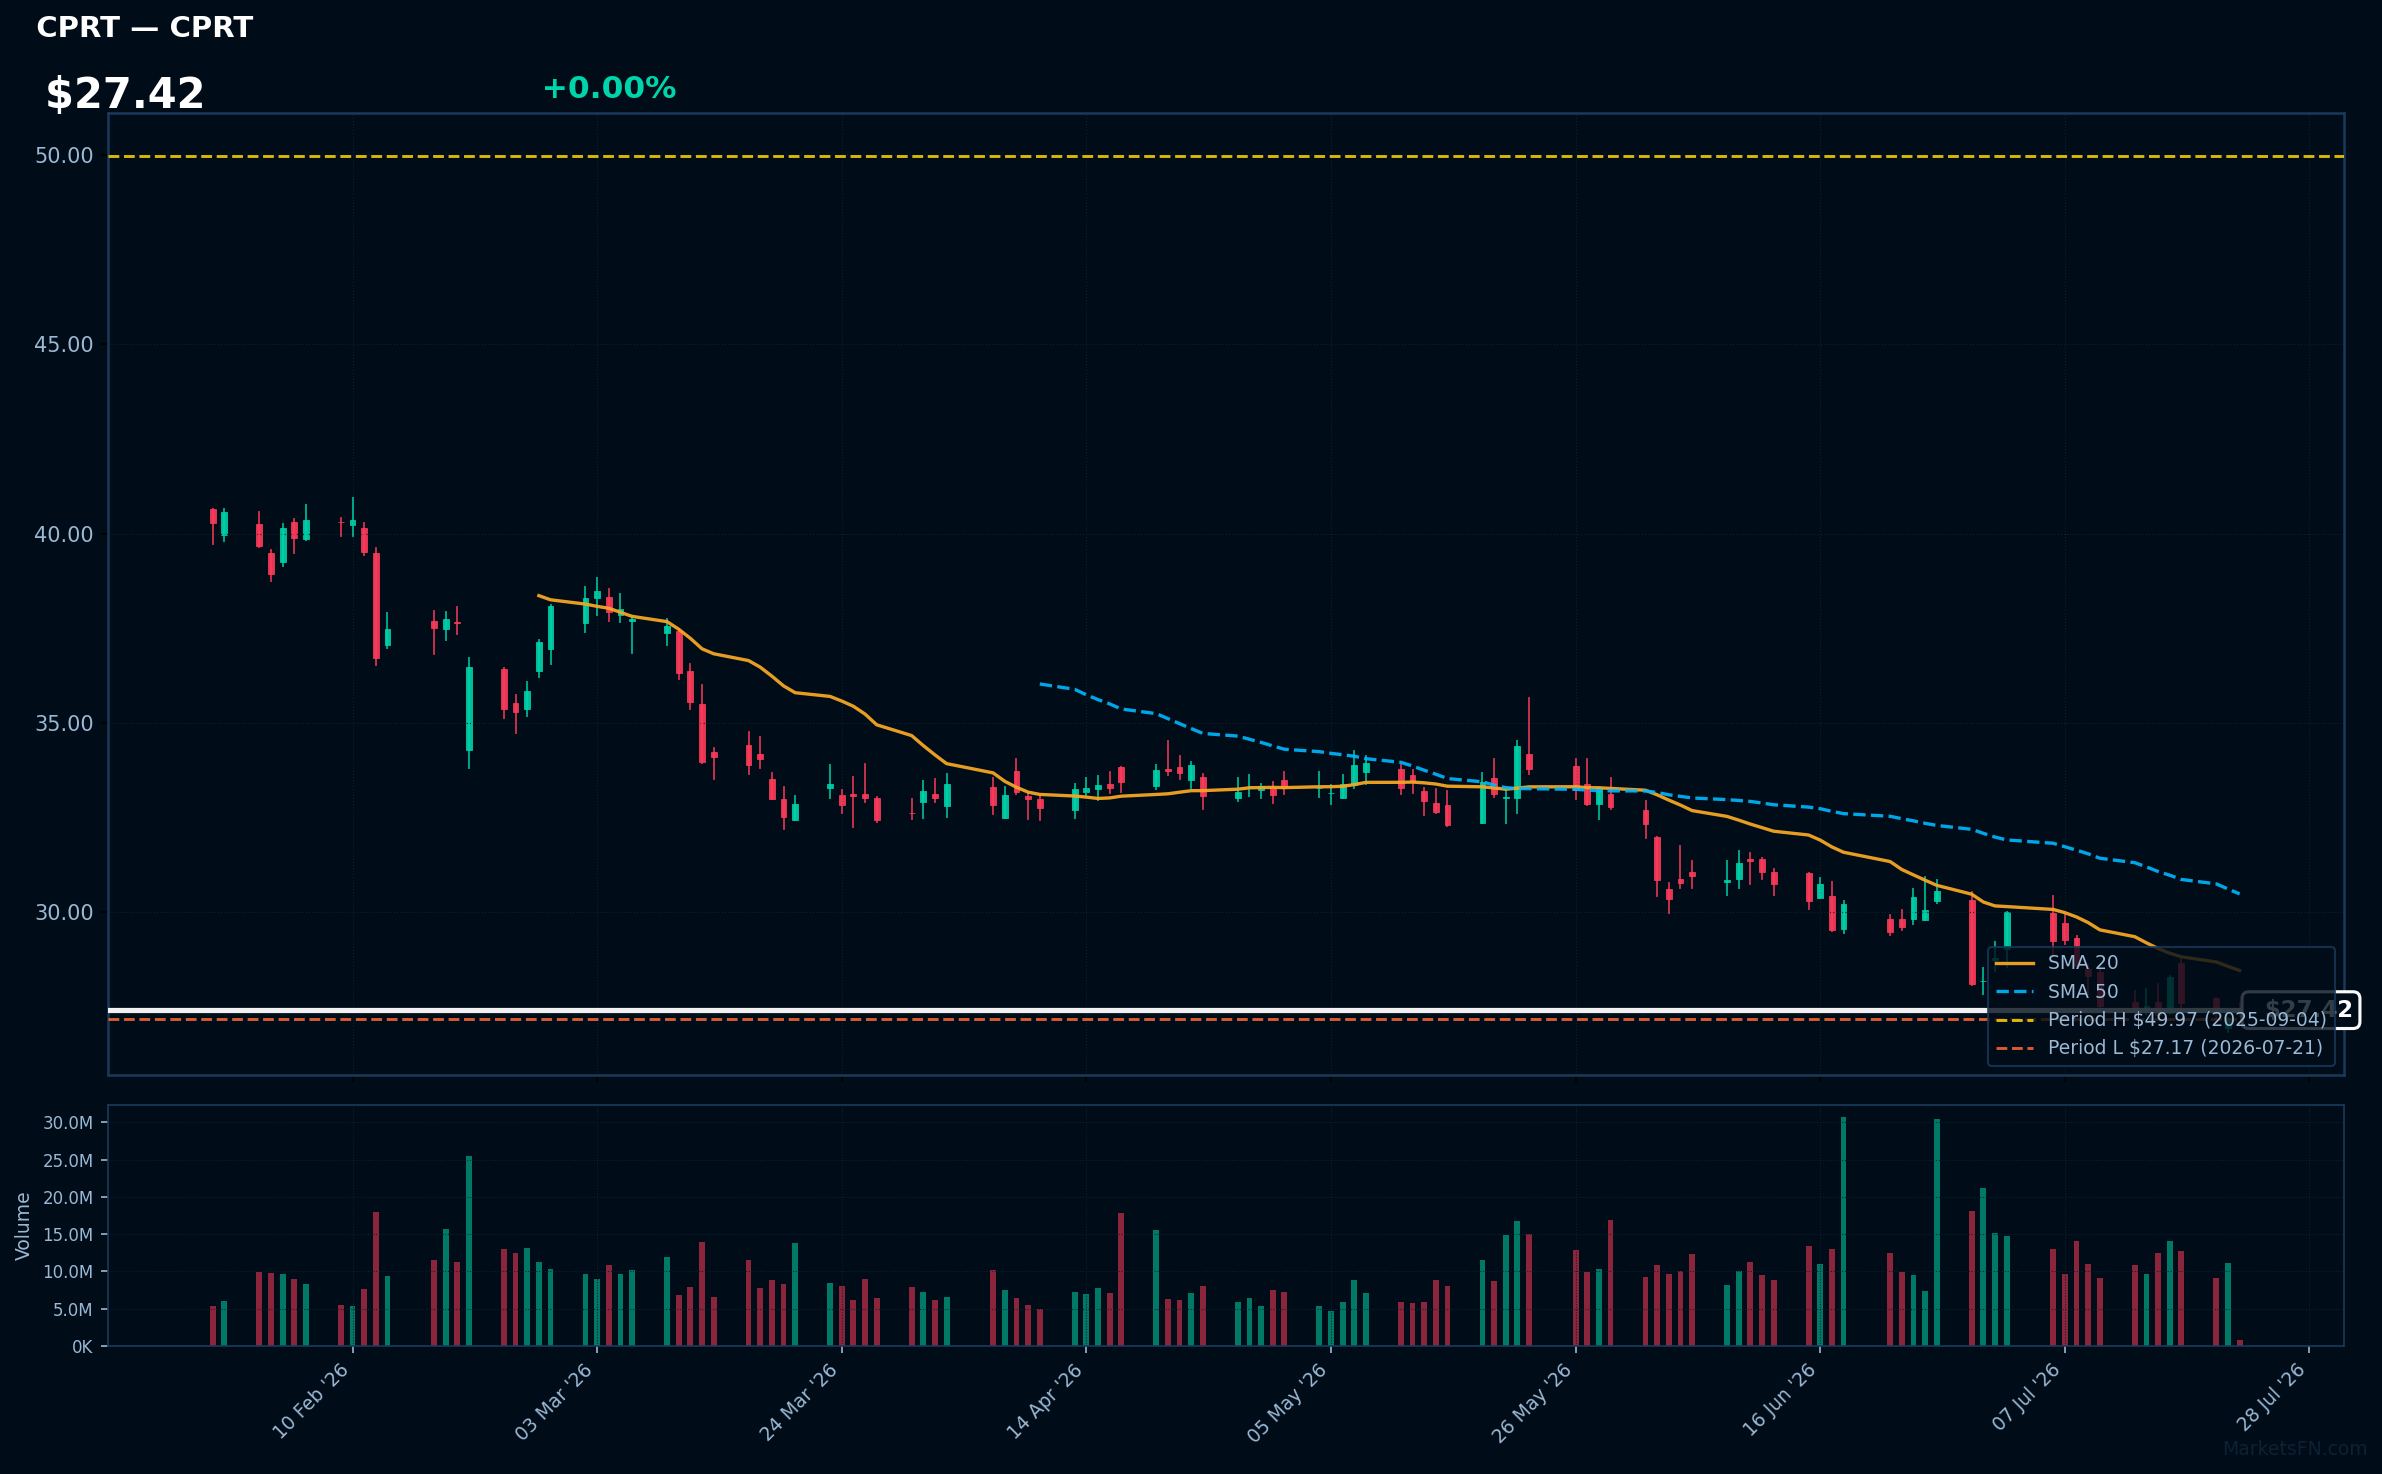
CPRT | Copart, Inc | Industrials | Price Last: $27.42 | % Realized: -40.90% | RSI: 38.7 | % above MA200: -24.7% | Trend: Below MA20, MA50, MA200
Copart, Inc (CPRT) operates an online vehicle auction platform and provides related services, allowing insurance companies and other sellers to sell damaged or used vehicles to buyers globally. Investors care due to its market dominance and growth prospects in the vehicle remarketing industry.
Copart's technical situation indicates a sustained downtrend with price ($27.42) below MA20, MA50, and MA200. The RSI(14) is 38.7, nearing oversold territory, and the stock is 0.9% above its 52-Week low, testing major support, potentially a warning sign.
Related headlines
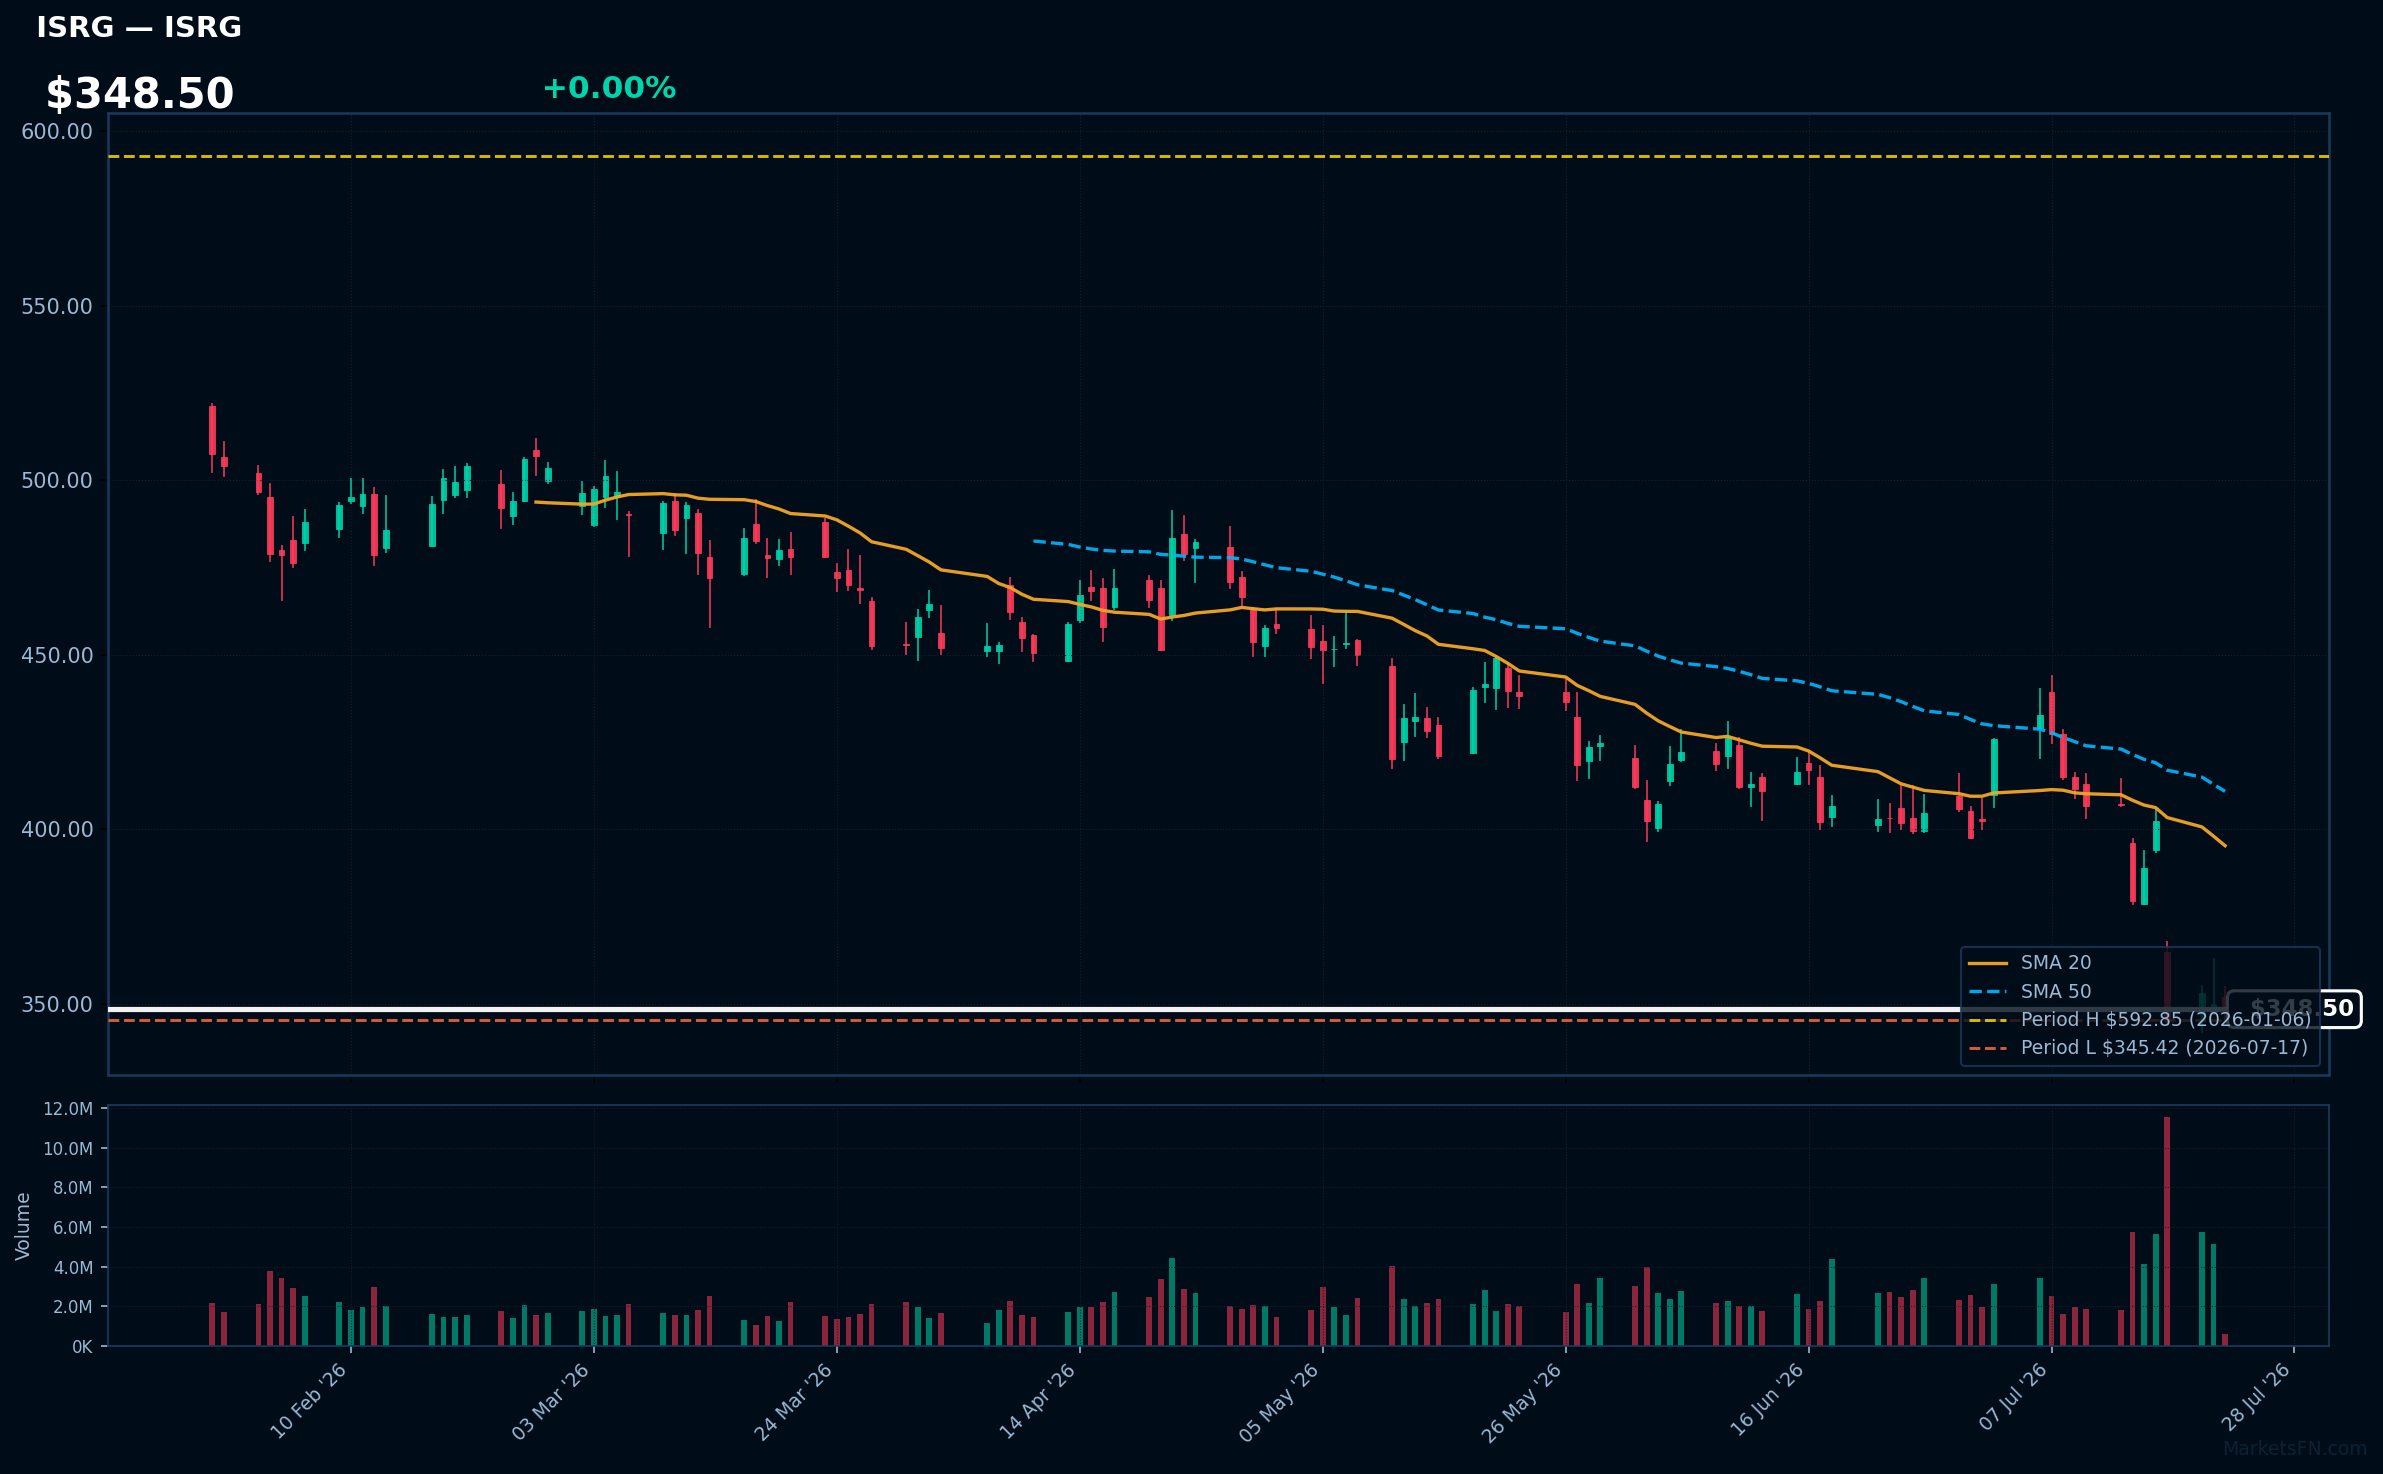
ISRG | Intuitive Surgical Inc | Healthcare | Price Last: $348.73 | % Realized: -31.75% | RSI: 32.5 | % above MA200: -28.1% | Trend: Below MA20, MA50, MA200
Intuitive Surgical Inc develops and markets robotic-assisted surgical systems, primarily the da Vinci system, which enables minimally invasive surgeries. Investors care due to its market dominance and growth potential in the surgical robotics market.
The stock is in a sustained downtrend with price ($348.50) < MA20 < MA50 < MA200, RSI(14) at 32.5, and is 1.0% above its 52-Week low, indicating a potential warning sign as it tests major support with a 52-Week return of -31.8%.
Related headlines
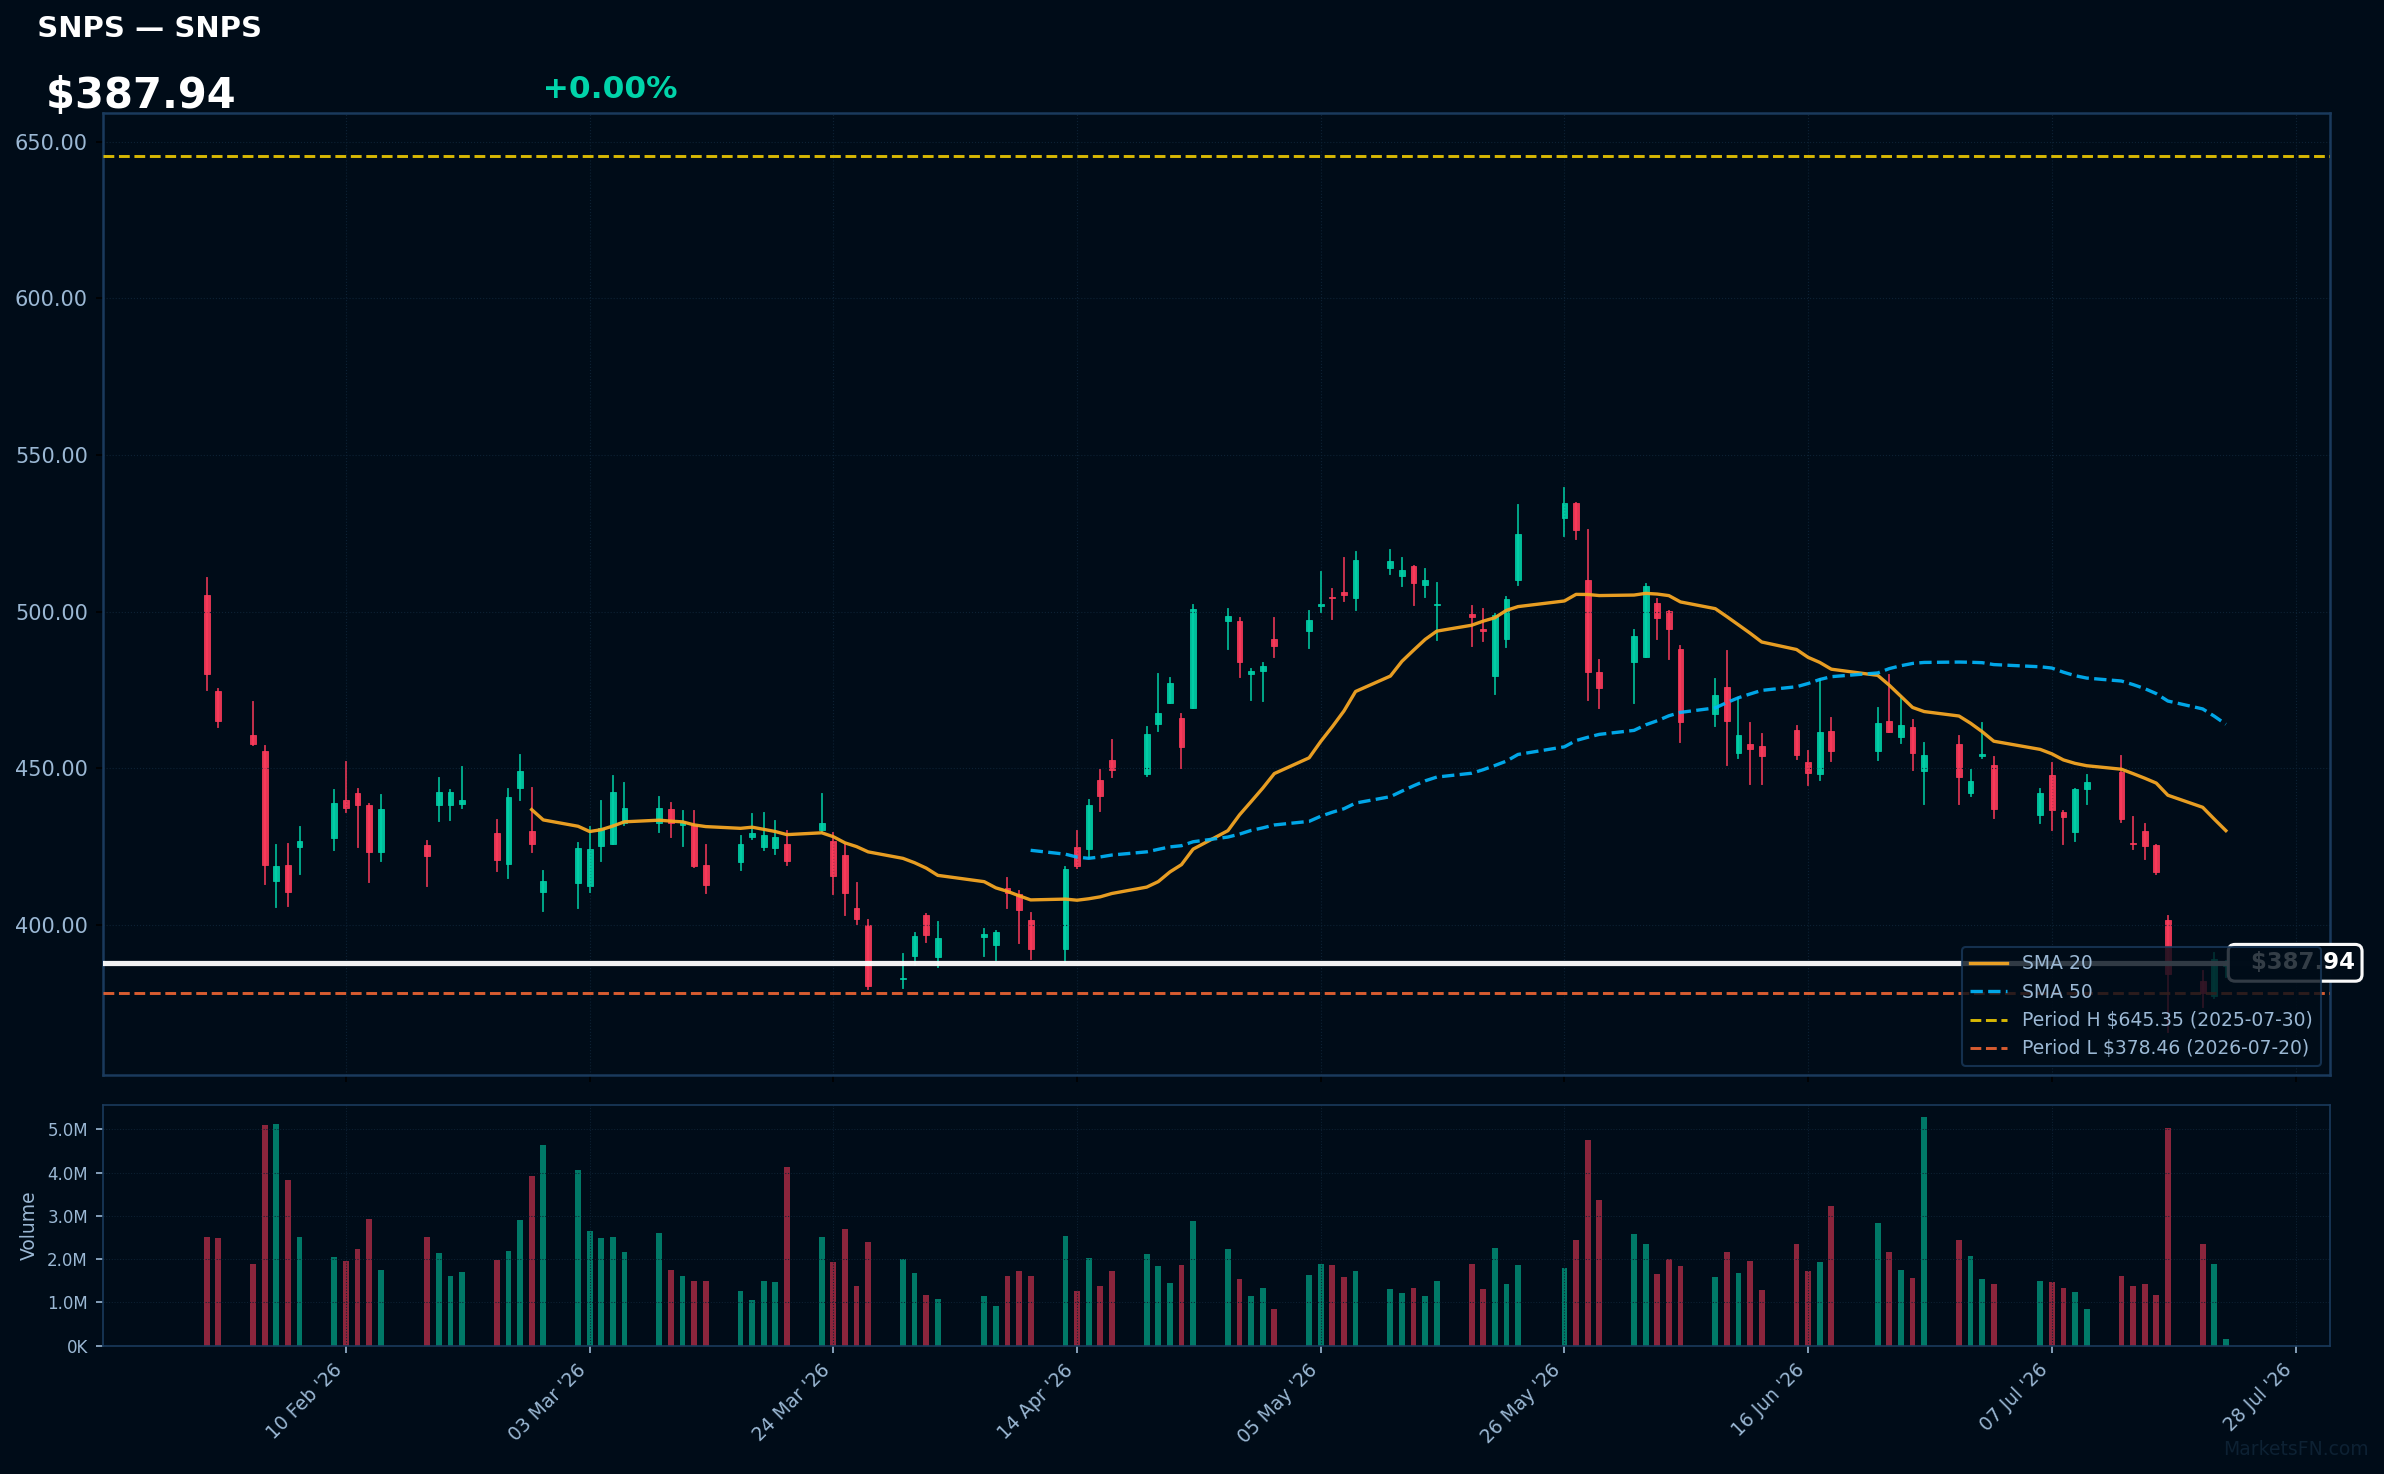
SNPS | Synopsys, Inc | Technology | Price Last: $388.23 | % Realized: -36.89% | RSI: 29.1 | % above MA200: -14.2% | Trend: Below MA20, MA50, MA200
Synopsys, Inc is a software company that provides electronic design automation (EDA) tools and semiconductor intellectual property (IP) used in the design and verification of complex digital systems-on-chips (SoCs), making it a crucial player in the semiconductor industry.
Synopsys' current technical situation shows a potential warning sign with an RSI(14) of 29.1, indicating oversold conditions, and the stock is below MA20, MA50, and MA200, with a price only 2.6% above its 52-Week low.
Related headlines
Market Commentary
The Nasdaq 100 stocks listed near 52-week extremes indicate a significant price movement. Stocks near 52-week highs, such as AAPL and EA, suggest strong investor confidence, while those near 52-week lows, like PEP and SNPS, may indicate potential concerns or undervaluation.
The technology sector is driving these price levels, with companies like AAPL and ISRG reflecting broader market trends. Macro themes, including consumer spending (ROST) and industrial activity (CSX), are also influencing these stocks. The presence of tech giants and industry leaders near extremes highlights the sector's sensitivity to market sentiment.
Key levels to watch include the 52-week highs and lows for these stocks. A breakout above the 52-week high for stocks like EA and AAPL, or a breakdown below the 52-week low for SNPS and PEP, could be significant. Potential catalysts include earnings reports, industry trends, and macroeconomic indicators. Monitoring these levels and catalysts will be crucial in determining the next direction for these Nasdaq 100 stocks.
Methodology: All 101 Nasdaq 100 constituents screened. 52-week high = highest daily close over the past 252 trading days (approx. 1 year). 52-week low = lowest daily close over the same period. Distance = (current price / extreme − 1) × 100. Technical indicators computed on up to 1 year of daily OHLCV data.
Disclaimer: For informational purposes only. Not investment advice. Past performance is not indicative of future results.

