Nasdaq 100 52-Week Highs & Lows Radar: Palo Alto Networks (PANW), PepsiCo (PEP) and more
MarketsFN Team

Nasdaq 100 52-Week Highs & Lows Radar: Palo Alto Networks (PANW), PepsiCo (PEP) and more
Screening all 101 Nasdaq 100 constituents for stocks nearest to their 52-week high and their 52-week low. Data as of August 04, 2026. % Realized = 52-week total return.
Legend: RSI > 70 = overbought · RSI < 30 = oversold · Green % Realized = positive 52W return · Red = negative.
📈 Nearest to 52-Week High
Sectors represented: Technology (4), Communication Services (1)
| Ticker | Company | Sector | Price Last | % Realized | 52-Week High Date | RSI | % above MA200 | Trend |
|---|---|---|---|---|---|---|---|---|
| PANW | Palo Alto Networks Inc | Technology | $363.08 | +112.33% | 2026-08-04 | 65.7 | +68.3% | Above MA20, MA50, MA200 |
| CRWD | Crowdstrike Holdings Inc | Technology | $212.07 | +86.49% | 2026-08-04 | 66.8 | +58.9% | Above MA20, MA50, MA200 |
| FTNT | Fortinet Inc | Technology | $167.55 | +70.02% | 2026-08-04 | 65.3 | +65.3% | Above MA20, MA50, MA200 |
| DDOG | Datadog Inc | Technology | $282.99 | +103.40% | 2026-08-04 | 68.6 | +68.0% | Above MA20, MA50, MA200 |
| EA | Electronic Arts, Inc | Communication Services | $209.91 | +31.38% | 2026-08-03 | 79.3 | +3.5% | Above MA20, MA50, MA200 |
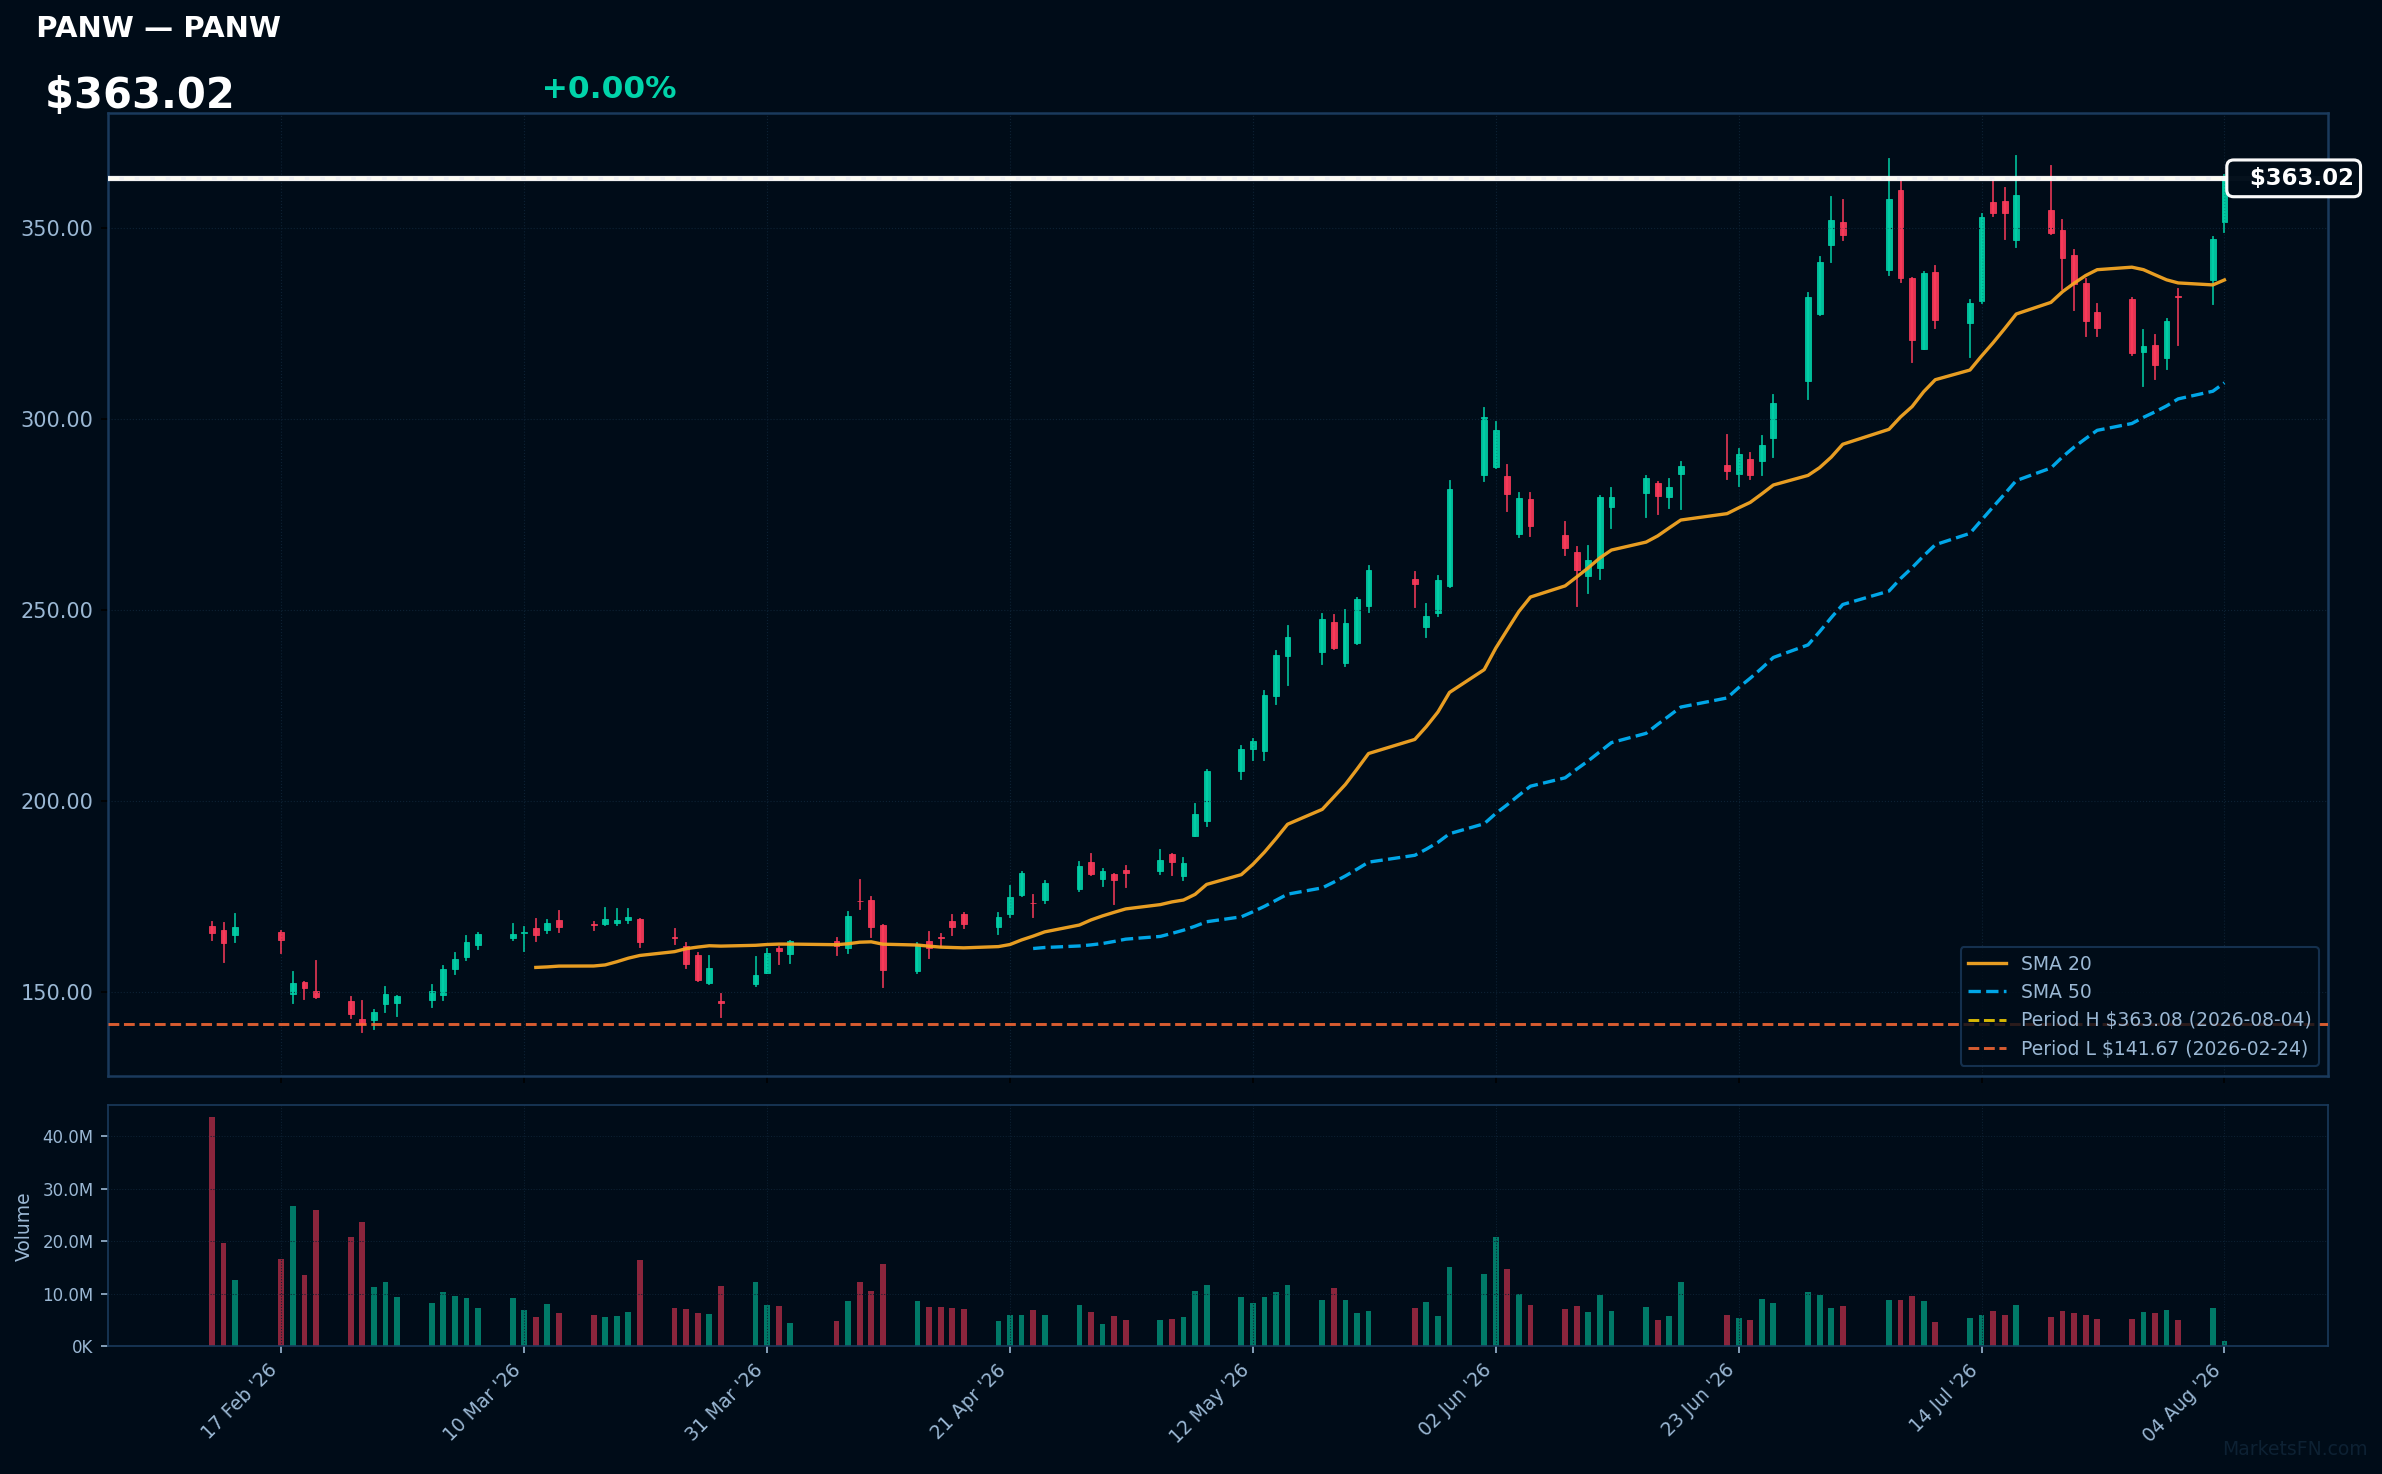
PANW | Palo Alto Networks Inc | Technology | Price Last: $363.08 | % Realized: +112.33% | RSI: 65.7 | % above MA200: +68.3% | Trend: Above MA20, MA50, MA200
Palo Alto Networks Inc specializes in cybersecurity solutions, providing advanced firewalls and cloud-based security services. Investors should care due to the increasing demand for cybersecurity as businesses face rising threats, positioning the company for sustained growth and market relevance.
The current technical situation indicates bullish momentum, with an RSI(14) of 65.7 and a strong MA alignment: price > MA20 > MA50 > MA200. The stock is also 0.0% below its 52-Week high, signaling a potential breakout.
Related headlines
- Palo Alto Networks to Announce Fiscal Fourth Quarter and Fiscal Year 2026 Financial Results on Tuesday, September 1, 2026
- Palo Alto Networks CEO calls OpenAI-Hugging Face hack next level
- Palo Alto Networks to Extend Leading Observability Platform with Innovative Digital Experience Monitoring
- Why Palo Alto Stock Is This Analyst's Top Pick
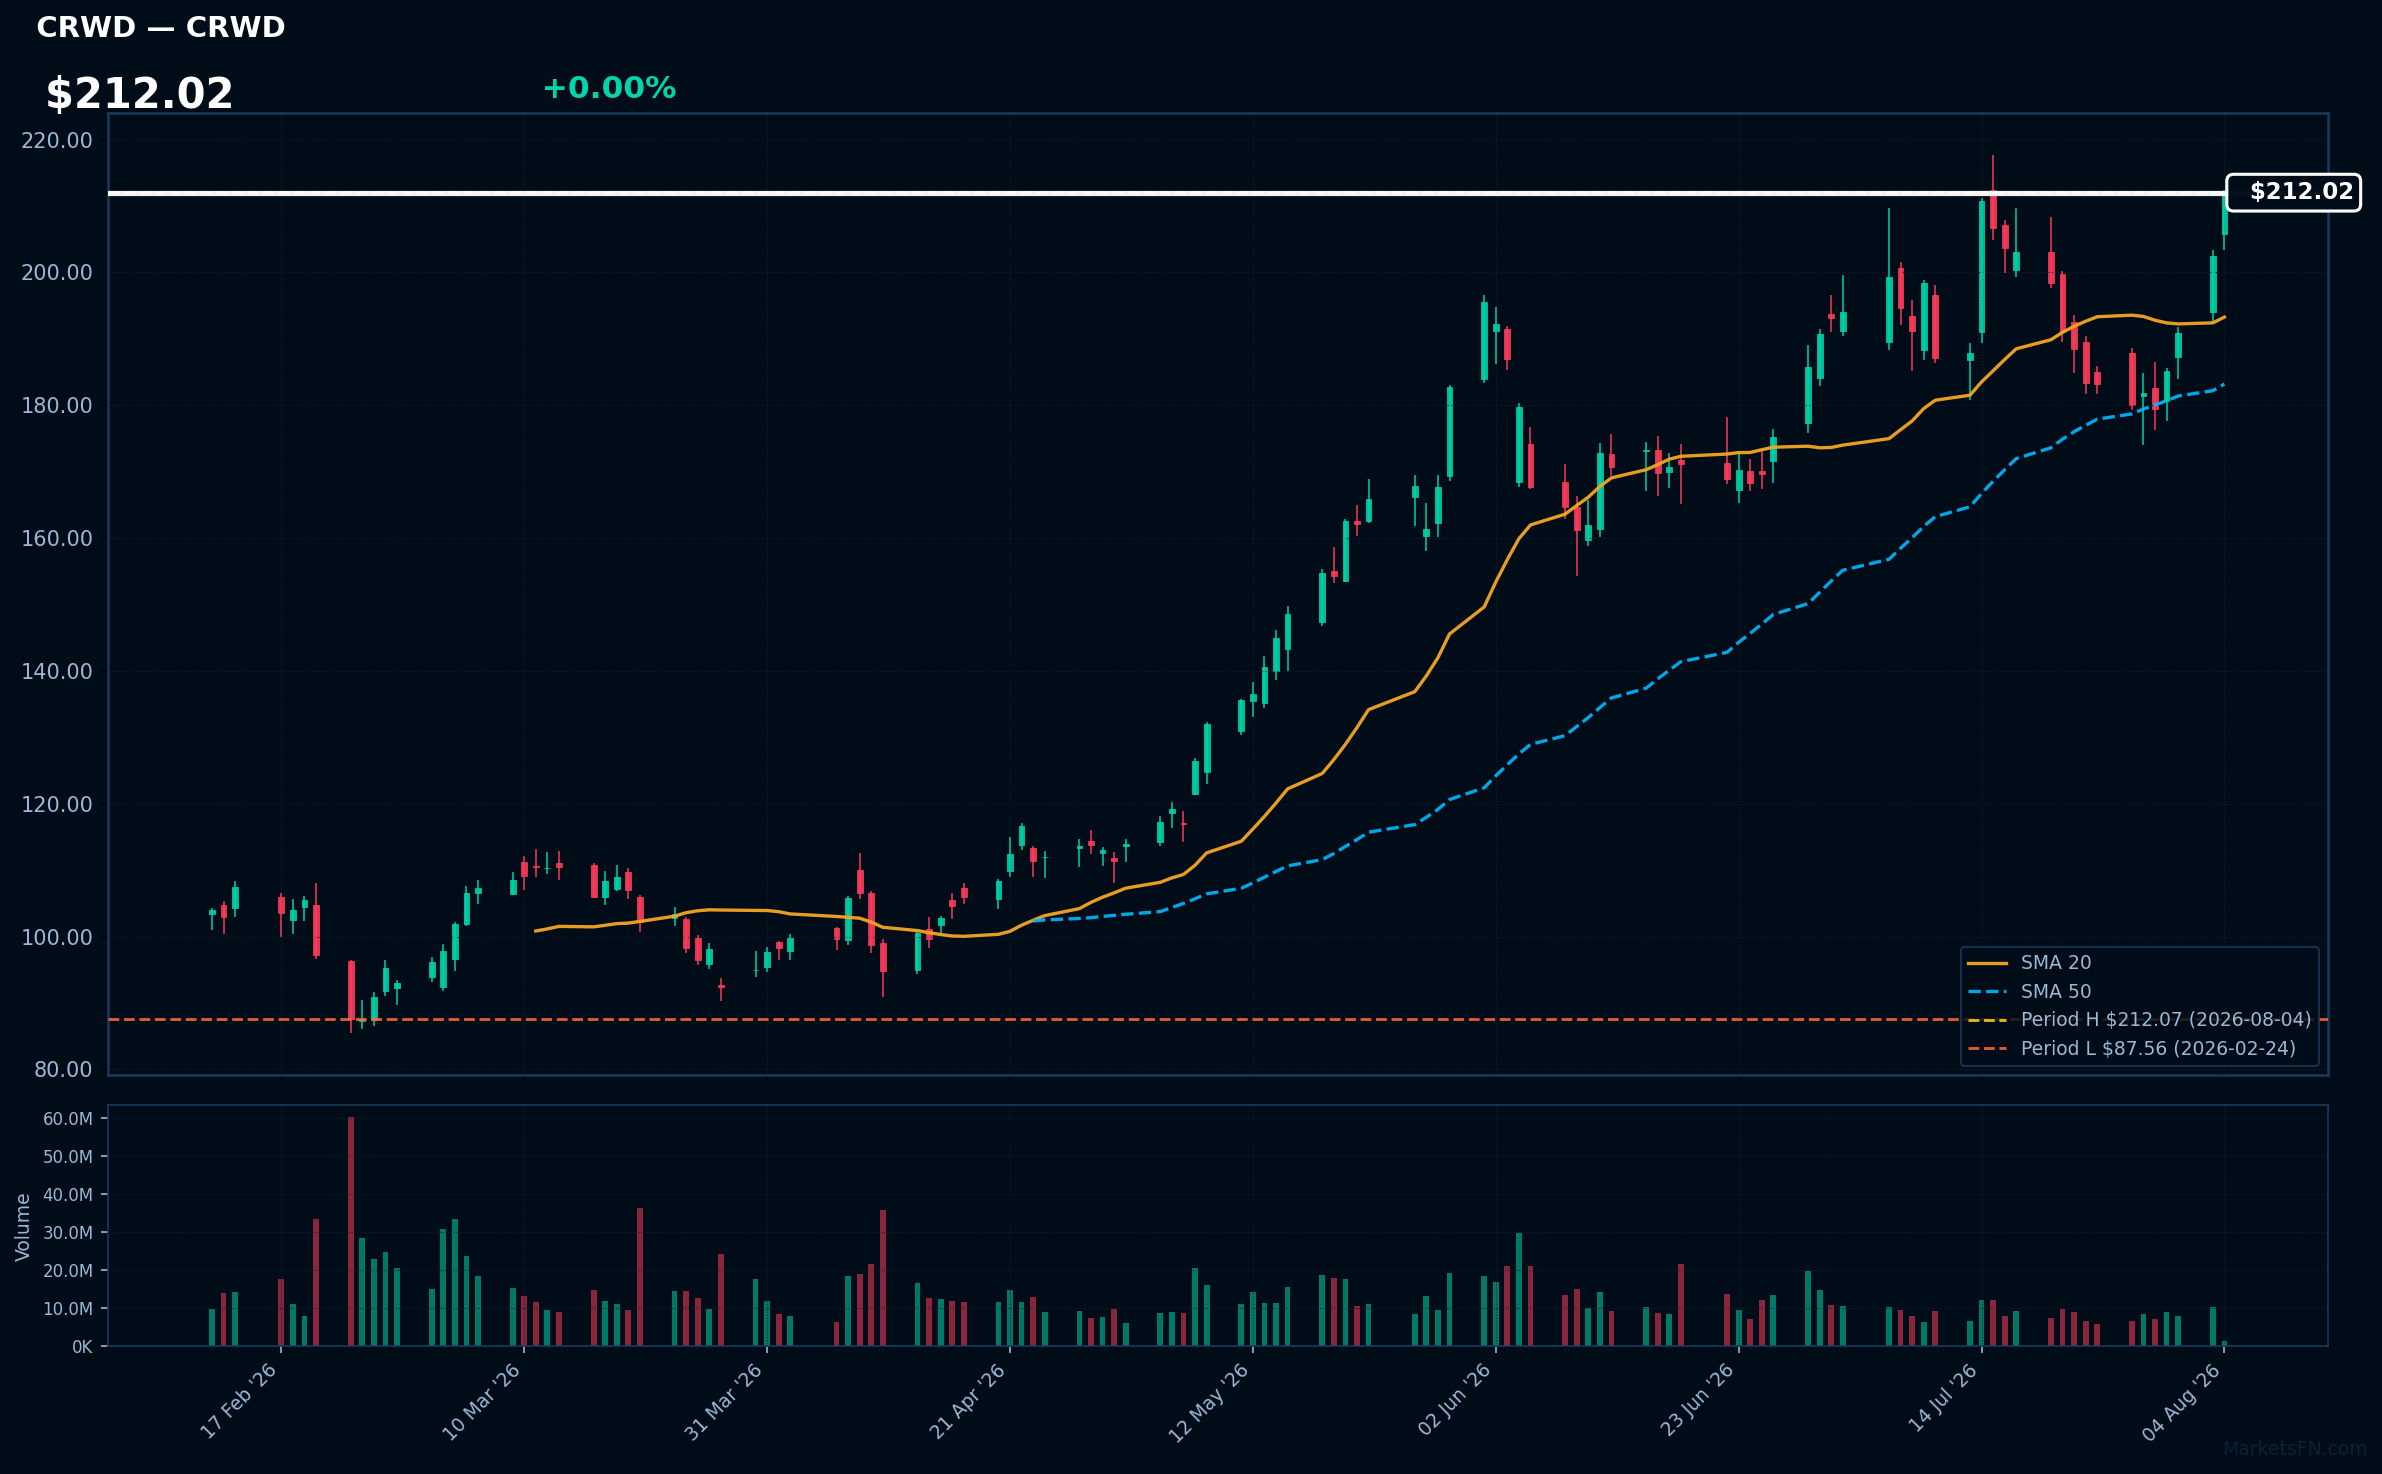
CRWD | Crowdstrike Holdings Inc | Technology | Price Last: $212.07 | % Realized: +86.49% | RSI: 66.8 | % above MA200: +58.9% | Trend: Above MA20, MA50, MA200
Crowdstrike Holdings Inc specializes in cybersecurity solutions, offering cloud-native endpoint protection and threat intelligence. Investors should care due to the increasing demand for cybersecurity amid rising cyber threats, positioning the company for sustained growth and market relevance.
The current technical situation indicates bullish momentum, with an RSI(14) of 66.8 and a strong MA alignment: price > MA20 > MA50 > MA200, suggesting a sustained uptrend. The stock is also 0.0% below its 52-Week high.
Related headlines
- CrowdStrike Announces Date of Fiscal Second Quarter 2027 Financial Results Conference Call
- CrowdStrike Fal.Con 2026 Sells Out at Record Pace as the Industry Races to Secure AI
- CrowdStrike 2026 Threat Hunting Report: AI is Now Embedded Across Modern Adversary Operations
- How Much CRWD Are You Really Betting On?
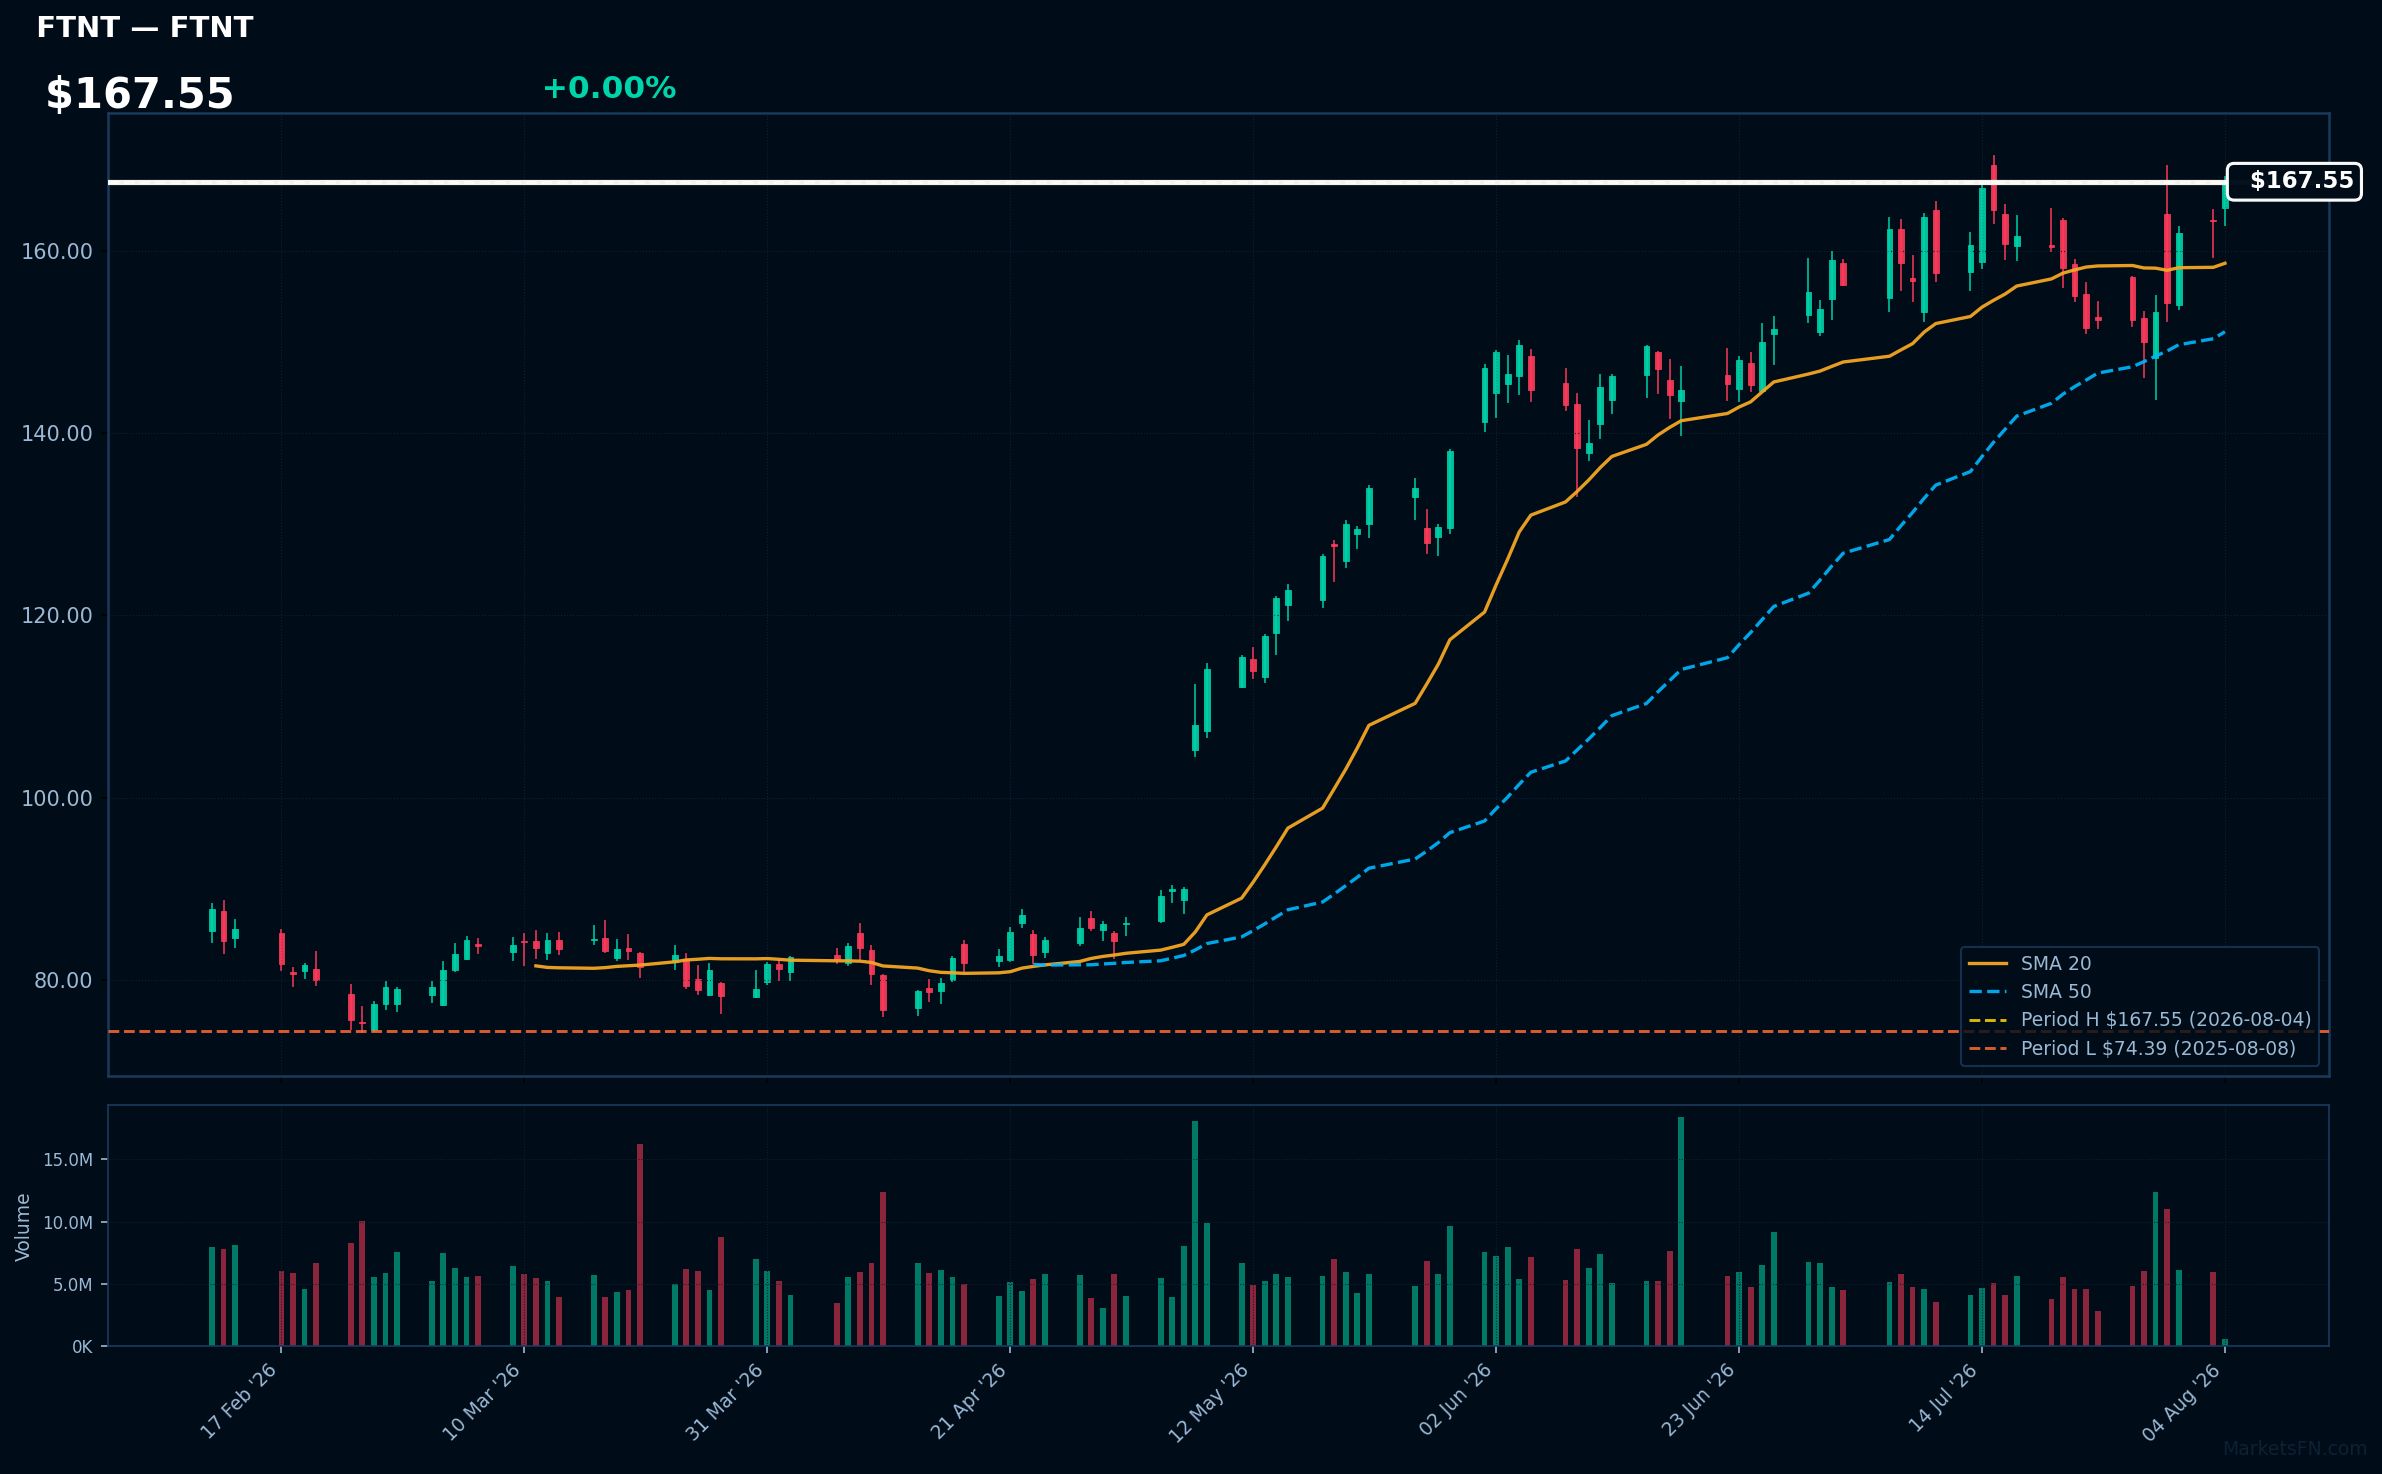
FTNT | Fortinet Inc | Technology | Price Last: $167.55 | % Realized: +70.02% | RSI: 65.3 | % above MA200: +65.3% | Trend: Above MA20, MA50, MA200
Fortinet Inc (FTNT) specializes in cybersecurity solutions, providing advanced threat protection and secure networking services. Investors should care due to the increasing demand for cybersecurity in a digital-first world, positioning Fortinet as a key player in a rapidly growing market.
Technically, FTNT shows bullish momentum with an RSI(14) of 65.3 and a strong MA alignment: price > MA20 > MA50 > MA200. The stock is 0.0% below its 52-Week high, indicating potential for a breakout.
Related headlines
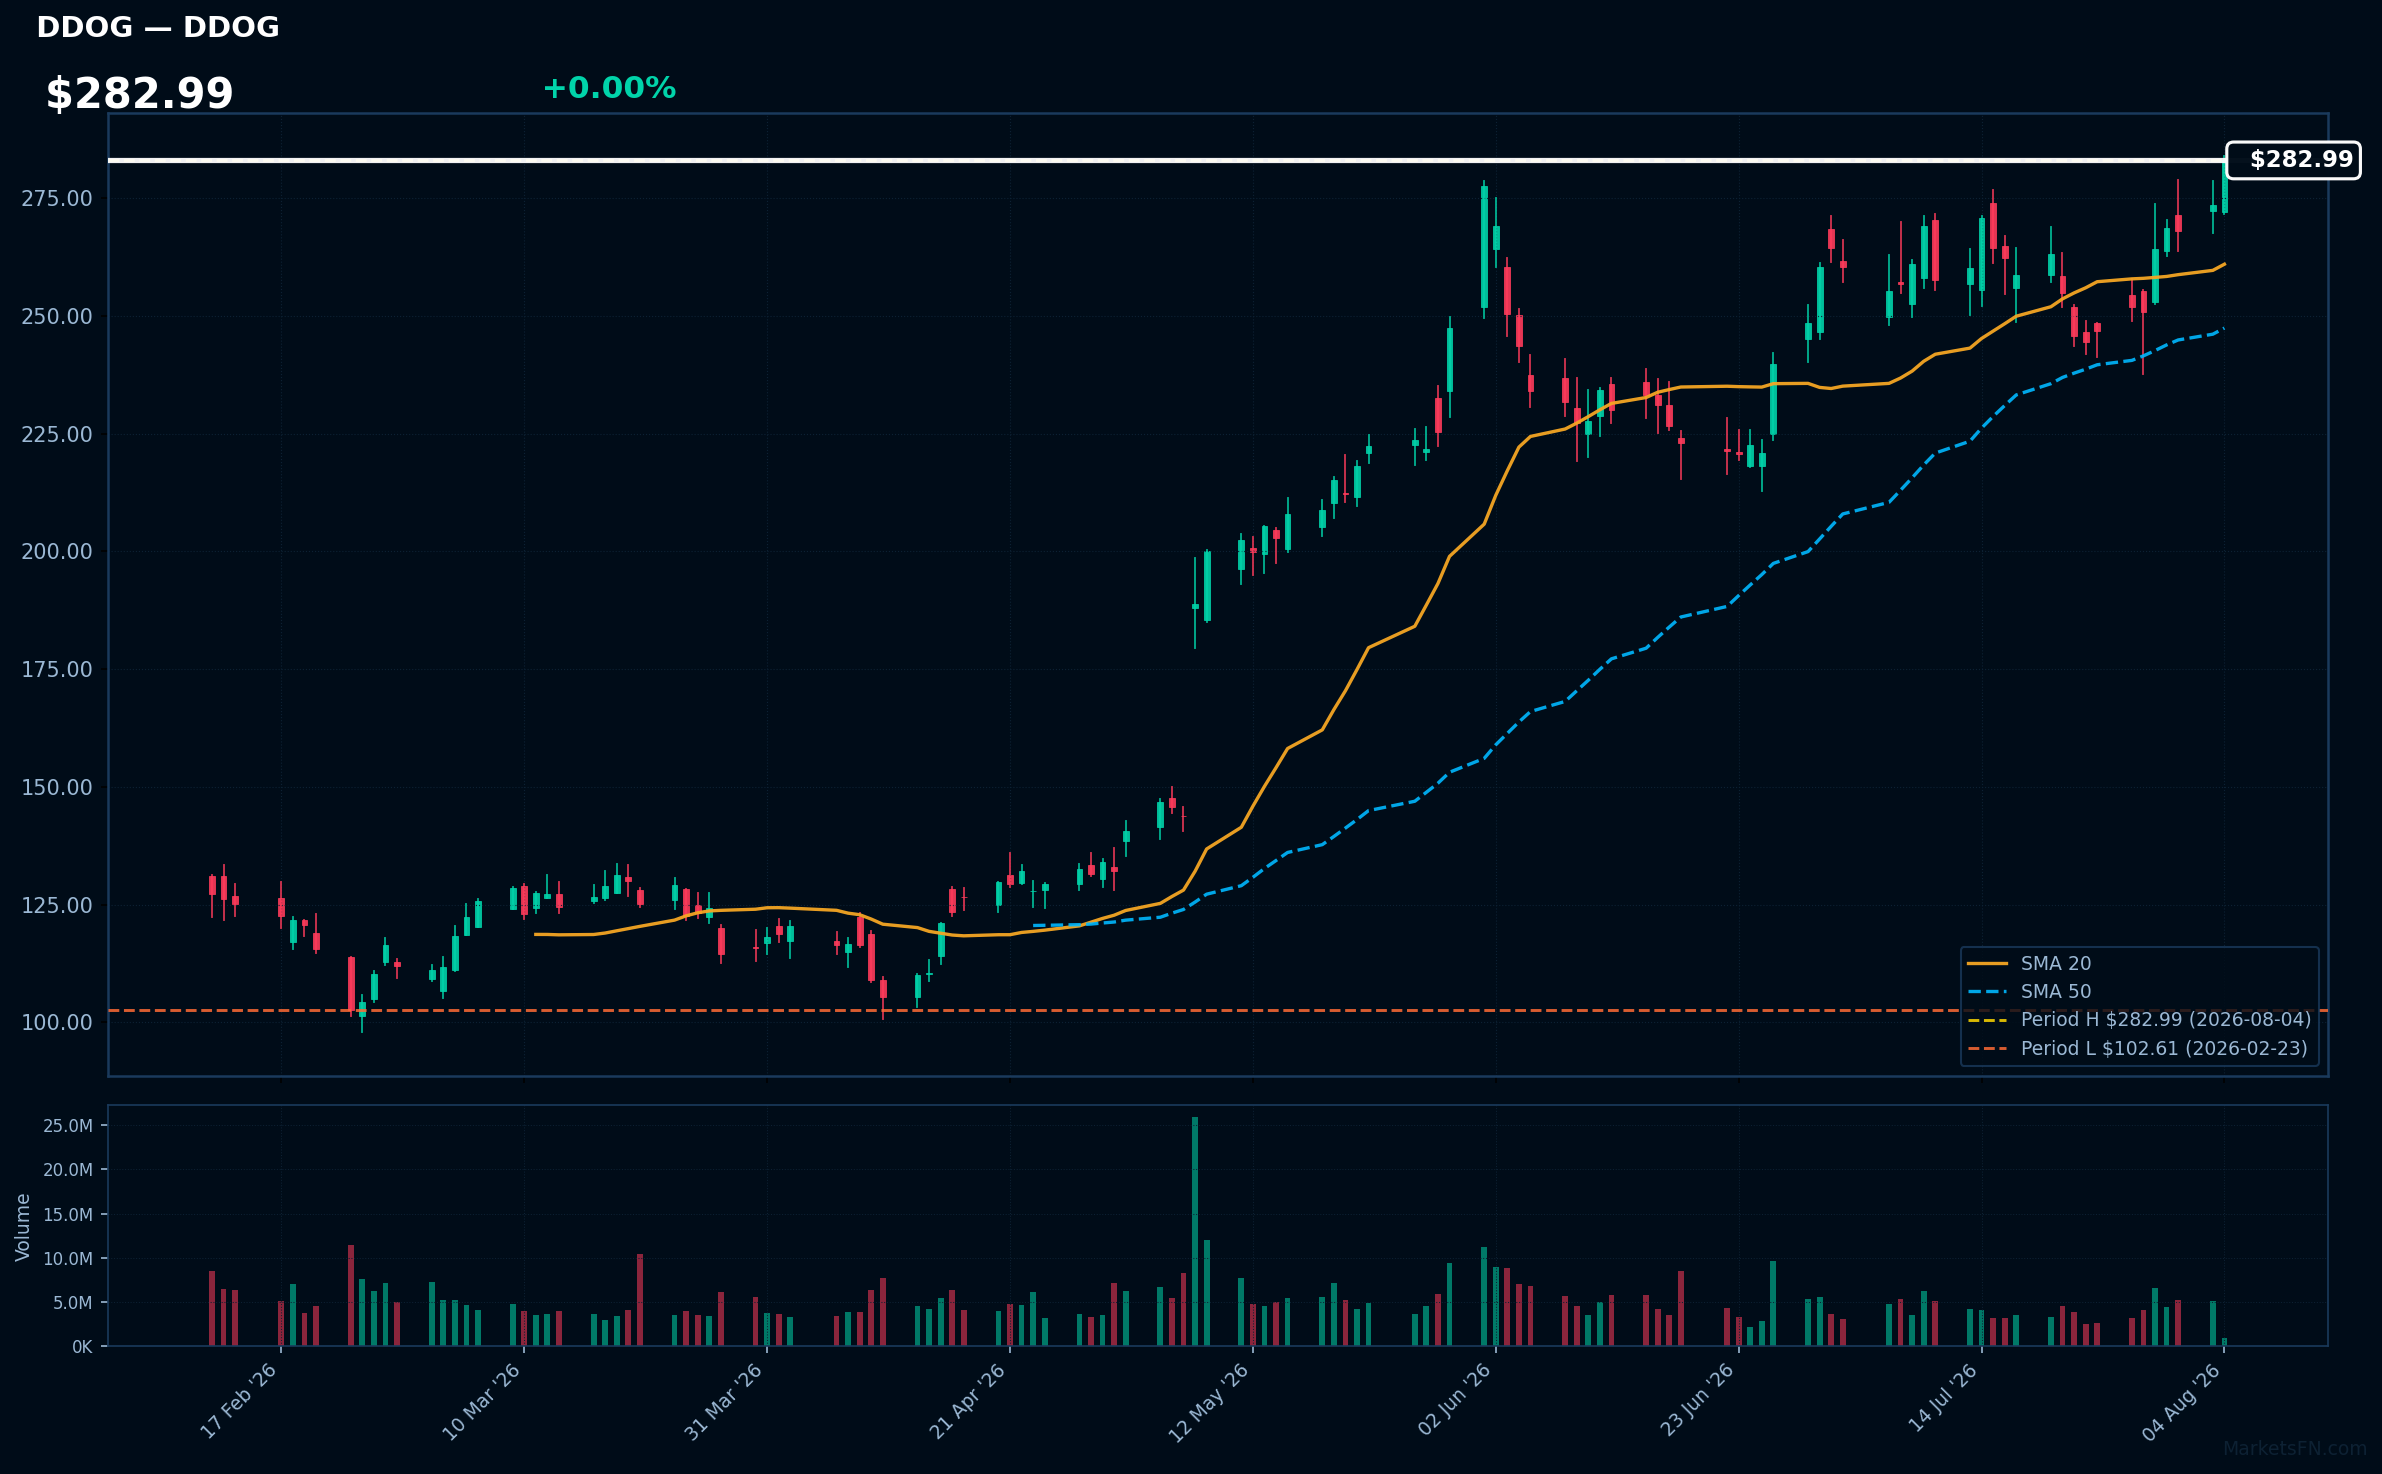
DDOG | Datadog Inc | Technology | Price Last: $282.99 | % Realized: +103.40% | RSI: 68.6 | % above MA200: +68.0% | Trend: Above MA20, MA50, MA200
Datadog Inc (DDOG) provides monitoring and analytics for cloud applications, enabling businesses to optimize performance and security. Investors should care due to its strong growth potential in the expanding cloud services market, which is critical for digital transformation.
Currently, DDOG shows bullish momentum with an RSI(14) of 68.6 and a strong MA alignment: price > MA20 > MA50 > MA200. It is also 0.0% below its 52-Week high, indicating a potential breakout.
Related headlines
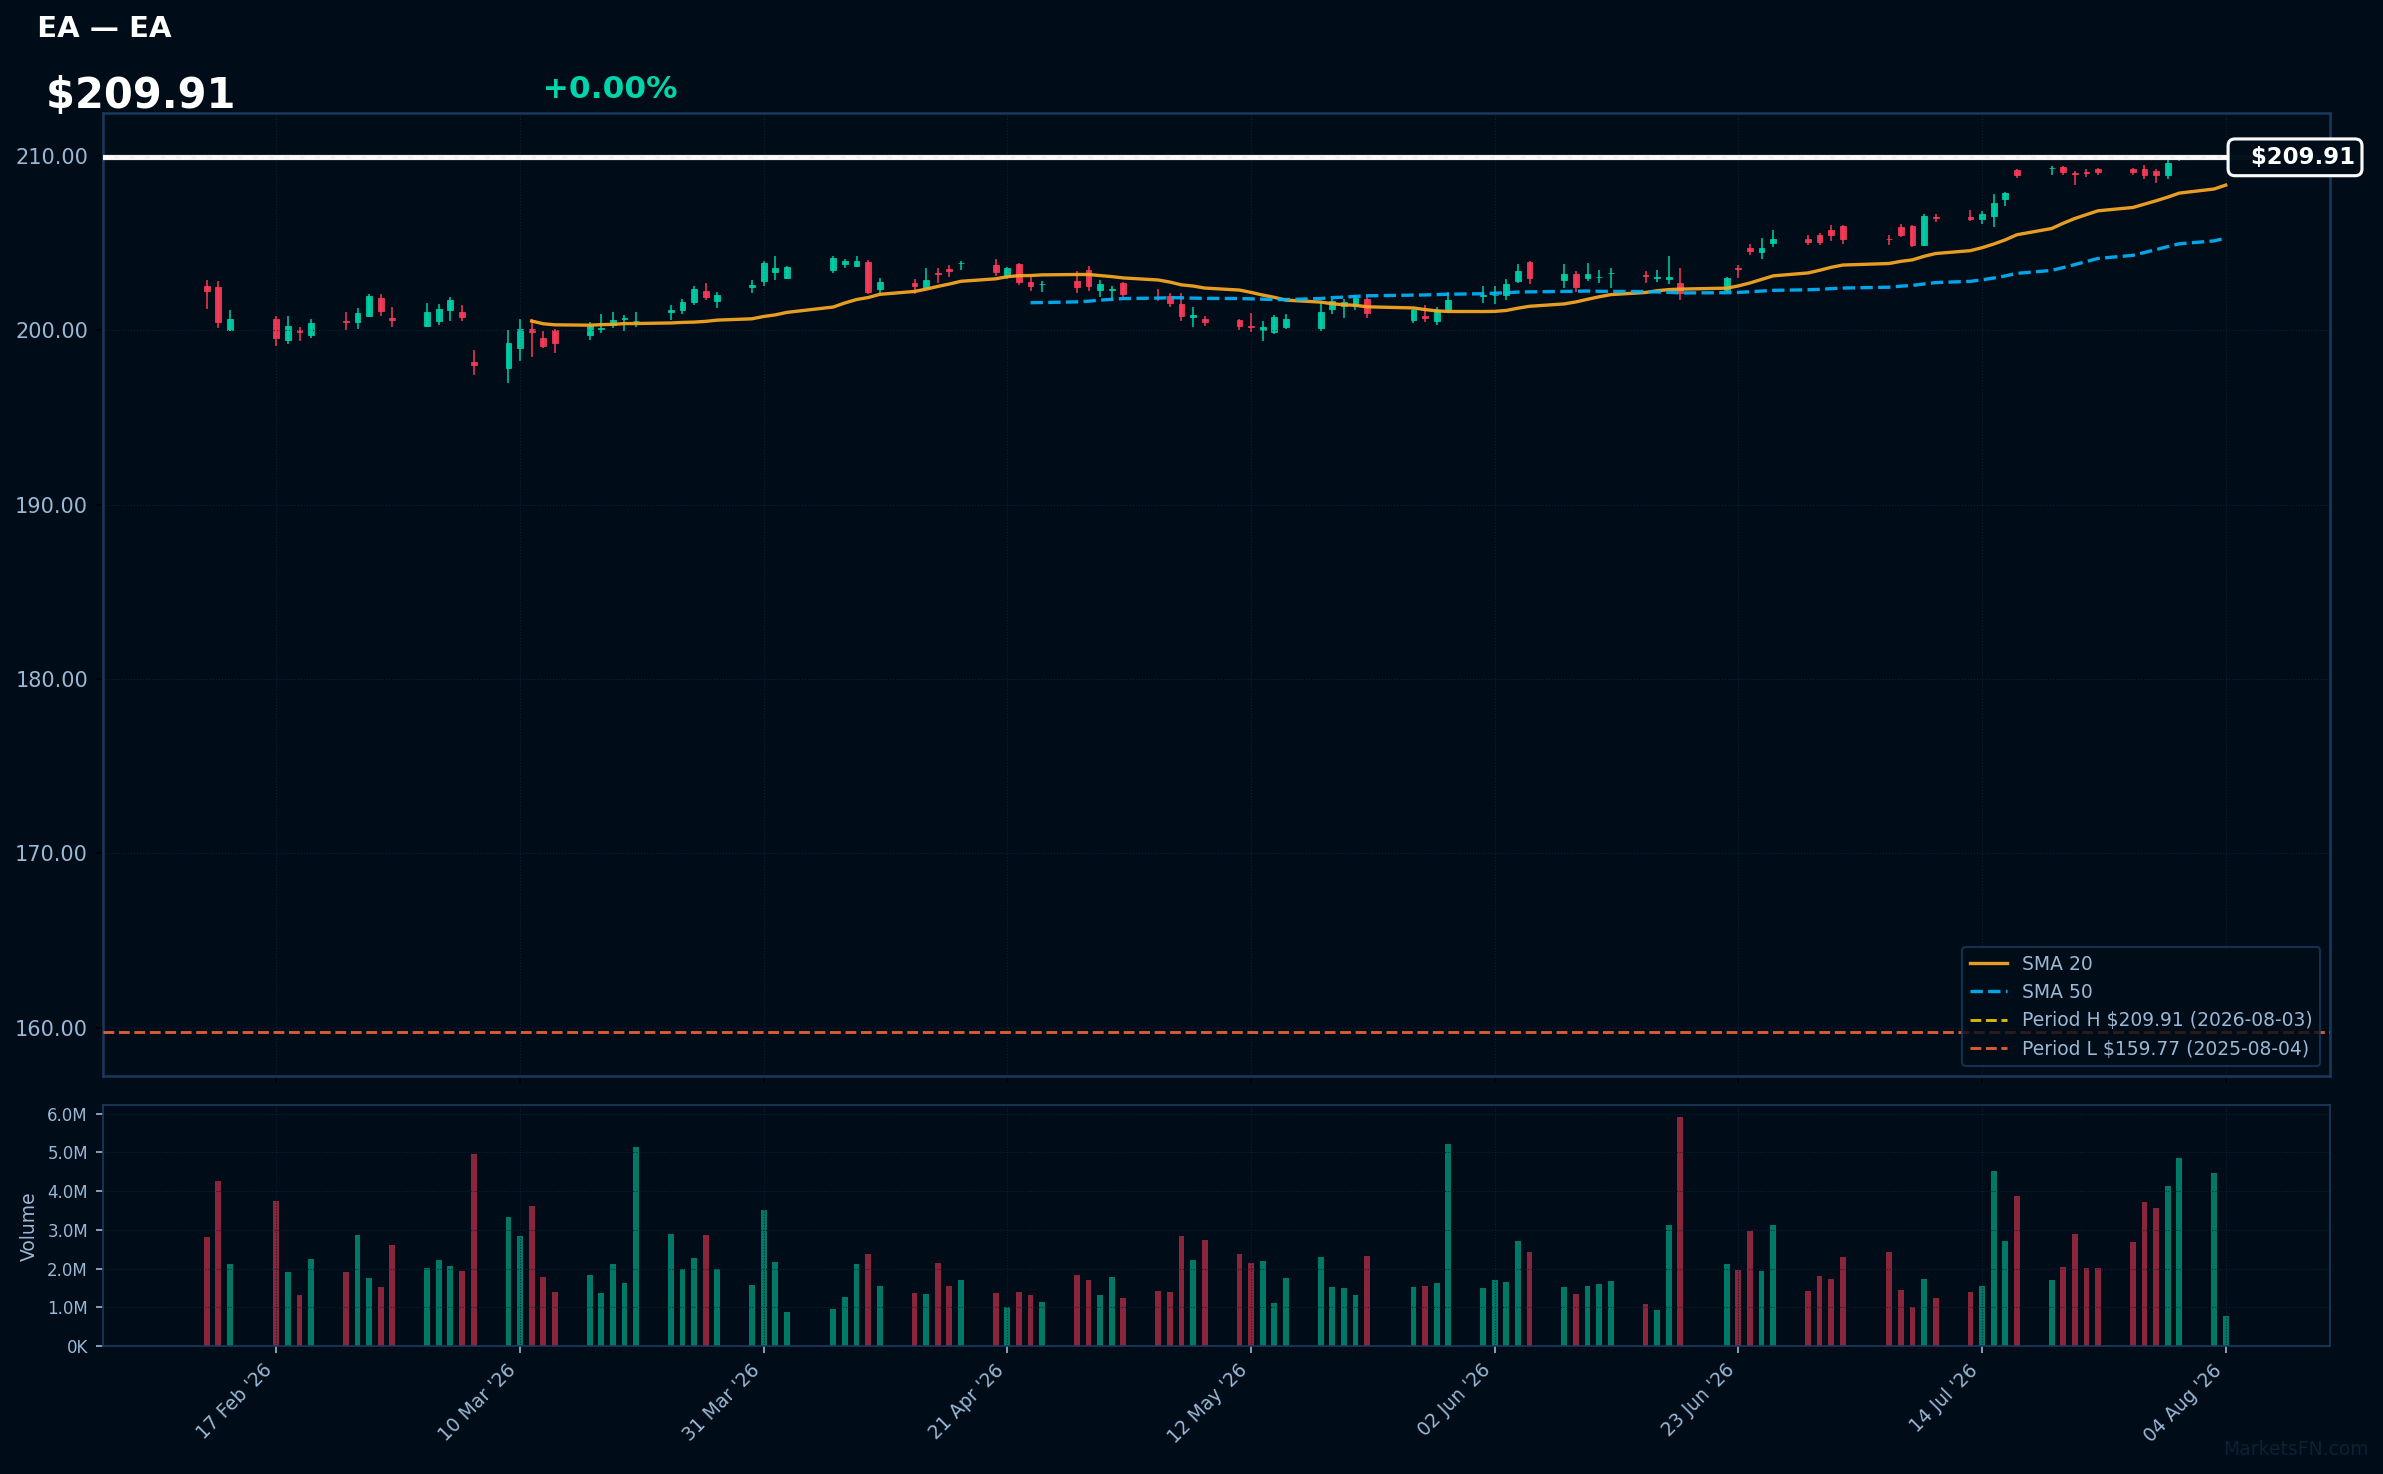
EA | Electronic Arts, Inc | Communication Services | Price Last: $209.91 | % Realized: +31.38% | RSI: 79.3 | % above MA200: +3.5% | Trend: Above MA20, MA50, MA200
Electronic Arts, Inc. develops and publishes interactive entertainment software, including popular franchises like FIFA and The Sims. Investors should care due to its strong market position and consistent revenue generation from both game sales and in-game purchases.
The current technical situation indicates strong momentum, with an RSI(14) of 79.3 and a bullish MA alignment: price > MA20 > MA50 > MA200. The stock is also 0.0% below its 52-Week high.
Related headlines
📉 Nearest to 52-Week Low
Sectors represented: Consumer Defensive (1), Communication Services (1), Utilities (1), Industrials (1), Healthcare (1)
| Ticker | Company | Sector | Price Last | % Realized | 52-Week Low Date | RSI | % above MA200 | Trend |
|---|---|---|---|---|---|---|---|---|
| PEP | PepsiCo Inc | Consumer Defensive | $138.55 | -0.72% | 2026-07-23 | 47.3 | -7.4% | Above MA20 · Below MA50, MA200 |
| TMUS | T-Mobile US Inc | Communication Services | $175.02 | -27.38% | 2026-06-30 | 43.8 | -11.9% | Below MA20, MA50, MA200 |
| EXC | Exelon Corp | Utilities | $45.17 | +0.00% | 2025-09-16 | 40.5 | -2.2% | Below MA20, MA50, MA200 |
| CPRT | Copart, Inc | Industrials | $28.90 | -36.82% | 2026-07-21 | 48.7 | -19.1% | Above MA20 · Below MA50, MA200 |
| AZN | Astrazeneca plc ADR | Healthcare | $157.59 | +5.64% | 2025-09-25 | 32.0 | -14.7% | Below MA20, MA50, MA200 |
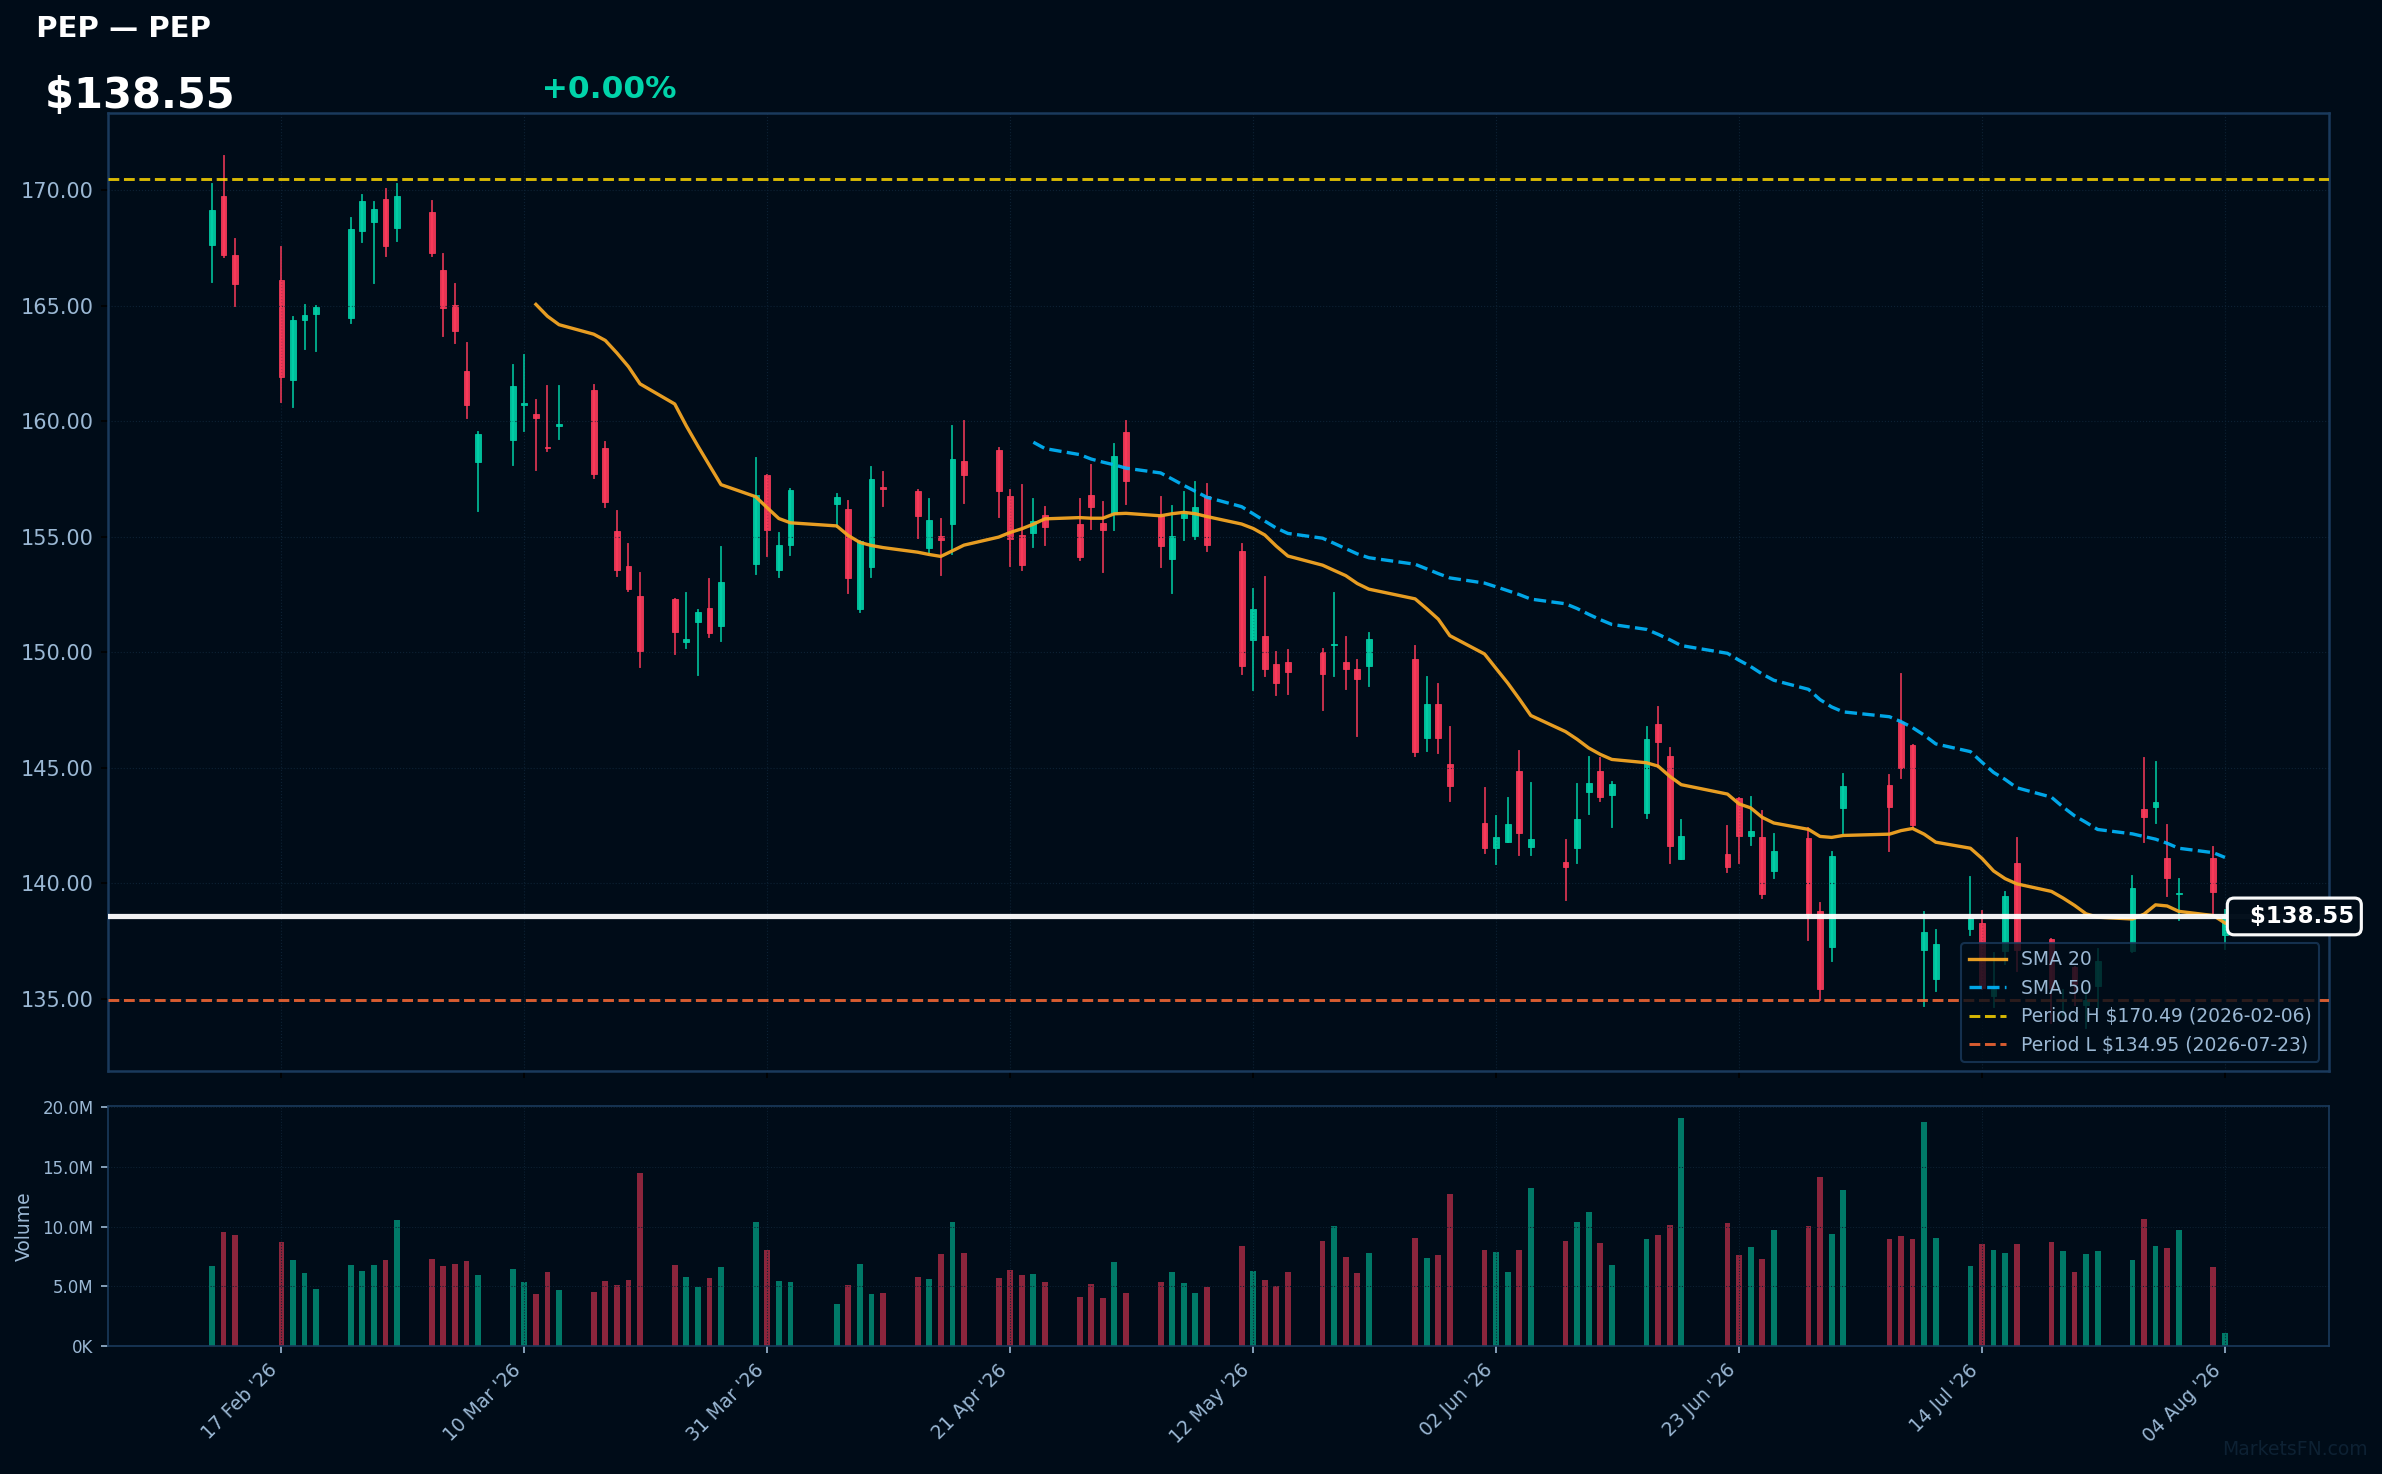
PEP | PepsiCo Inc | Consumer Defensive | Price Last: $138.55 | % Realized: -0.72% | RSI: 47.3 | % above MA200: -7.4% | Trend: Above MA20 · Below MA50, MA200
PepsiCo Inc (PEP) is a global leader in the food and beverage industry, known for its diverse portfolio including snacks, soft drinks, and health-focused products. Investors should care due to its strong market presence and potential for growth in health-conscious consumer segments.
The current technical situation shows mixed signals: the RSI(14) is at 47.3, indicating neutral momentum, while the price is above MA20 but below MA50 and MA200, suggesting caution as it tests major support just 2.7% above its 52-Week low.
Related headlines
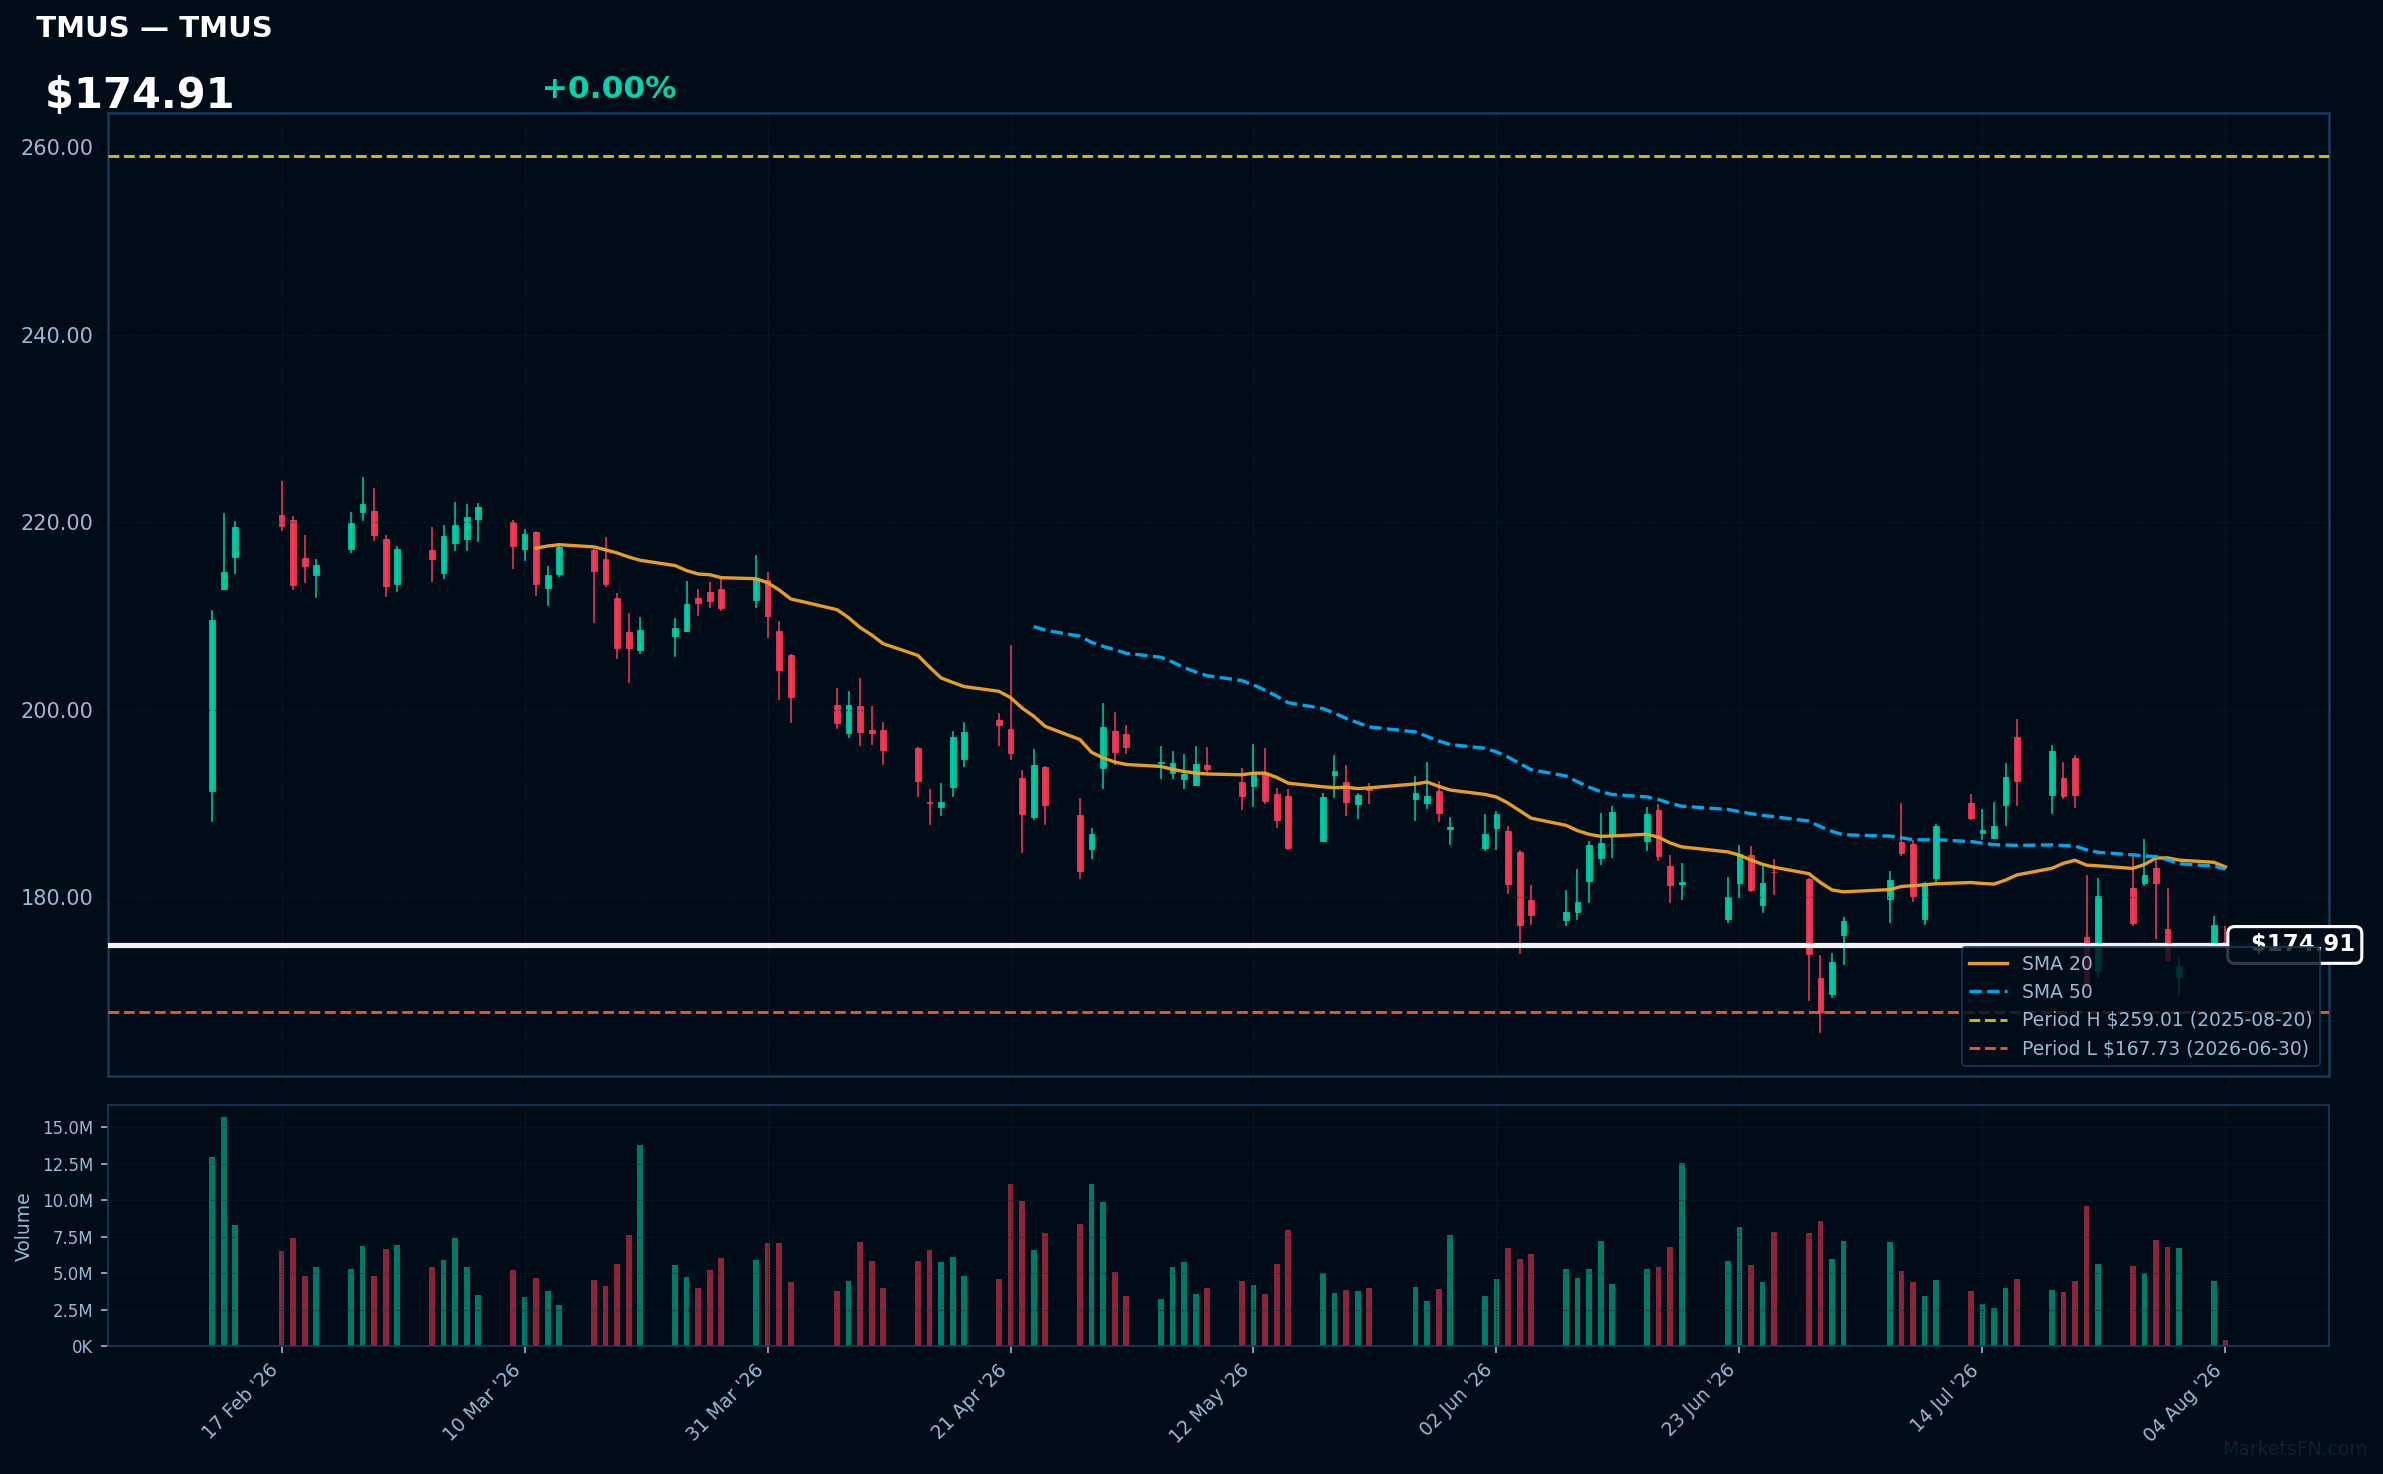
TMUS | T-Mobile US Inc | Communication Services | Price Last: $175.02 | % Realized: -27.38% | RSI: 43.8 | % above MA200: -11.9% | Trend: Below MA20, MA50, MA200
T-Mobile US Inc provides wireless voice, messaging, and data services across the United States. Investors should care due to its significant market share and competitive positioning in the rapidly evolving telecommunications sector, which is crucial for growth and innovation in connectivity.
The current technical situation shows mixed signals with an RSI(14) of 43.8 and the stock below MA20/MA50/MA200. Additionally, it is only 4.3% above its 52-Week low, indicating potential warning signs.
Related headlines
- Introducing Nothing. T-Mobile Eliminates Upfront Costs One of Wireless Biggest Barriers to Switching
- TMUS Stock Slips As $300B Deutsche Telekom Merger Talks Reportedly Hit A Roadblock
- T-Mobile executives oppose $300B Deutsche Telekom merger plan - report
- T, VZ, TMUS Stocks Are Sliding Today Is There A SpaceX Connection?
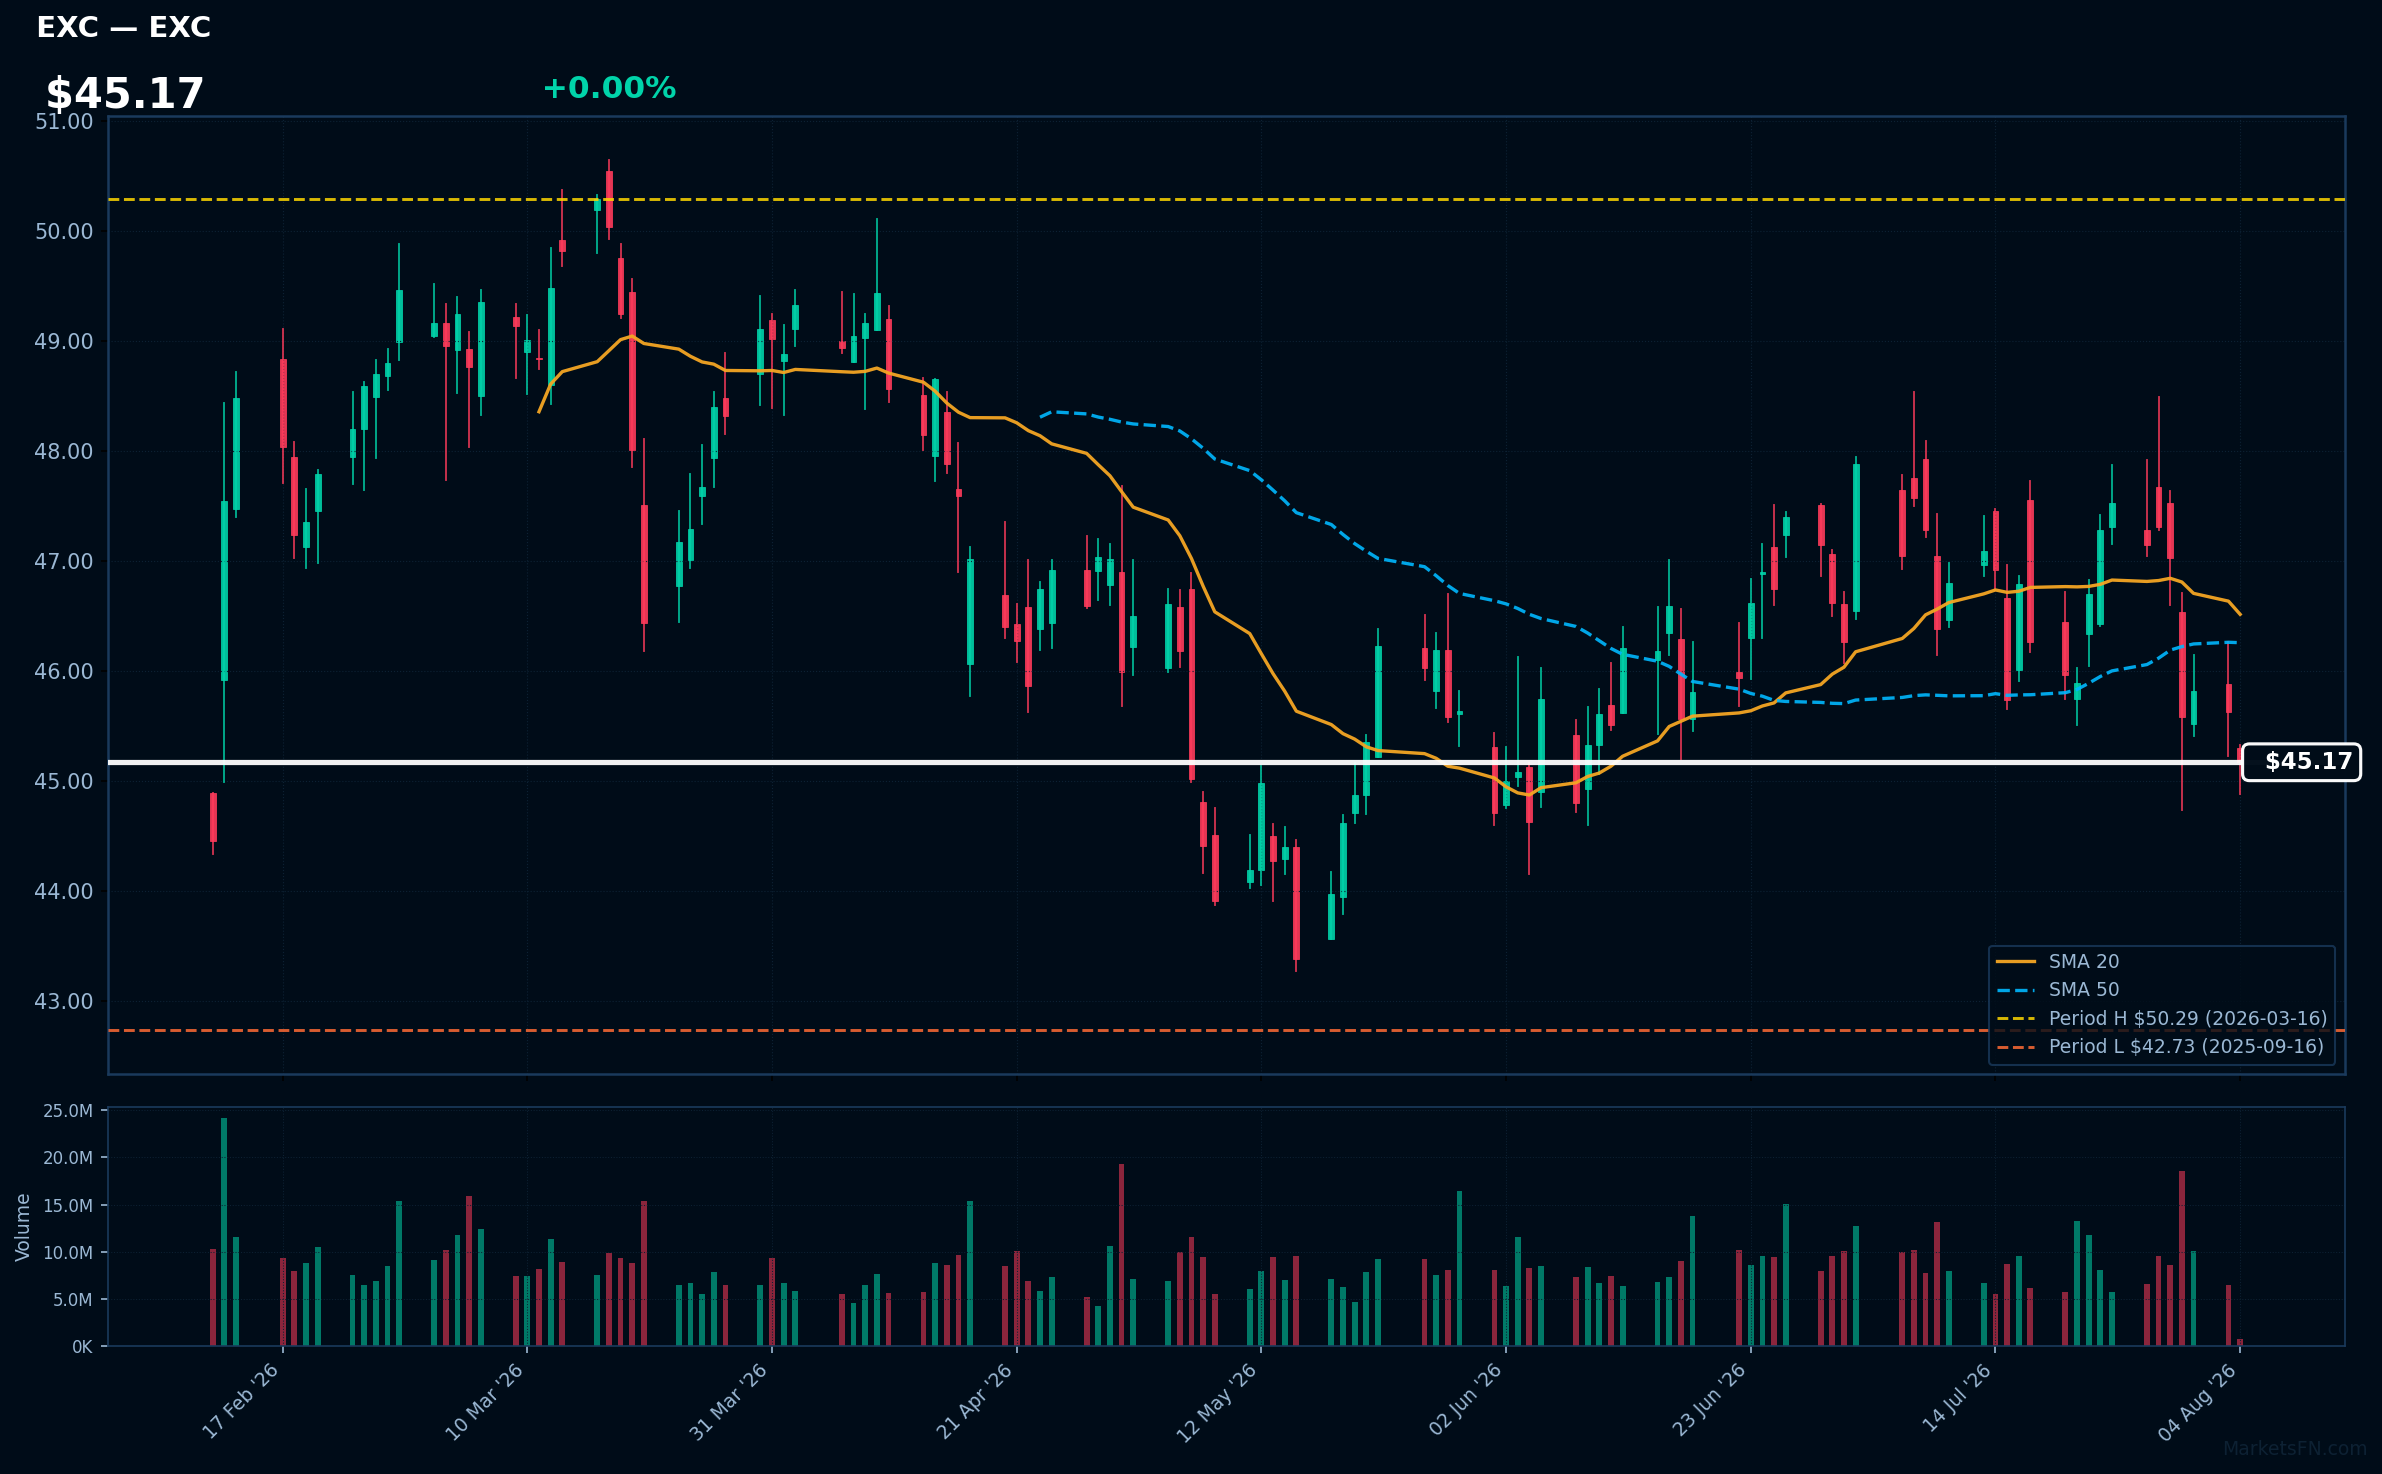
EXC | Exelon Corp | Utilities | Price Last: $45.17 | % Realized: +0.00% | RSI: 40.5 | % above MA200: -2.2% | Trend: Below MA20, MA50, MA200
Exelon Corp (EXC) is a leading energy provider, focusing on the generation and distribution of electricity, primarily from nuclear power. Investors should care due to its significant role in the energy sector and potential impacts from regulatory changes and energy demand shifts.
Currently, EXC shows mixed signals with an RSI(14) of 40.5 and is below MA20/MA50/MA200. The stock is testing major support, being only 5.7% above its 52-Week low, indicating a warning sign.
Related headlines
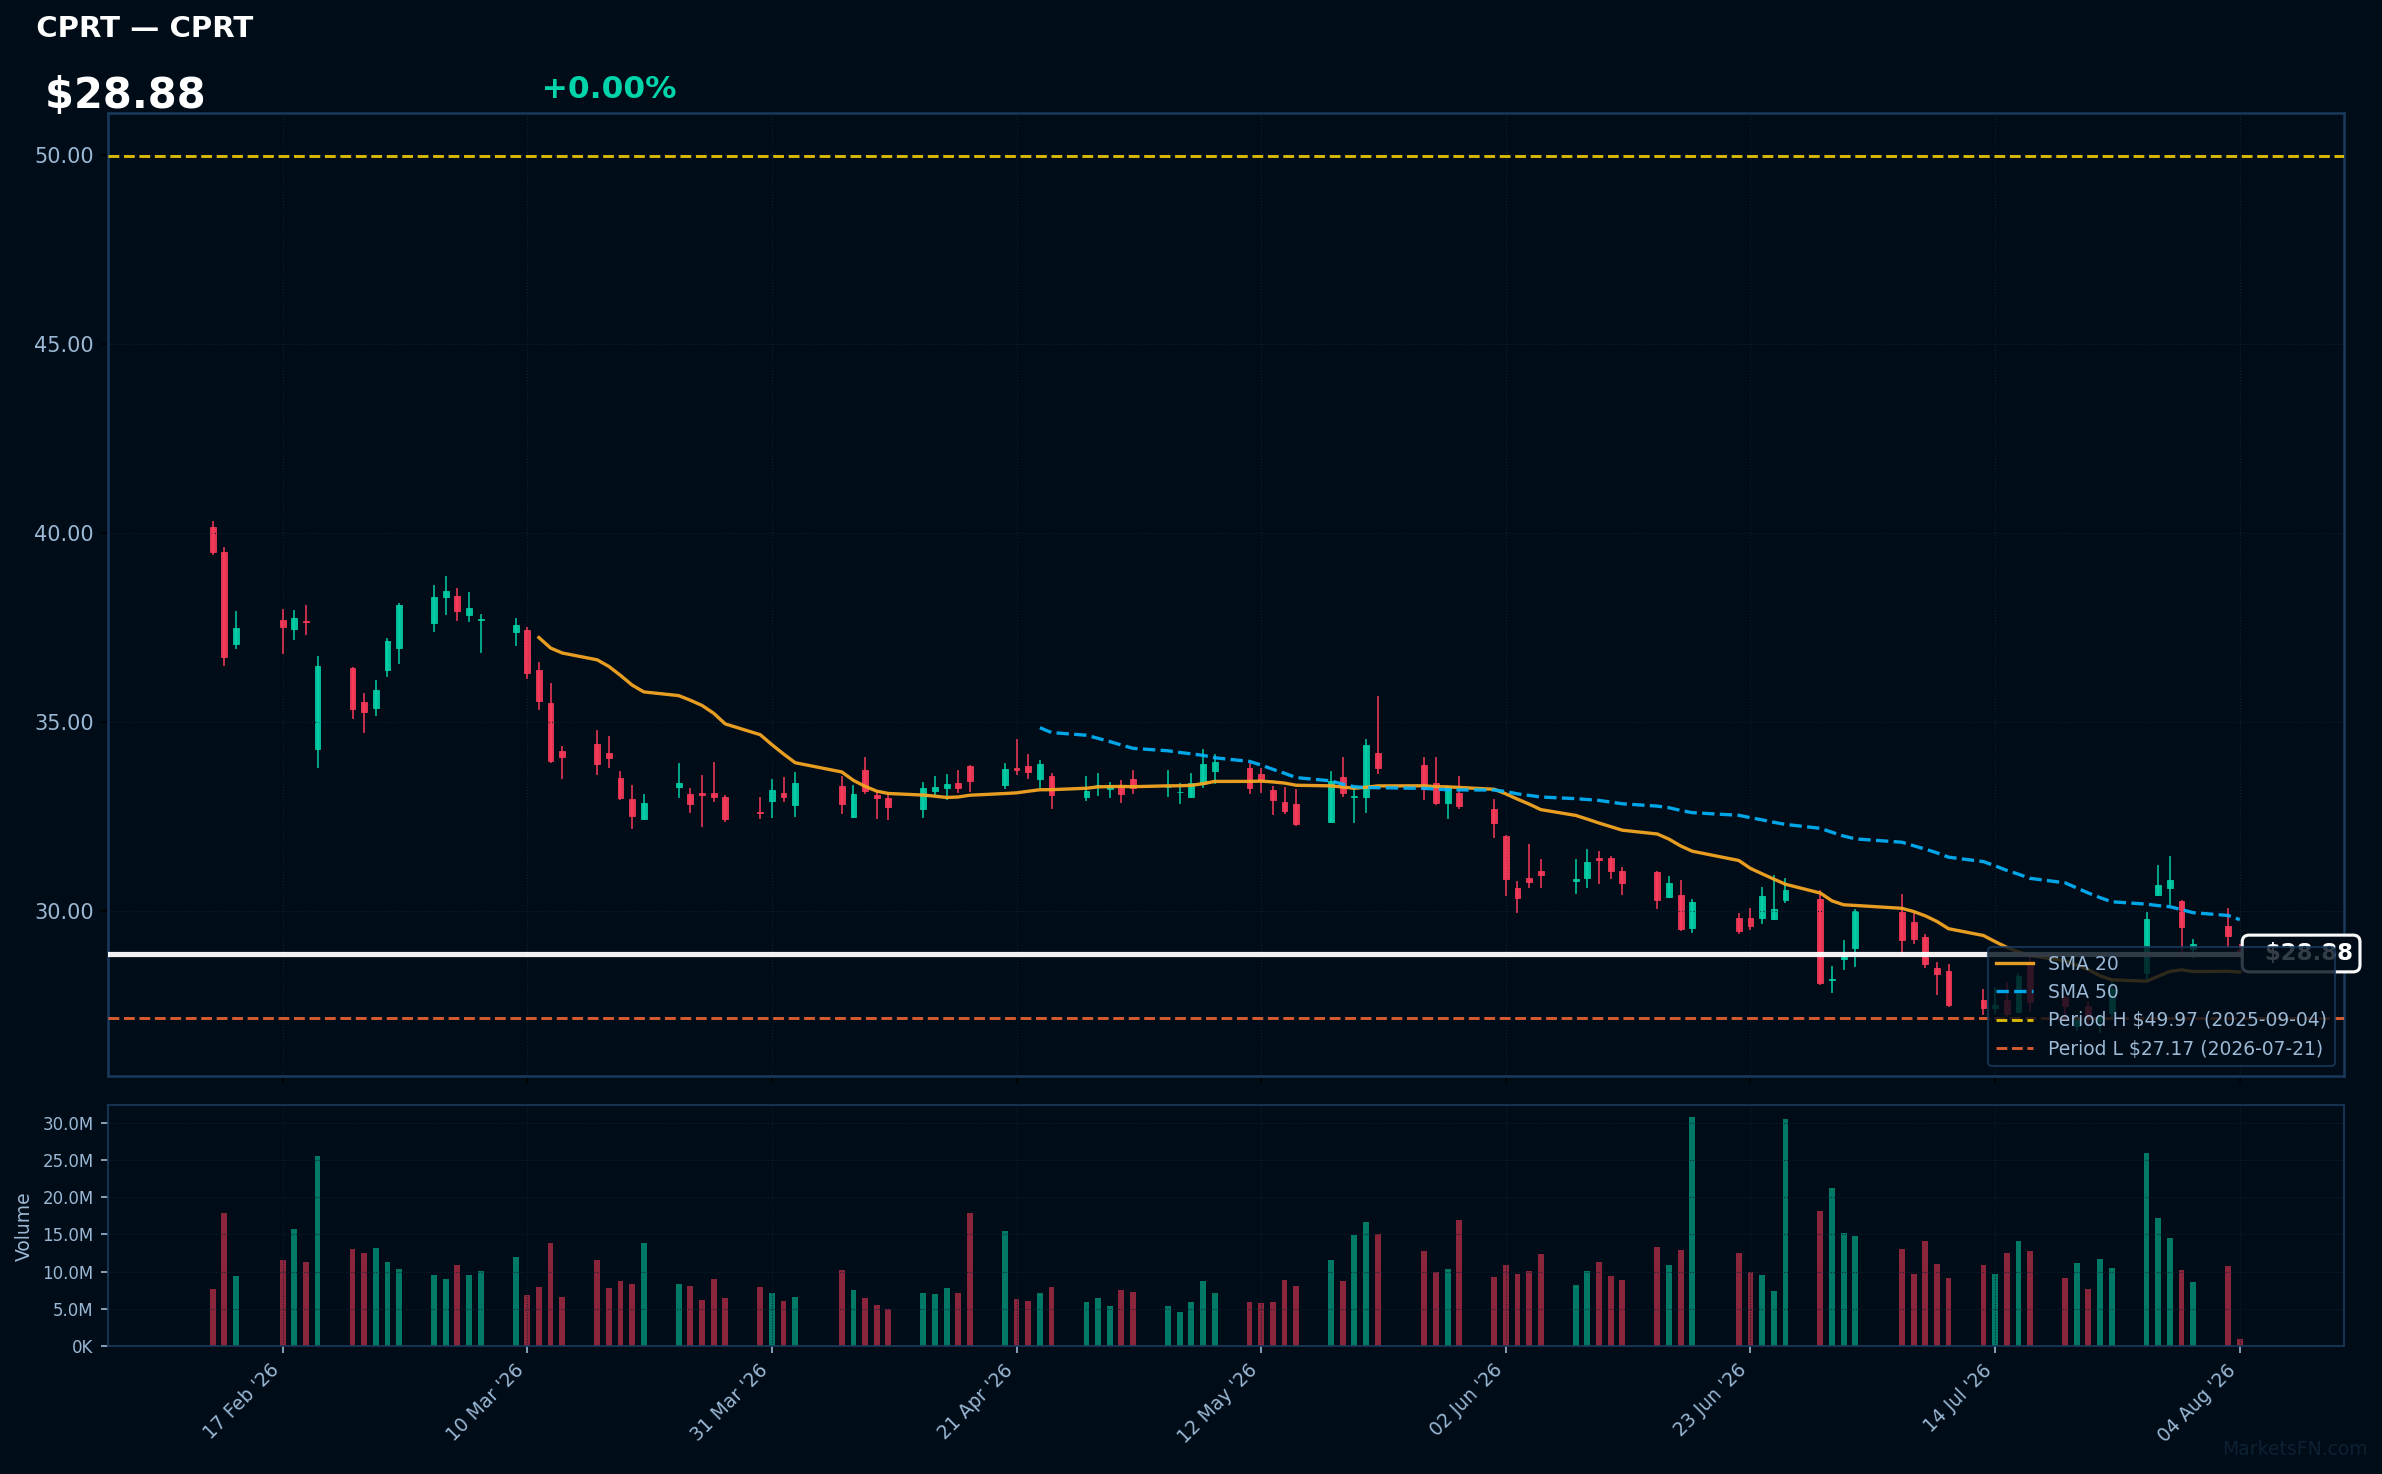
CPRT | Copart, Inc | Industrials | Price Last: $28.90 | % Realized: -36.82% | RSI: 48.7 | % above MA200: -19.1% | Trend: Above MA20 · Below MA50, MA200
Copart, Inc. specializes in the online auction and resale of vehicles, primarily for insurance companies and dealers. Investors should care due to its significant market position in the automotive salvage industry, which is essential for vehicle recovery and recycling.
Currently, Copart's RSI(14) is 48.7, indicating neutral momentum. The mixed signals from price being above MA20 but below MA50/MA200 suggest caution, especially as the stock is 6.4% above its 52-Week low.
Related headlines
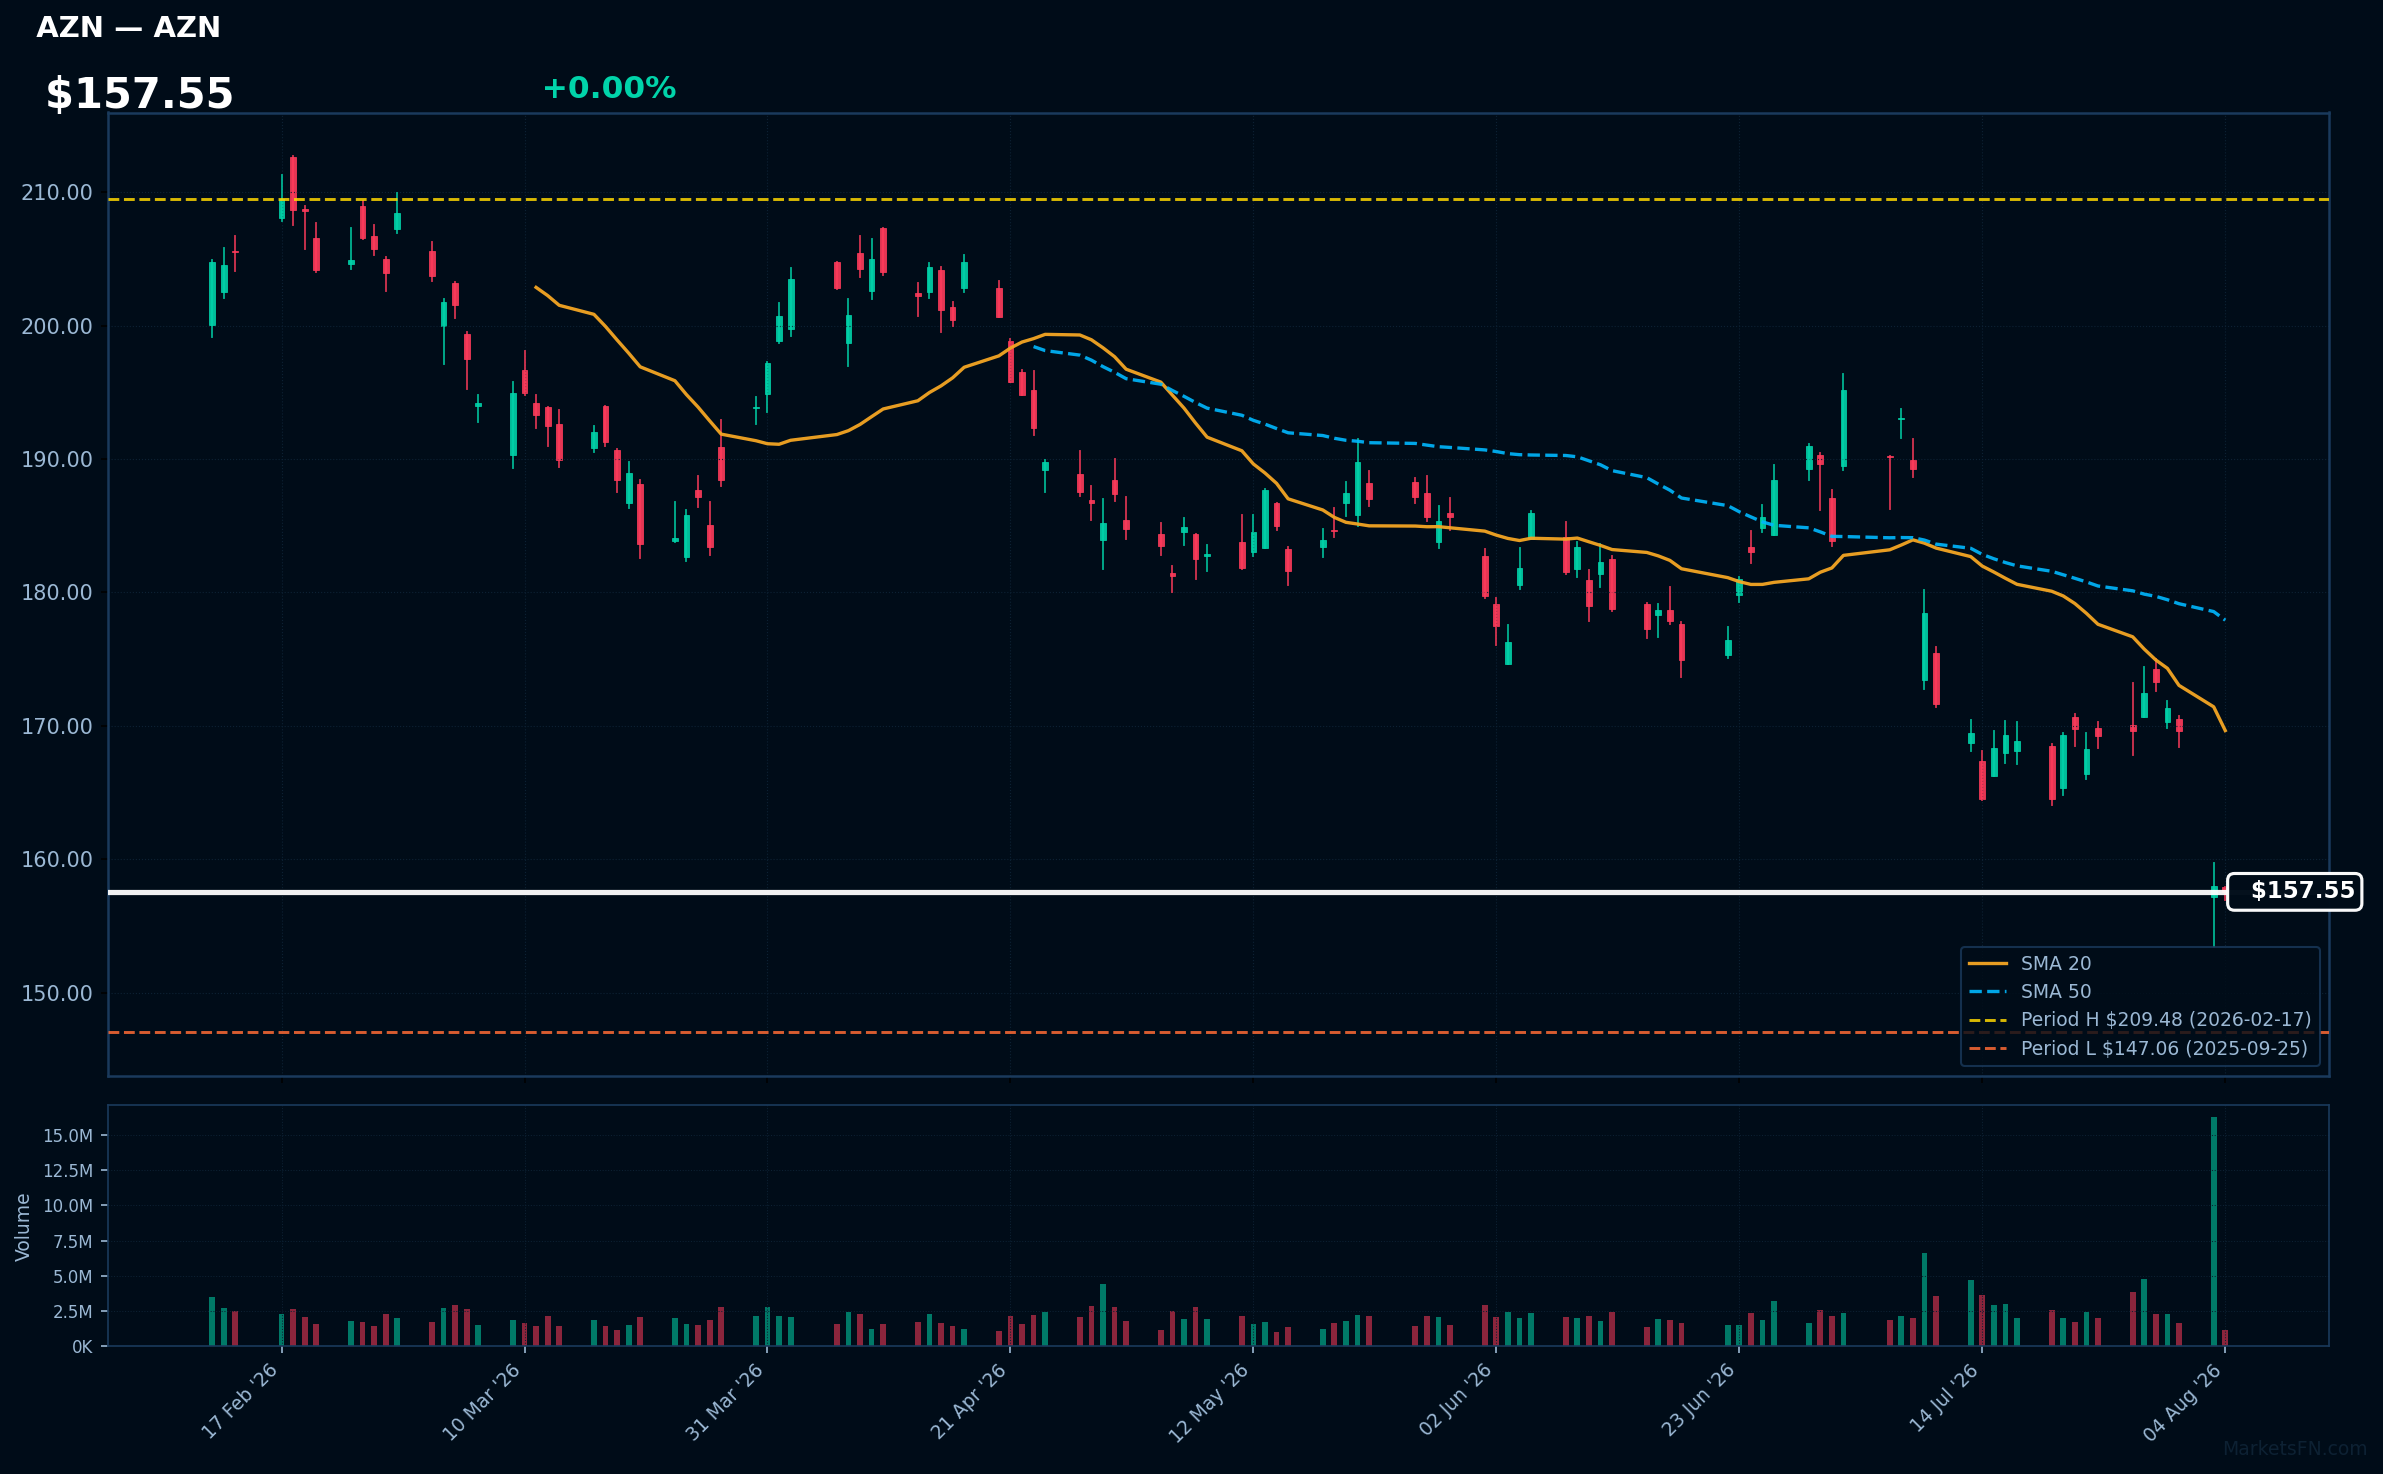
AZN | Astrazeneca plc ADR | Healthcare | Price Last: $157.59 | % Realized: +5.64% | RSI: 32.0 | % above MA200: -14.7% | Trend: Below MA20, MA50, MA200
Astrazeneca plc ADR develops prescription medicines, focusing on oncology, cardiovascular, and respiratory diseases. Investors should care due to its innovative pipeline and potential for growth in high-demand therapeutic areas, impacting healthcare outcomes and market share.
The current technical situation indicates a bearish trend with an RSI of 32.0 and a MA alignment of price < MA20 < MA50 < MA200, suggesting a sustained downtrend and testing major support.
Related headlines
Market Commentary
The presence of several Nasdaq 100 tech stocks near their 52-week highs, including Palo Alto Networks Inc (PANW), Crowdstrike Holdings Inc (CRWD), Fortinet Inc (FTNT), Datadog Inc (DDOG), and Electronic Arts, Inc (EA), signals strong investor confidence and bullish sentiment in the technology sector. These stocks being at their peak suggests robust demand and positive market perception, reflecting the sector's resilience amid fluctuating economic conditions.
Several macro themes are driving these price levels, including advancements in cybersecurity, cloud computing, and digital entertainment. The ongoing emphasis on cybersecurity solutions, particularly in light of increasing cyber threats, has propelled companies like PANW and CRWD to the forefront. Additionally, the shift towards digital platforms and services continues to bolster demand for tech stocks, as businesses and consumers increasingly rely on technology for operations and entertainment.
Key levels to watch include the 52-week highs for the aforementioned stocks, which could serve as critical resistance points. A breakout above these levels may indicate further bullish momentum, while a failure to maintain these highs could lead to a potential breakdown. Catalysts for movement could include earnings reports, regulatory changes, or shifts in consumer behavior that impact the technology landscape.
Methodology: All 101 Nasdaq 100 constituents screened. 52-week high = highest daily close over the past 252 trading days (approx. 1 year). 52-week low = lowest daily close over the same period. Distance = (current price / extreme − 1) × 100. Technical indicators computed on up to 1 year of daily OHLCV data.
Disclaimer: For informational purposes only. Not investment advice. Past performance is not indicative of future results.

