Nasdaq 100 52-Week Highs & Lows Radar: Palo Alto Networks (PANW), Trade Desk (TTD) and more
MarketsFN Team

Nasdaq 100 52-Week Highs & Lows Radar: Palo Alto Networks (PANW), Trade Desk (TTD) and more
Screening all 101 Nasdaq 100 constituents for stocks nearest to their 52-week high and their 52-week low. Data as of August 07, 2026. % Realized = 52-week total return.
Legend: RSI > 70 = overbought · RSI < 30 = oversold · Green % Realized = positive 52W return · Red = negative.
📈 Nearest to 52-Week High
Sectors represented: Technology (2), Consumer Cyclical (1), Industrials (1), Communication Services (1)
| Ticker | Company | Sector | Price Last | % Realized | 52-Week High Date | RSI | % above MA200 | Trend |
|---|---|---|---|---|---|---|---|---|
| PANW | Palo Alto Networks Inc | Technology | $369.42 | +119.77% | 2026-08-07 | 66.0 | +69.4% | Above MA20, MA50, MA200 |
| CRWD | Crowdstrike Holdings Inc | Technology | $215.91 | +103.21% | 2026-08-07 | 67.3 | +60.2% | Above MA20, MA50, MA200 |
| ABNB | Airbnb Inc | Consumer Cyclical | $175.71 | +46.38% | 2026-08-07 | 78.1 | +31.8% | Above MA20, MA50, MA200 |
| FAST | Fastenal Co | Industrials | $51.27 | +7.98% | 2026-08-07 | 70.4 | +15.3% | Above MA20, MA50, MA200 |
| EA | Electronic Arts, Inc | Communication Services | $209.70 | +28.85% | 2026-08-04 | 82.2 | +3.6% | Above MA20, MA50, MA200 |
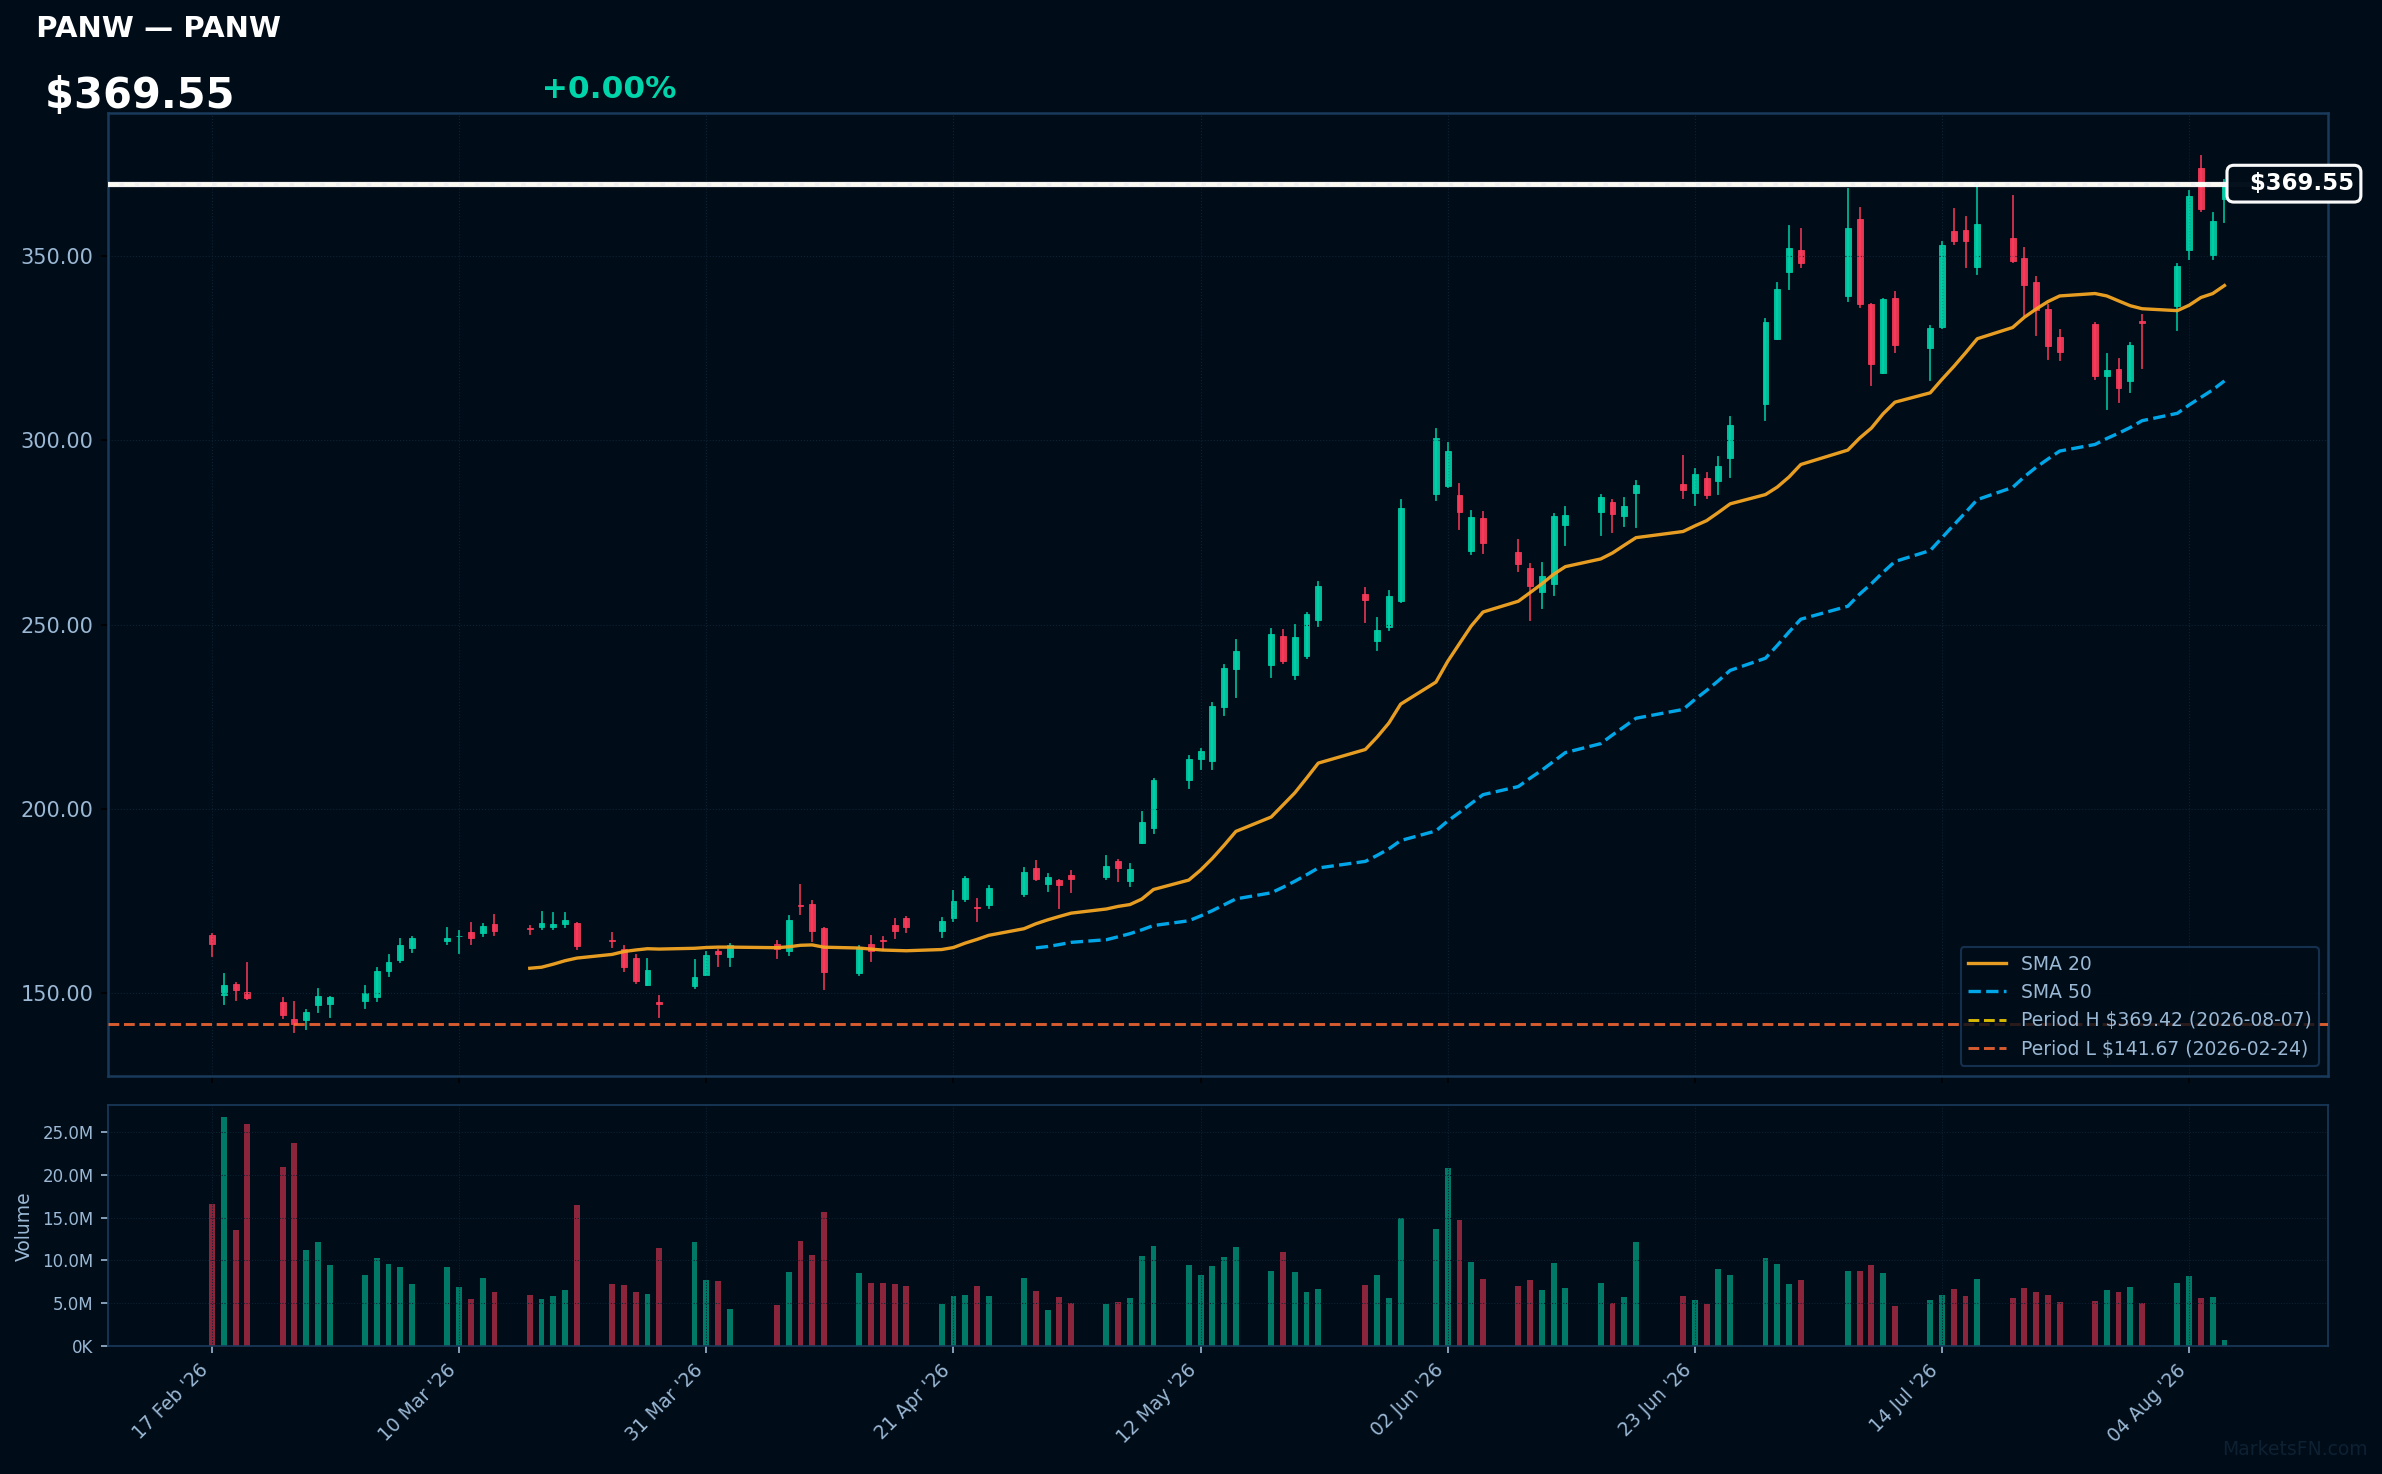
PANW | Palo Alto Networks Inc | Technology | Price Last: $369.42 | % Realized: +119.77% | RSI: 66.0 | % above MA200: +69.4% | Trend: Above MA20, MA50, MA200
Palo Alto Networks Inc specializes in cybersecurity solutions, providing advanced firewalls and cloud-based security services. Investors should care due to the increasing demand for cybersecurity amid rising digital threats, positioning the company for sustained growth and market relevance.
The current technical situation indicates bullish momentum, with an RSI of 66.0 and a strong MA alignment: price > MA20 > MA50 > MA200, suggesting a sustained uptrend. The stock is also 0.0% below its 52-Week high, indicating a potential breakout level.
Related headlines
- China launches cybersecurity review into Palo Alto Networks products
- PANW Stock Holds Near Record Highs Despite Fresh China Security Review That Mirrors Micron Case
- Palo Alto Networks to Announce Fiscal Fourth Quarter and Fiscal Year 2026 Financial Results on Tuesday, September 1, 2026
- Palo Alto Networks CEO calls OpenAI-Hugging Face hack next level
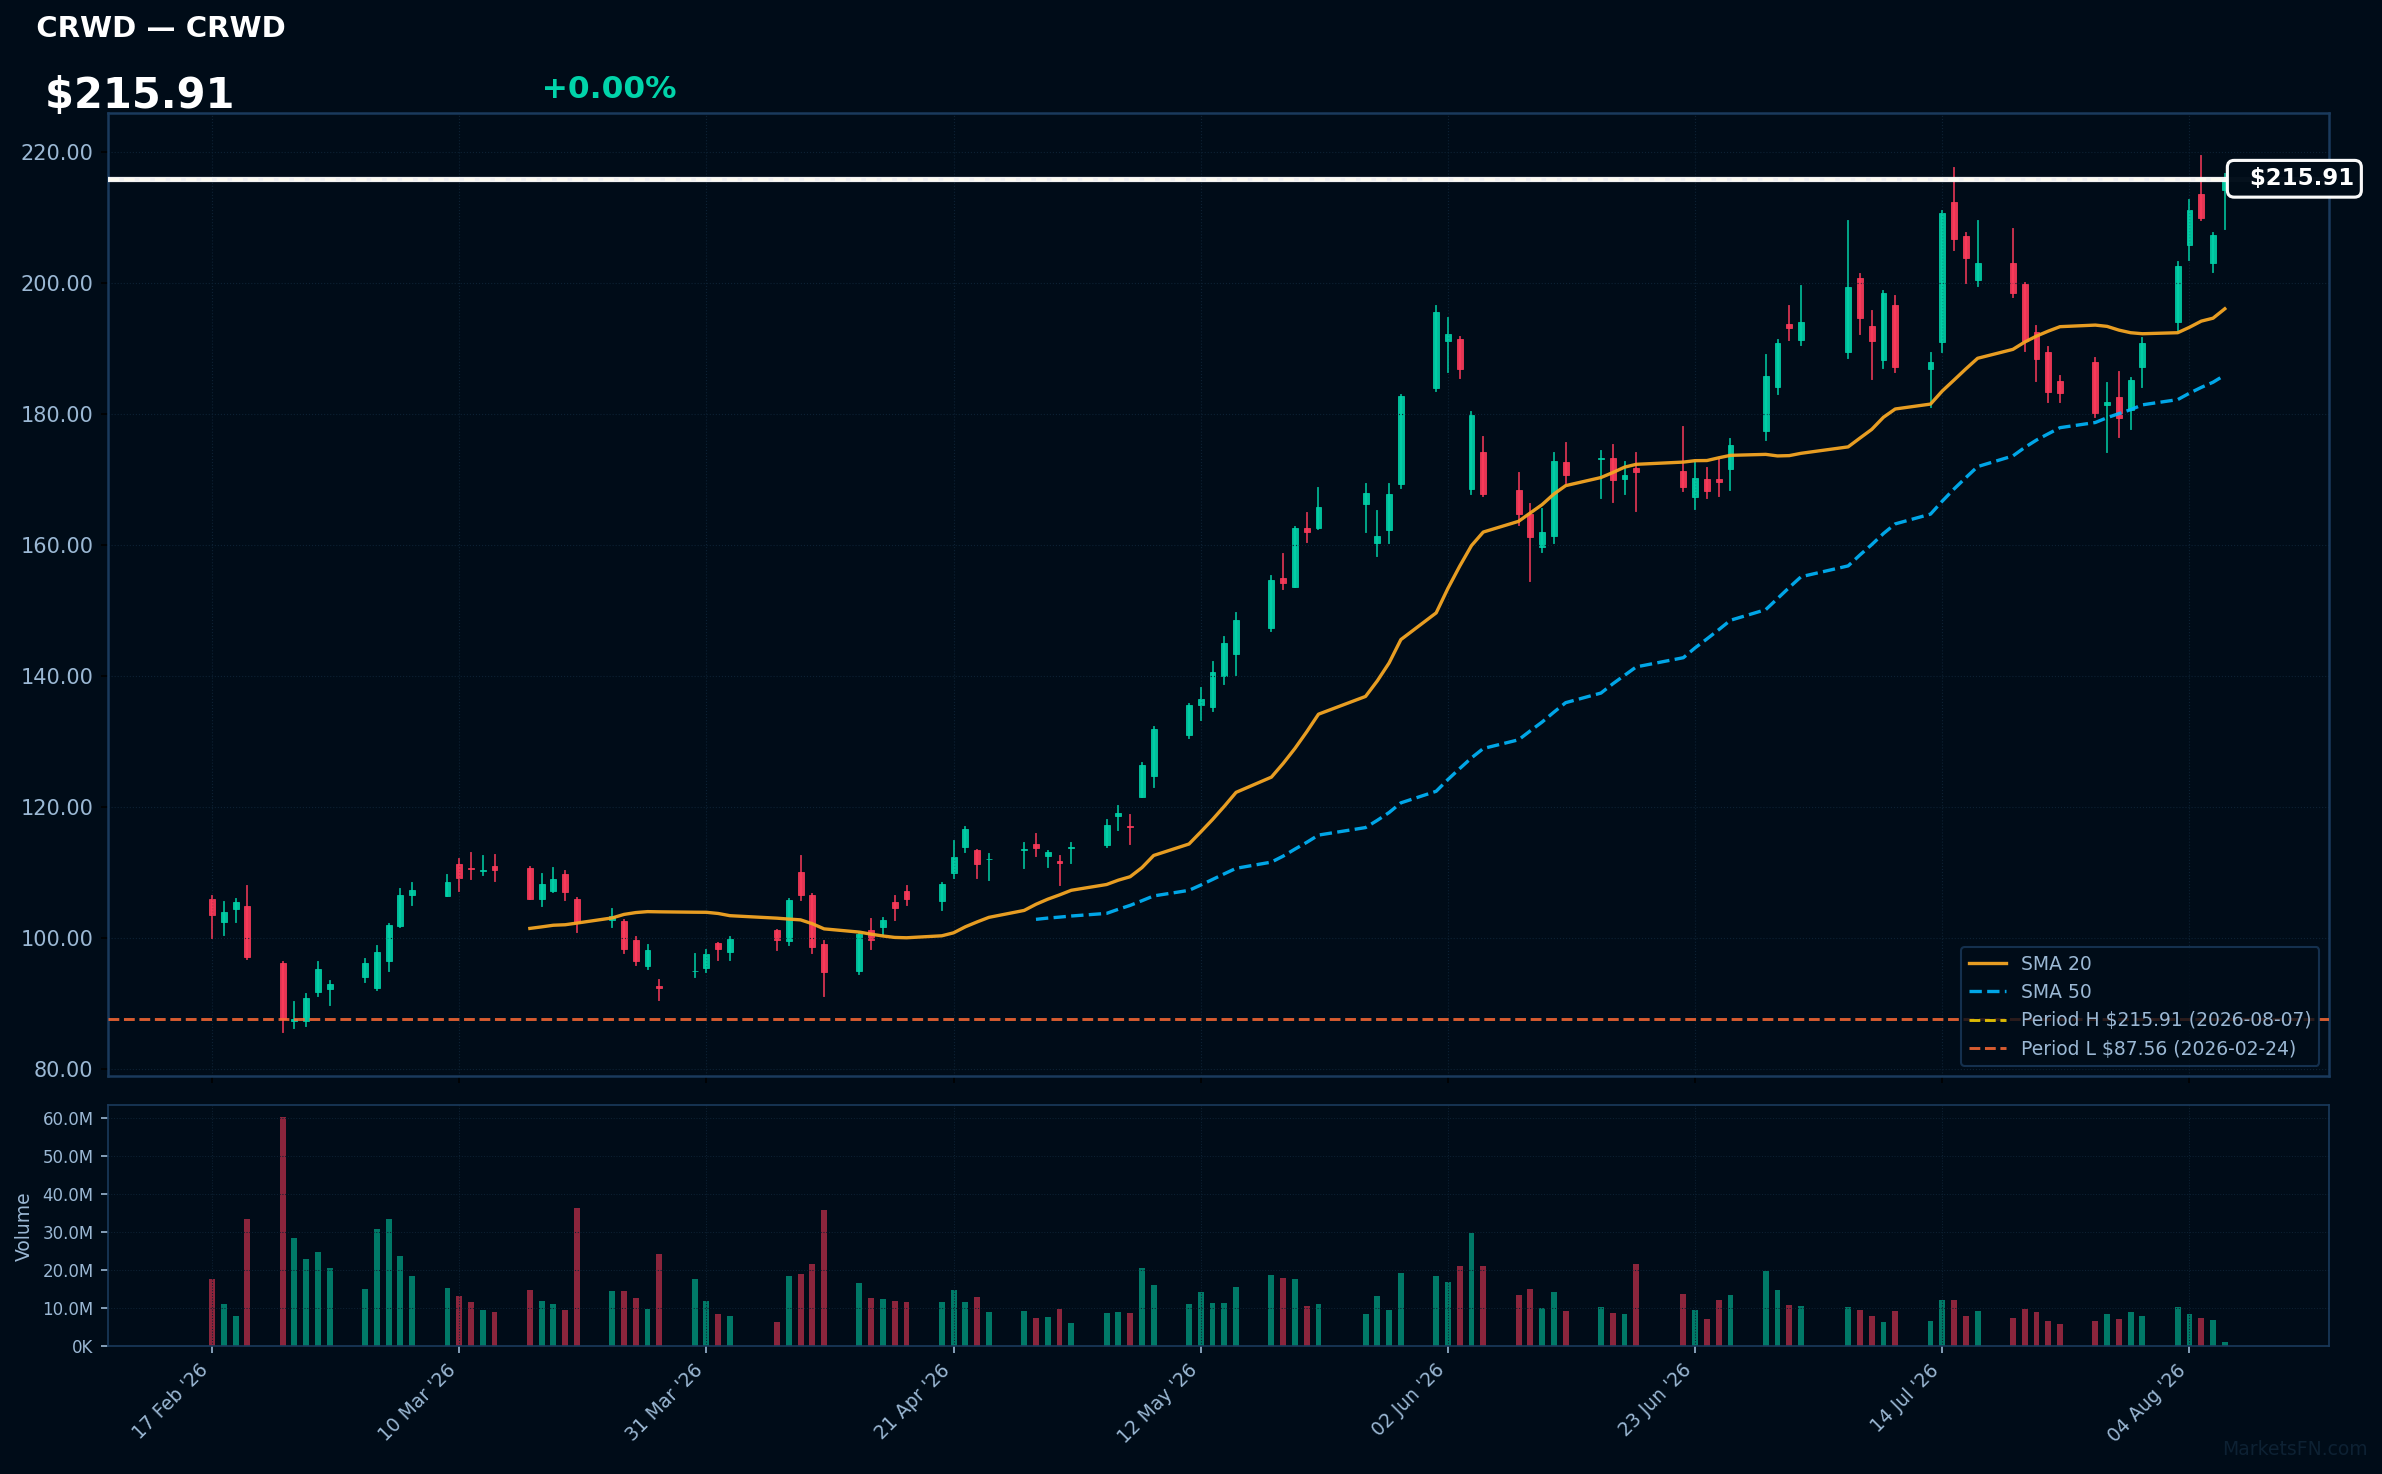
CRWD | Crowdstrike Holdings Inc | Technology | Price Last: $215.91 | % Realized: +103.21% | RSI: 67.3 | % above MA200: +60.2% | Trend: Above MA20, MA50, MA200
Crowdstrike Holdings Inc specializes in cybersecurity solutions, offering cloud-native endpoint protection and threat intelligence. Investors should care due to the increasing demand for robust cybersecurity measures as cyber threats escalate, positioning Crowdstrike as a leader in a critical industry.
The current technical situation indicates bullish momentum, with an RSI(14) of 67.3 and a strong MA alignment: price > MA20 > MA50 > MA200. The stock is also 0.0% below its 52-Week high, suggesting a potential breakout.
Related headlines
- CrowdStrike Announces $100,000 International AI Security Challenge
- CrowdStrike Announces Date of Fiscal Second Quarter 2027 Financial Results Conference Call
- CrowdStrike Fal.Con 2026 Sells Out at Record Pace as the Industry Races to Secure AI
- CrowdStrike 2026 Threat Hunting Report: AI is Now Embedded Across Modern Adversary Operations
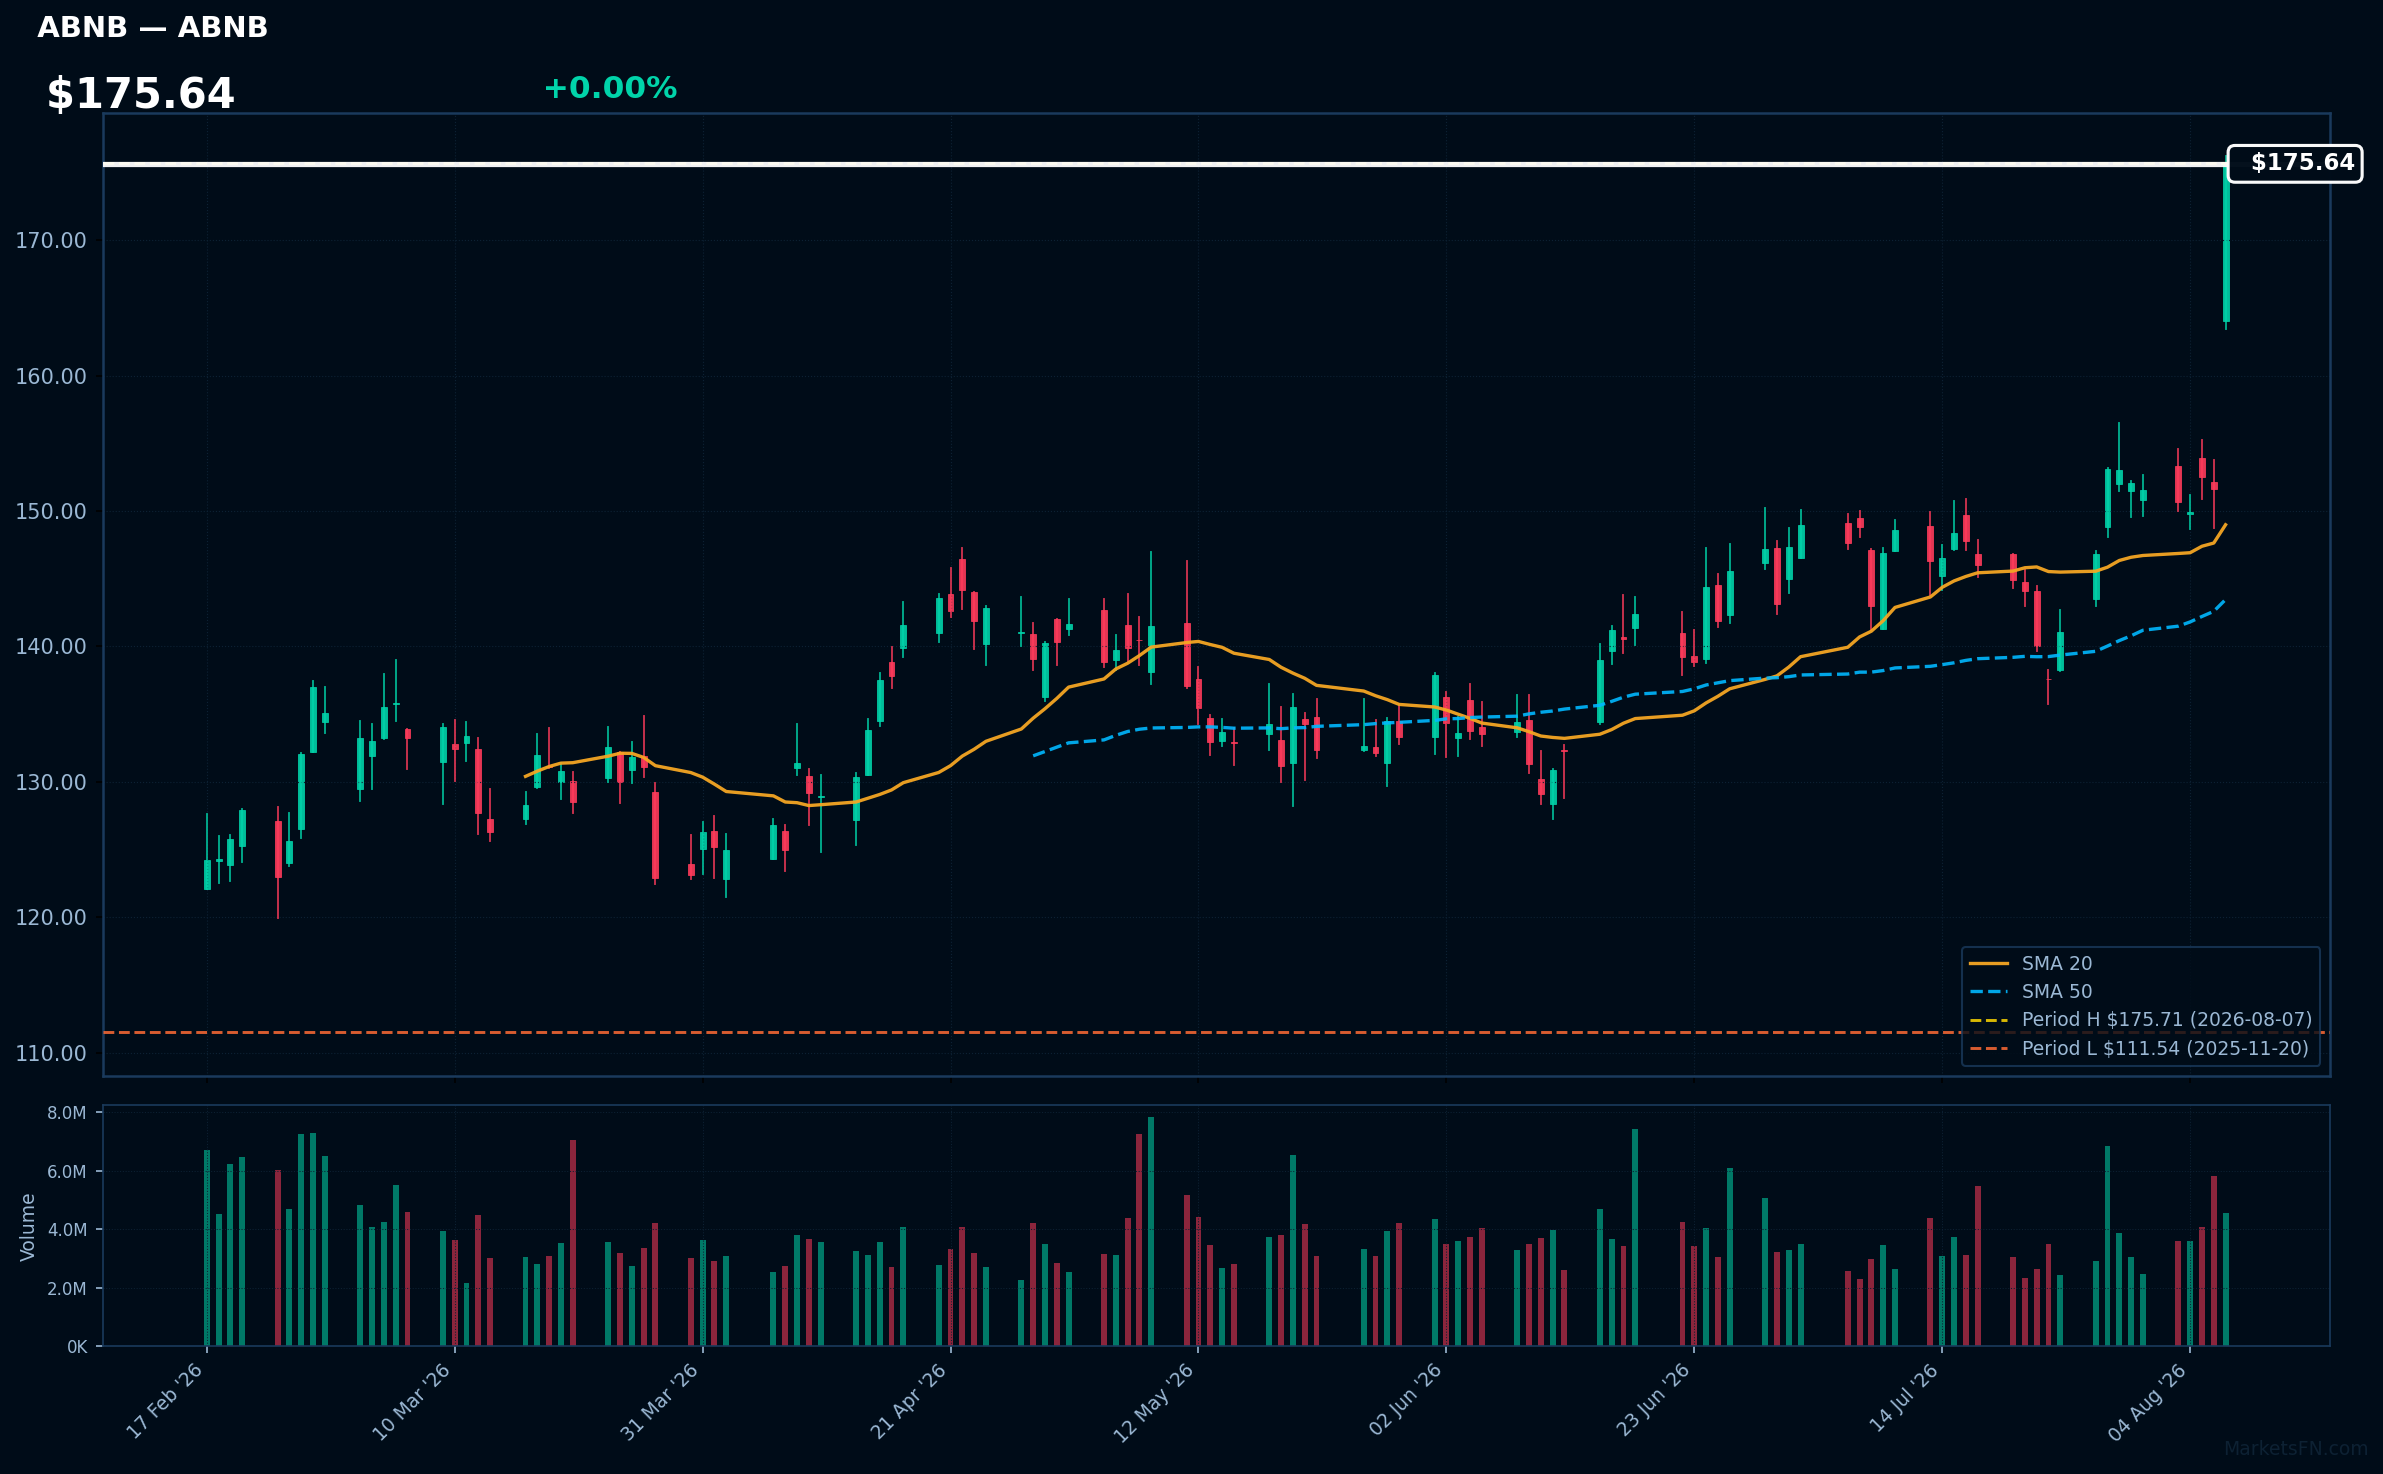
ABNB | Airbnb Inc | Consumer Cyclical | Price Last: $175.71 | % Realized: +46.38% | RSI: 78.1 | % above MA200: +31.8% | Trend: Above MA20, MA50, MA200
Airbnb Inc (ABNB) operates an online marketplace for lodging, primarily homestays for vacation rentals. Investors should care due to its innovative approach to travel accommodation, which has disrupted traditional hospitality and continues to grow in popularity, especially post-pandemic.
The current technical situation indicates strong momentum, with an RSI(14) of 78.1 and a bullish MA alignment: price > MA20 > MA50 > MA200. The stock is also 0.0% below its 52-Week high, signaling a potential breakout.
Related headlines
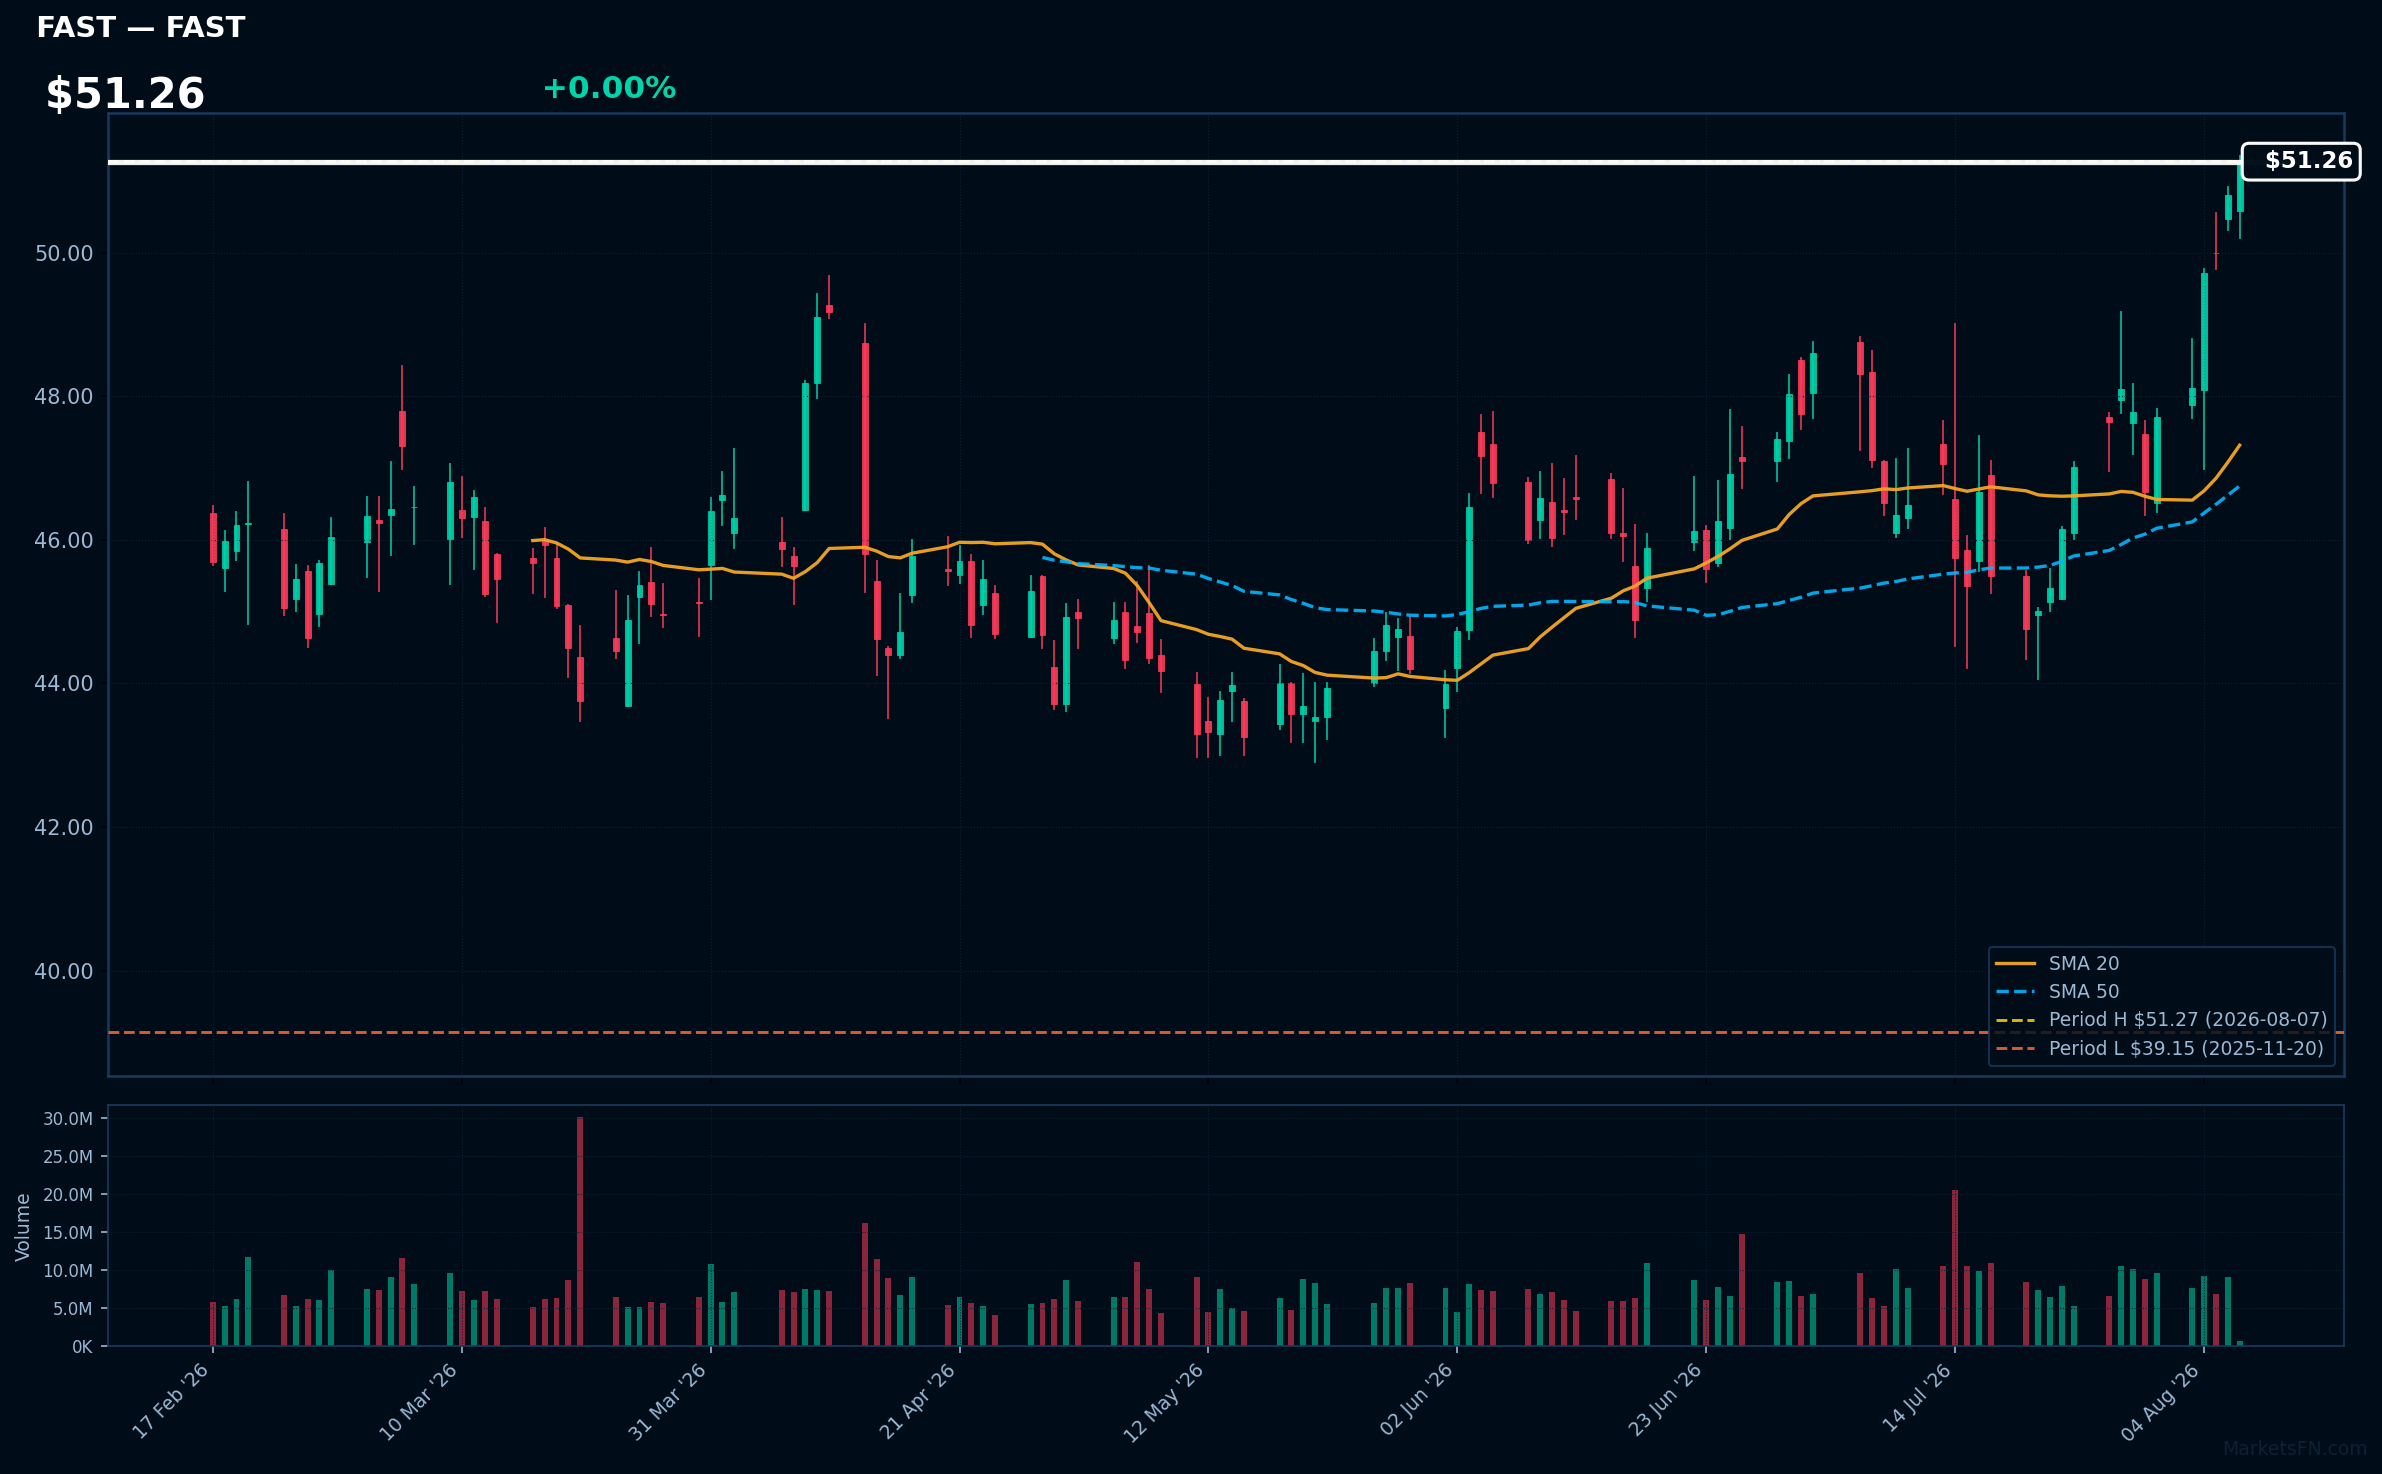
FAST | Fastenal Co | Industrials | Price Last: $51.27 | % Realized: +7.98% | RSI: 70.4 | % above MA200: +15.3% | Trend: Above MA20, MA50, MA200
Fastenal Co (FAST) is a distributor of industrial and construction supplies, specializing in fasteners, tools, and safety products. Investors should care due to its strong market position and consistent demand in the manufacturing and construction sectors, which drive revenue growth.
The current technical situation shows bullish momentum with an RSI(14) of 70.4 and a bullish MA alignment: price > MA20 > MA50 > MA200. The stock is also 0.0% below its 52-Week high, indicating a potential breakout.
Related headlines
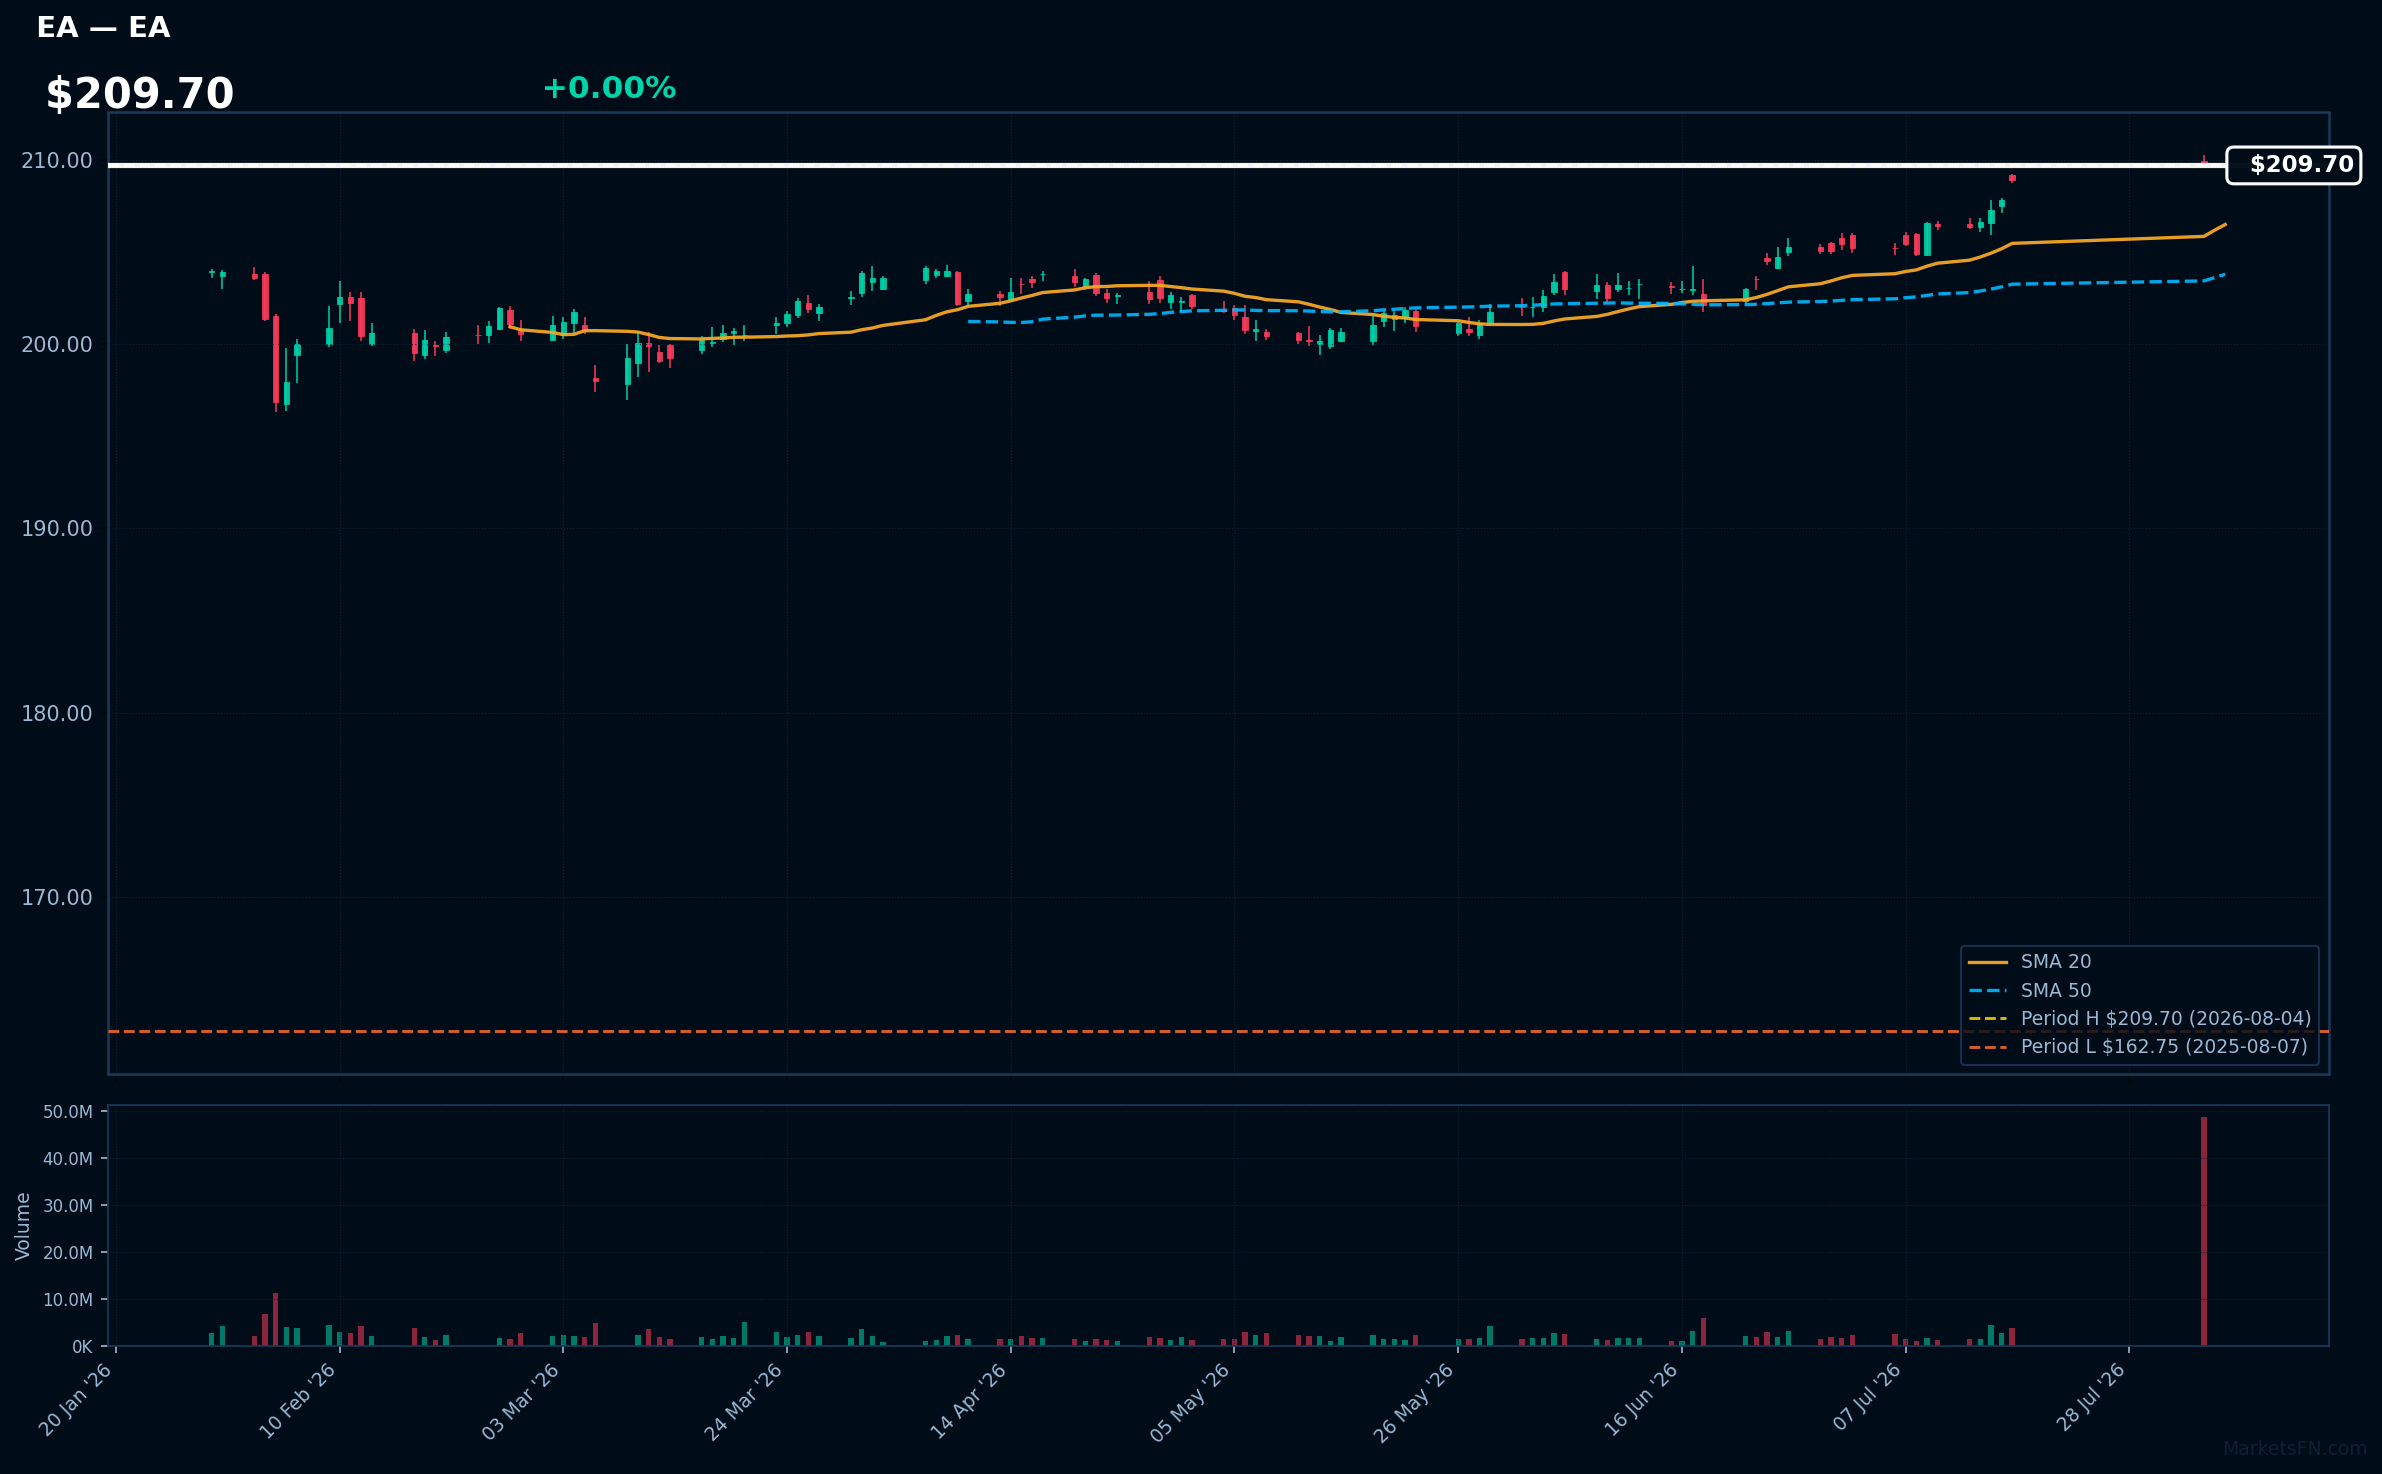
EA | Electronic Arts, Inc | Communication Services | Price Last: $209.70 | % Realized: +28.85% | RSI: 82.2 | % above MA200: +3.6% | Trend: Above MA20, MA50, MA200
Electronic Arts, Inc. develops and publishes interactive software and video games, including popular franchises like FIFA and Madden NFL. Investors should care due to its strong market position and consistent revenue generation from digital sales and live services.
The current technical situation shows strong momentum with an RSI(14) of 82.2 and a bullish MA alignment: price > MA20 > MA50 > MA200, indicating a sustained uptrend.
Related headlines
📉 Nearest to 52-Week Low
Sectors represented: Communication Services (3), Consumer Defensive (1), Utilities (1)
| Ticker | Company | Sector | Price Last | % Realized | 52-Week Low Date | RSI | % above MA200 | Trend |
|---|---|---|---|---|---|---|---|---|
| TTD | Trade Desk Inc | Communication Services | $13.87 | -84.30% | 2026-08-07 | 28.6 | -51.2% | Below MA20, MA50, MA200 |
| APP | Applovin Corp | Communication Services | $342.14 | -21.77% | 2026-08-06 | 30.9 | -33.6% | Below MA20, MA50, MA200 |
| PEP | PepsiCo Inc | Consumer Defensive | $138.13 | -4.02% | 2026-07-23 | 46.2 | -7.5% | Below MA20, MA50, MA200 |
| EXC | Exelon Corp | Utilities | $45.34 | -0.44% | 2025-09-16 | 41.4 | -1.7% | Below MA20, MA50, MA200 |
| TMUS | T-Mobile US Inc | Communication Services | $178.38 | -26.57% | 2026-06-30 | 47.6 | -9.8% | Below MA20, MA50, MA200 |
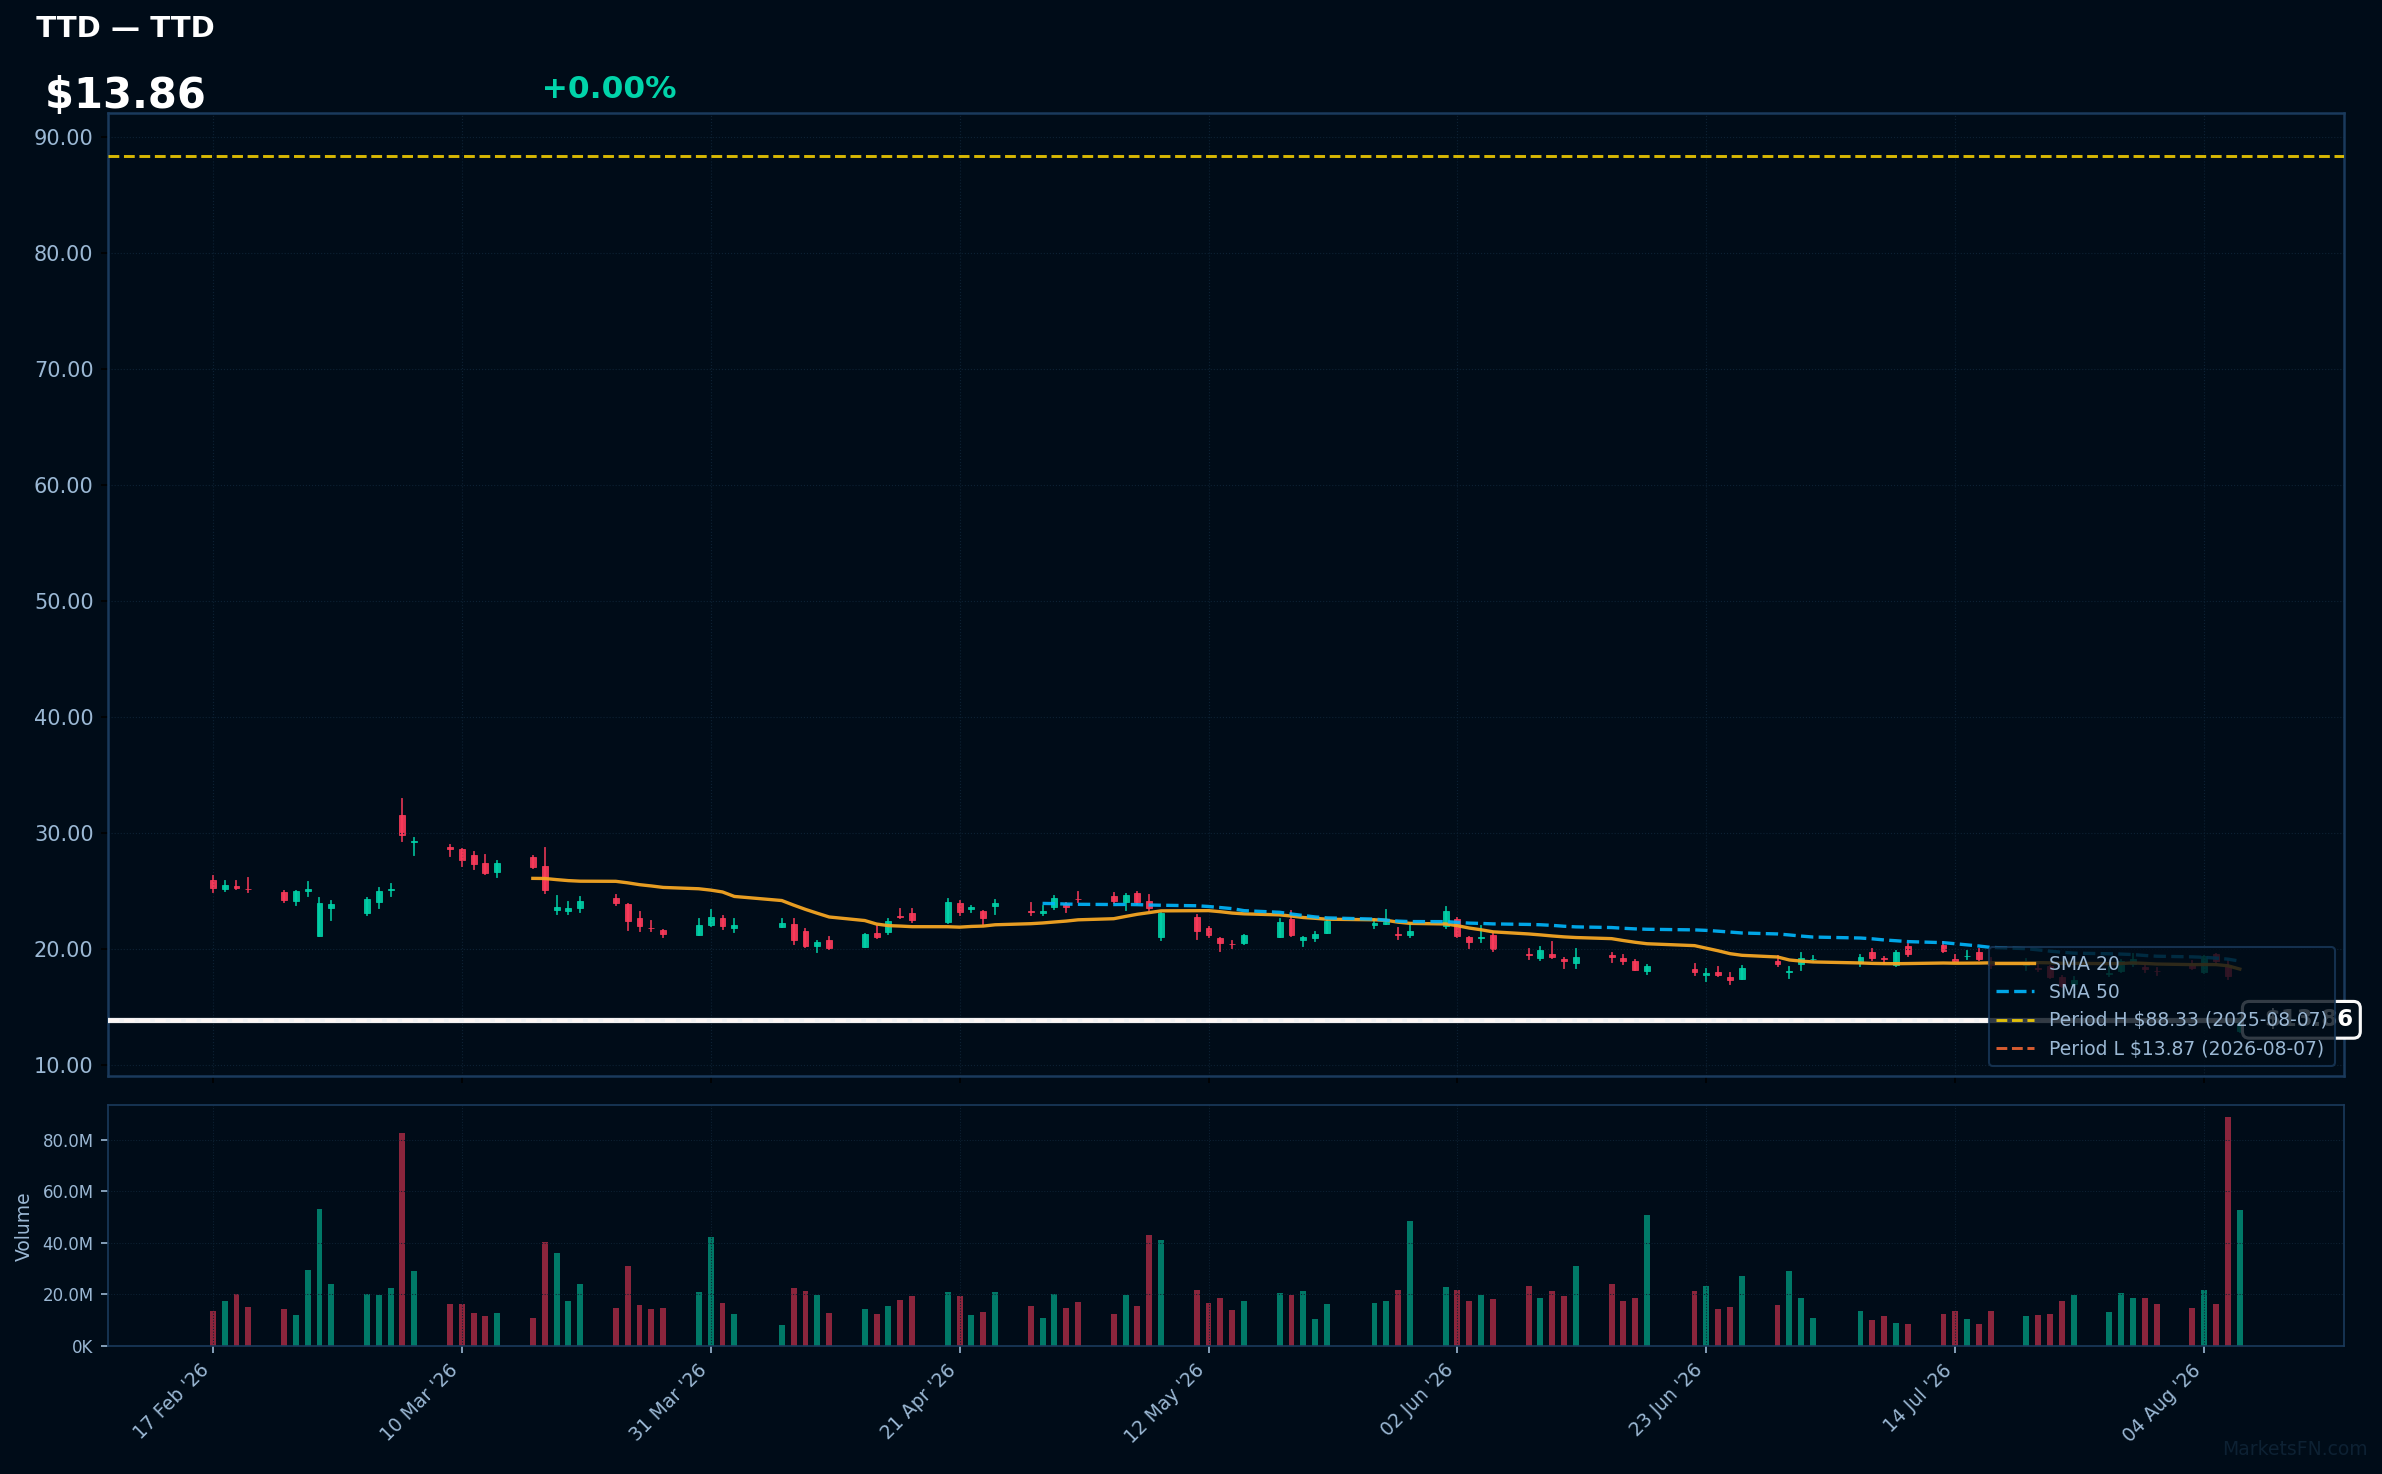
TTD | Trade Desk Inc | Communication Services | Price Last: $13.87 | % Realized: -84.30% | RSI: 28.6 | % above MA200: -51.2% | Trend: Below MA20, MA50, MA200
Trade Desk Inc (TTD) provides a technology platform for digital advertising, enabling advertisers to manage data-driven campaigns across various channels. Investors should care due to its significant market position in programmatic advertising and the potential for recovery in digital ad spending.
The current technical situation indicates a warning sign, with an RSI of 28.6 suggesting oversold conditions. The bearish MA alignment shows price < MA20 < MA50 < MA200, indicating a sustained downtrend, while the stock is only 0.0% above its 52-Week low.
Related headlines
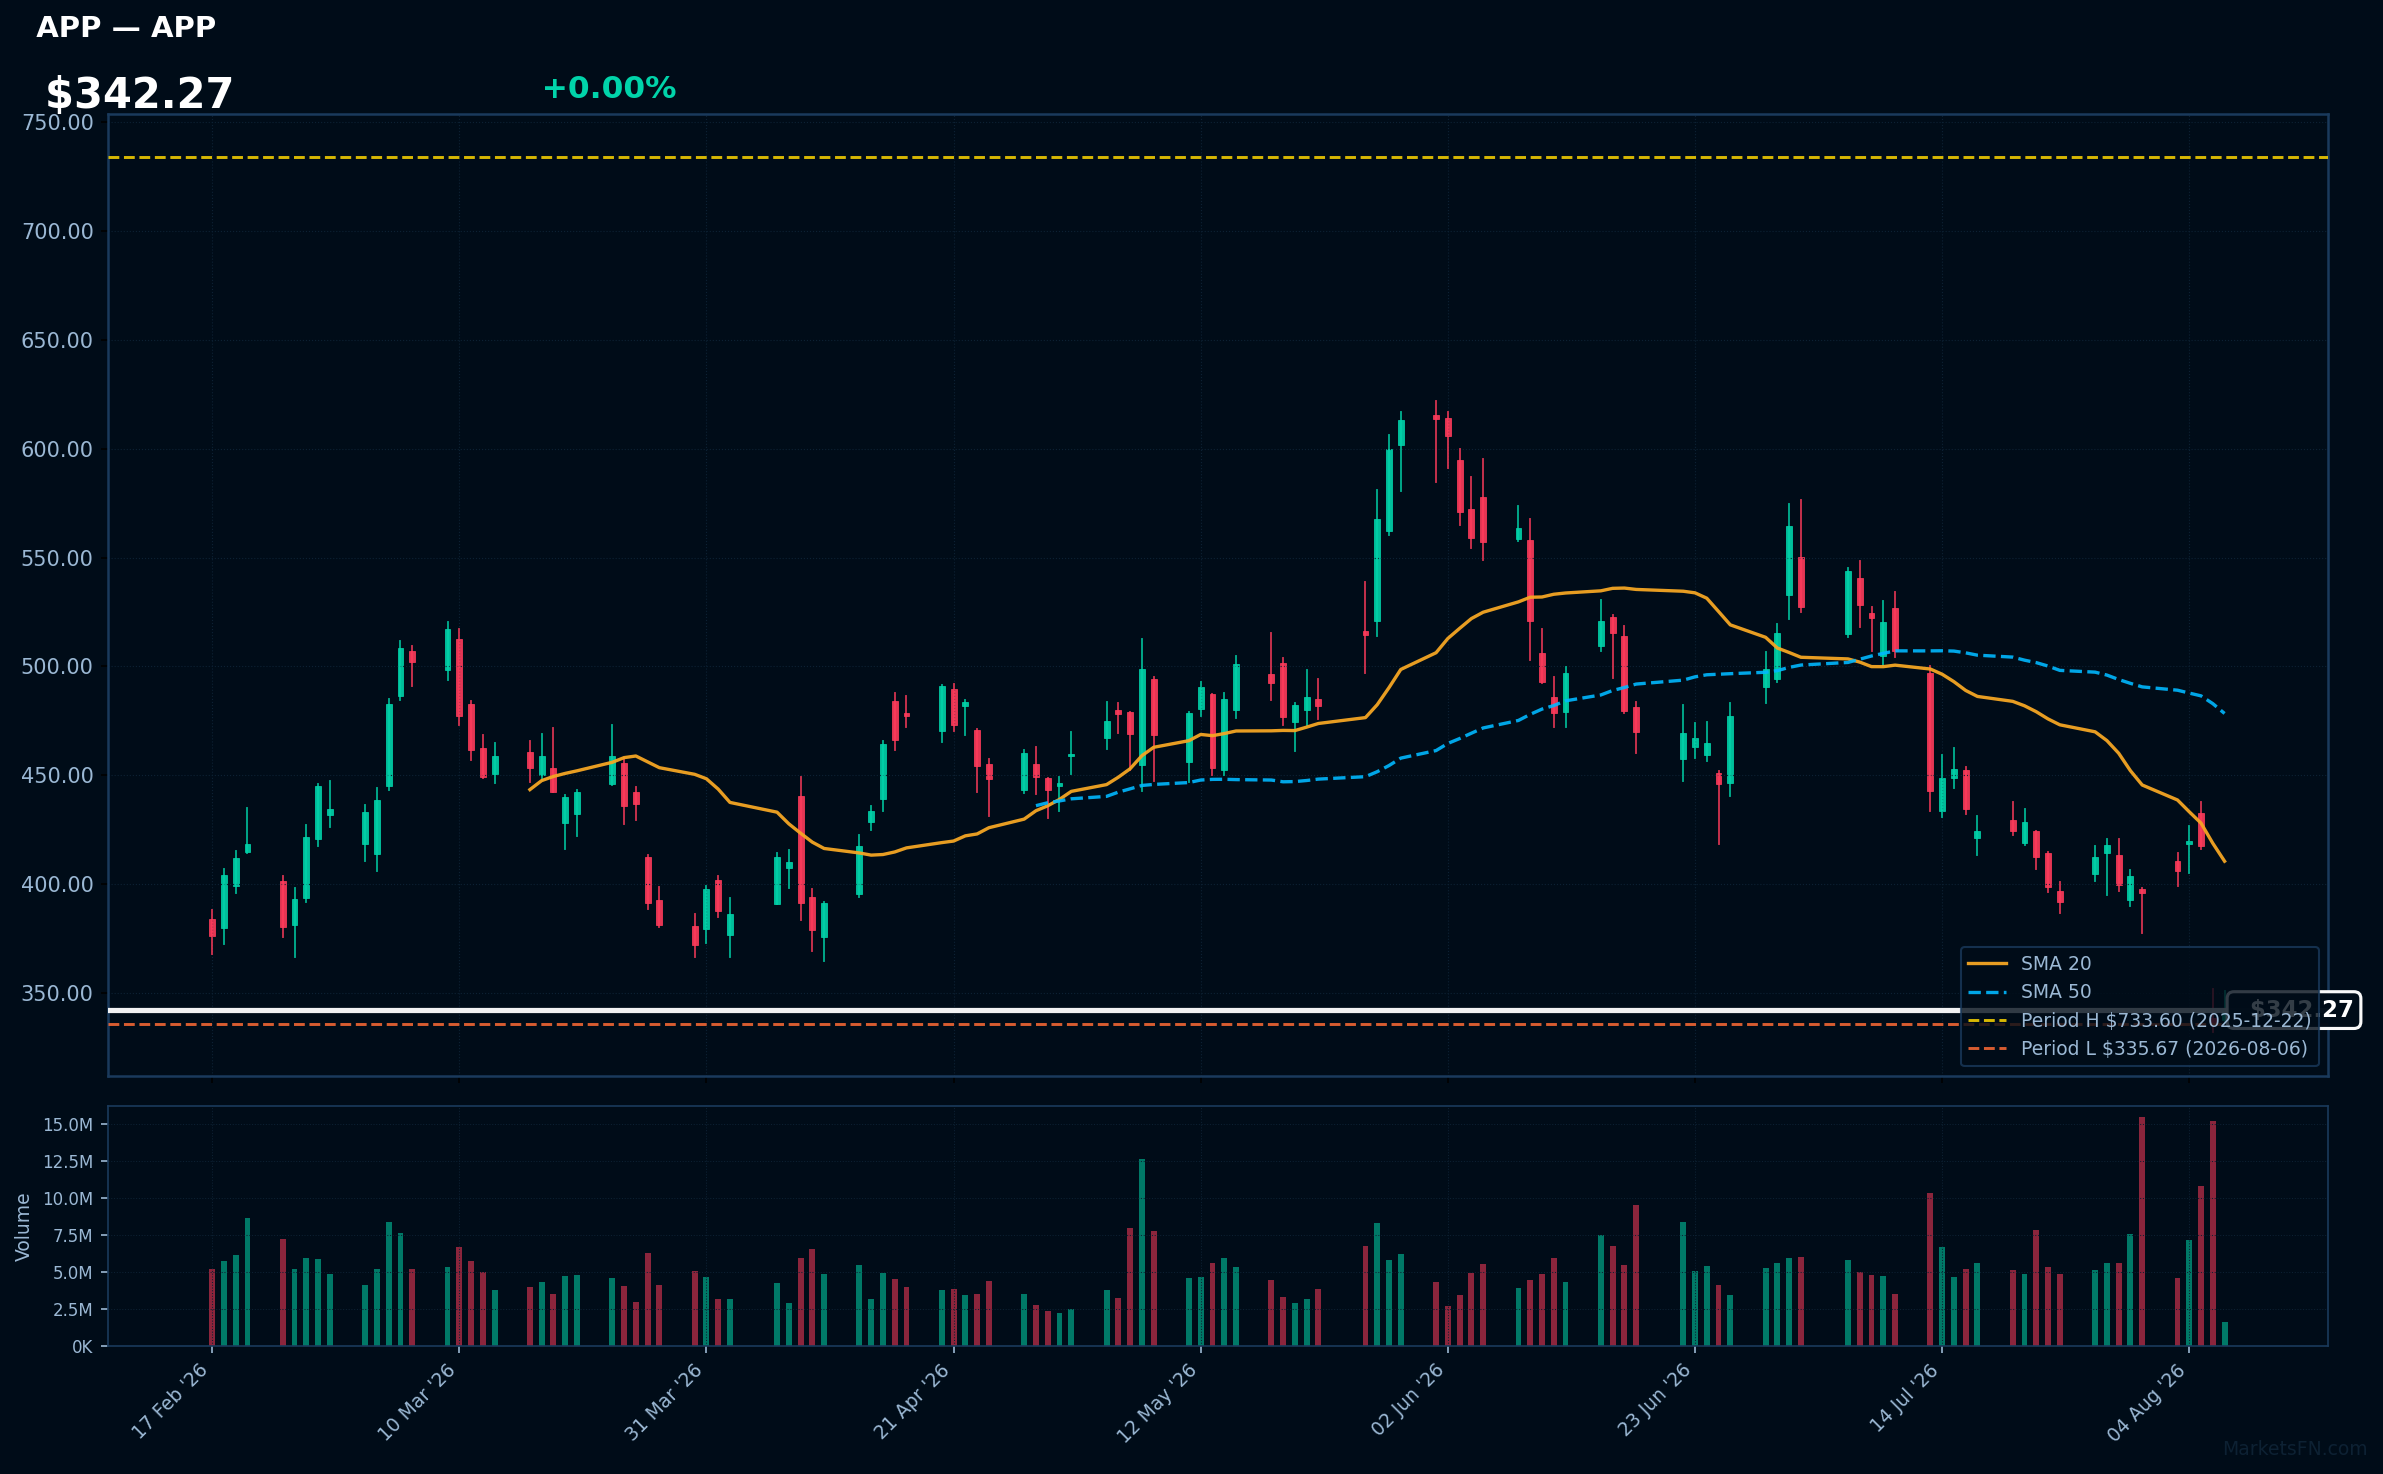
APP | Applovin Corp | Communication Services | Price Last: $342.14 | % Realized: -21.77% | RSI: 30.9 | % above MA200: -33.6% | Trend: Below MA20, MA50, MA200
Applovin Corp (APP) provides a platform for mobile app developers to monetize and market their applications. Investors should care due to its significant role in the growing mobile advertising sector, which is critical for app developers seeking revenue growth.
The current technical situation indicates a bearish trend, with an RSI(14) of 30.9 and a MA alignment of price < MA20 < MA50 < MA200, suggesting sustained downtrend and potential warning signs for investors.
Related headlines
- APP Vs CELH Vs BROS Vs AXON: Retail Traders Are Most Interested In Buying Post-Earnings Dips Of These 2 Stocks
- AppLovin Corp (APP) (Q2 2026) Earnings Call Highlights: Record Revenue and Strategic Expansion ...
- AppLovin's AI stumbles send the stock sliding toward its worst day in over a year
- AppLovin Stock Plummets to Lowest Level in Over a Year on Weaker-Than-Expected Revenue, Outlook
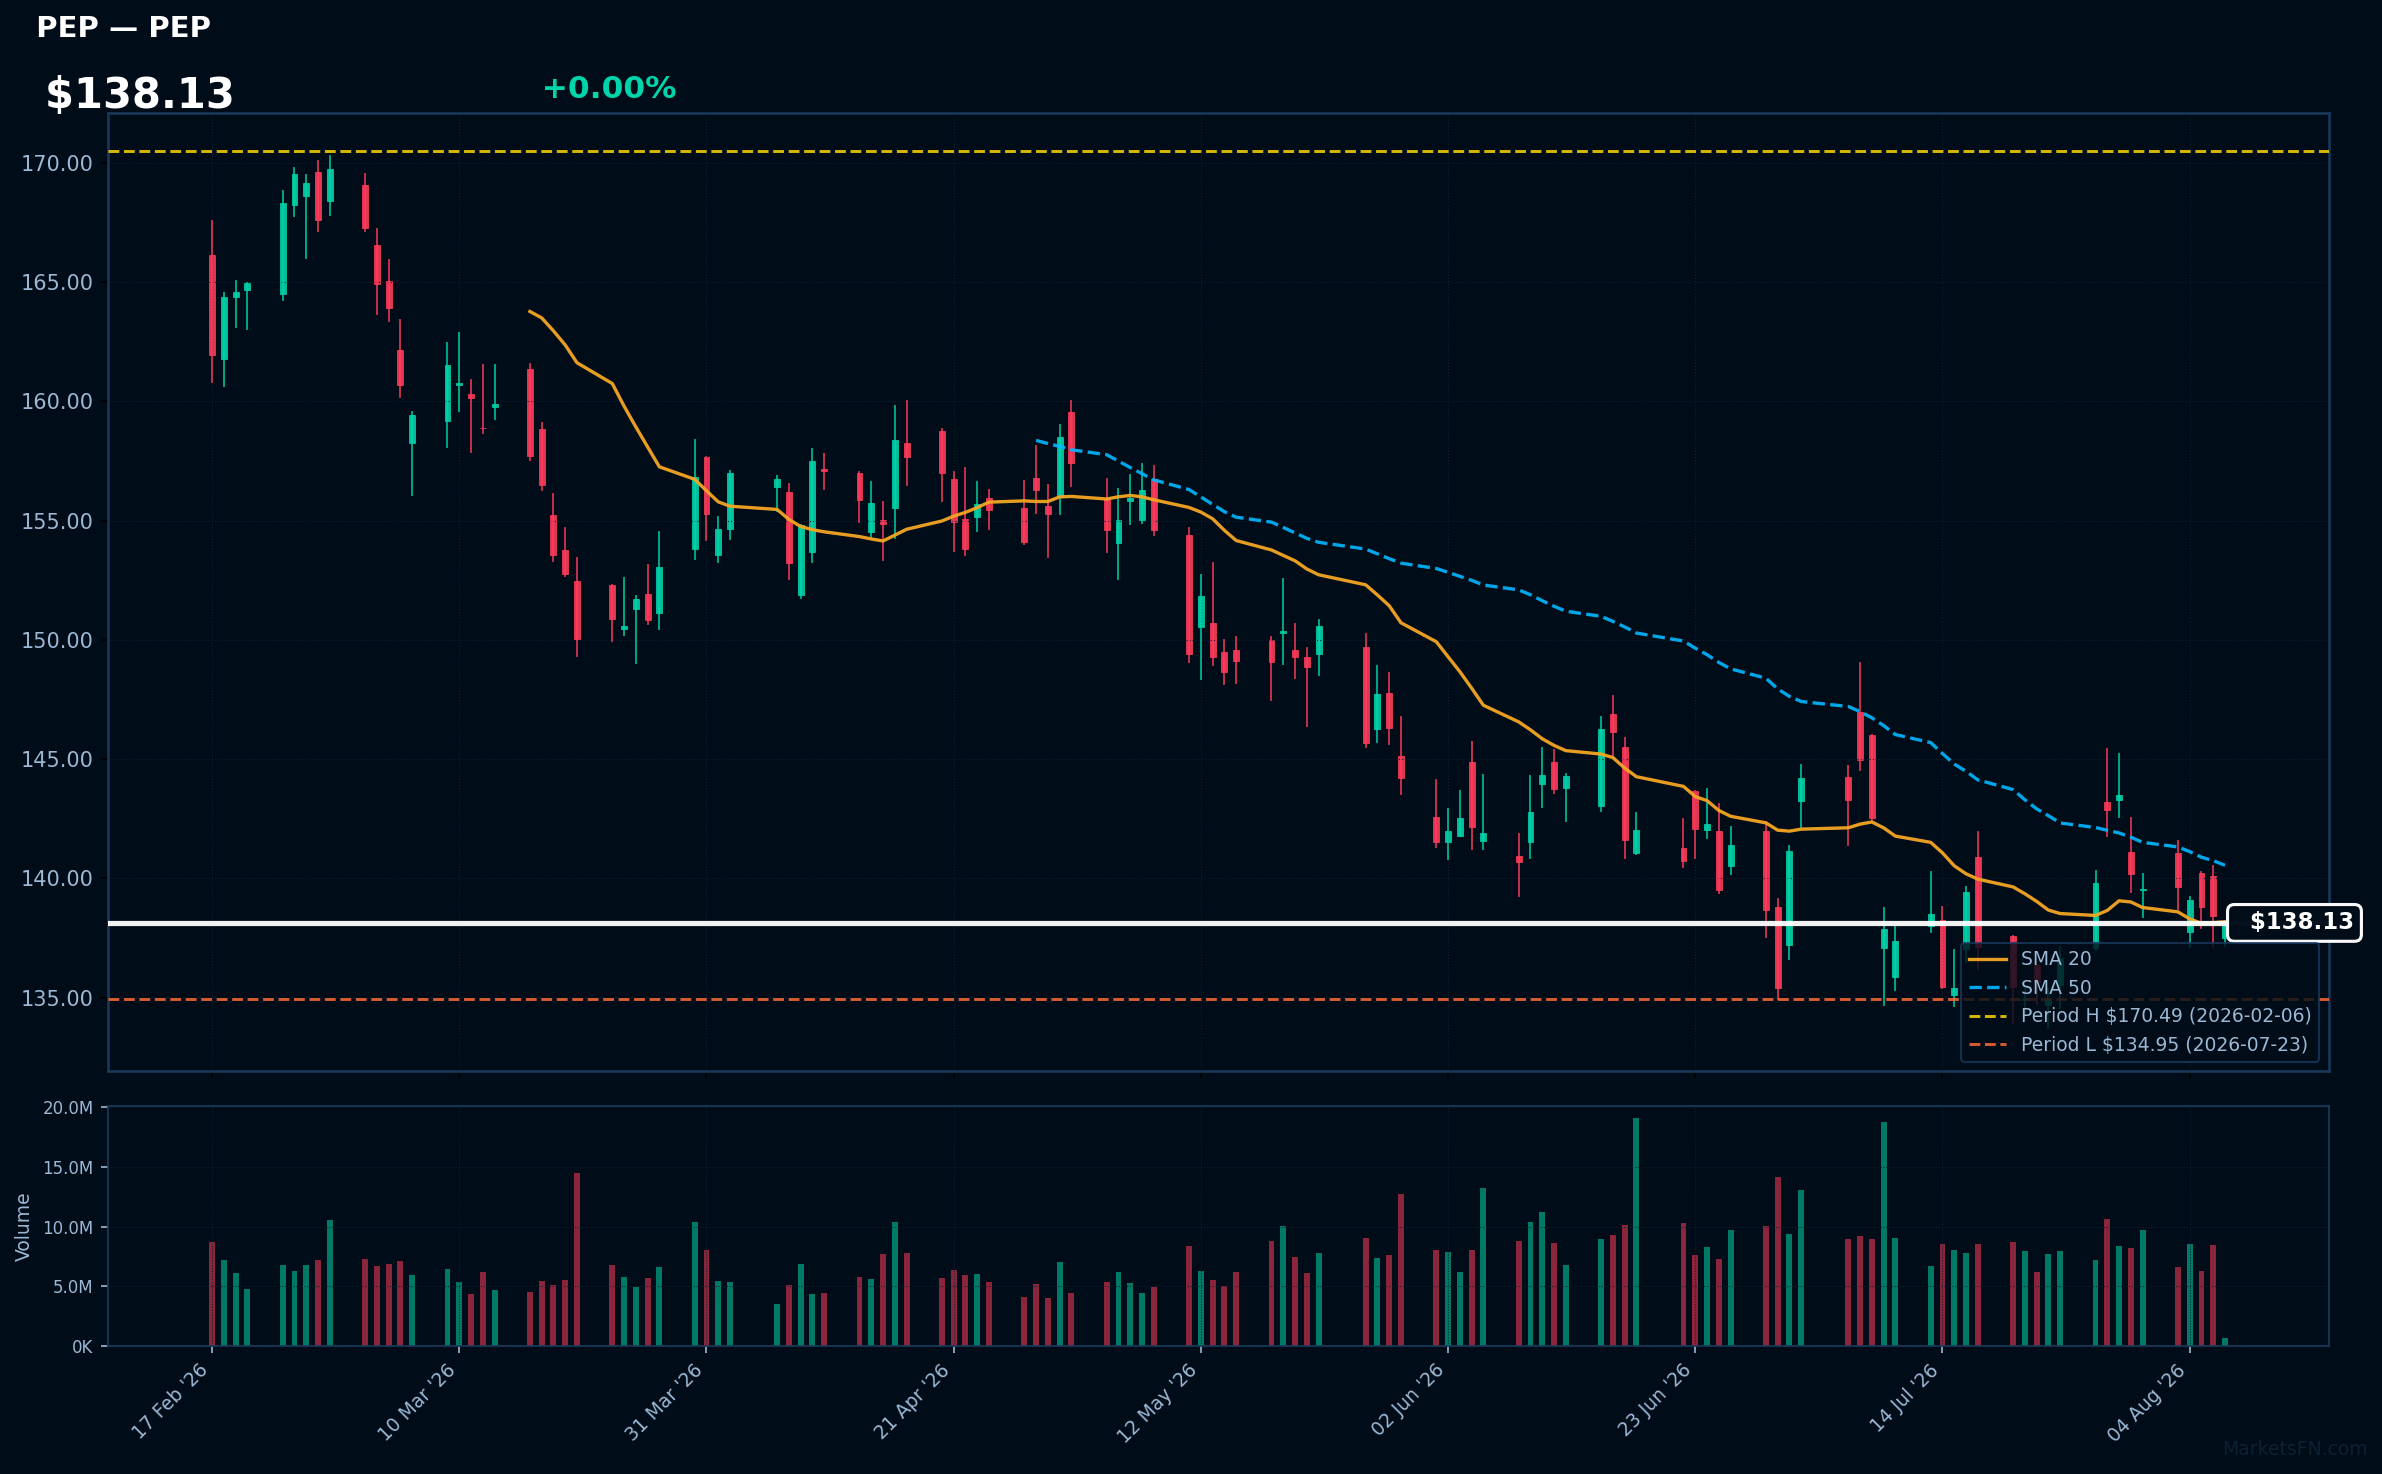
PEP | PepsiCo Inc | Consumer Defensive | Price Last: $138.13 | % Realized: -4.02% | RSI: 46.2 | % above MA200: -7.5% | Trend: Below MA20, MA50, MA200
PepsiCo Inc (PEP) is a global leader in the food and beverage industry, known for its diverse portfolio including snacks, soft drinks, and health-focused products. Investors should care due to its strong brand equity and consistent market presence, which can drive long-term growth.
The current technical situation indicates a bearish trend with an RSI(14) of 46.2 and a MA alignment of price < MA20 < MA50 < MA200, suggesting a sustained downtrend. The stock is also 2.4% above its 52-Week low, testing major support.
Related headlines
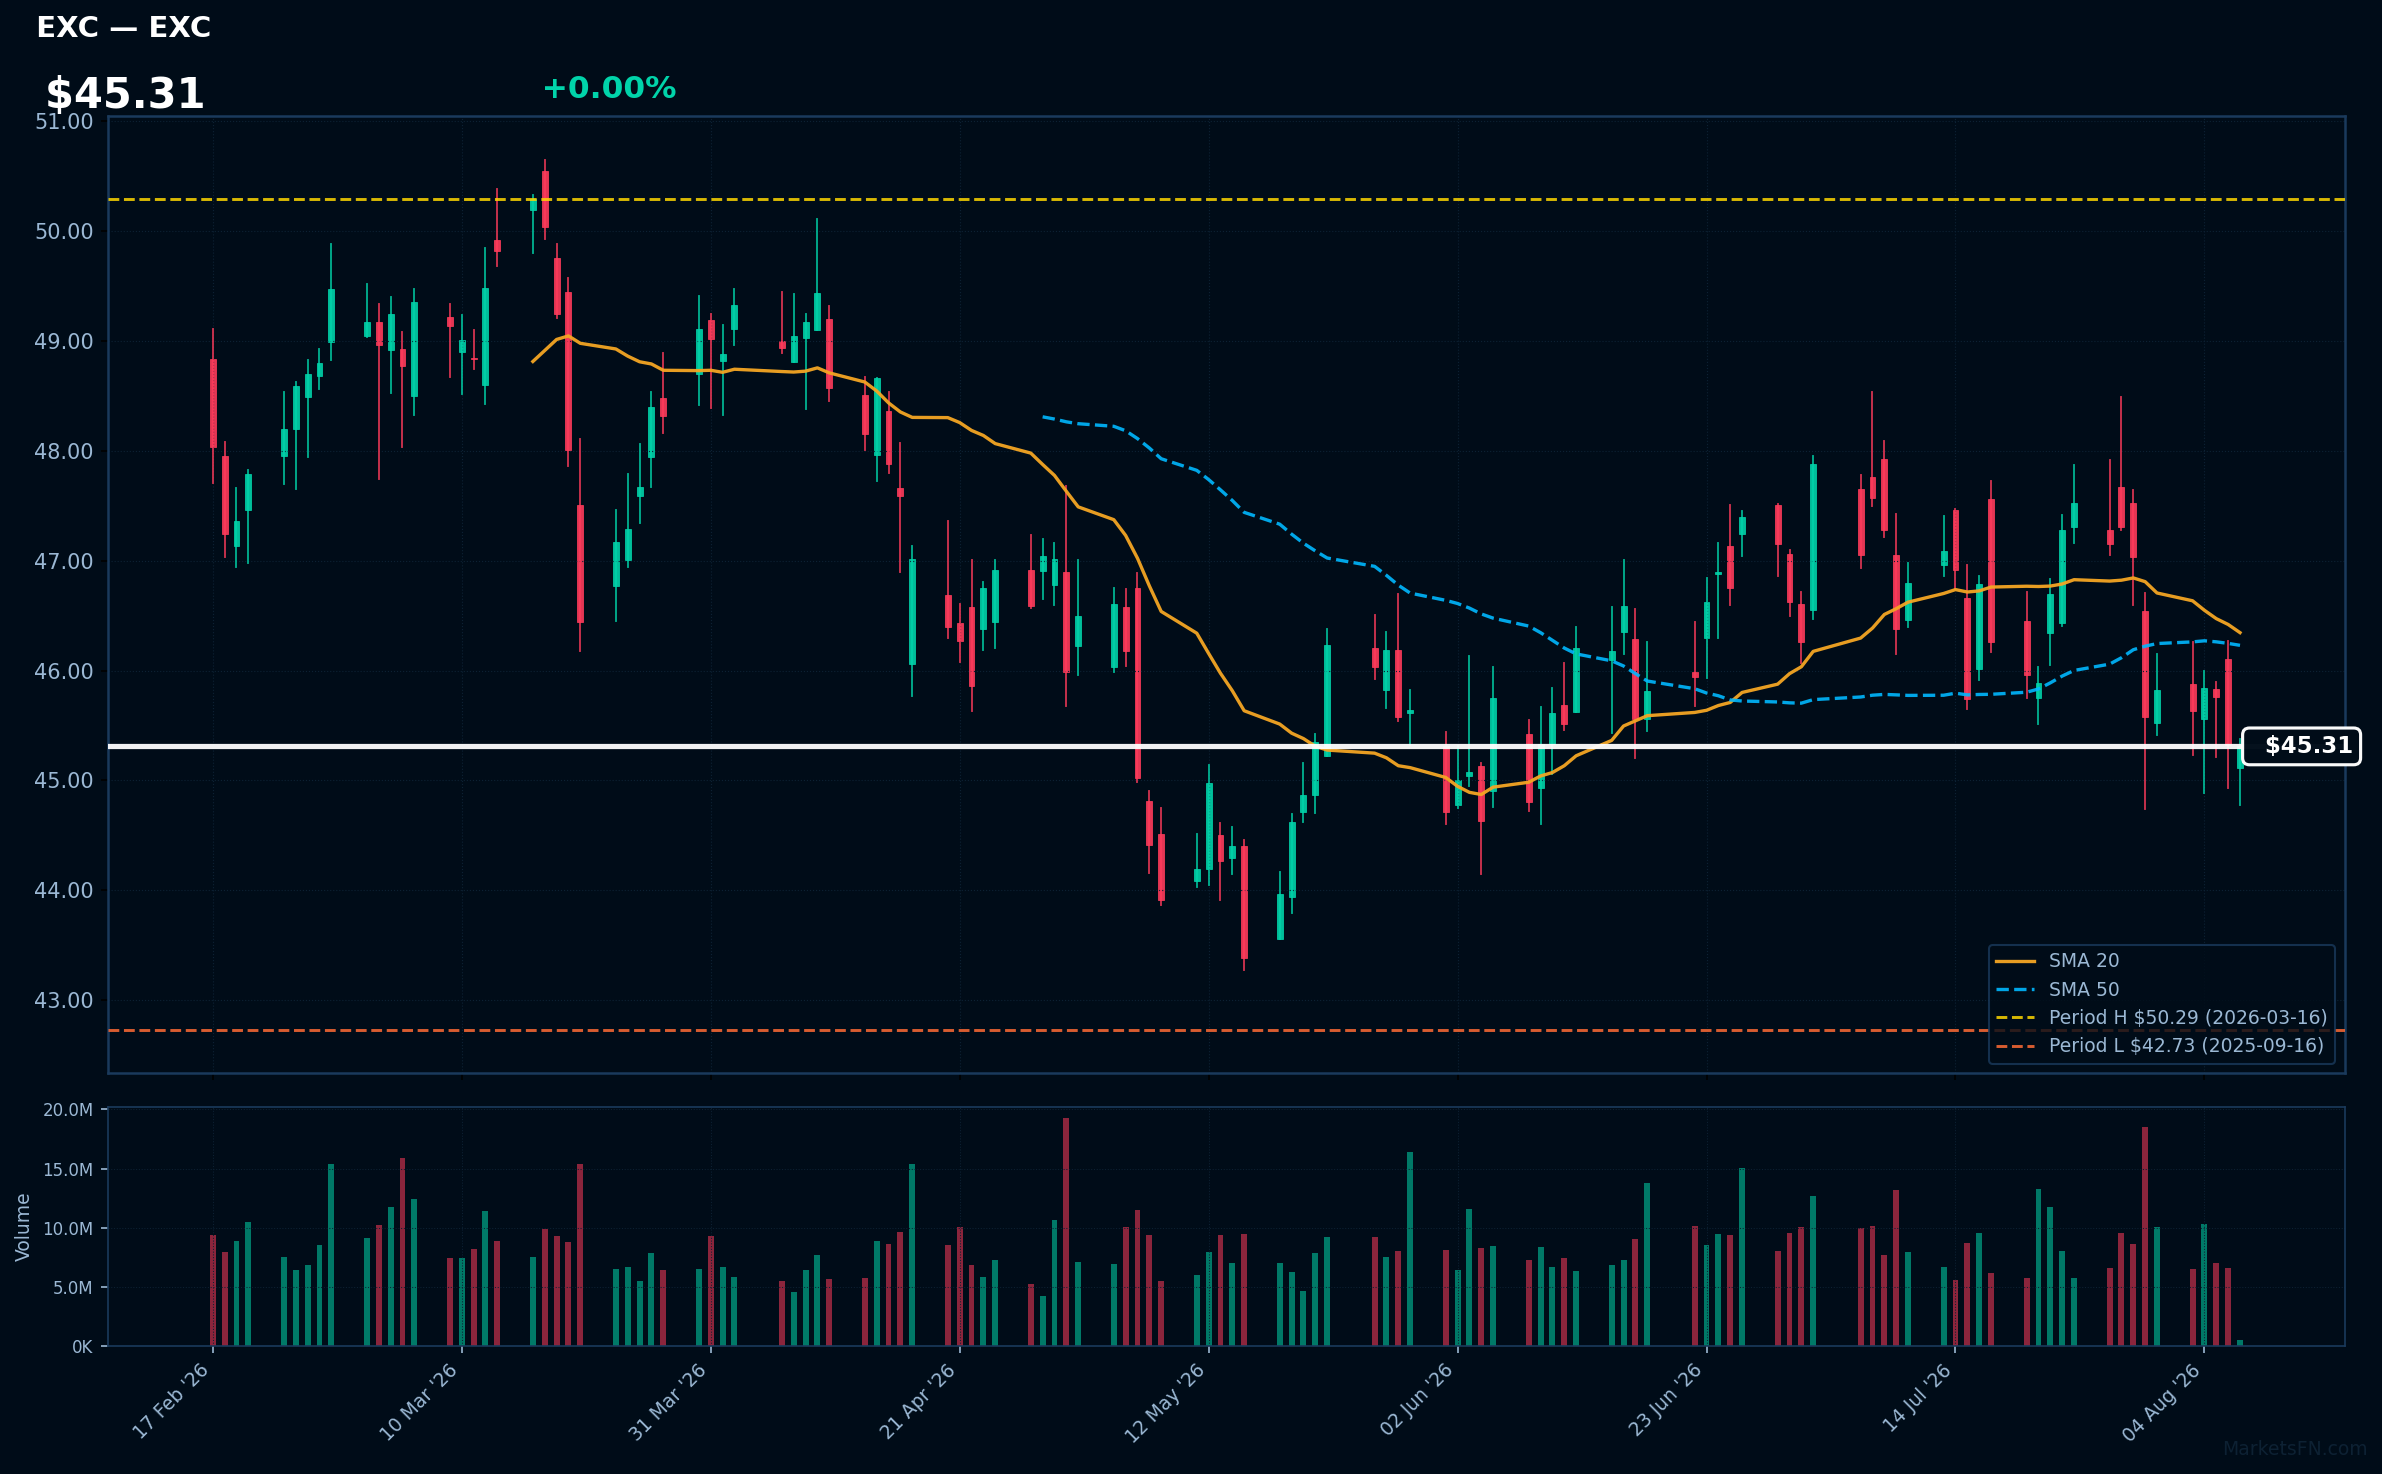
EXC | Exelon Corp | Utilities | Price Last: $45.34 | % Realized: -0.44% | RSI: 41.4 | % above MA200: -1.7% | Trend: Below MA20, MA50, MA200
Exelon Corp (EXC) is a leading energy provider, focusing on nuclear power generation and renewable energy solutions. Investors should care due to its significant role in the transition to cleaner energy and its potential for stable cash flows in a regulated market.
The current technical situation shows mixed signals, with an RSI(14) of 41.4 and the stock below MA20/MA50/MA200. Additionally, it is only 6.1% above its 52-Week low, indicating potential testing of major support.
Related headlines
- Exelon Secures More Than $1 Billion in Customer Protections Through Pioneering Transmission Security Agreements
- Exelon high probability data center load falls 40%
- Exelon Corp (EXC) (Q2 2026) Earnings Call Highlights: Navigating Regulatory Hurdles and Data ...
- Exelon Corporation Q2 2026 Earnings Call Summary
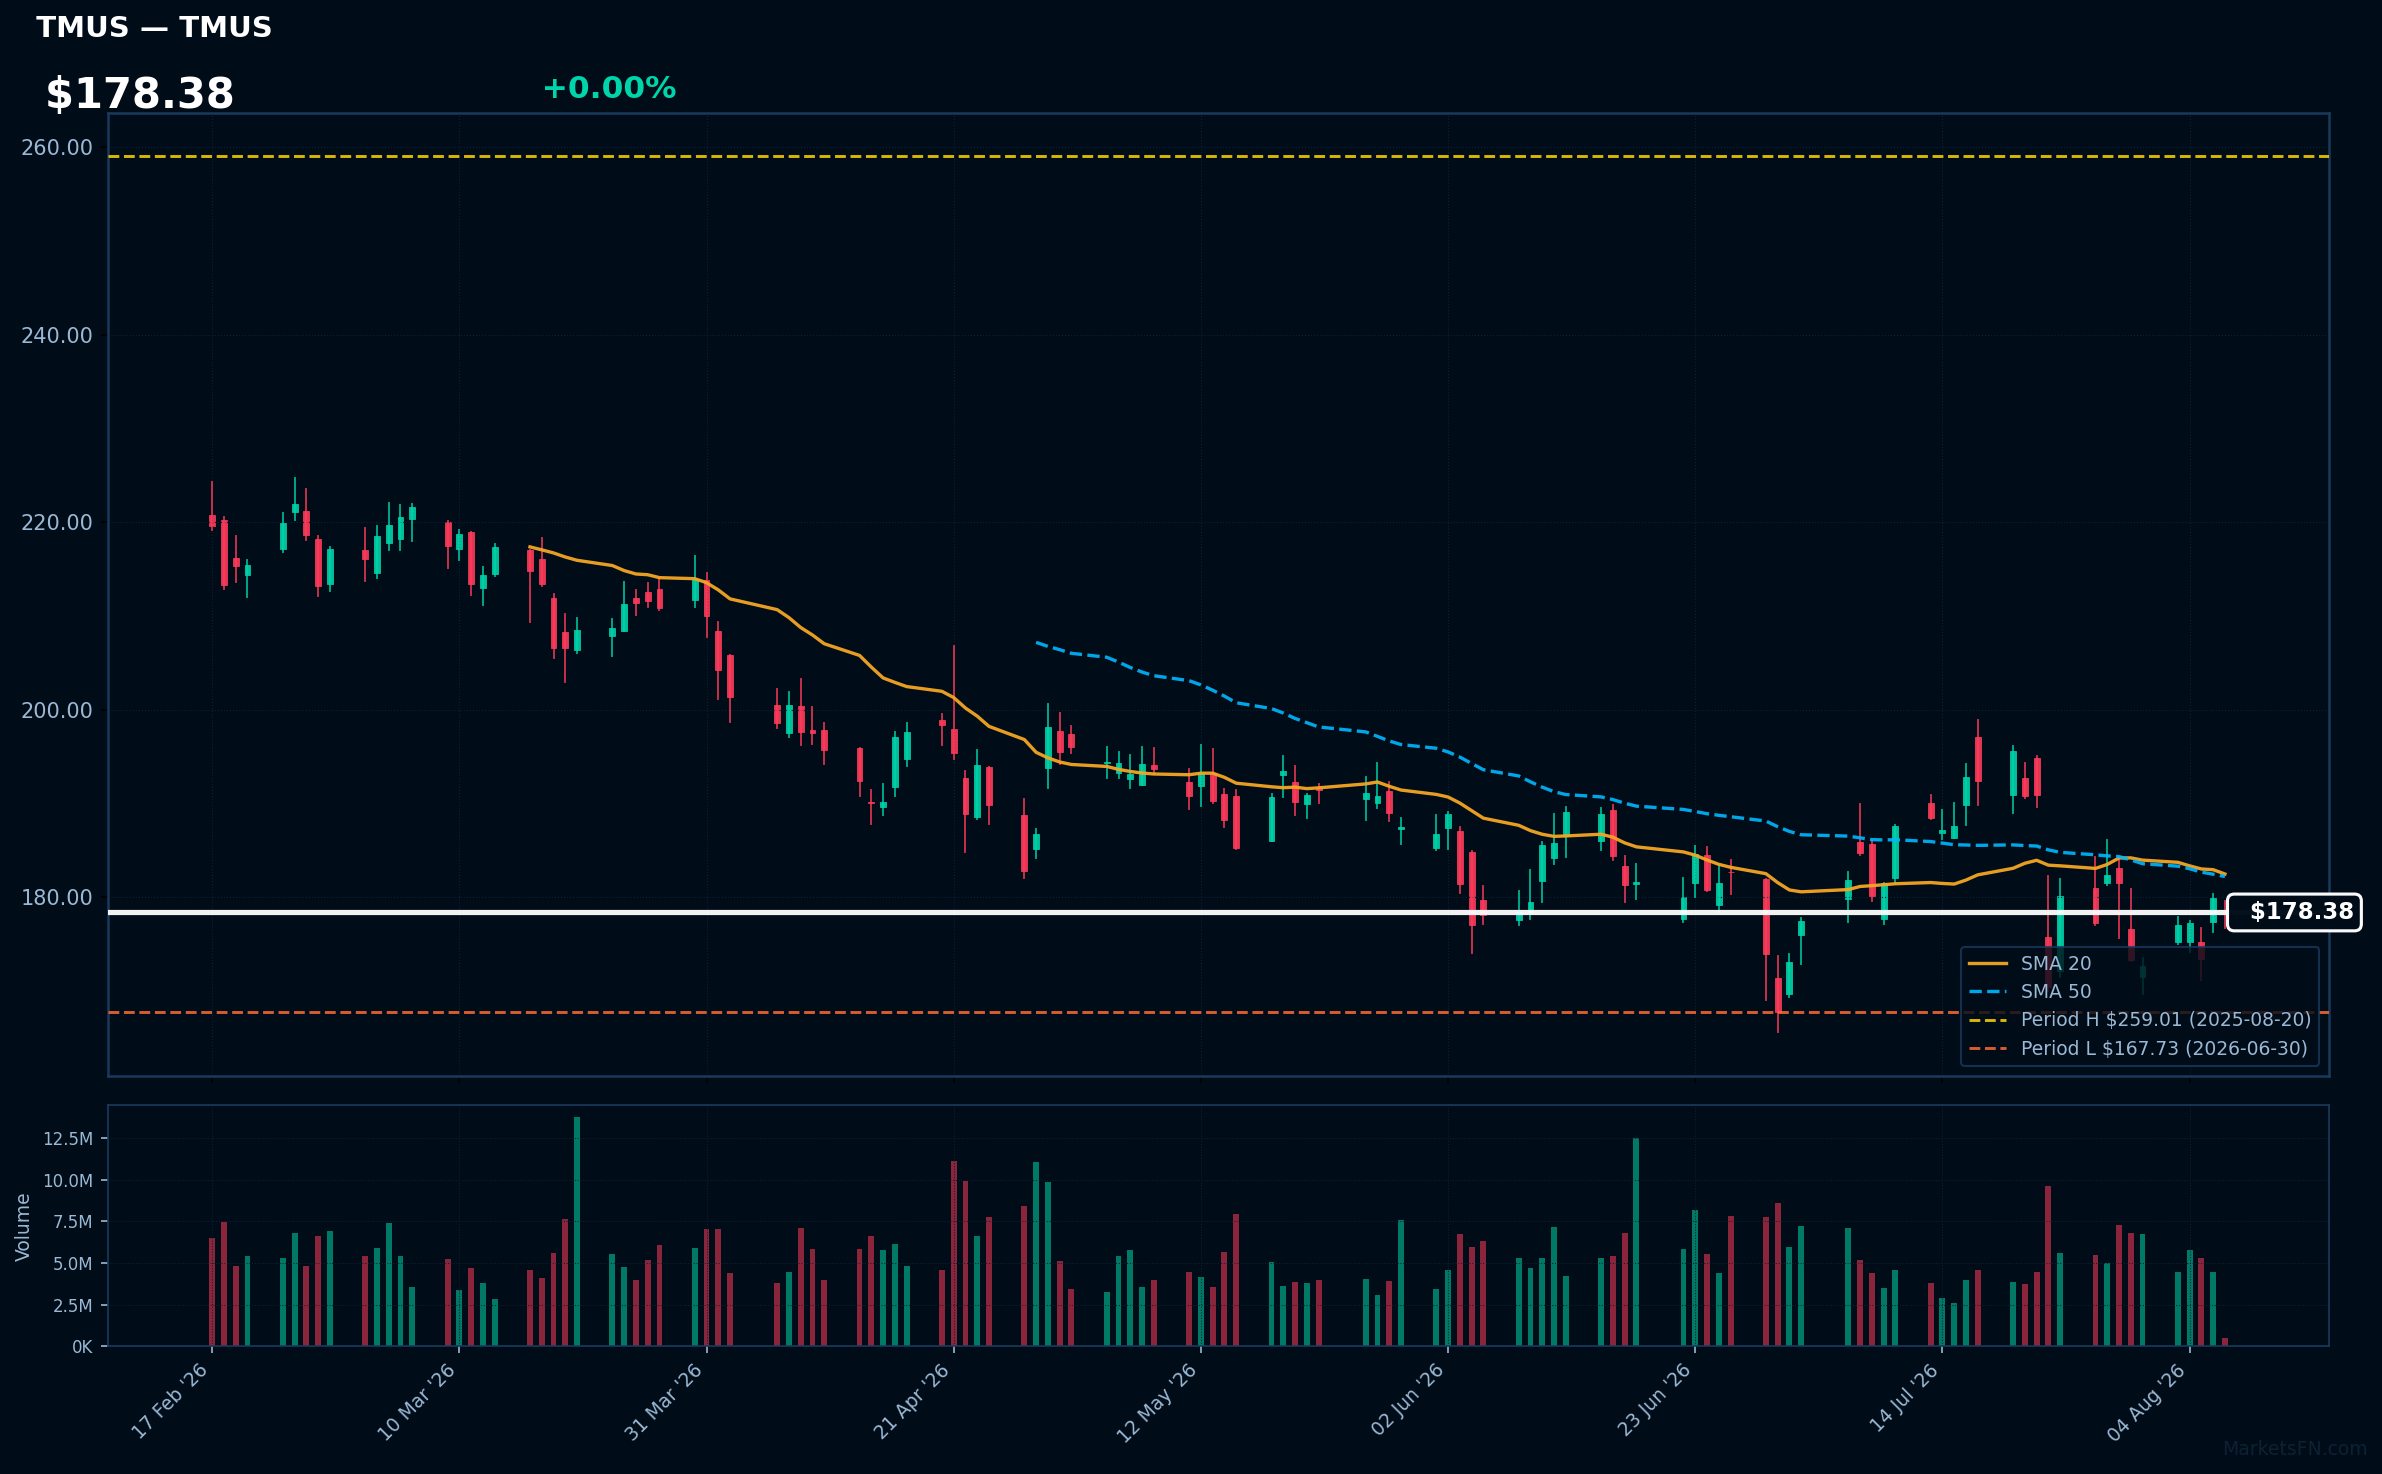
TMUS | T-Mobile US Inc | Communication Services | Price Last: $178.38 | % Realized: -26.57% | RSI: 47.6 | % above MA200: -9.8% | Trend: Below MA20, MA50, MA200
T-Mobile US Inc provides wireless voice, messaging, and data services across the United States. Investors should care due to its competitive positioning in the telecommunications sector and its focus on expanding 5G coverage, which is crucial for future growth and market share.
The current technical situation shows mixed signals with an RSI(14) of 47.6 and the stock below MA20/MA50/MA200. Additionally, it is only 6.3% above its 52-Week low, indicating potential testing of major support.
Related headlines
- Elon Musk Wants Starlink To Take On T-Mobile, Verizon, AT&THere's Why That's Easier Said Than Done
- T-Mobile CEO Says Starlink's Competitive Threat to Mobile Networks Is Overstated
- T-Mobile's Friday Night 5G Lights Returns Bigger Than Ever with Over $8 Million in Prizes
- Why AT&T, Verizon and T-Mobile shares are down after SpaceX's earnings
Market Commentary
The proximity of several Nasdaq 100 tech stocks to their 52-week extremes signals a critical juncture for the sector. Stocks such as Palo Alto Networks Inc (PANW), Crowdstrike Holdings Inc (CRWD), and Airbnb Inc (ABNB) are at their 52-week highs, indicating strong investor confidence and bullish sentiment. Conversely, Trade Desk Inc (TTD) and Applovin Corp (APP) are near their lows, suggesting potential challenges or market corrections that could impact investor sentiment negatively.
Current macro themes influencing these price levels include ongoing advancements in cybersecurity, cloud computing, and digital entertainment, which are driving demand for companies like PANW and CRWD. Additionally, broader economic factors such as interest rate fluctuations and inflation concerns may be contributing to the volatility observed in stocks near their lows, like TTD and APP, as investors reassess growth prospects in a changing economic landscape.
Key levels to watch include the 52-week highs for the leading stocks, which could serve as resistance points, while the lows for TTD and APP may act as support levels. Potential catalysts for a breakout could include strong earnings reports or favorable regulatory developments, while a breakdown could be triggered by disappointing economic data or shifts in monetary policy that affect tech valuations.
Methodology: All 101 Nasdaq 100 constituents screened. 52-week high = highest daily close over the past 252 trading days (approx. 1 year). 52-week low = lowest daily close over the same period. Distance = (current price / extreme − 1) × 100. Technical indicators computed on up to 1 year of daily OHLCV data.
Disclaimer: For informational purposes only. Not investment advice. Past performance is not indicative of future results.

