Nasdaq 100 Bull & Bear Radar — June 18, 2026
· Stocks · QuoteReporter
Nasdaq 100 Bull & Bear Radar — June 18, 2026
A daily technical sweep of 101 Nasdaq 100 constituents ranked by session performance, enriched with RSI, MA20/MA50/MA200 trend signals, Bloomberg-style charts, and recent news.
Index-Wide Breadth
| Constituents tracked | 101 |
| Advancing | 60 (59.4%) |
| Declining | 41 (40.6%) |
| Average daily change | +0.87% |
| Above MA200 | 13 (12.9%) |
Top 10 Gainers
Today's strongest Nasdaq 100 performers. Sector leadership: Technology (10).
| Ticker | Company | Sector | Price | Day % | 1W % | 1M % | RSI | vs MA200 | Trend |
|---|---|---|---|---|---|---|---|---|---|
| MRVL | Marvell Technology Inc | Technology | $315.76 | +9.05% | +12.45% | +79.08% | 65.3 | +179.2% | Above MA20, MA50, MA200 |
| KLAC | KLA Corp | Technology | $256.48 | +7.44% | +6.33% | +47.33% | 69.4 | +77.6% | Above MA20, MA50, MA200 |
| INTC | Intel Corp | Technology | $129.84 | +7.21% | +11.05% | +17.22% | 62.3 | +134.0% | Above MA20, MA50, MA200 |
| MU | Micron Technology Inc | Technology | $1114.93 | +6.88% | +12.00% | +59.62% | 65.5 | +178.3% | Above MA20, MA50, MA200 |
| AMAT | Applied Materials Inc | Technology | $633.65 | +6.87% | +14.73% | +55.82% | 77.6 | +99.3% | Above MA20, MA50, MA200 |
| ON | ON Semiconductor Corp | Technology | $120.05 | +6.31% | +3.53% | +13.23% | 53.7 | +75.3% | Above MA50, MA200 · Below MA20 |
| LRCX | Lam Research Corp | Technology | $397.38 | +6.20% | +9.62% | +45.37% | 70.1 | +89.1% | Above MA20, MA50, MA200 |
| MCHP | Microchip Technology, Inc | Technology | $99.36 | +5.58% | +6.90% | +8.21% | 57.5 | +37.0% | Above MA20, MA50, MA200 |
| NXPI | NXP Semiconductors NV | Technology | $313.90 | +5.27% | +3.75% | +6.67% | 55.7 | +34.3% | Above MA20, MA50, MA200 |
| TXN | Texas Instruments Inc | Technology | $316.87 | +4.97% | +6.65% | +4.82% | 59.9 | +50.7% | Above MA20, MA50, MA200 |
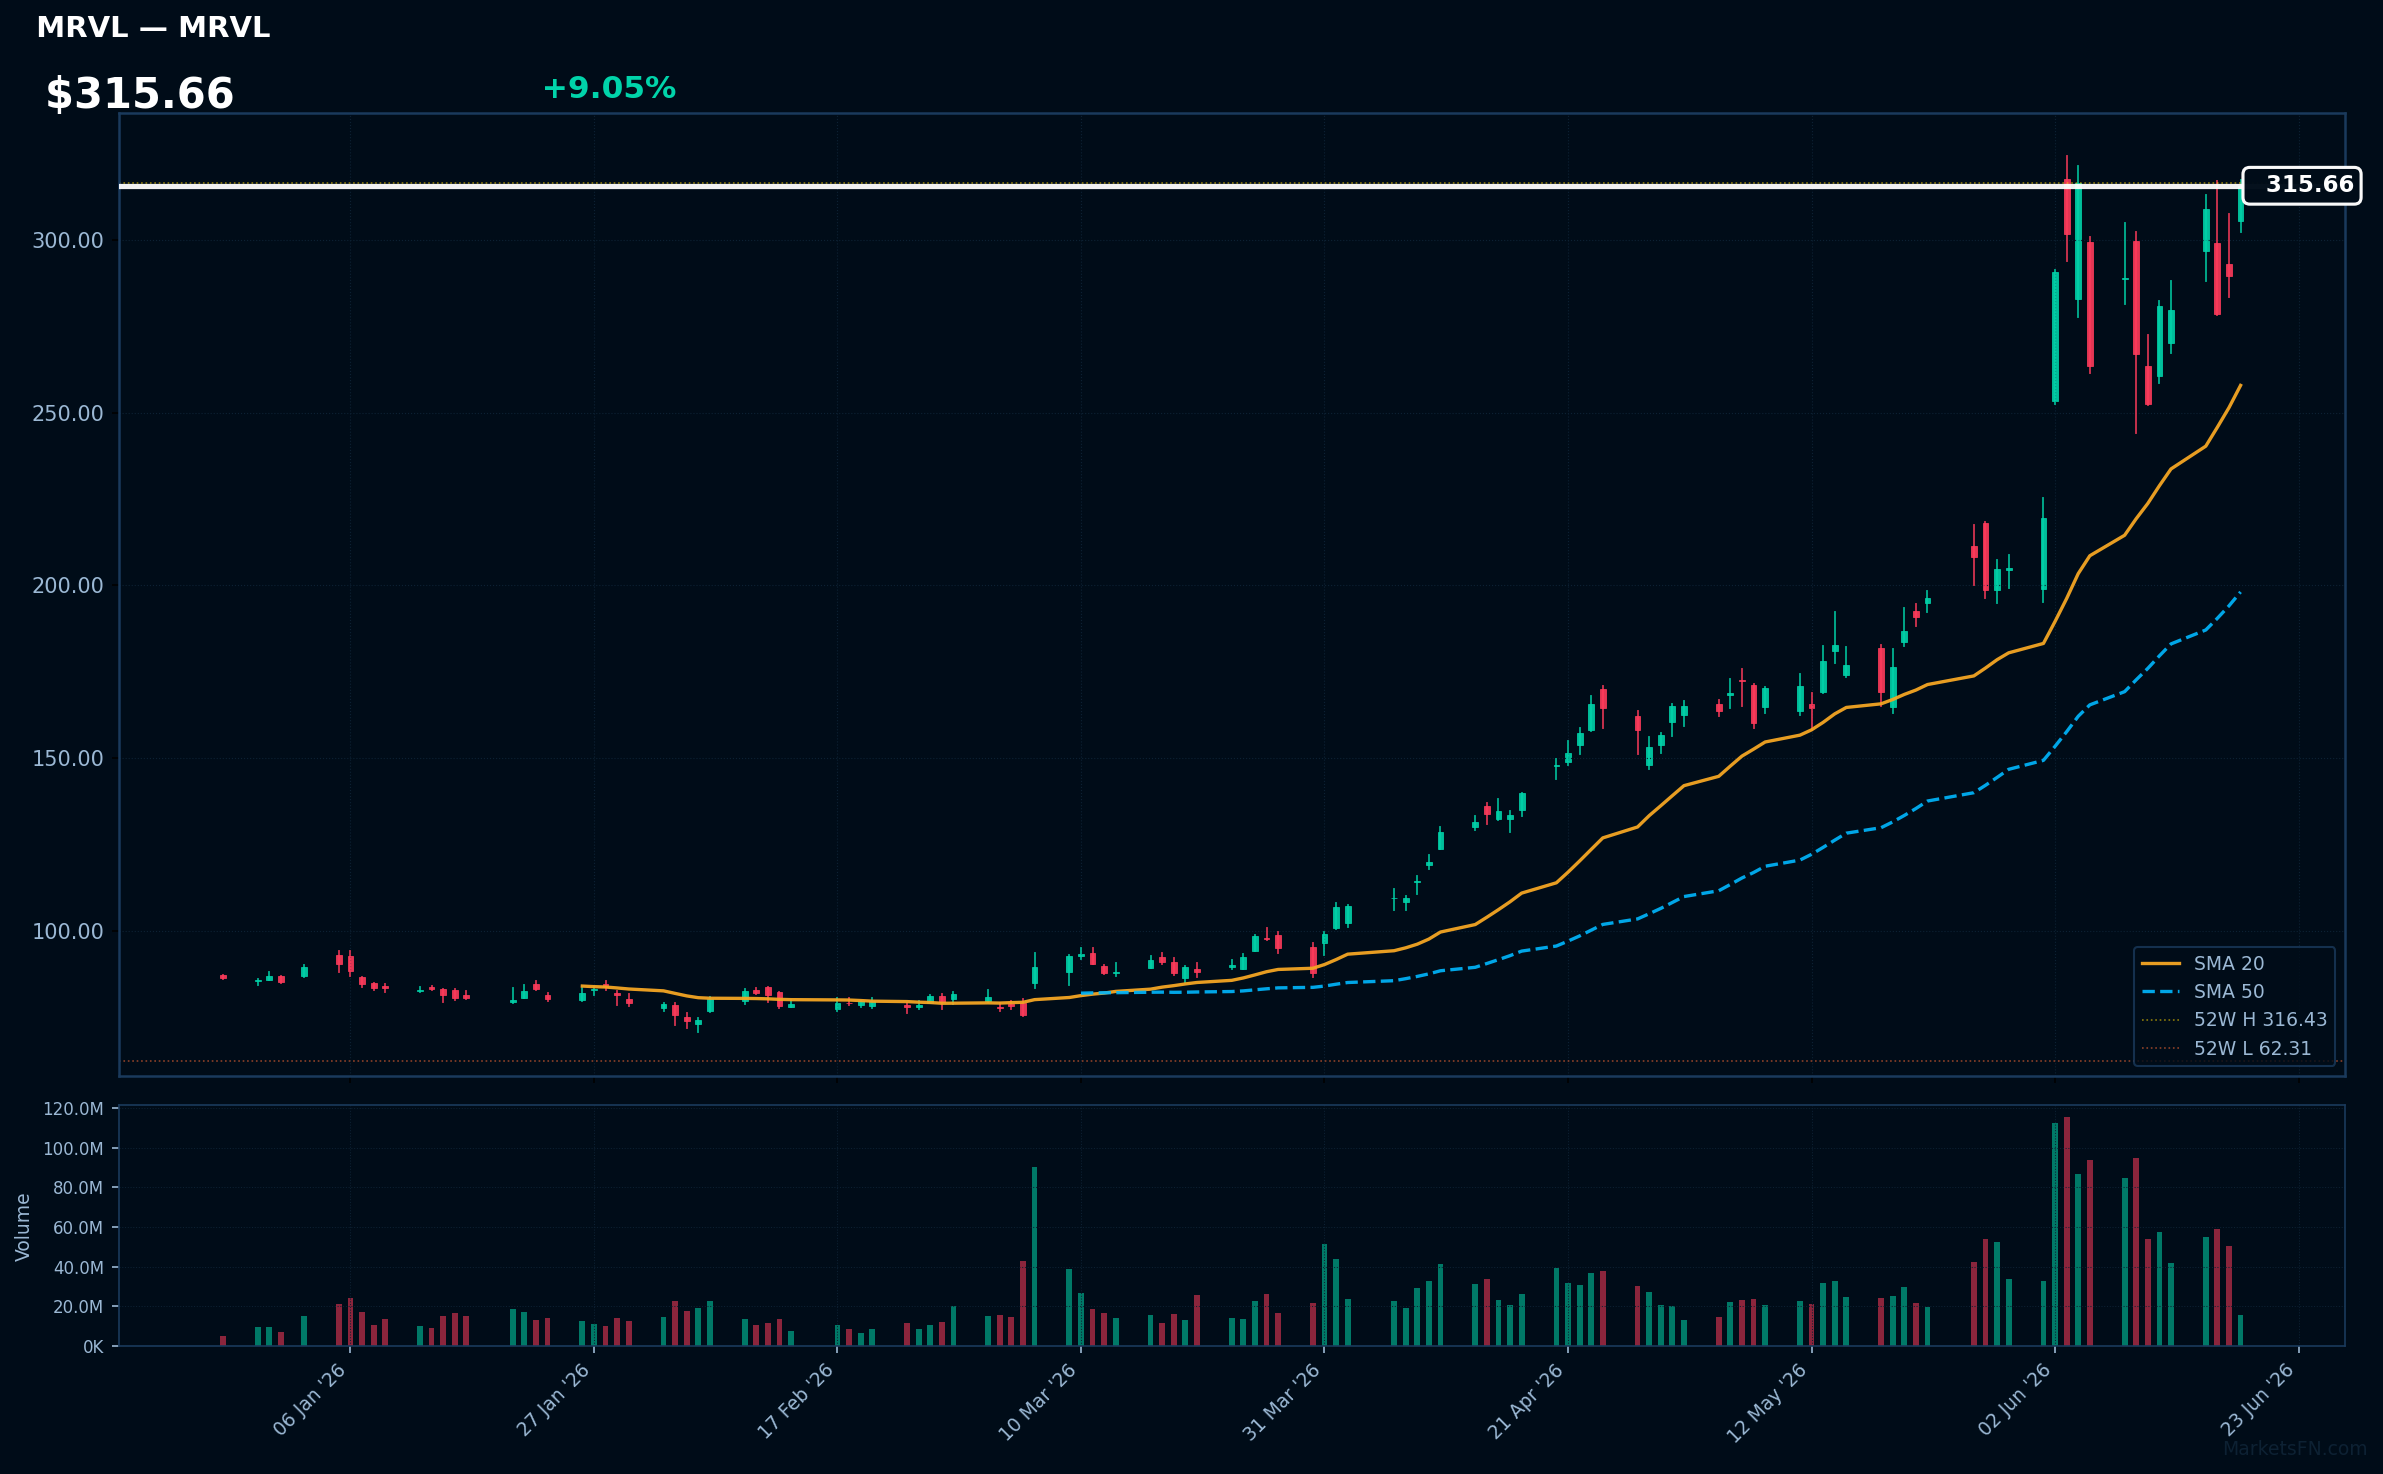
MRVL | Marvell Technology Inc | Technology | Price: $315.76 | Day: +9.05% | 1W: +12.45% | 1M: +79.08% | RSI: 65.3 | vs MA200: +179.2% | Trend: Above MA20, MA50, MA200
Recent headlines (last 12h)
- Stocks to Watch: Intel, Micron, SpaceX
- Architect Labs raises $24 million to take on Broadcom, Marvell custom chip business
- Wall St set to rise as Iran deal optimism offsets hawkish Fed; Intel up
- Marvell Stock Seen Rising 48% From Current Levels on Growth in Optical-Networking
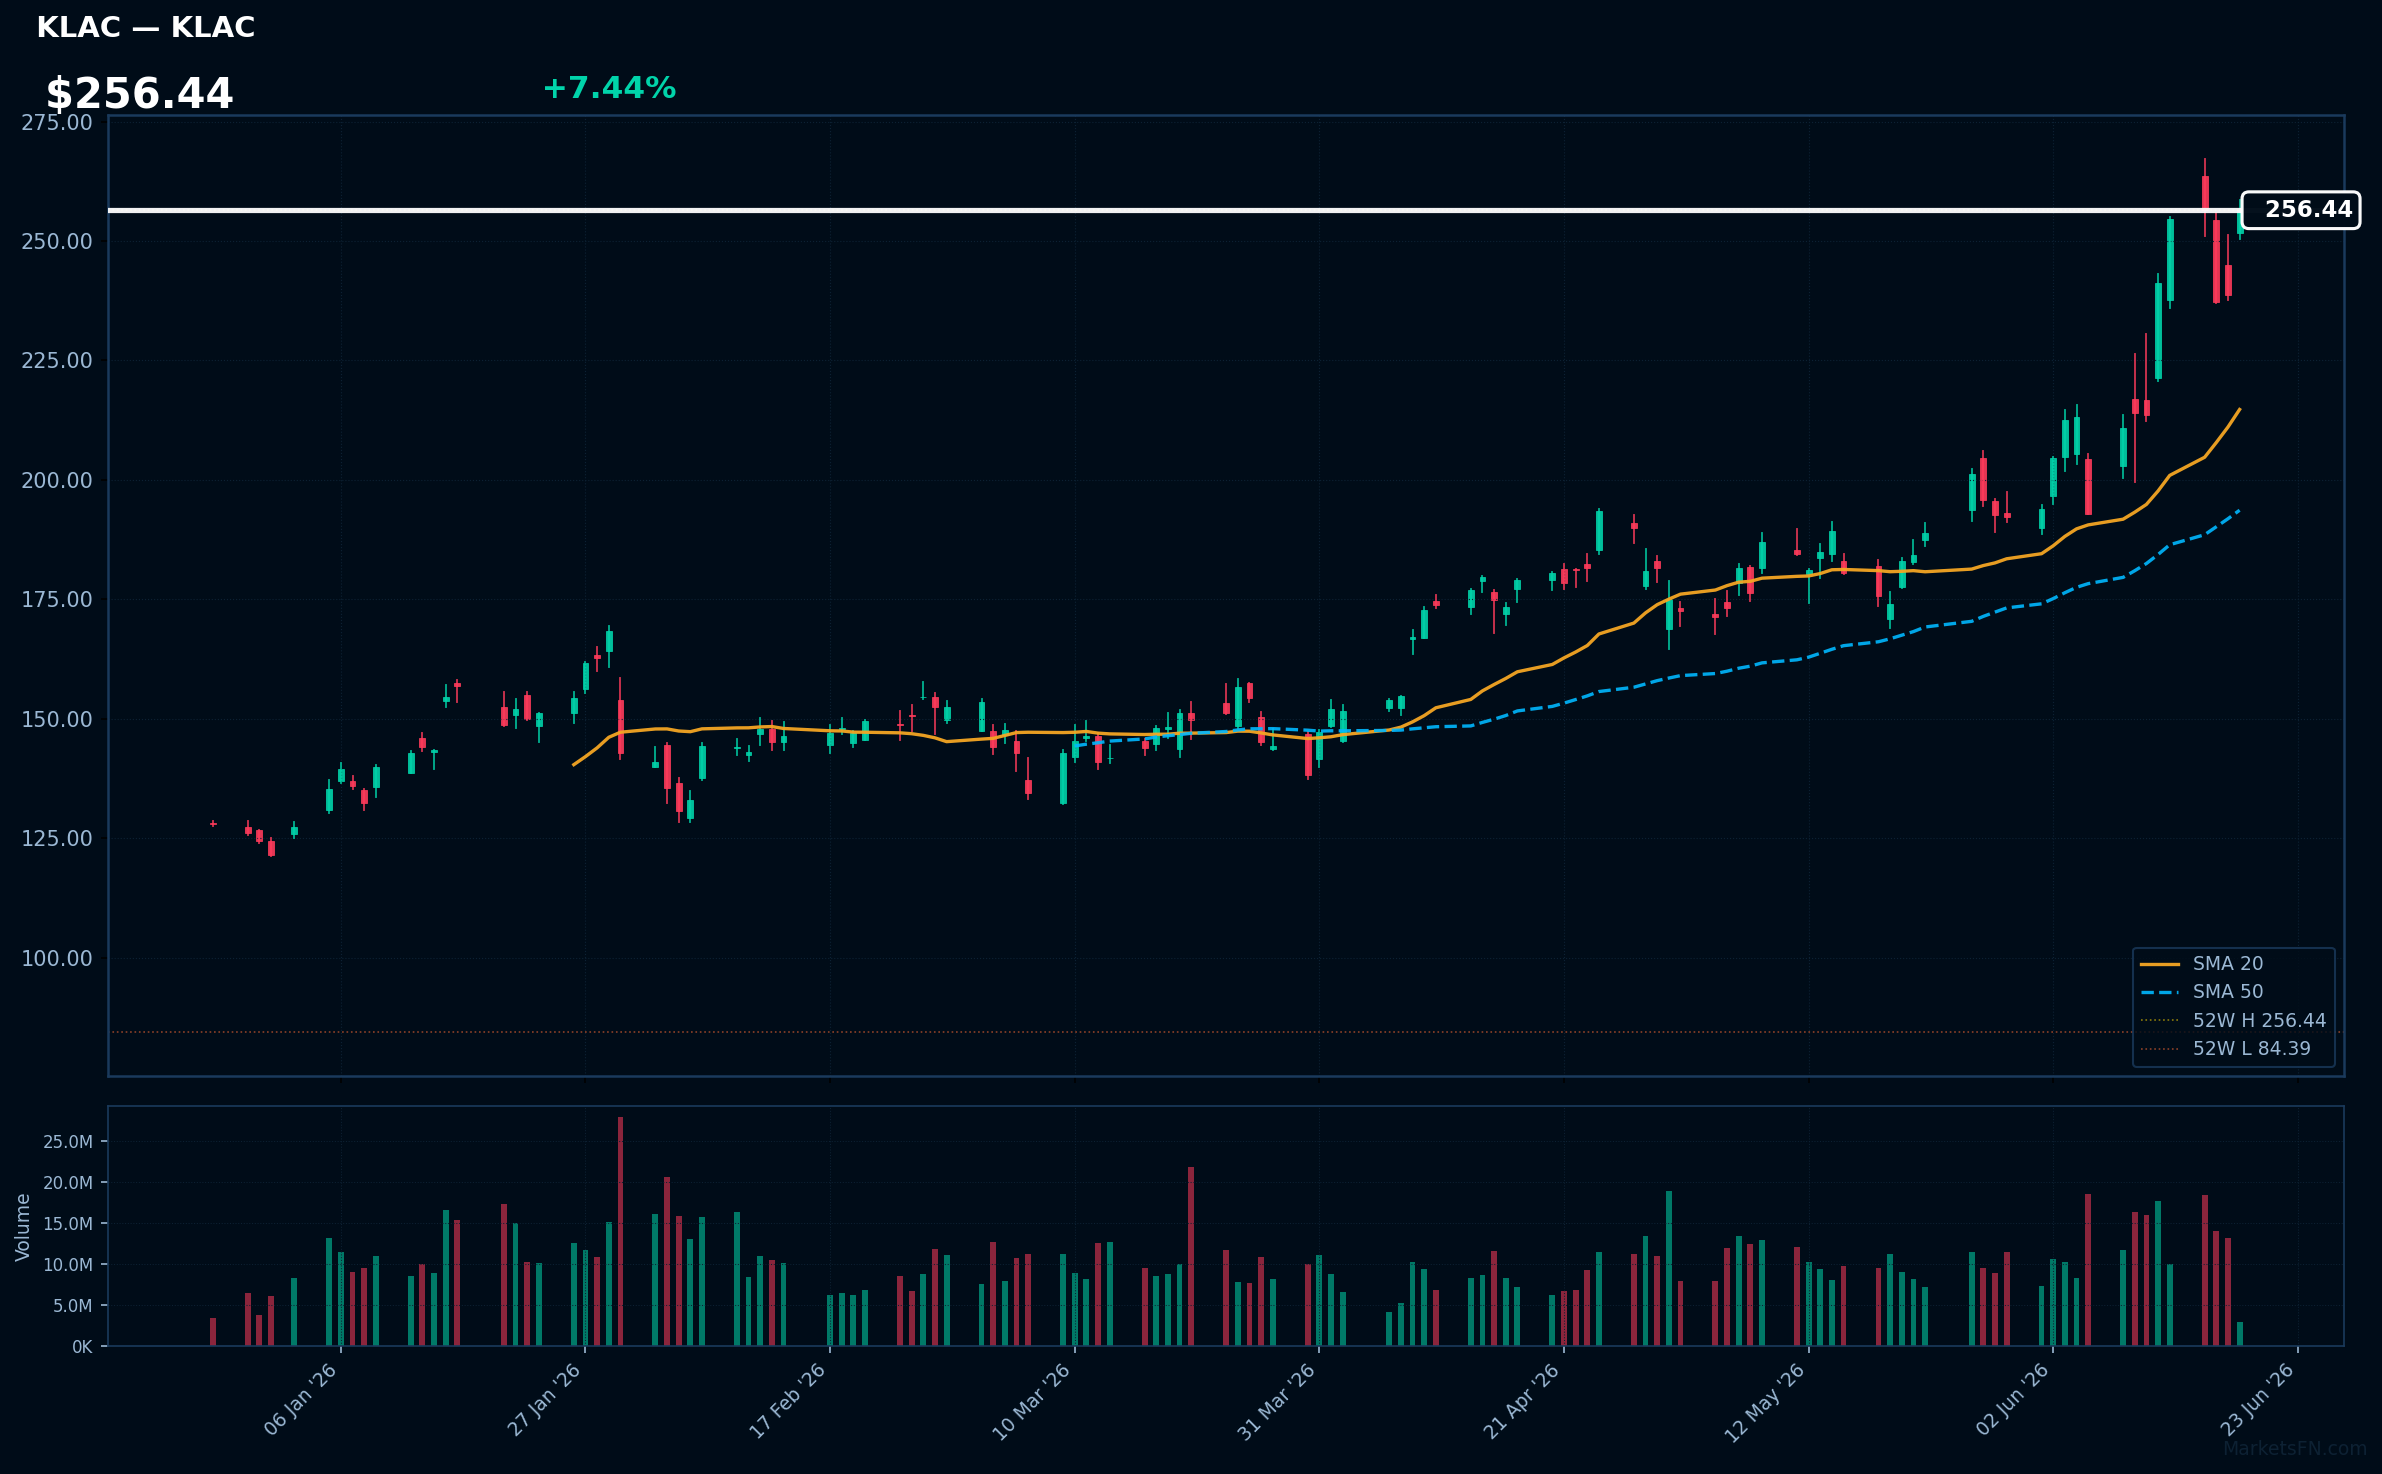
KLAC | KLA Corp | Technology | Price: $256.48 | Day: +7.44% | 1W: +6.33% | 1M: +47.33% | RSI: 69.4 | vs MA200: +77.6% | Trend: Above MA20, MA50, MA200
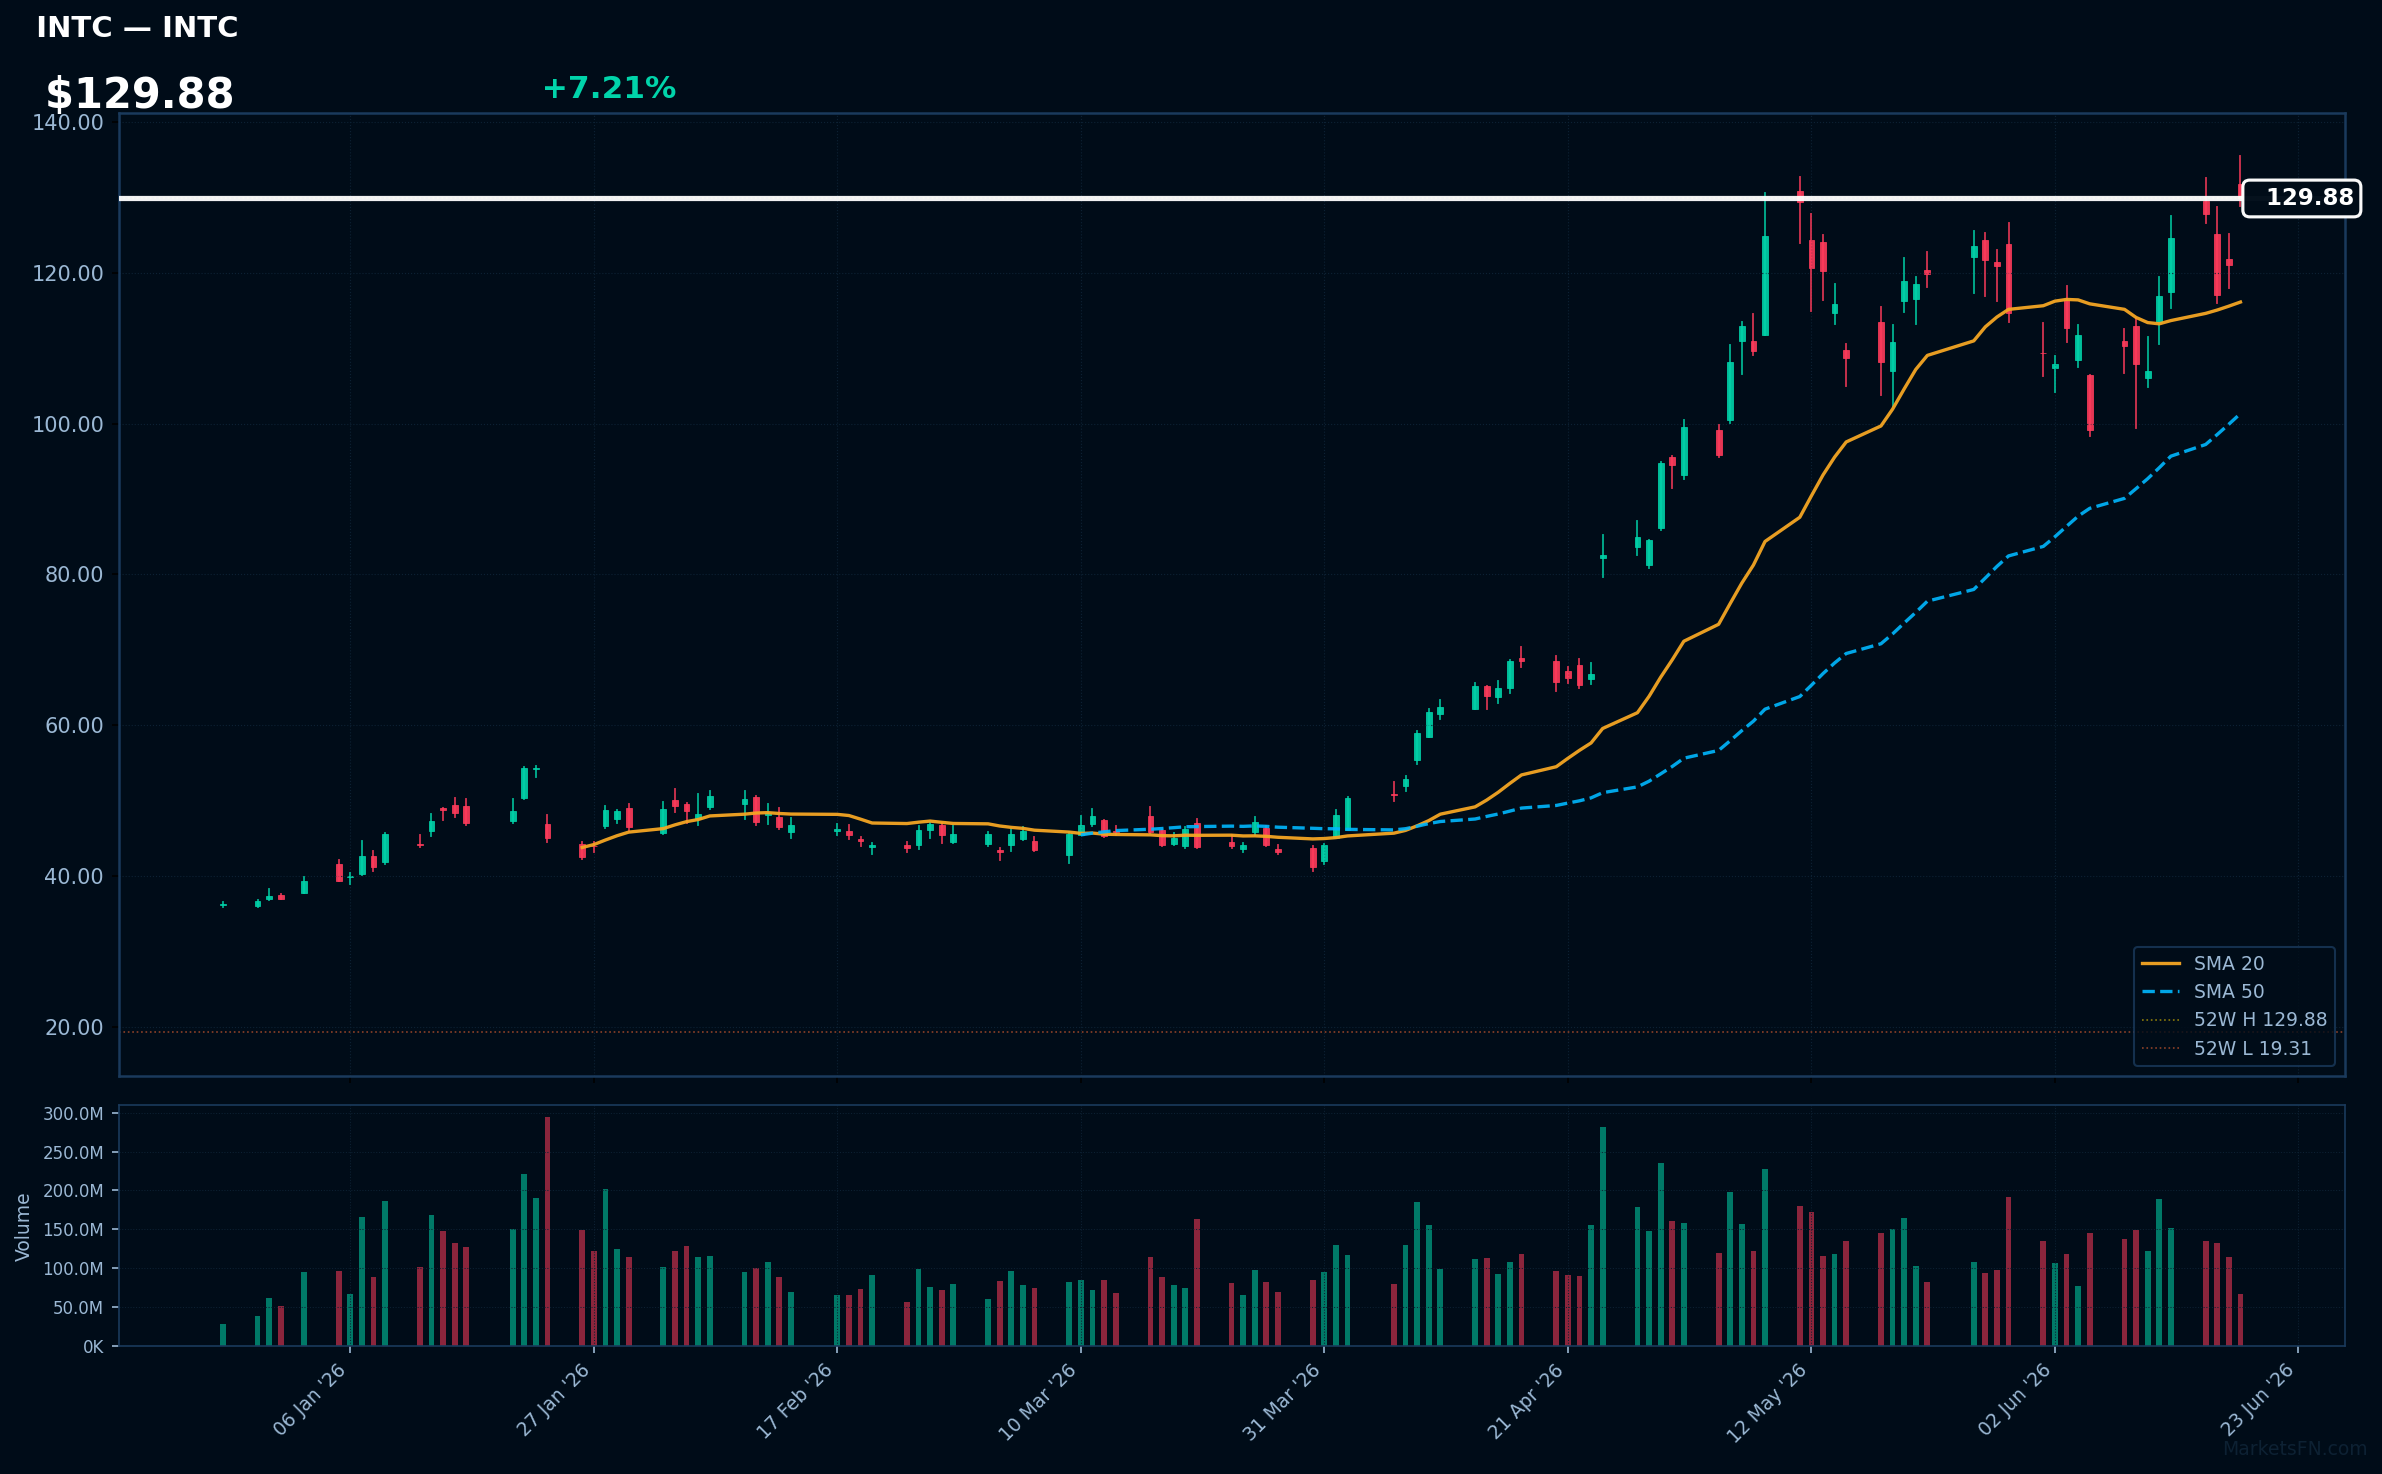
INTC | Intel Corp | Technology | Price: $129.84 | Day: +7.21% | 1W: +11.05% | 1M: +17.22% | RSI: 62.3 | vs MA200: +134.0% | Trend: Above MA20, MA50, MA200
Recent headlines (last 12h)
- Trump says Apple to work with Intel to manufacture chips in US
- Trump says Apple to partner with Intel on US chip design, production
- Wall St advances as Iran deal optimism offsets hawkish Fed; Intel soars
- Stocks to Watch: Intel, Micron, SpaceX
MU | Micron Technology Inc | Technology | Price: $1114.93 | Day: +6.88% | 1W: +12.00% | 1M: +59.62% | RSI: 65.5 | vs MA200: +178.3% | Trend: Above MA20, MA50, MA200
Recent headlines (last 12h)
- Wall St advances as Iran deal optimism offsets hawkish Fed; Intel soars
- Stocks to Watch: Intel, Micron, SpaceX
- Wall Street scrambles to lift Micron price targets ahead of earnings
- Stifel's $1,500 Target Bets Micron Has Further to Run
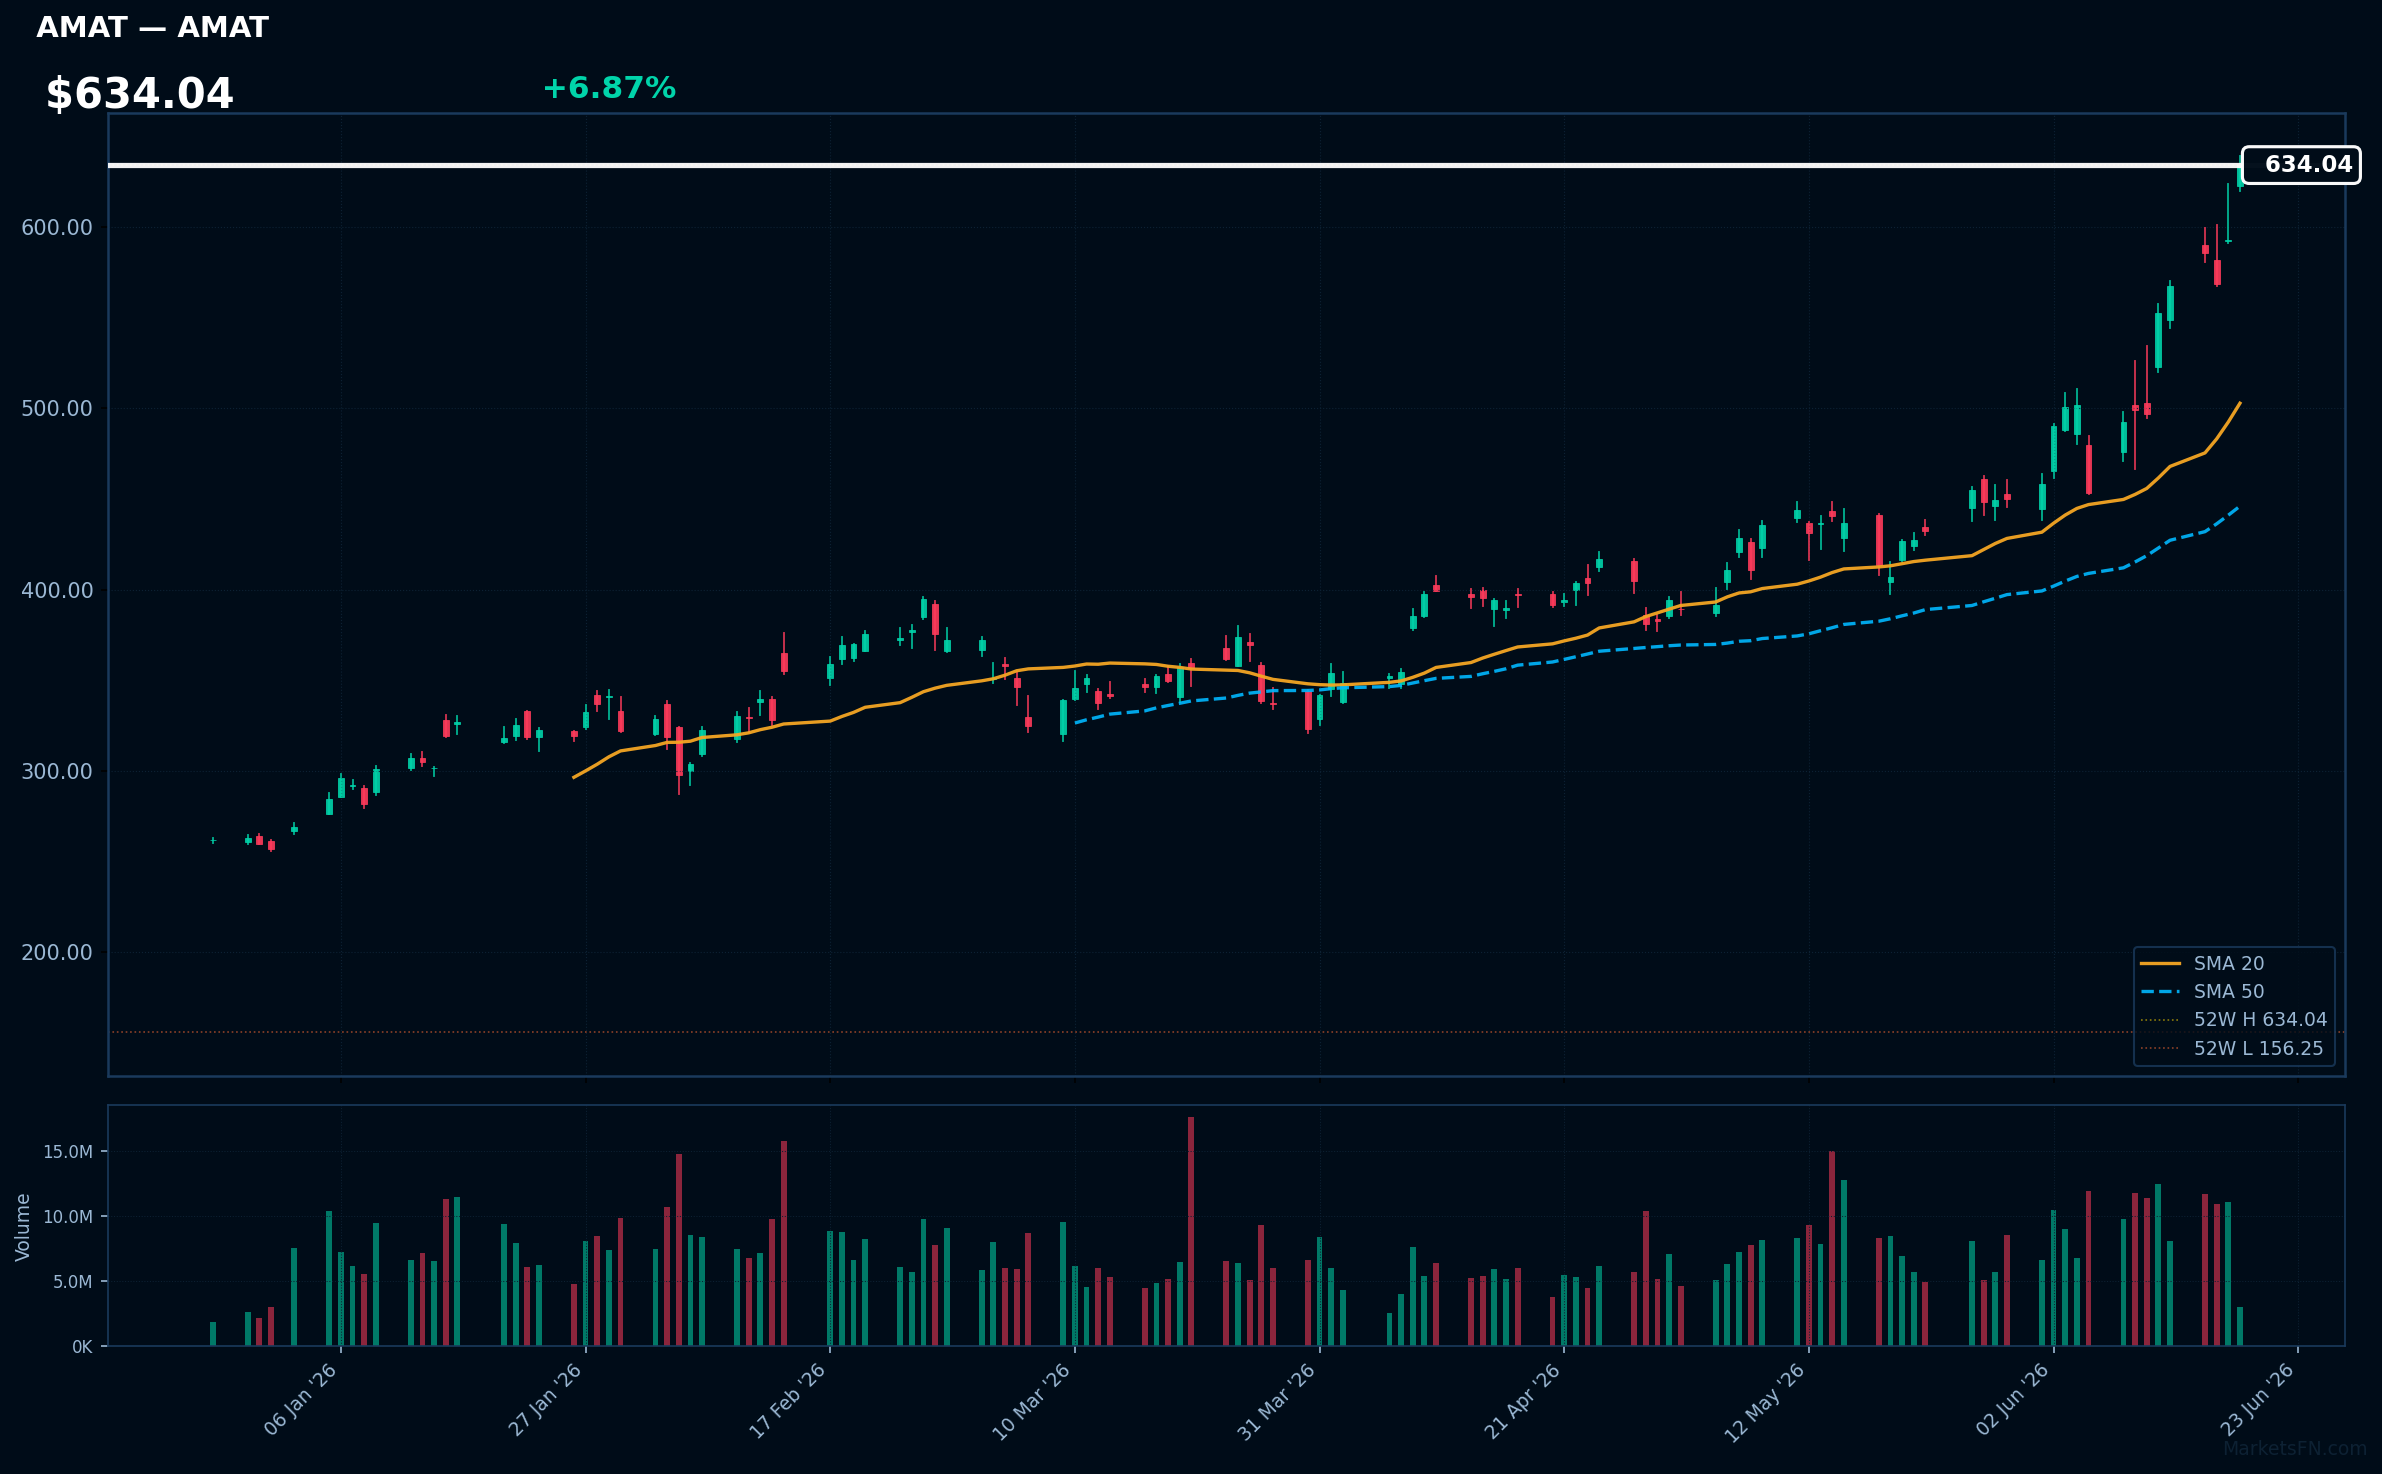
AMAT | Applied Materials Inc | Technology | Price: $633.65 | Day: +6.87% | 1W: +14.73% | 1M: +55.82% | RSI: 77.6 | vs MA200: +99.3% | Trend: Above MA20, MA50, MA200
Recent headlines (last 12h)
- Nasdaq rebounds as Iran deal signed, SpaceX falls again
- US chip stocks gain after Apple-Intel partnership
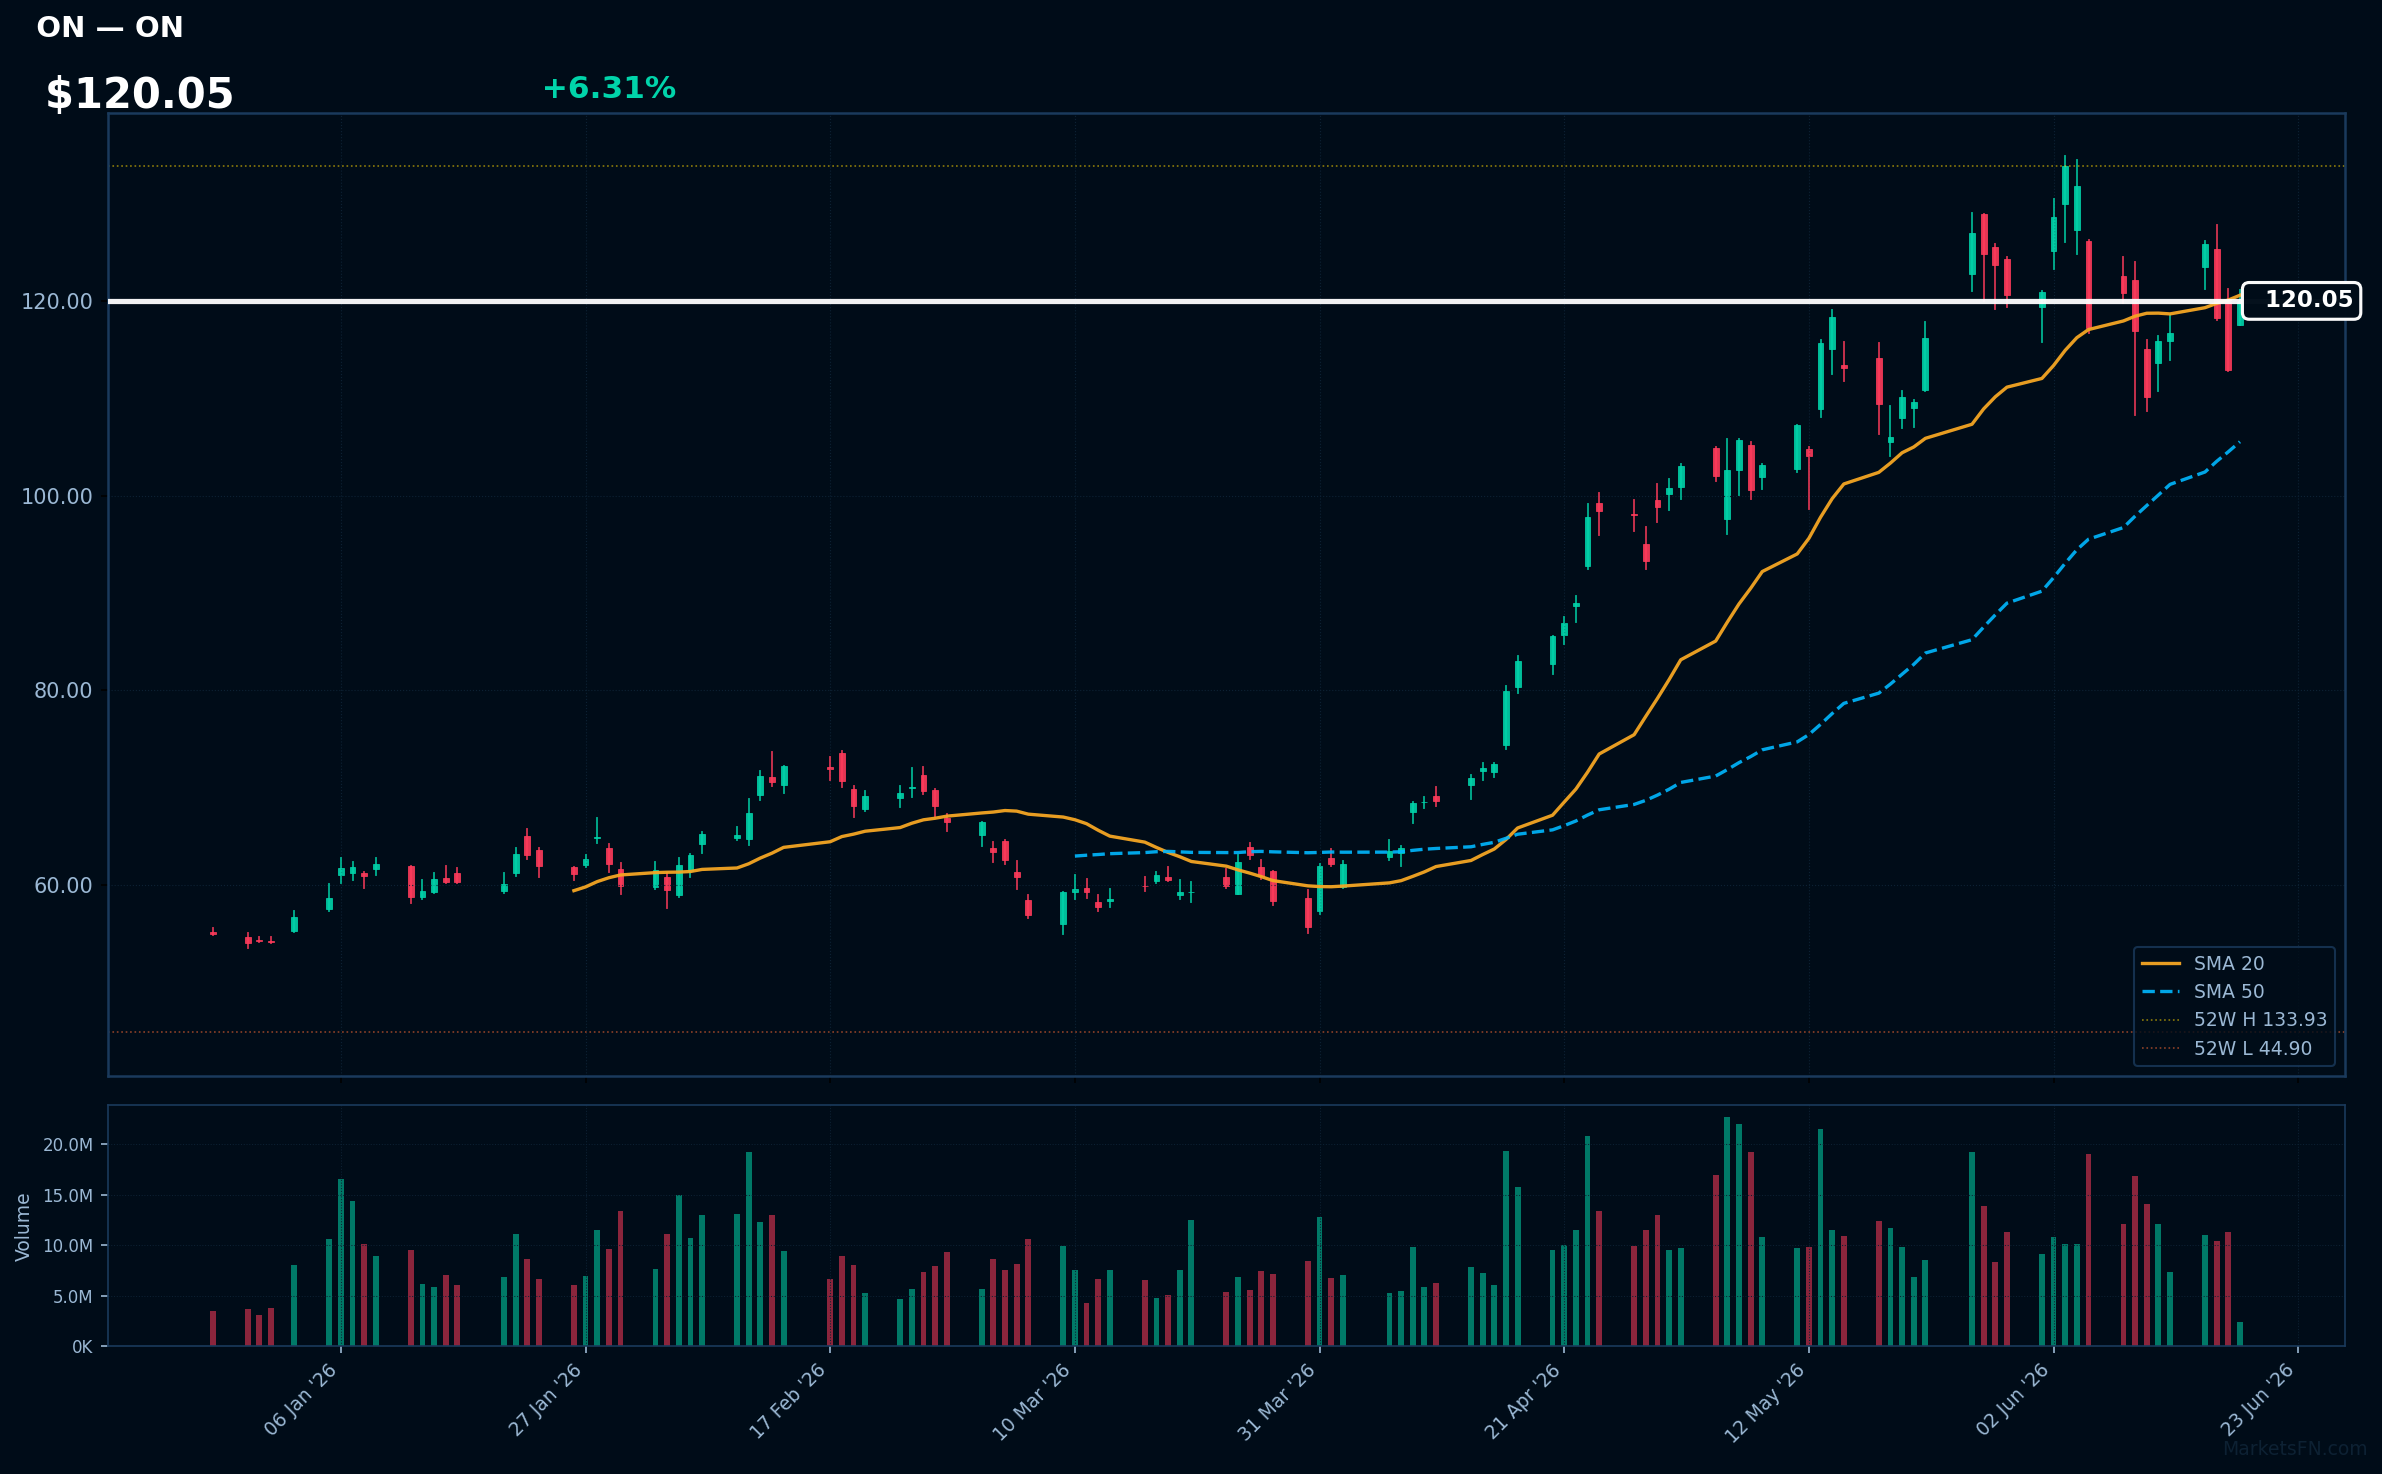
ON | ON Semiconductor Corp | Technology | Price: $120.05 | Day: +6.31% | 1W: +3.53% | 1M: +13.23% | RSI: 53.7 | vs MA200: +75.3% | Trend: Above MA50, MA200 · Below MA20
Recent headlines (last 12h)
- Nasdaq rebounds as Iran deal signed, SpaceX falls again
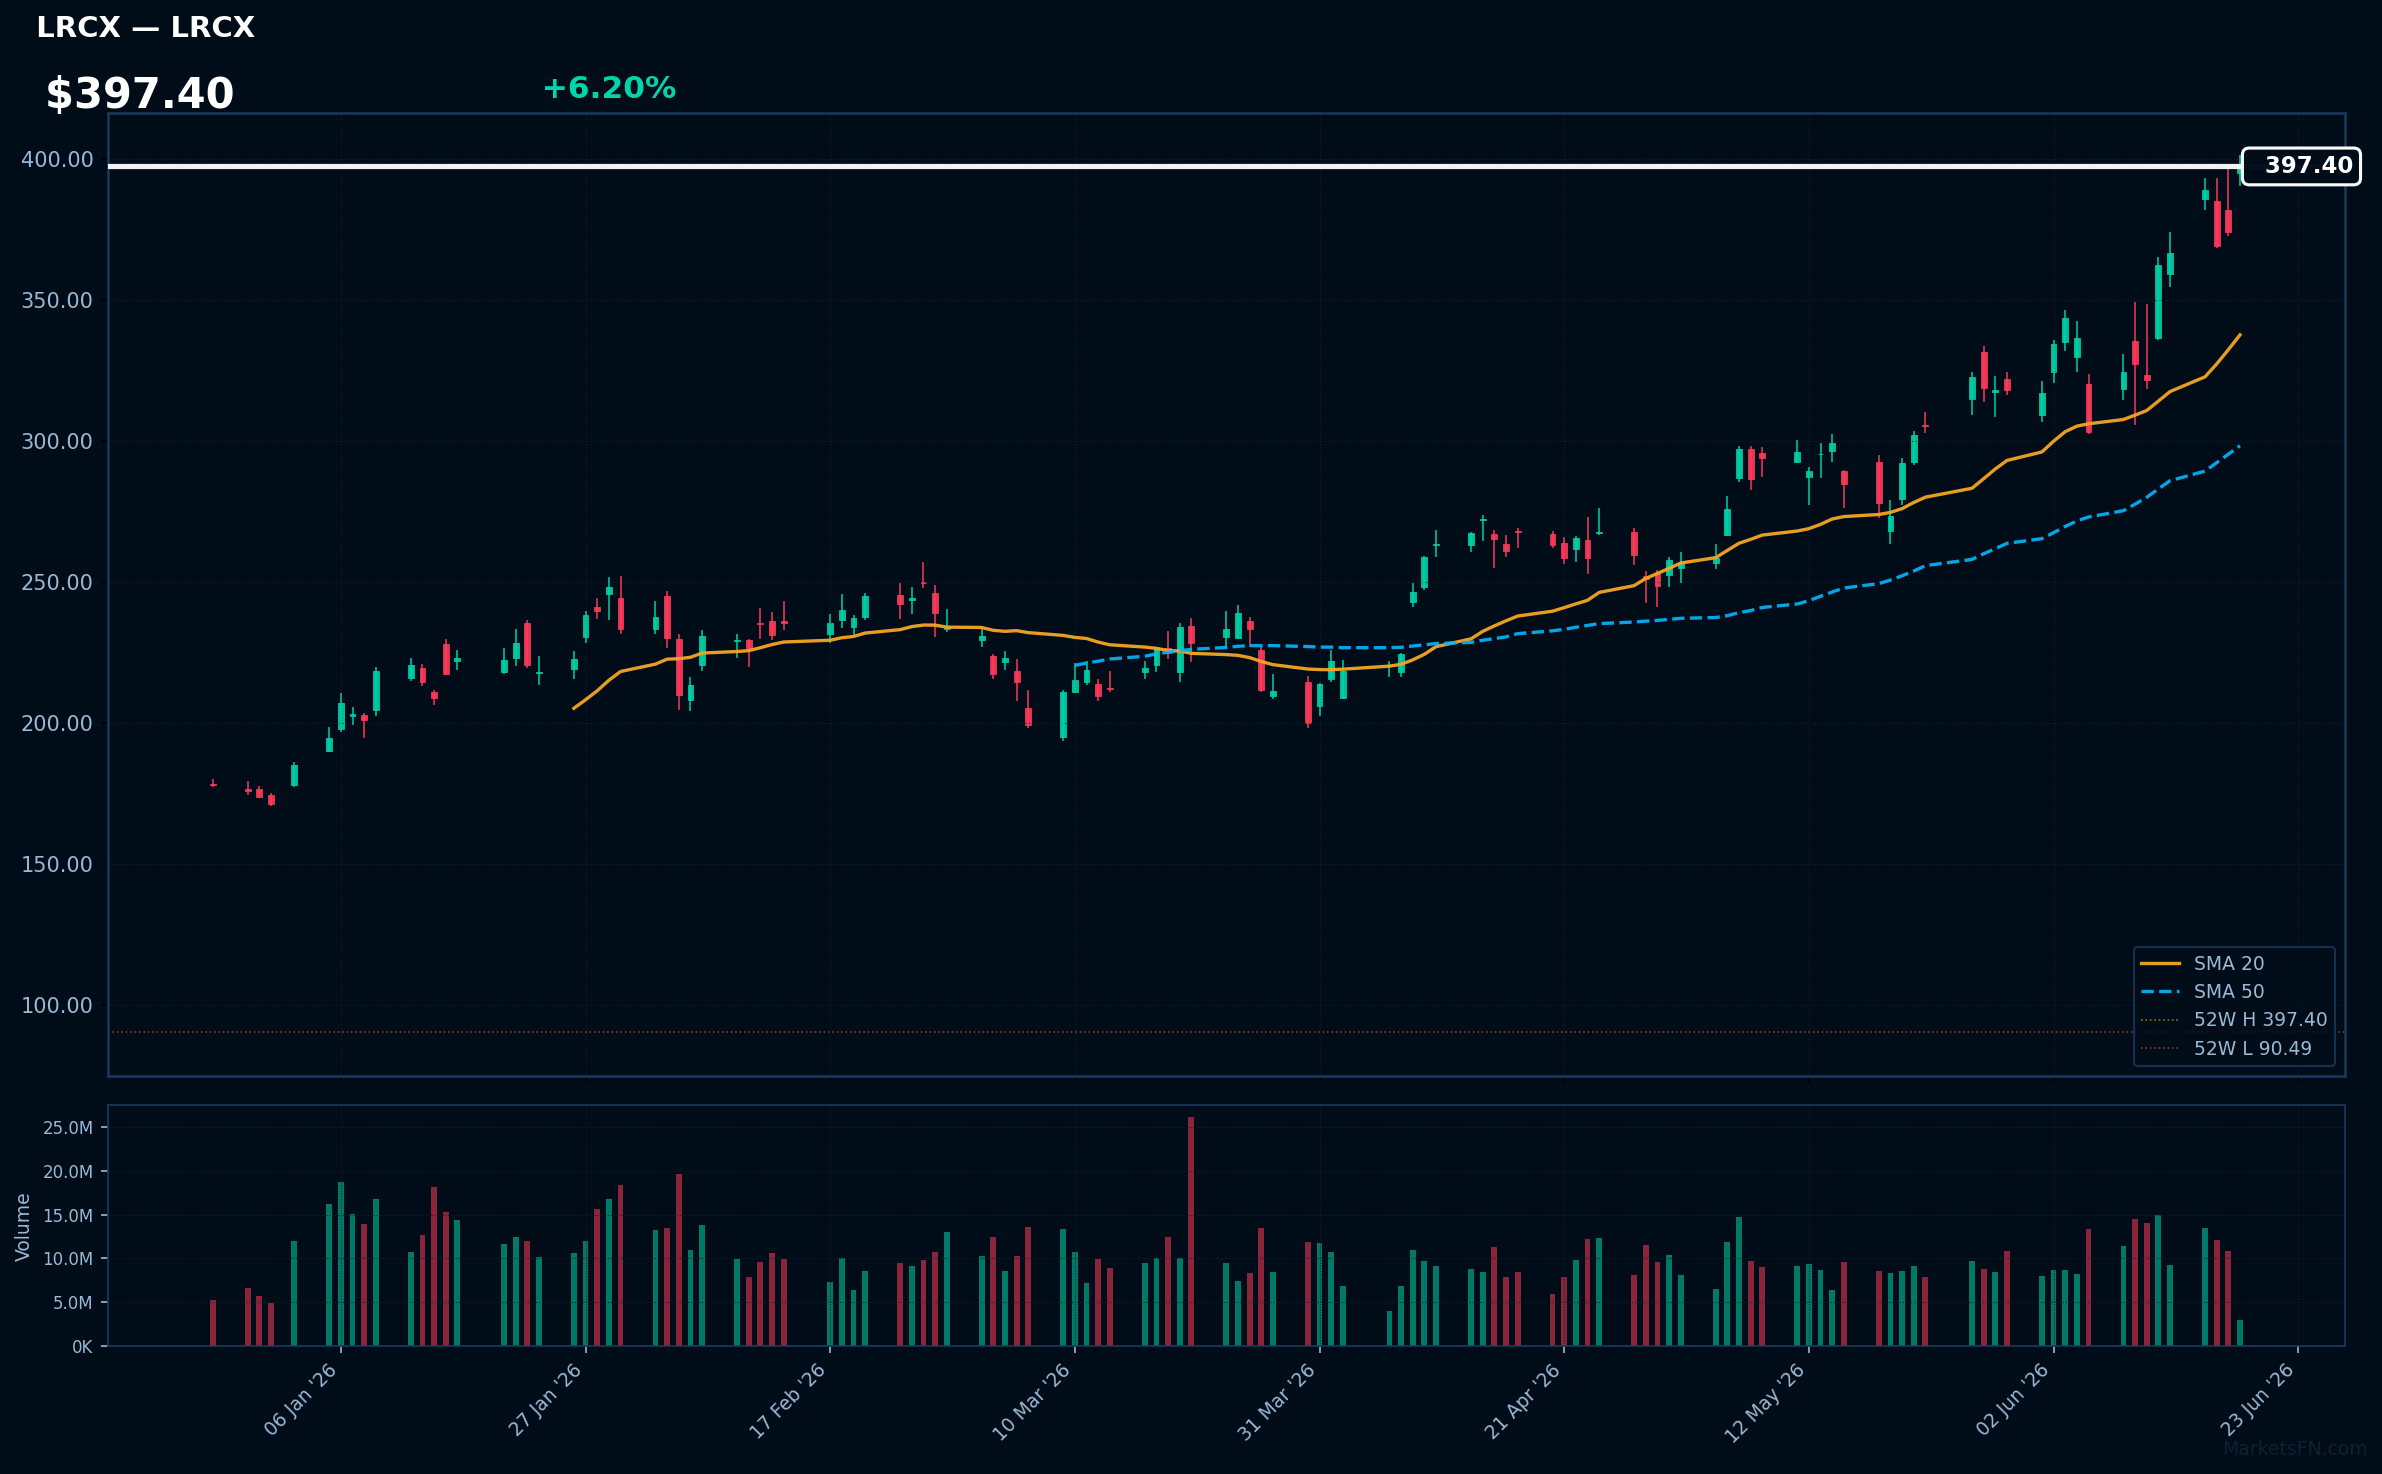
LRCX | Lam Research Corp | Technology | Price: $397.38 | Day: +6.20% | 1W: +9.62% | 1M: +45.37% | RSI: 70.1 | vs MA200: +89.1% | Trend: Above MA20, MA50, MA200
Recent headlines (last 12h)
- Nasdaq rebounds as Iran deal signed, SpaceX falls again
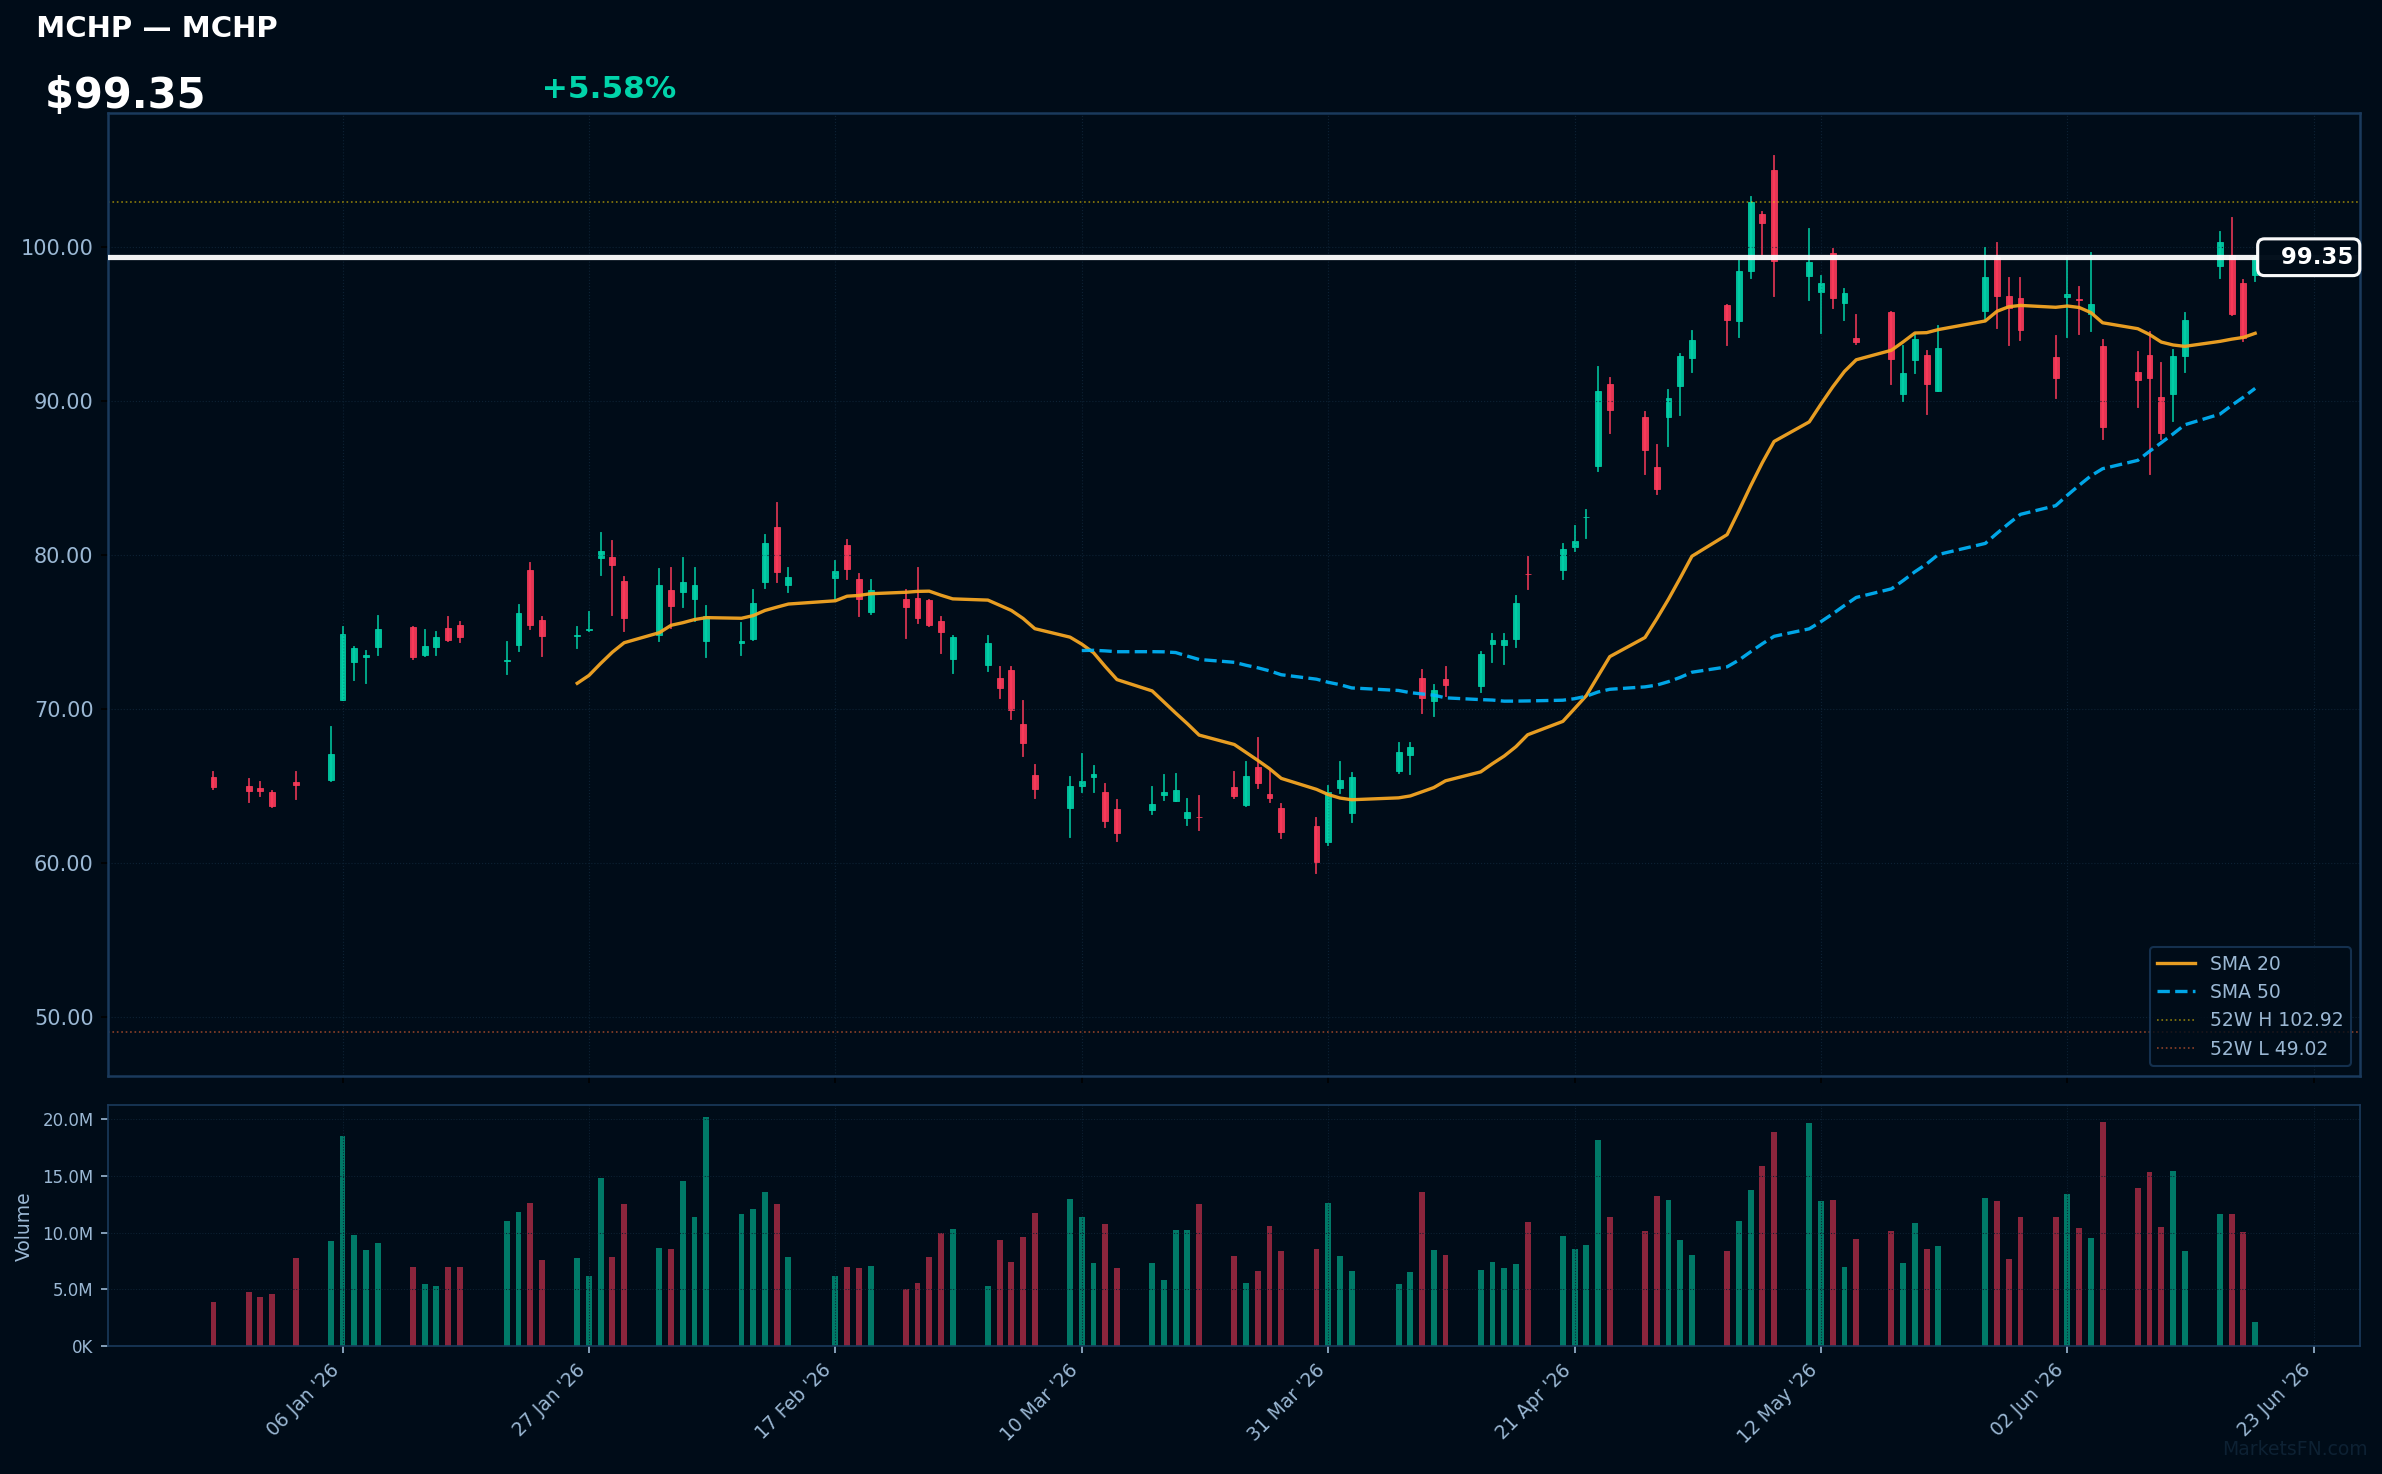
MCHP | Microchip Technology, Inc | Technology | Price: $99.36 | Day: +5.58% | 1W: +6.90% | 1M: +8.21% | RSI: 57.5 | vs MA200: +37.0% | Trend: Above MA20, MA50, MA200
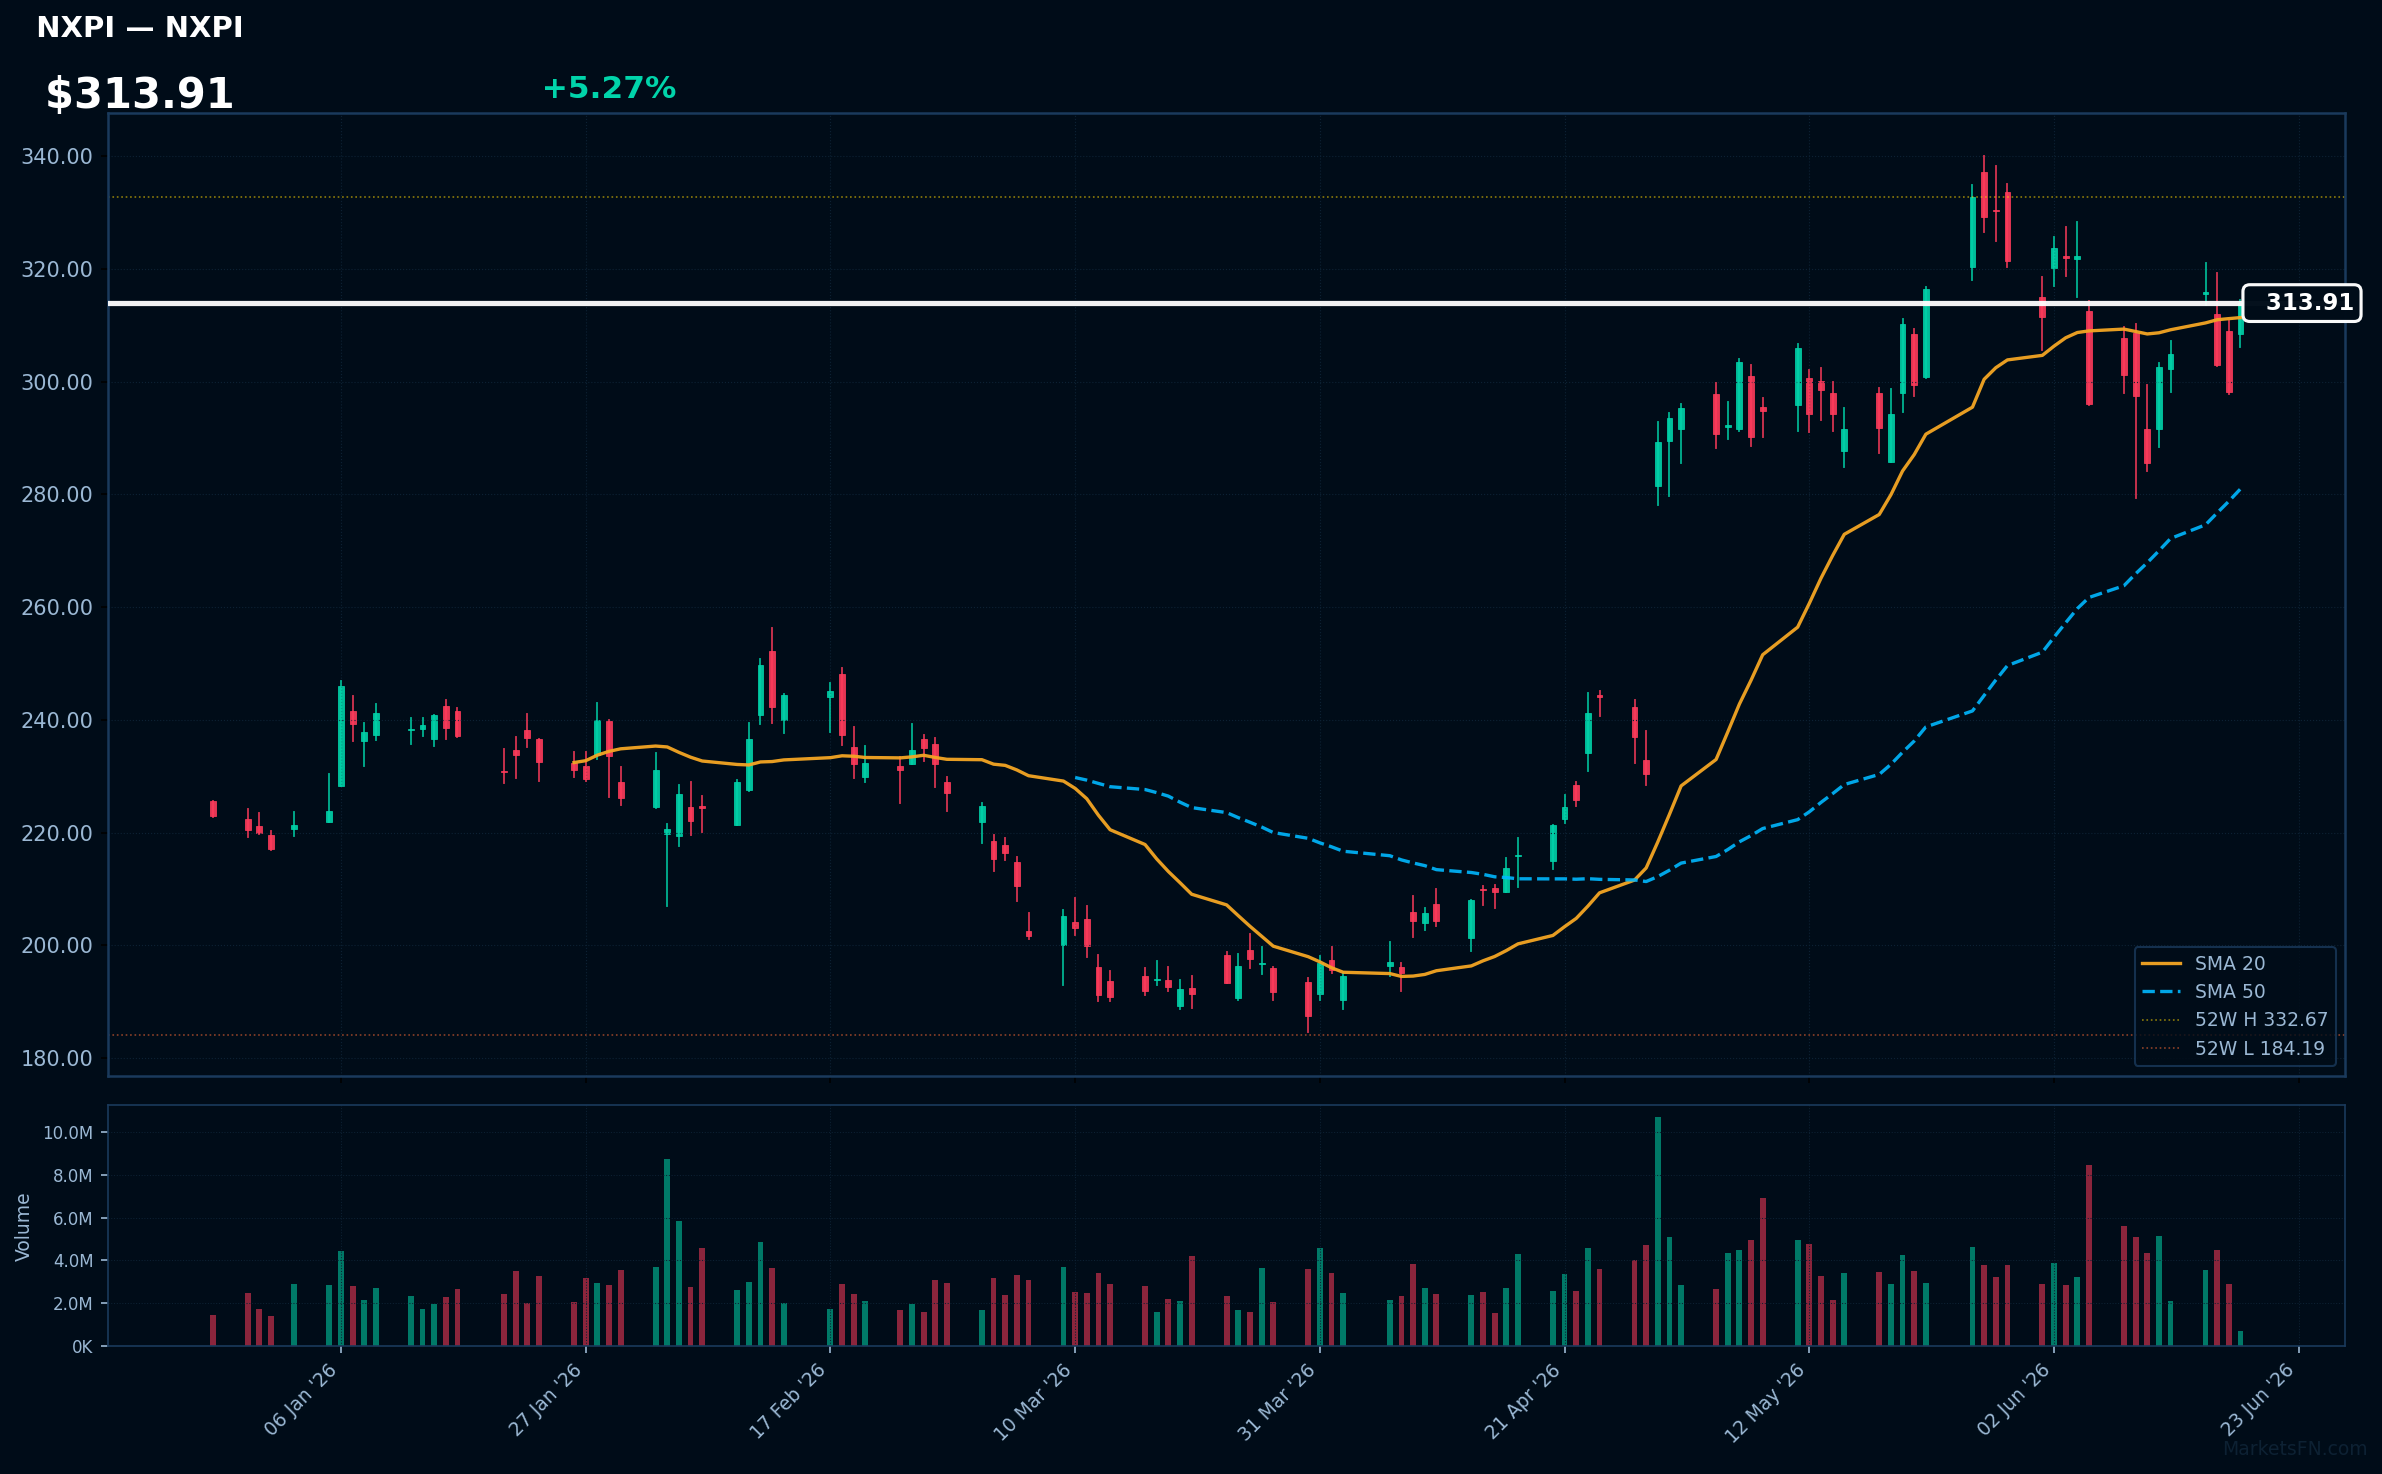
NXPI | NXP Semiconductors NV | Technology | Price: $313.90 | Day: +5.27% | 1W: +3.75% | 1M: +6.67% | RSI: 55.7 | vs MA200: +34.3% | Trend: Above MA20, MA50, MA200
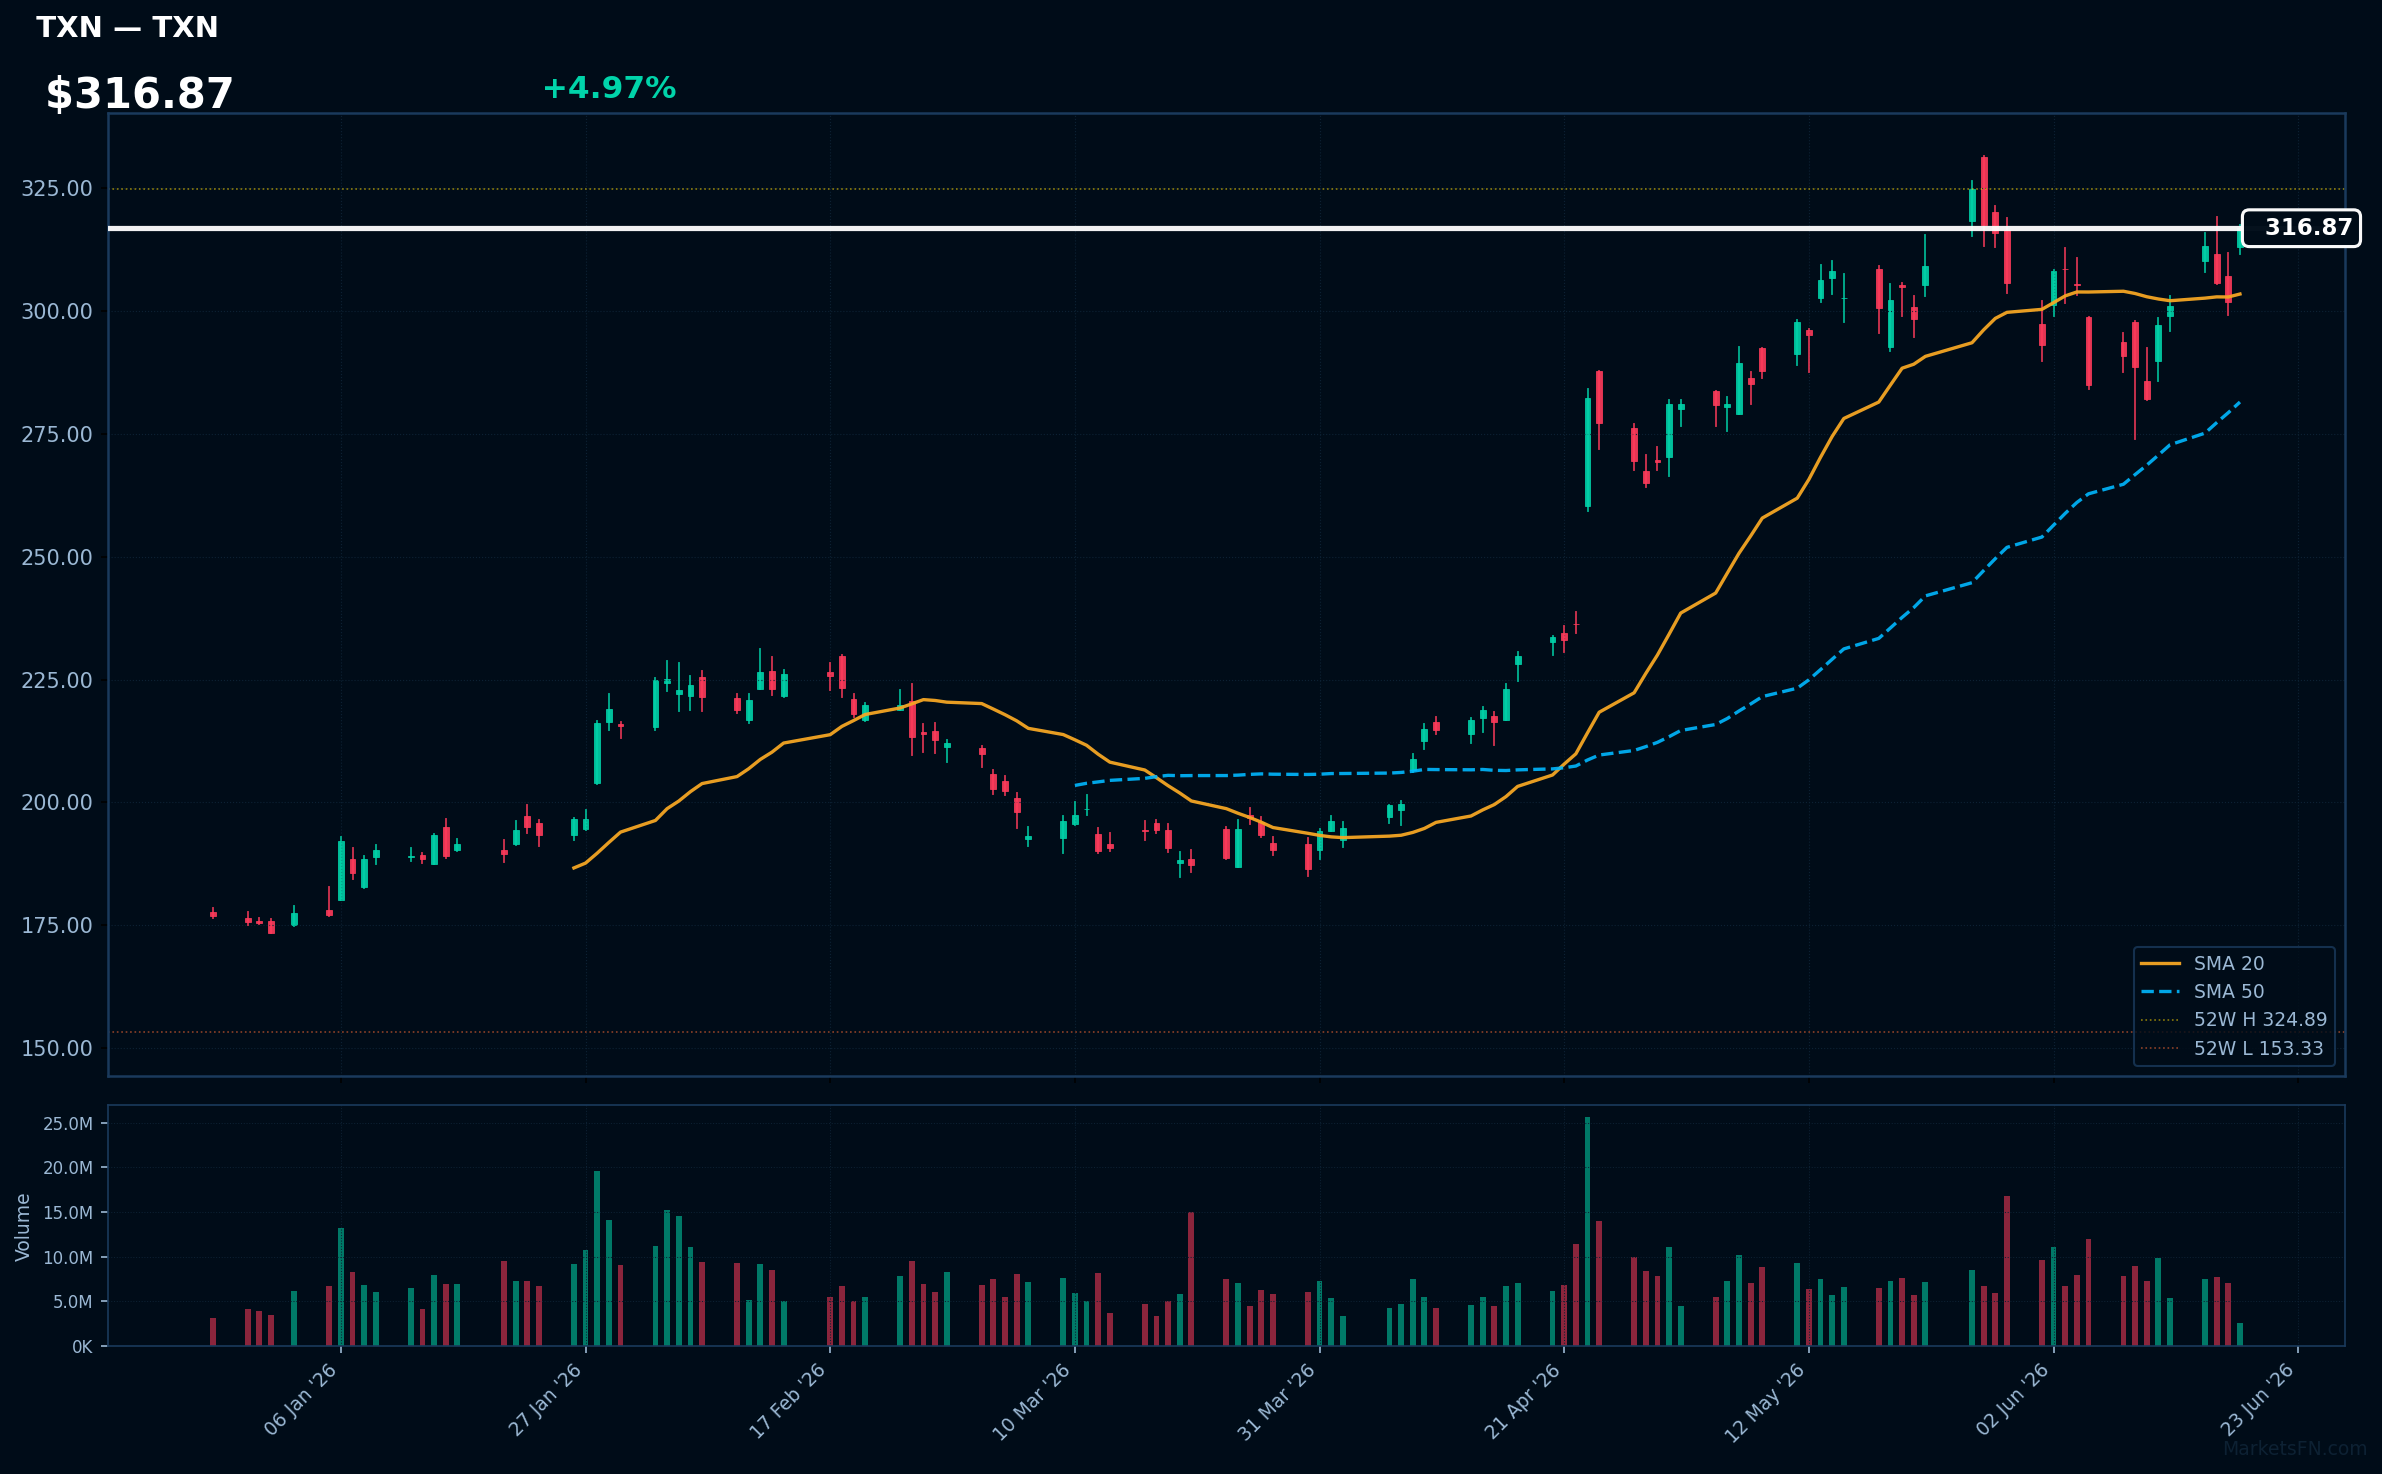
TXN | Texas Instruments Inc | Technology | Price: $316.87 | Day: +4.97% | 1W: +6.65% | 1M: +4.82% | RSI: 59.9 | vs MA200: +50.7% | Trend: Above MA20, MA50, MA200
Top 10 Losers
Today's weakest Nasdaq 100 performers. Sector drag: Technology (5), Energy (2), Consumer Cyclical (1), Industrials (1), Communication Services (1).
| Ticker | Company | Sector | Price | Day % | 1W % | 1M % | RSI | vs MA200 | Trend |
|---|---|---|---|---|---|---|---|---|---|
| TSLA | Tesla Inc | Consumer Cyclical | $390.42 | -1.50% | -2.16% | -3.36% | 43.4 | -6.4% | Below MA20, MA50, MA200 |
| ZS | Zscaler Inc | Technology | $122.24 | -1.72% | -3.14% | -30.30% | 38.9 | -42.2% | Below MA20, MA50, MA200 |
| FANG | Diamondback Energy Inc | Energy | $180.83 | -2.51% | -5.62% | -12.97% | 36.4 | +8.4% | Above MA200 · Below MA20, MA50 |
| AXON | Axon Enterprise Inc | Industrials | $412.11 | -2.58% | -7.64% | +5.04% | 42.5 | -24.3% | Below MA20, MA50, MA200 |
| PLTR | Palantir Technologies Inc | Technology | $127.00 | -2.78% | -3.10% | -6.09% | 40.1 | -20.6% | Below MA20, MA50, MA200 |
| MSTR | Strategy Inc | Technology | $113.19 | -2.89% | -5.72% | -31.19% | 34.3 | -41.0% | Below MA20, MA50, MA200 |
| BKR | Baker Hughes Co | Energy | $58.09 | -3.30% | -8.49% | -11.27% | 33.5 | +5.3% | Above MA200 · Below MA20, MA50 |
| APP | Applovin Corp | Communication Services | $462.24 | -3.60% | -3.41% | -3.07% | 39.9 | -14.7% | Below MA20, MA50, MA200 |
| DDOG | Datadog Inc | Technology | $217.68 | -3.95% | -7.07% | +1.18% | 49.3 | +43.8% | Above MA50, MA200 · Below MA20 |
| CTSH | Cognizant Technology Solutions Corp | Technology | $45.58 | -6.64% | -10.94% | -10.42% | 28.6 | -32.6% | Below MA20, MA50, MA200 |
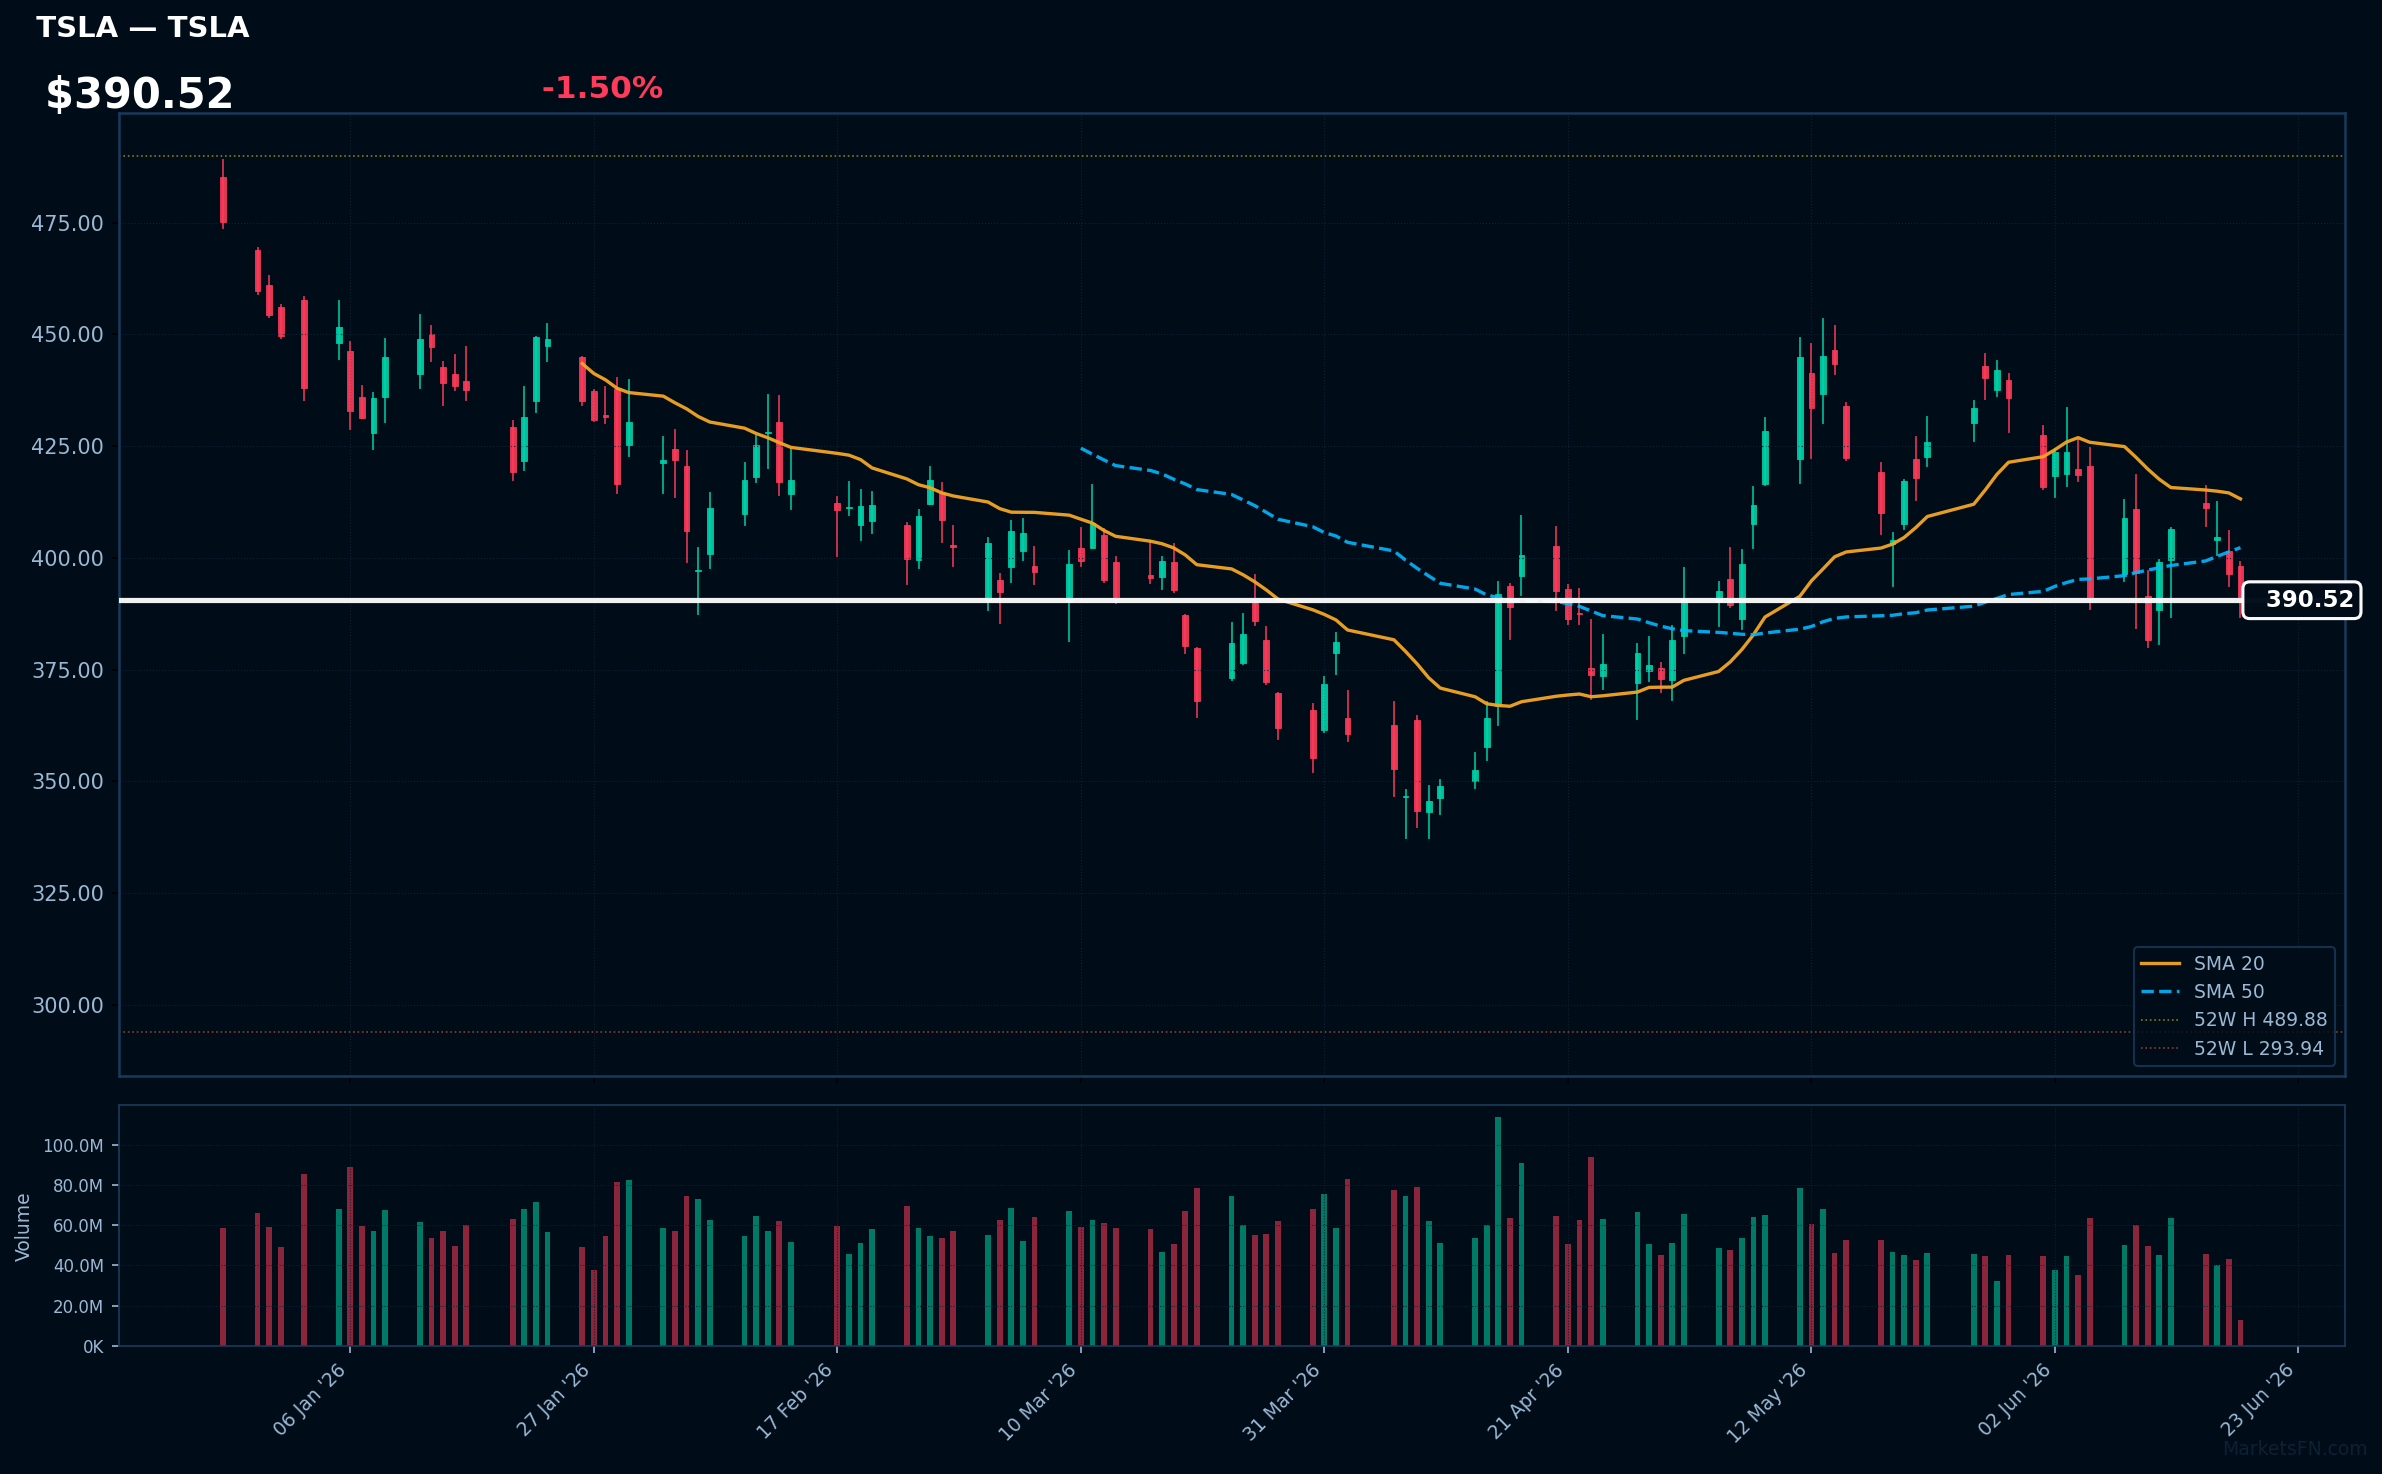
TSLA | Tesla Inc | Consumer Cyclical | Price: $390.42 | Day: -1.50% | 1W: -2.16% | 1M: -3.36% | RSI: 43.4 | vs MA200: -6.4% | Trend: Below MA20, MA50, MA200
Recent headlines (last 12h)
- SpaceX acquires Cursor to bolster xAI and court AI developers
- Large cryptocurrencies drop on Sui, Avalanche declines
- Waymo Has a Tesla-Like Recall. What It Means for Alphabet Stock.
- Your Tesla Drives Better Than You Do-and That's Good News for the Stock
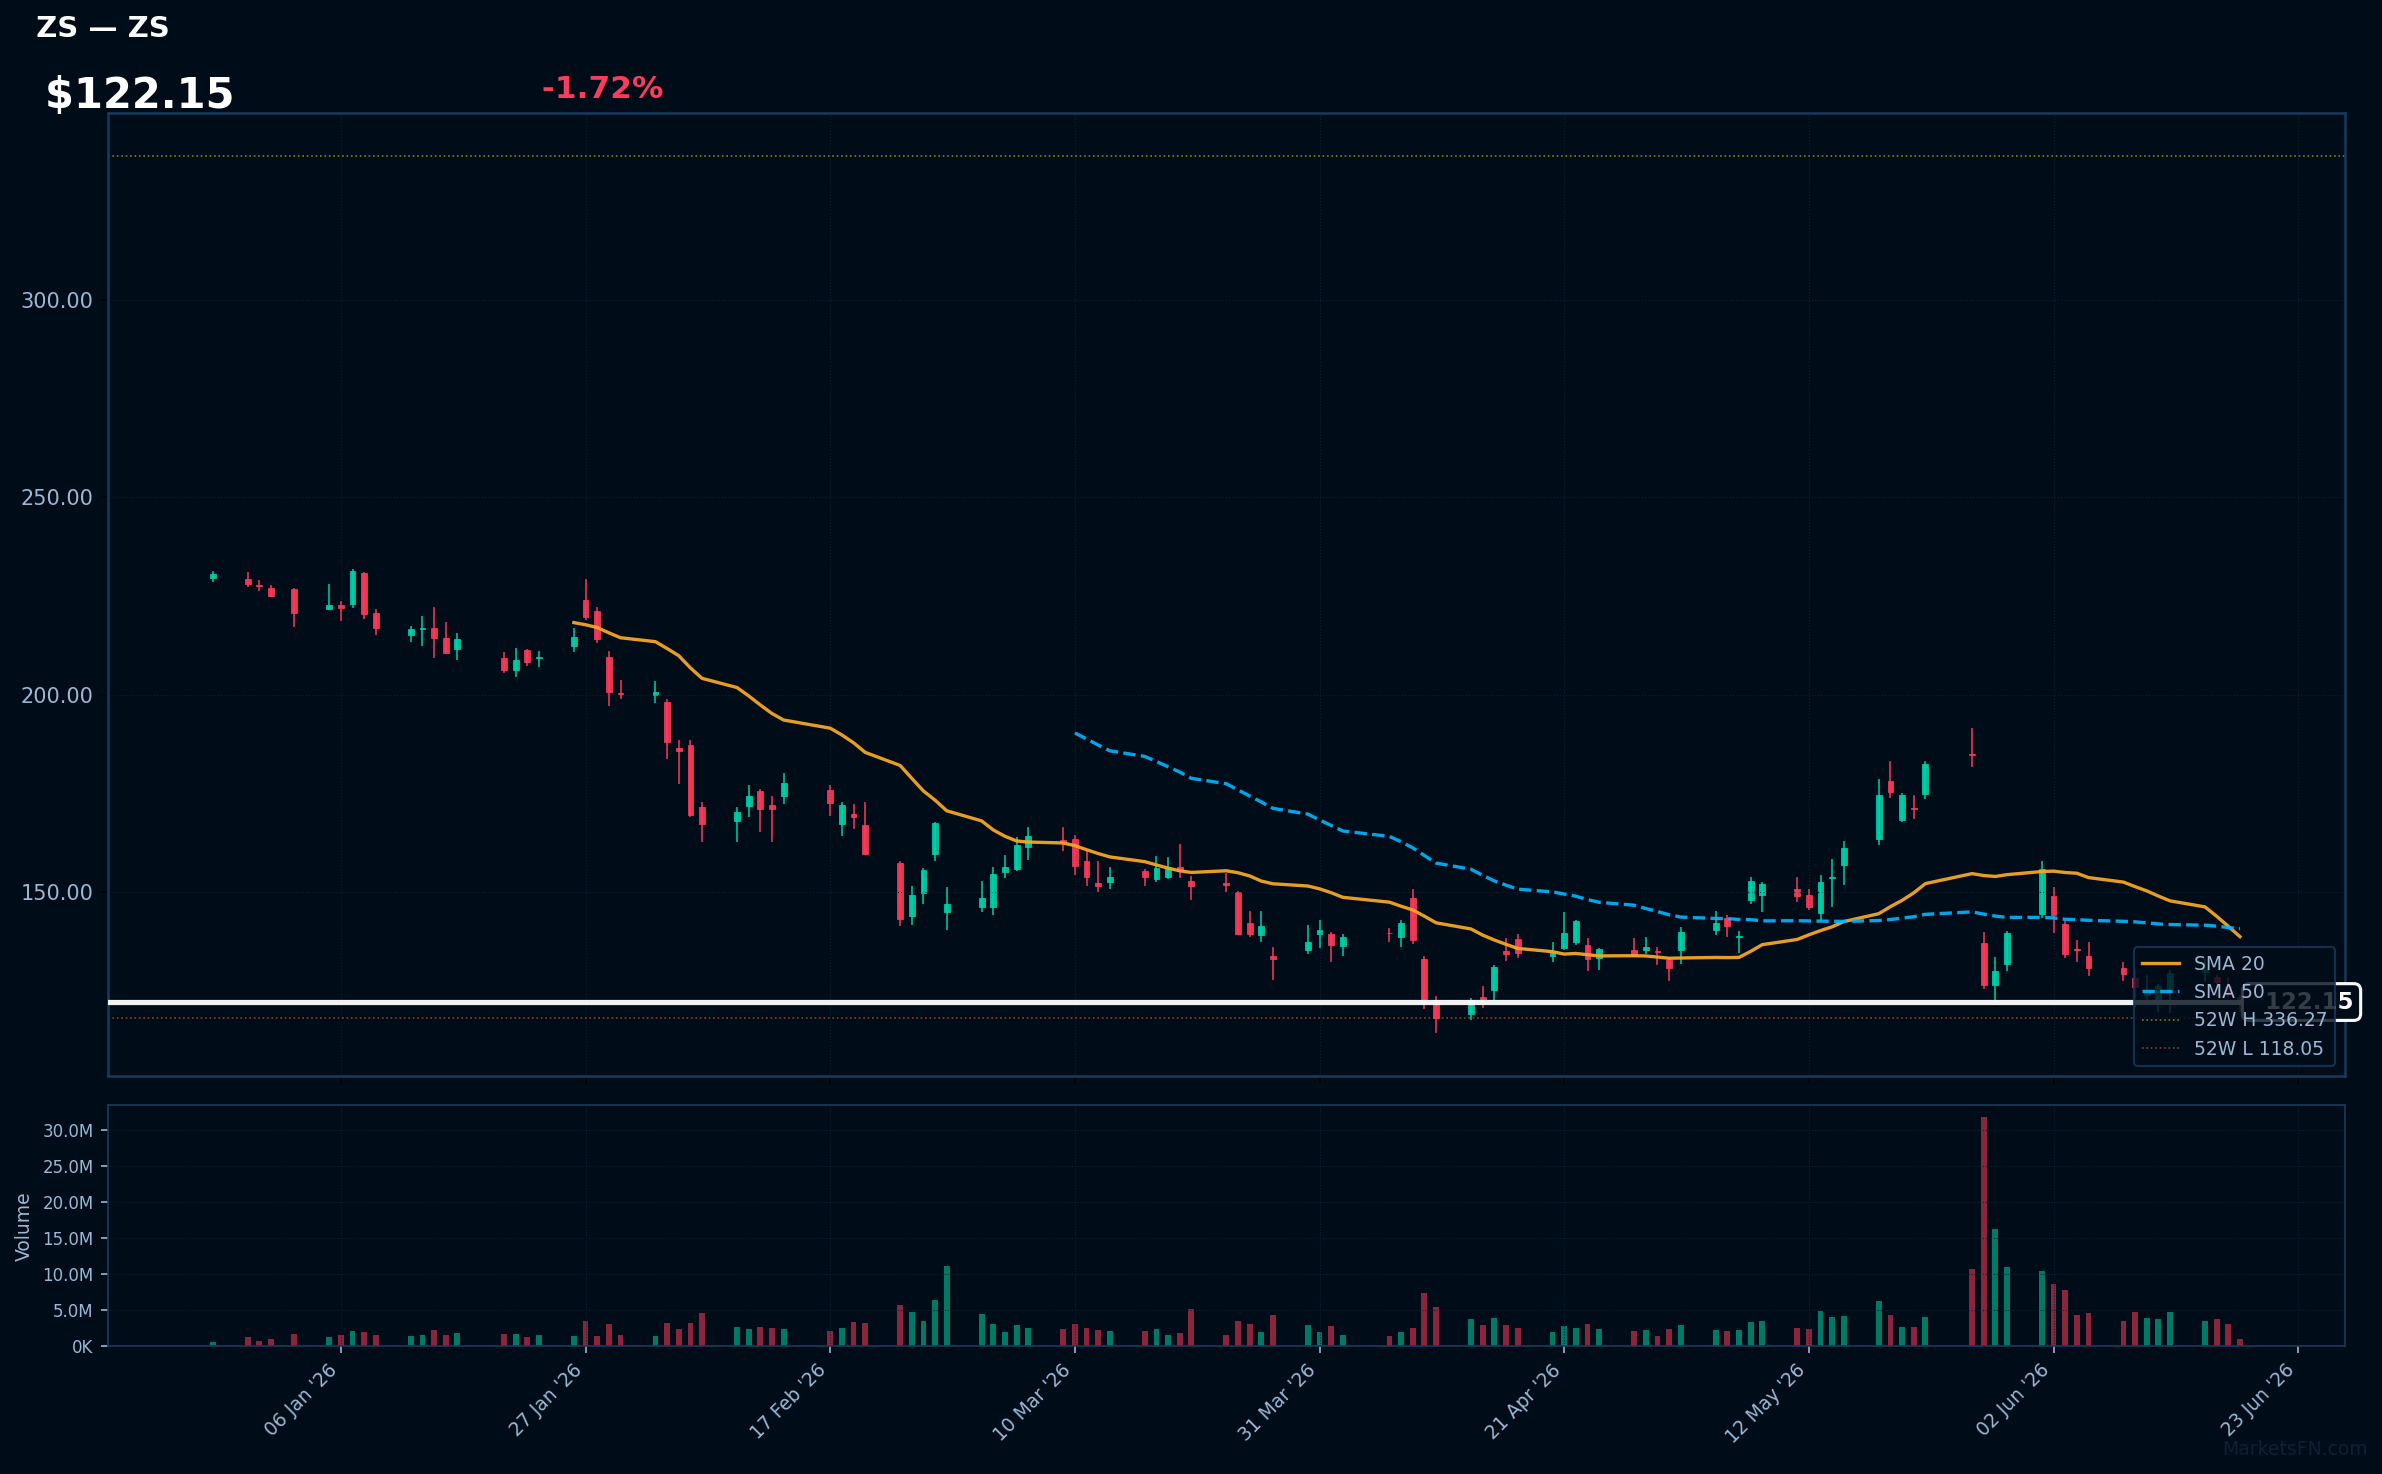
ZS | Zscaler Inc | Technology | Price: $122.24 | Day: -1.72% | 1W: -3.14% | 1M: -30.30% | RSI: 38.9 | vs MA200: -42.2% | Trend: Below MA20, MA50, MA200
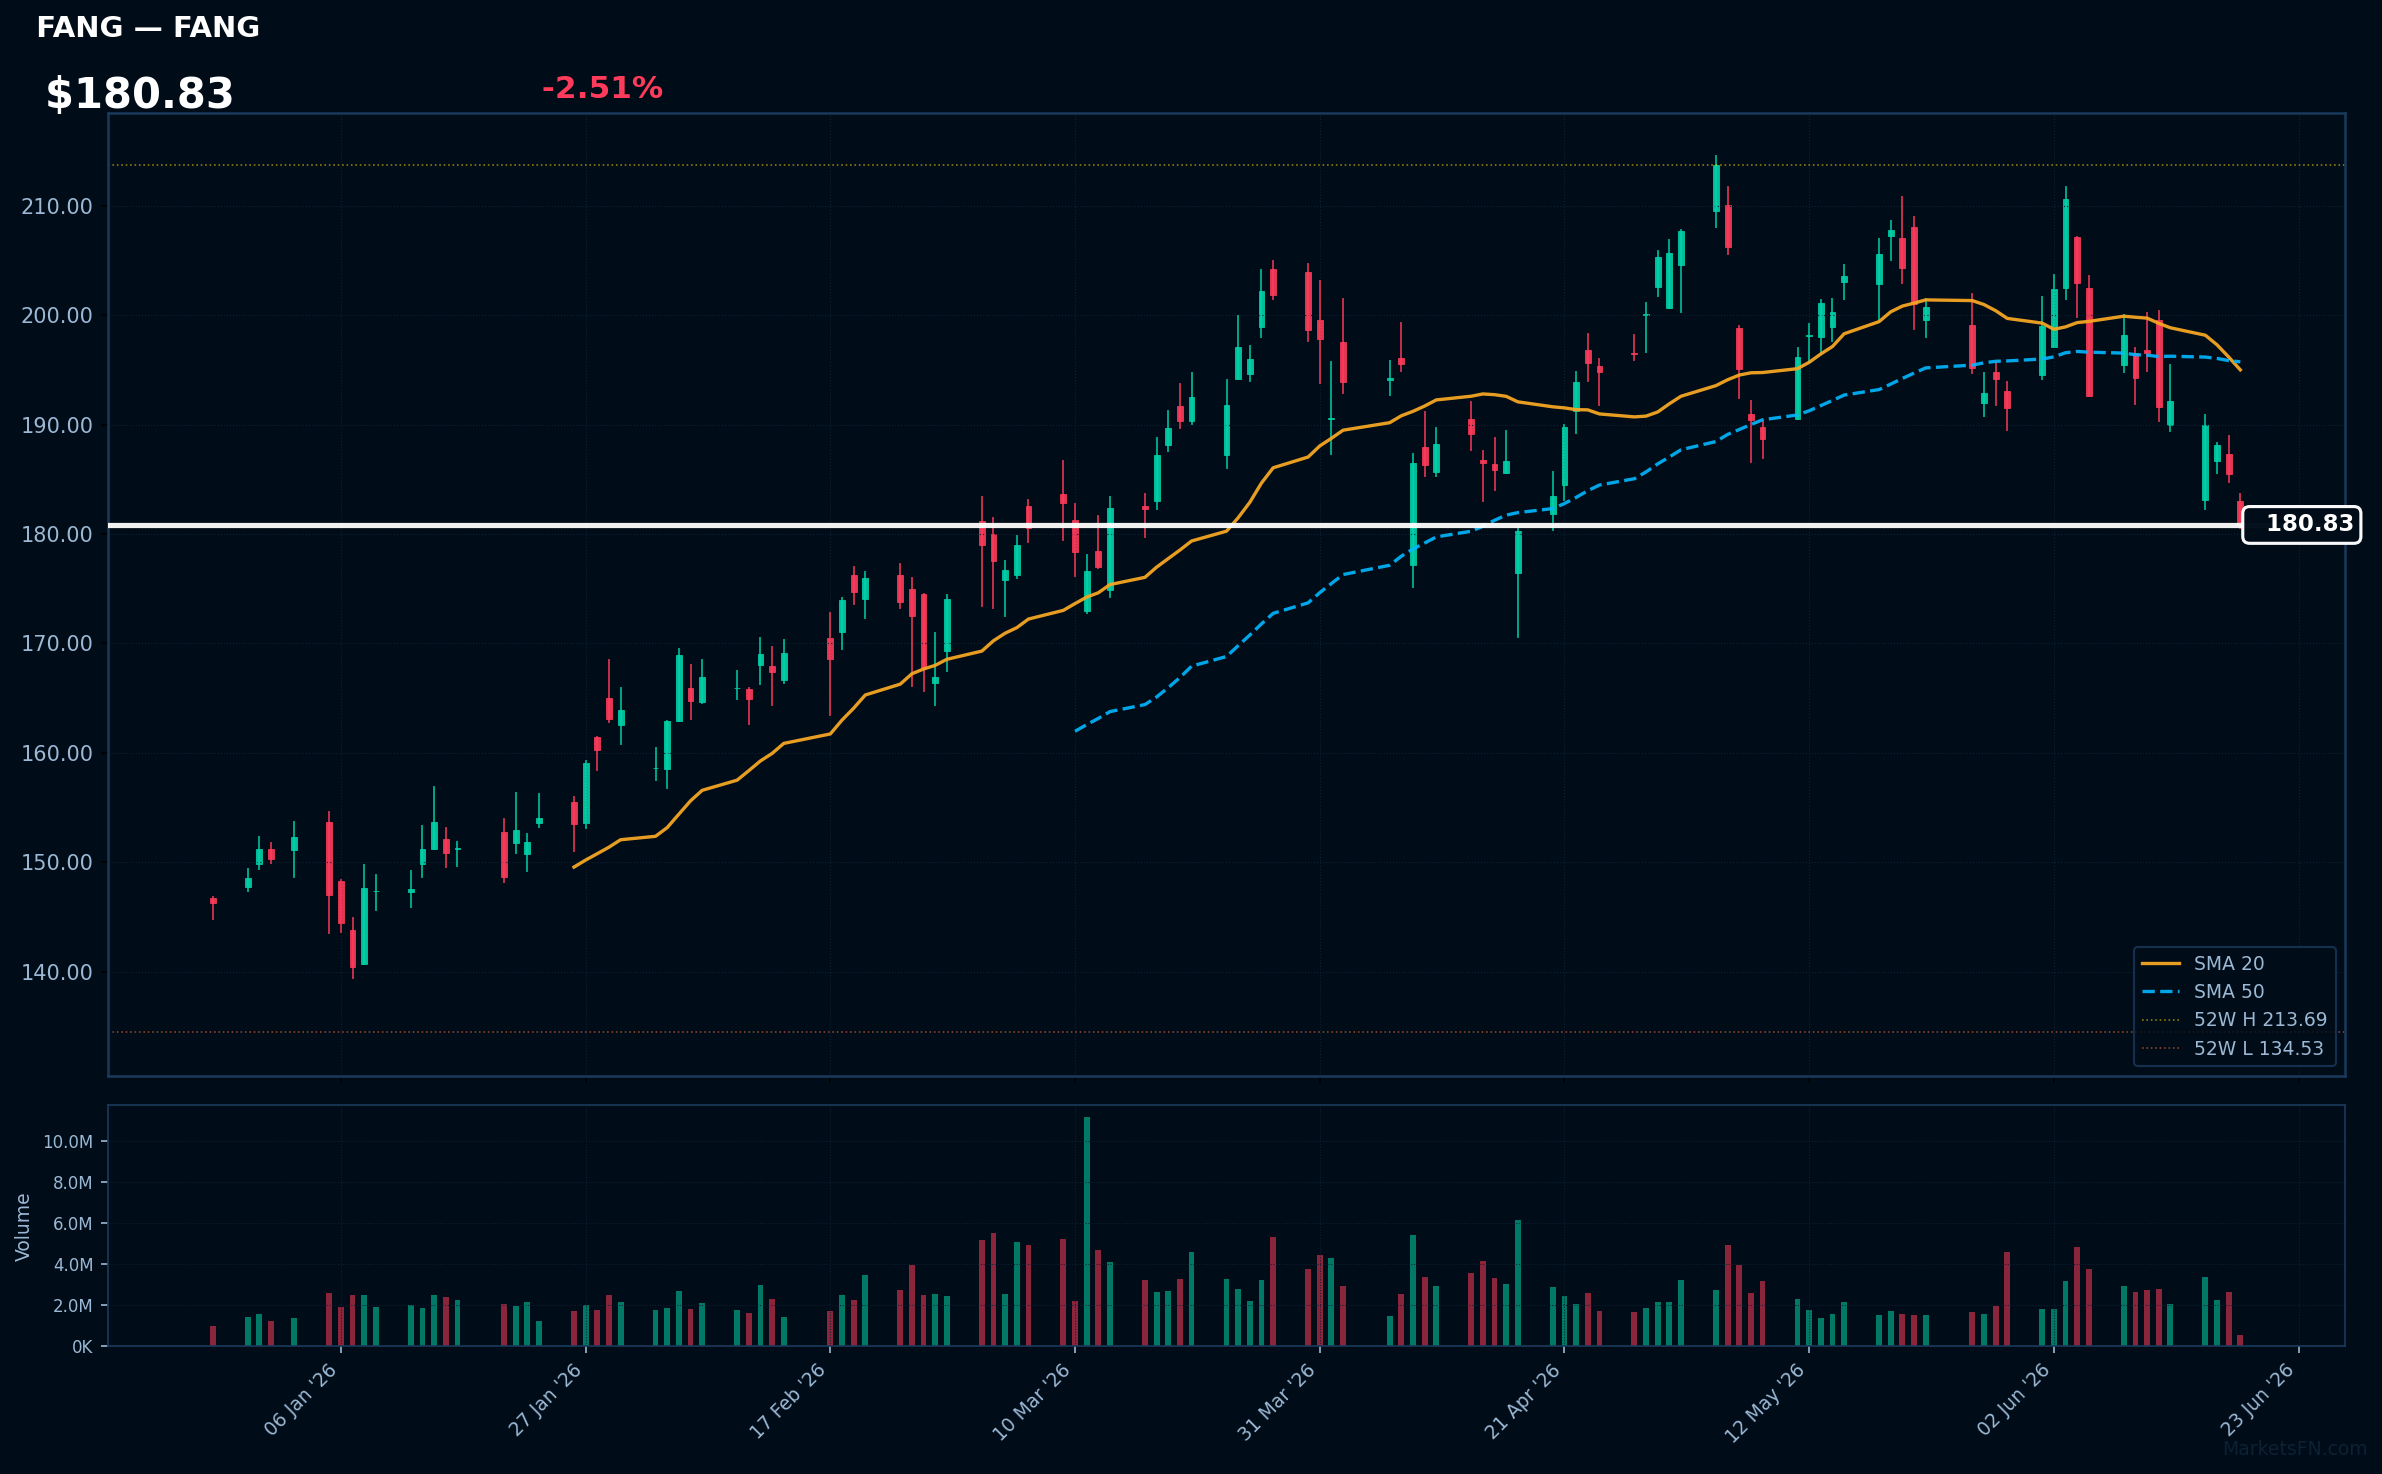
FANG | Diamondback Energy Inc | Energy | Price: $180.83 | Day: -2.51% | 1W: -5.62% | 1M: -12.97% | RSI: 36.4 | vs MA200: +8.4% | Trend: Above MA200 · Below MA20, MA50
Recent headlines (last 12h)
- How an Oil Outsider Became Shales Staunchest Defender
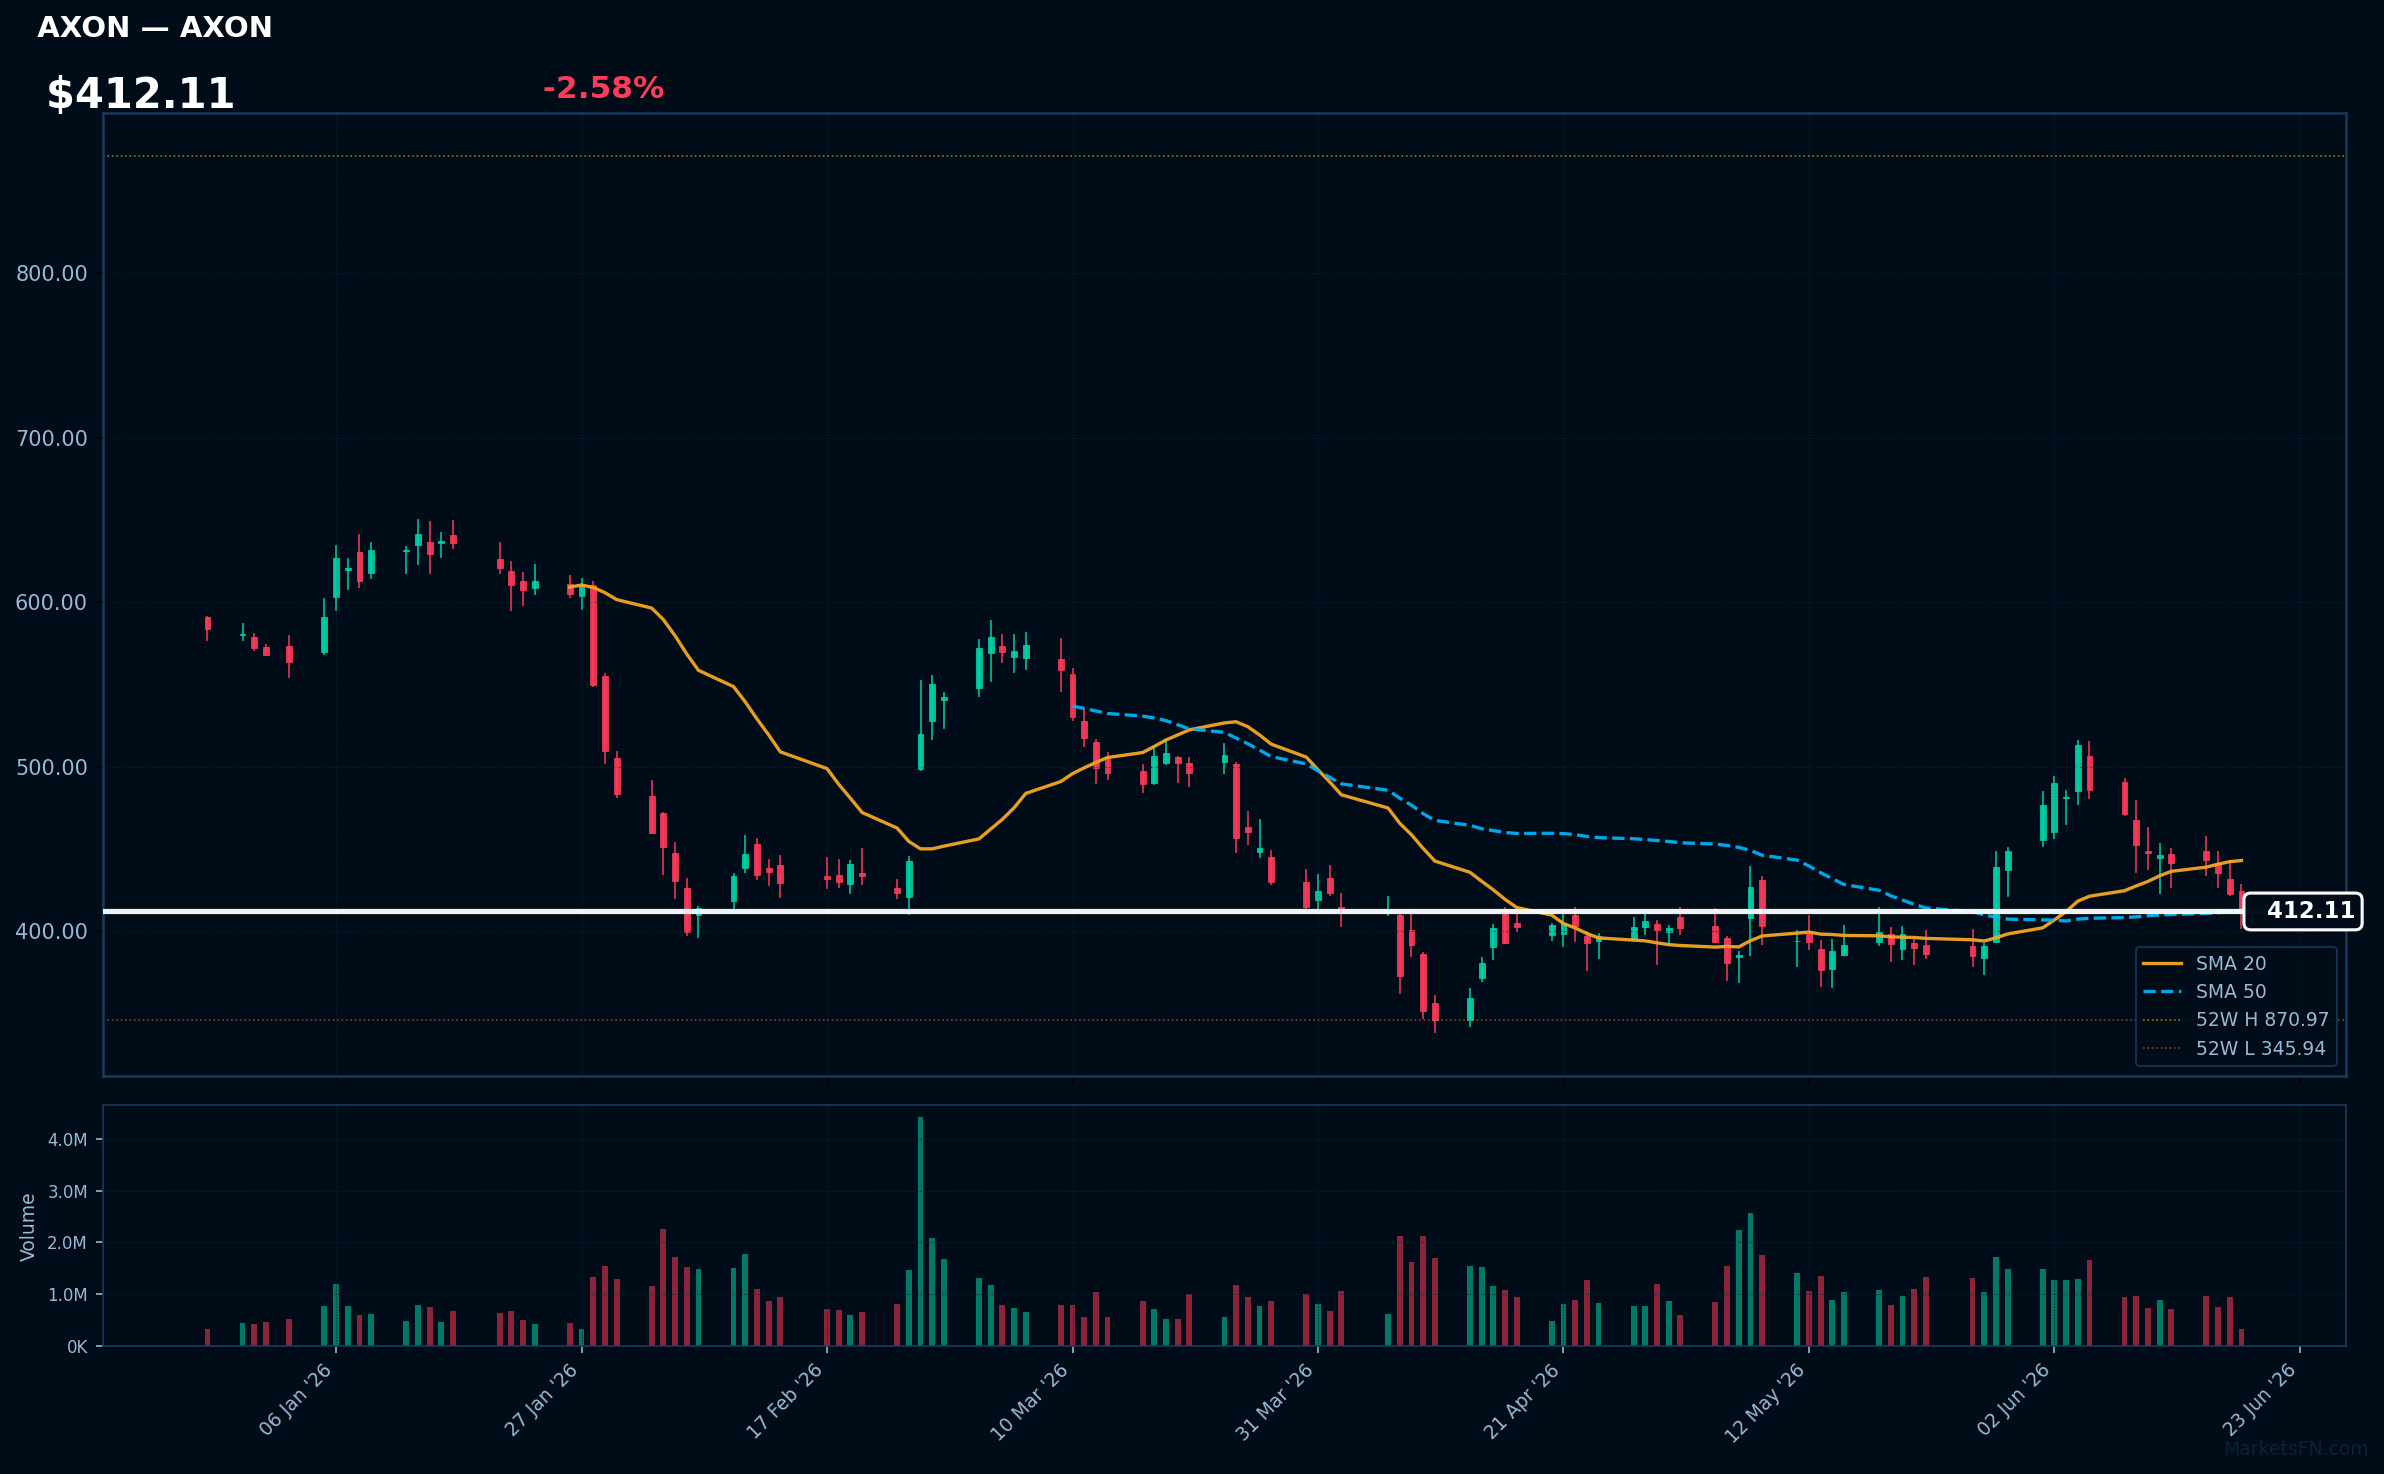
AXON | Axon Enterprise Inc | Industrials | Price: $412.11 | Day: -2.58% | 1W: -7.64% | 1M: +5.04% | RSI: 42.5 | vs MA200: -24.3% | Trend: Below MA20, MA50, MA200
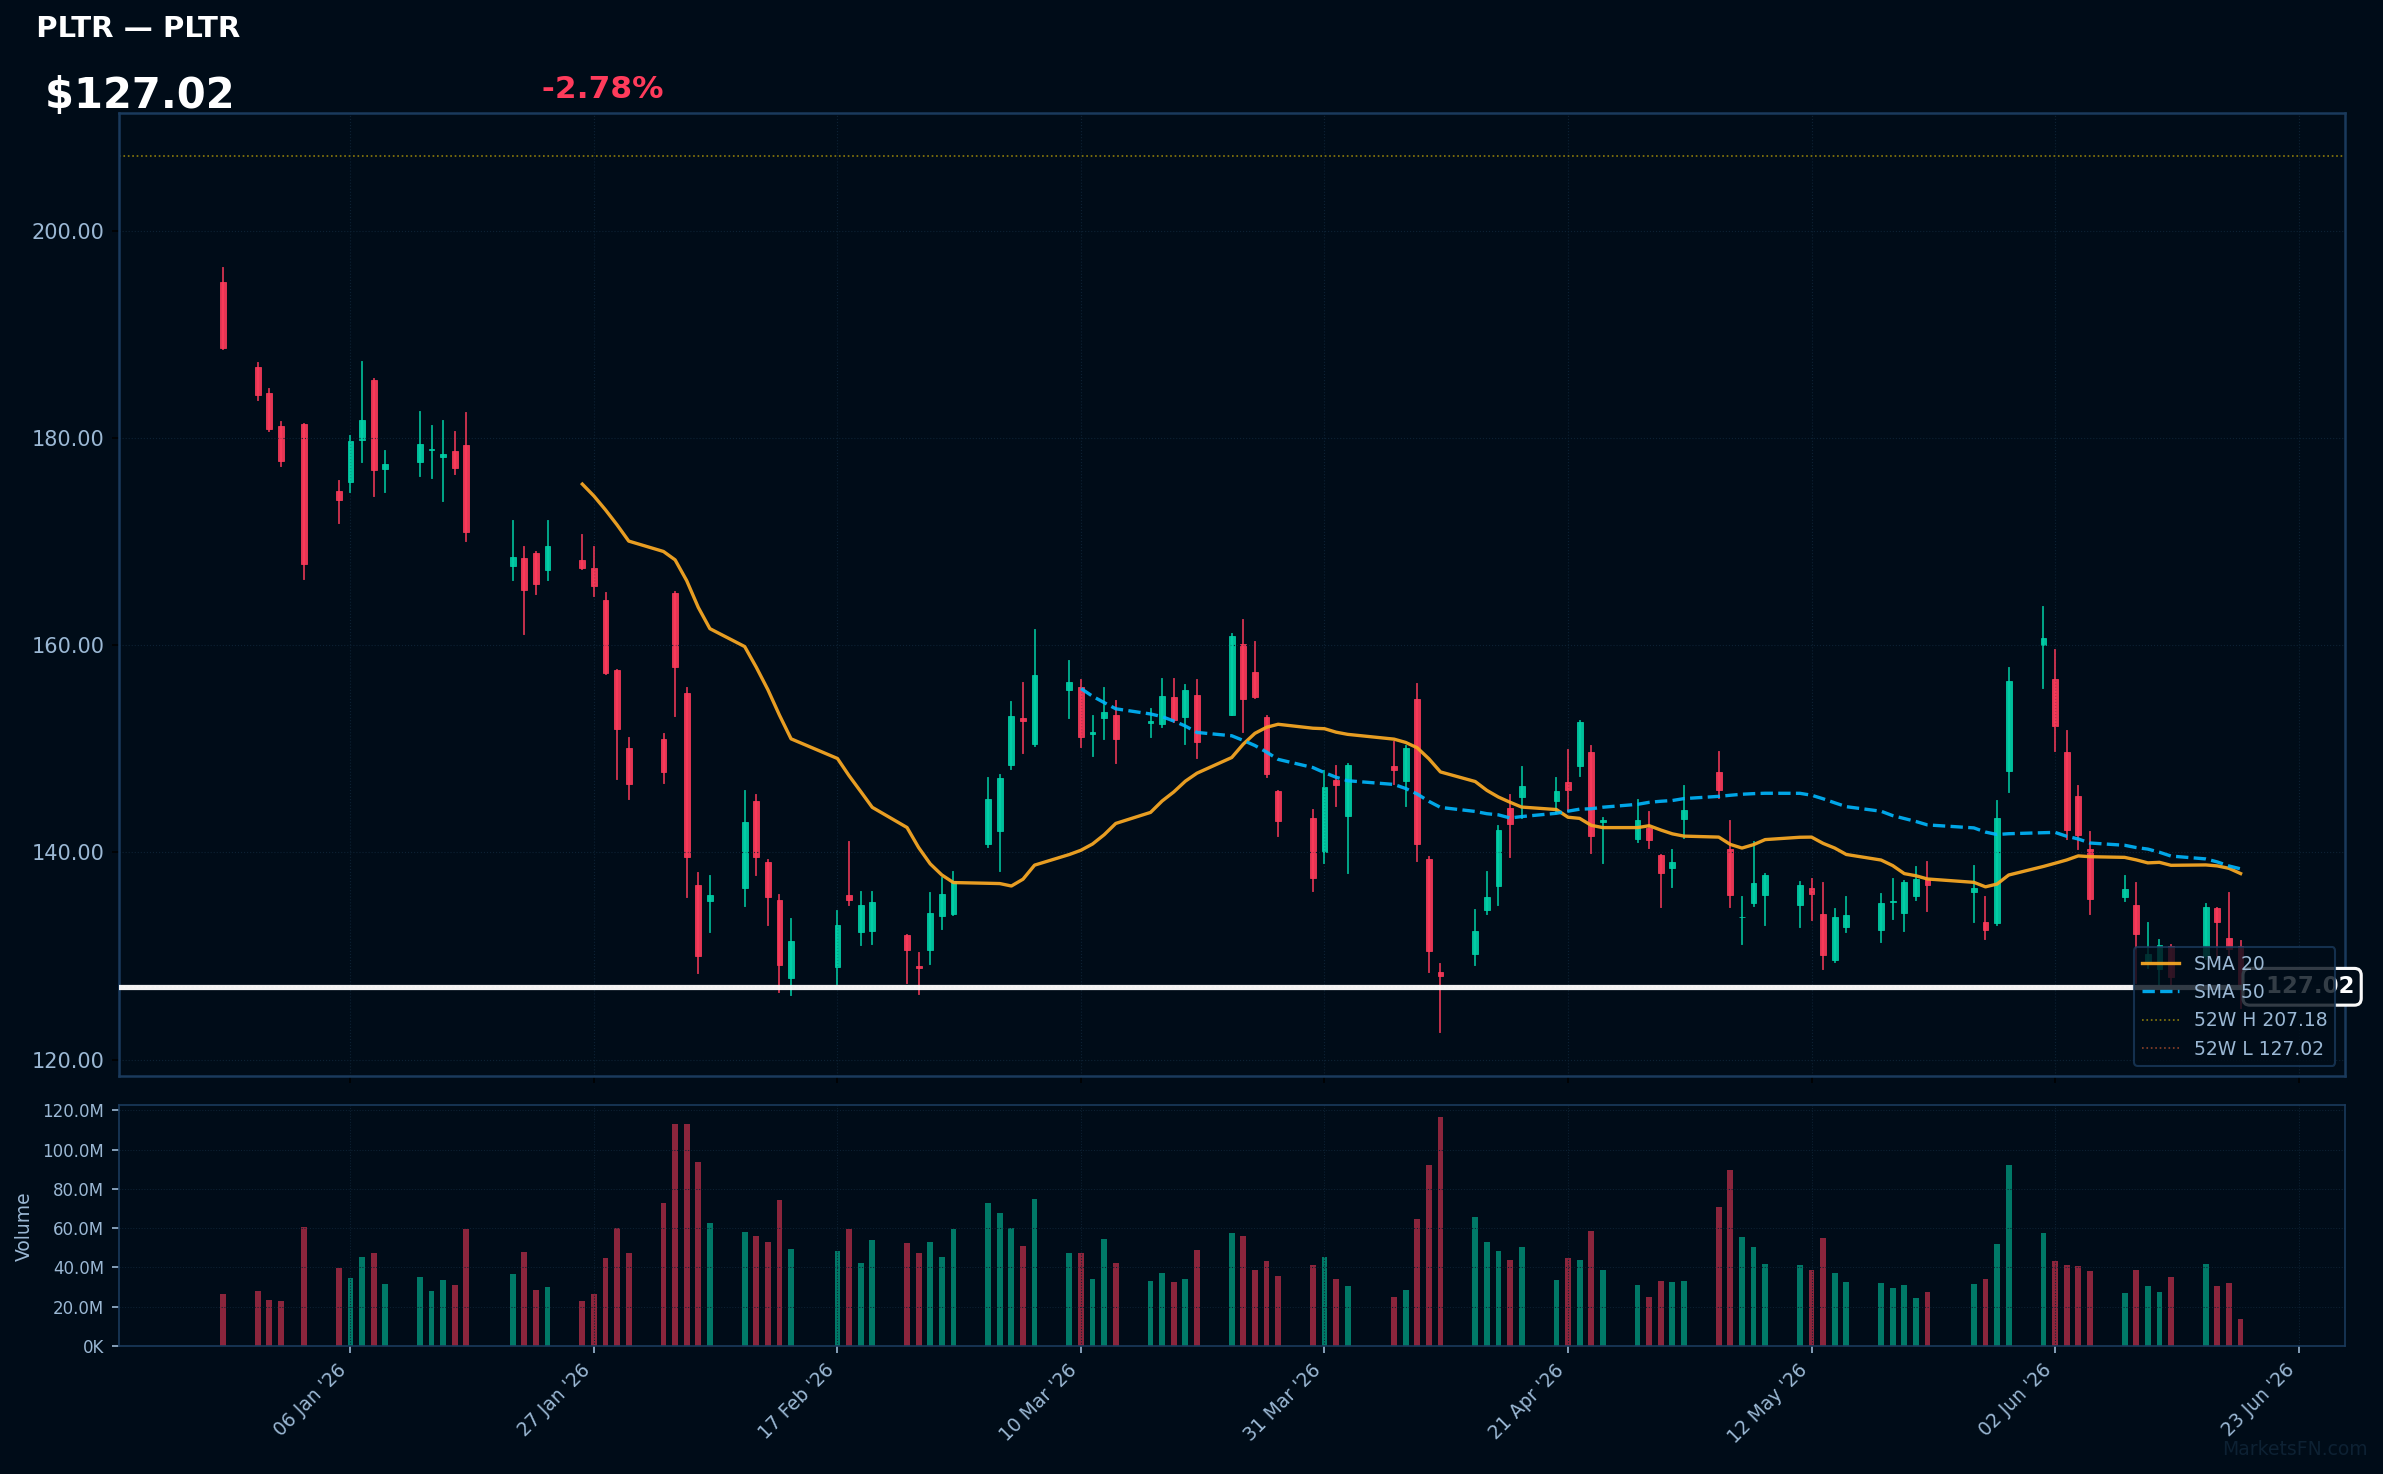
PLTR | Palantir Technologies Inc | Technology | Price: $127.00 | Day: -2.78% | 1W: -3.10% | 1M: -6.09% | RSI: 40.1 | vs MA200: -20.6% | Trend: Below MA20, MA50, MA200
Recent headlines (last 12h)
- Anthropic Ban Forces Investor Rethink of Political Risk
- SpaceX Looks Like Meme Stock To Some. Is That A Good Or Bad Thing?
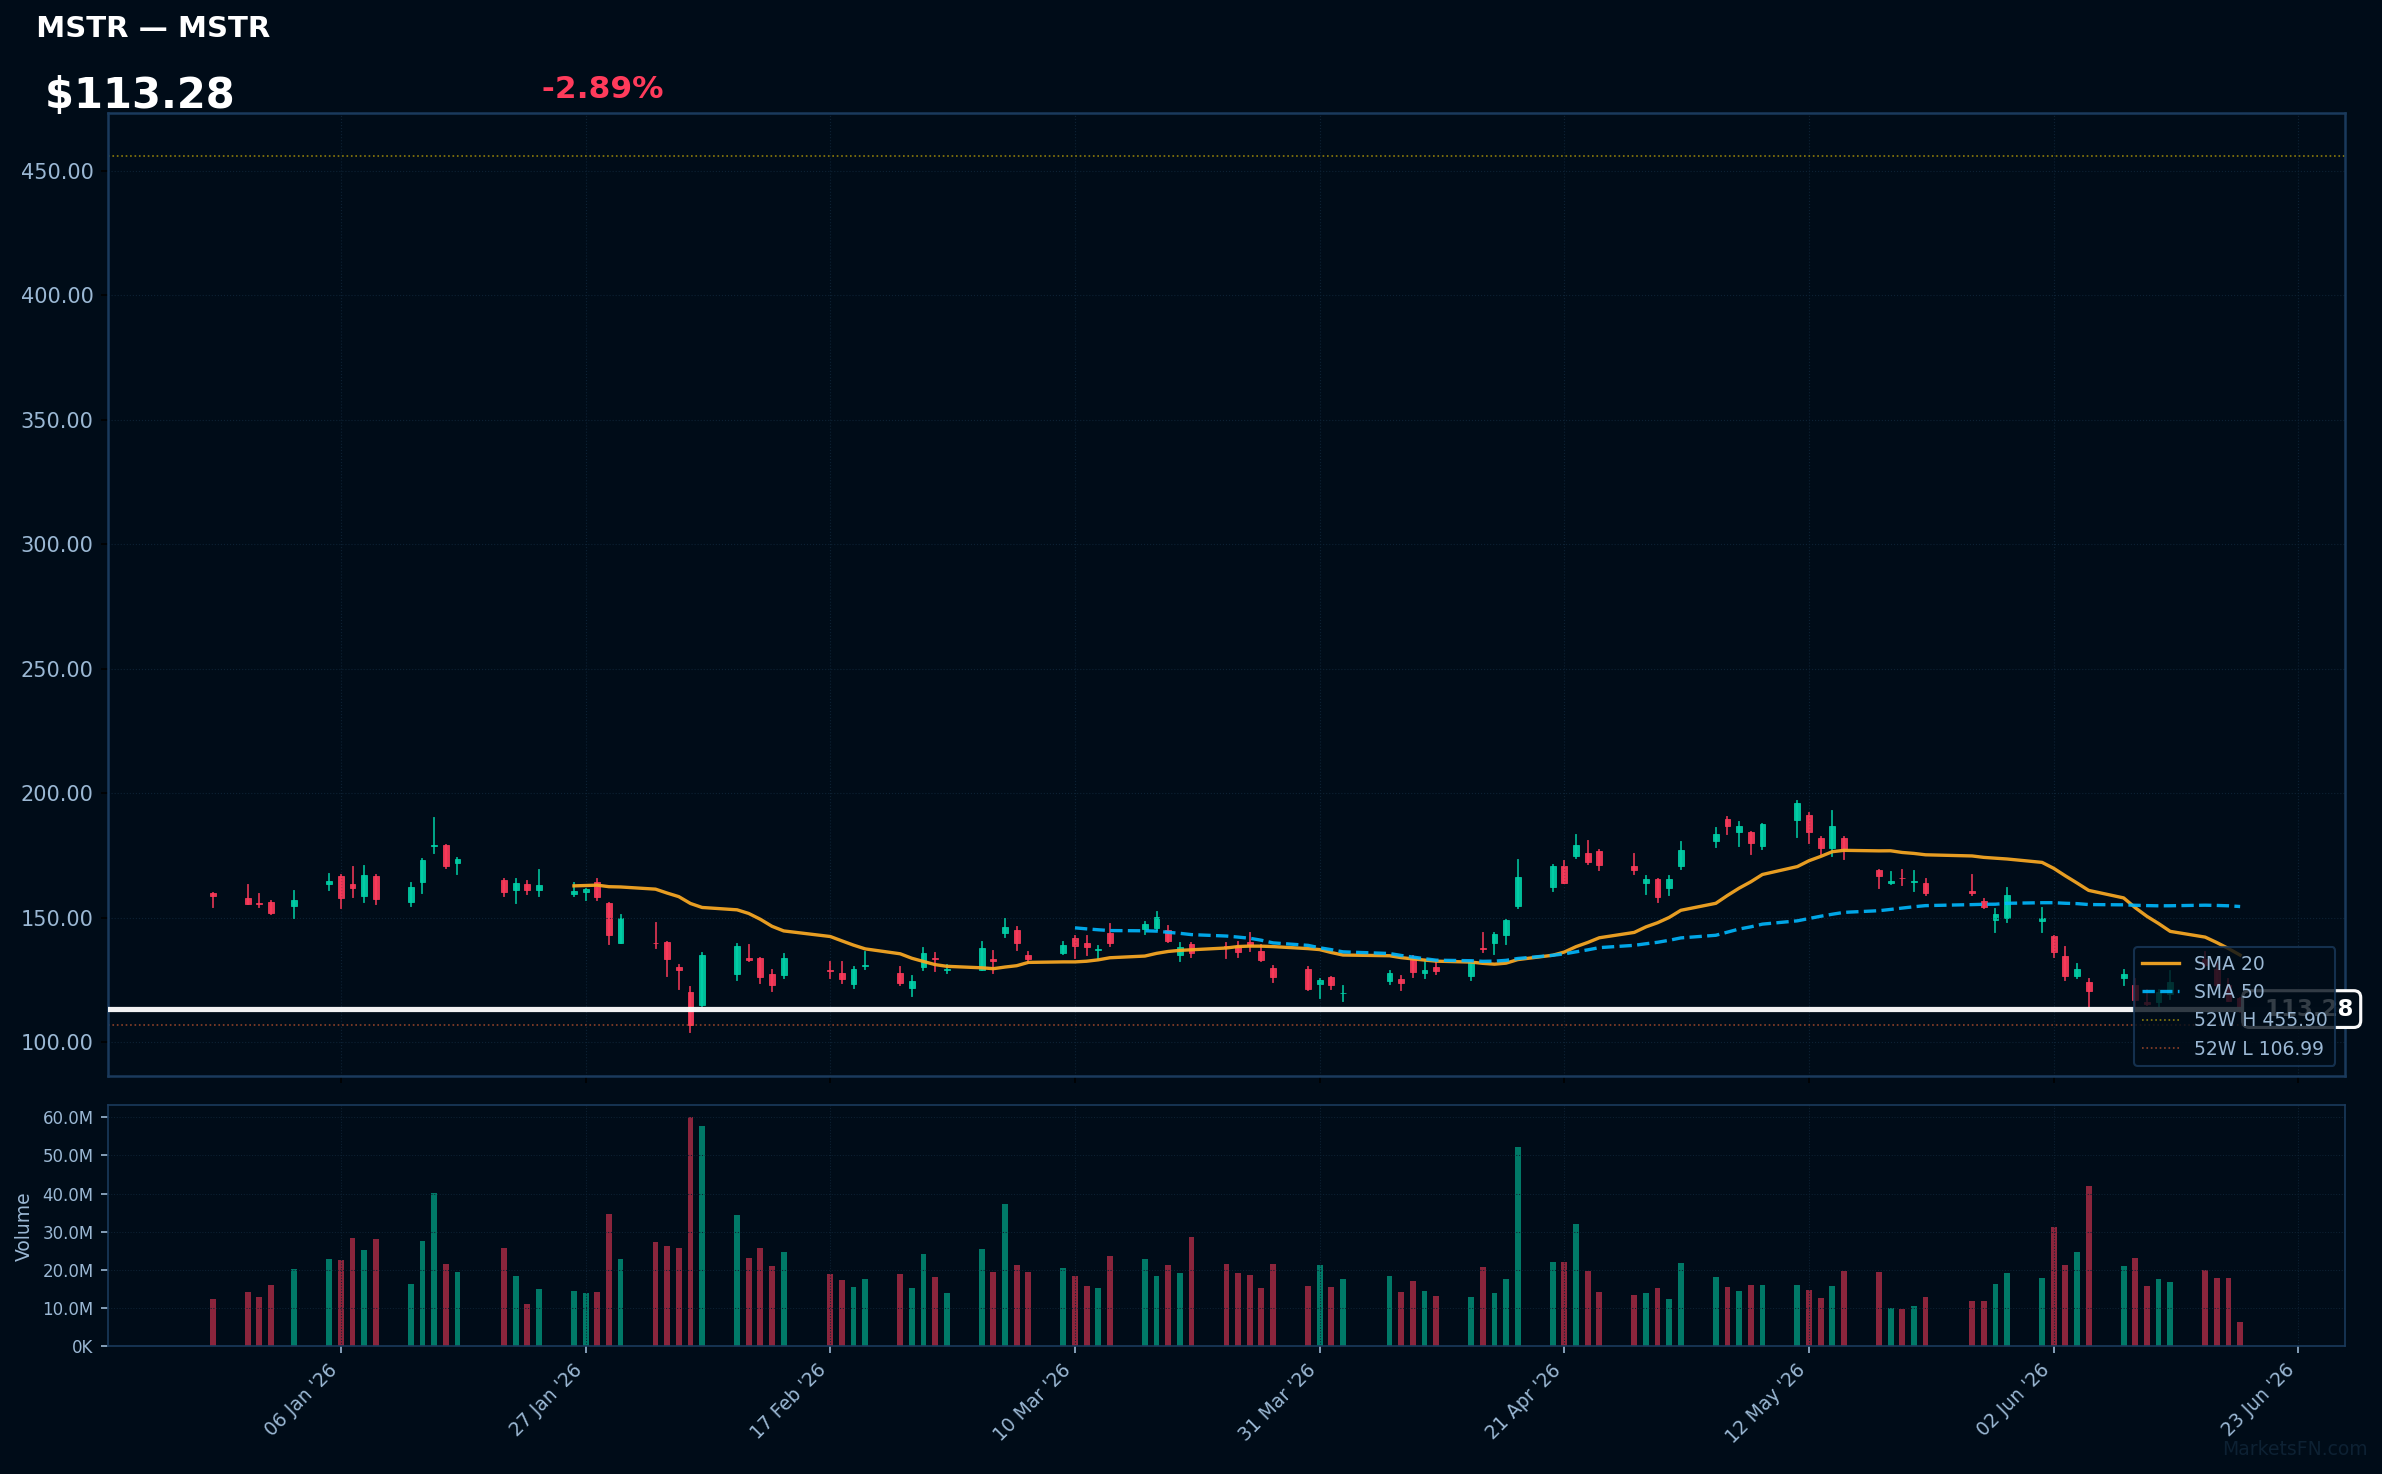
MSTR | Strategy Inc | Technology | Price: $113.19 | Day: -2.89% | 1W: -5.72% | 1M: -31.19% | RSI: 34.3 | vs MA200: -41.0% | Trend: Below MA20, MA50, MA200
Recent headlines (last 12h)
- Strategys Preferred Stock Hits All-Time Low
- Why Strategy, Coinbase Stocks Are Rising When Bitcoin Is Falling
- Strategy's STRC Hits $89 Record Low: Is Peter Schiff's 'Death Spiral' Warning Coming True?
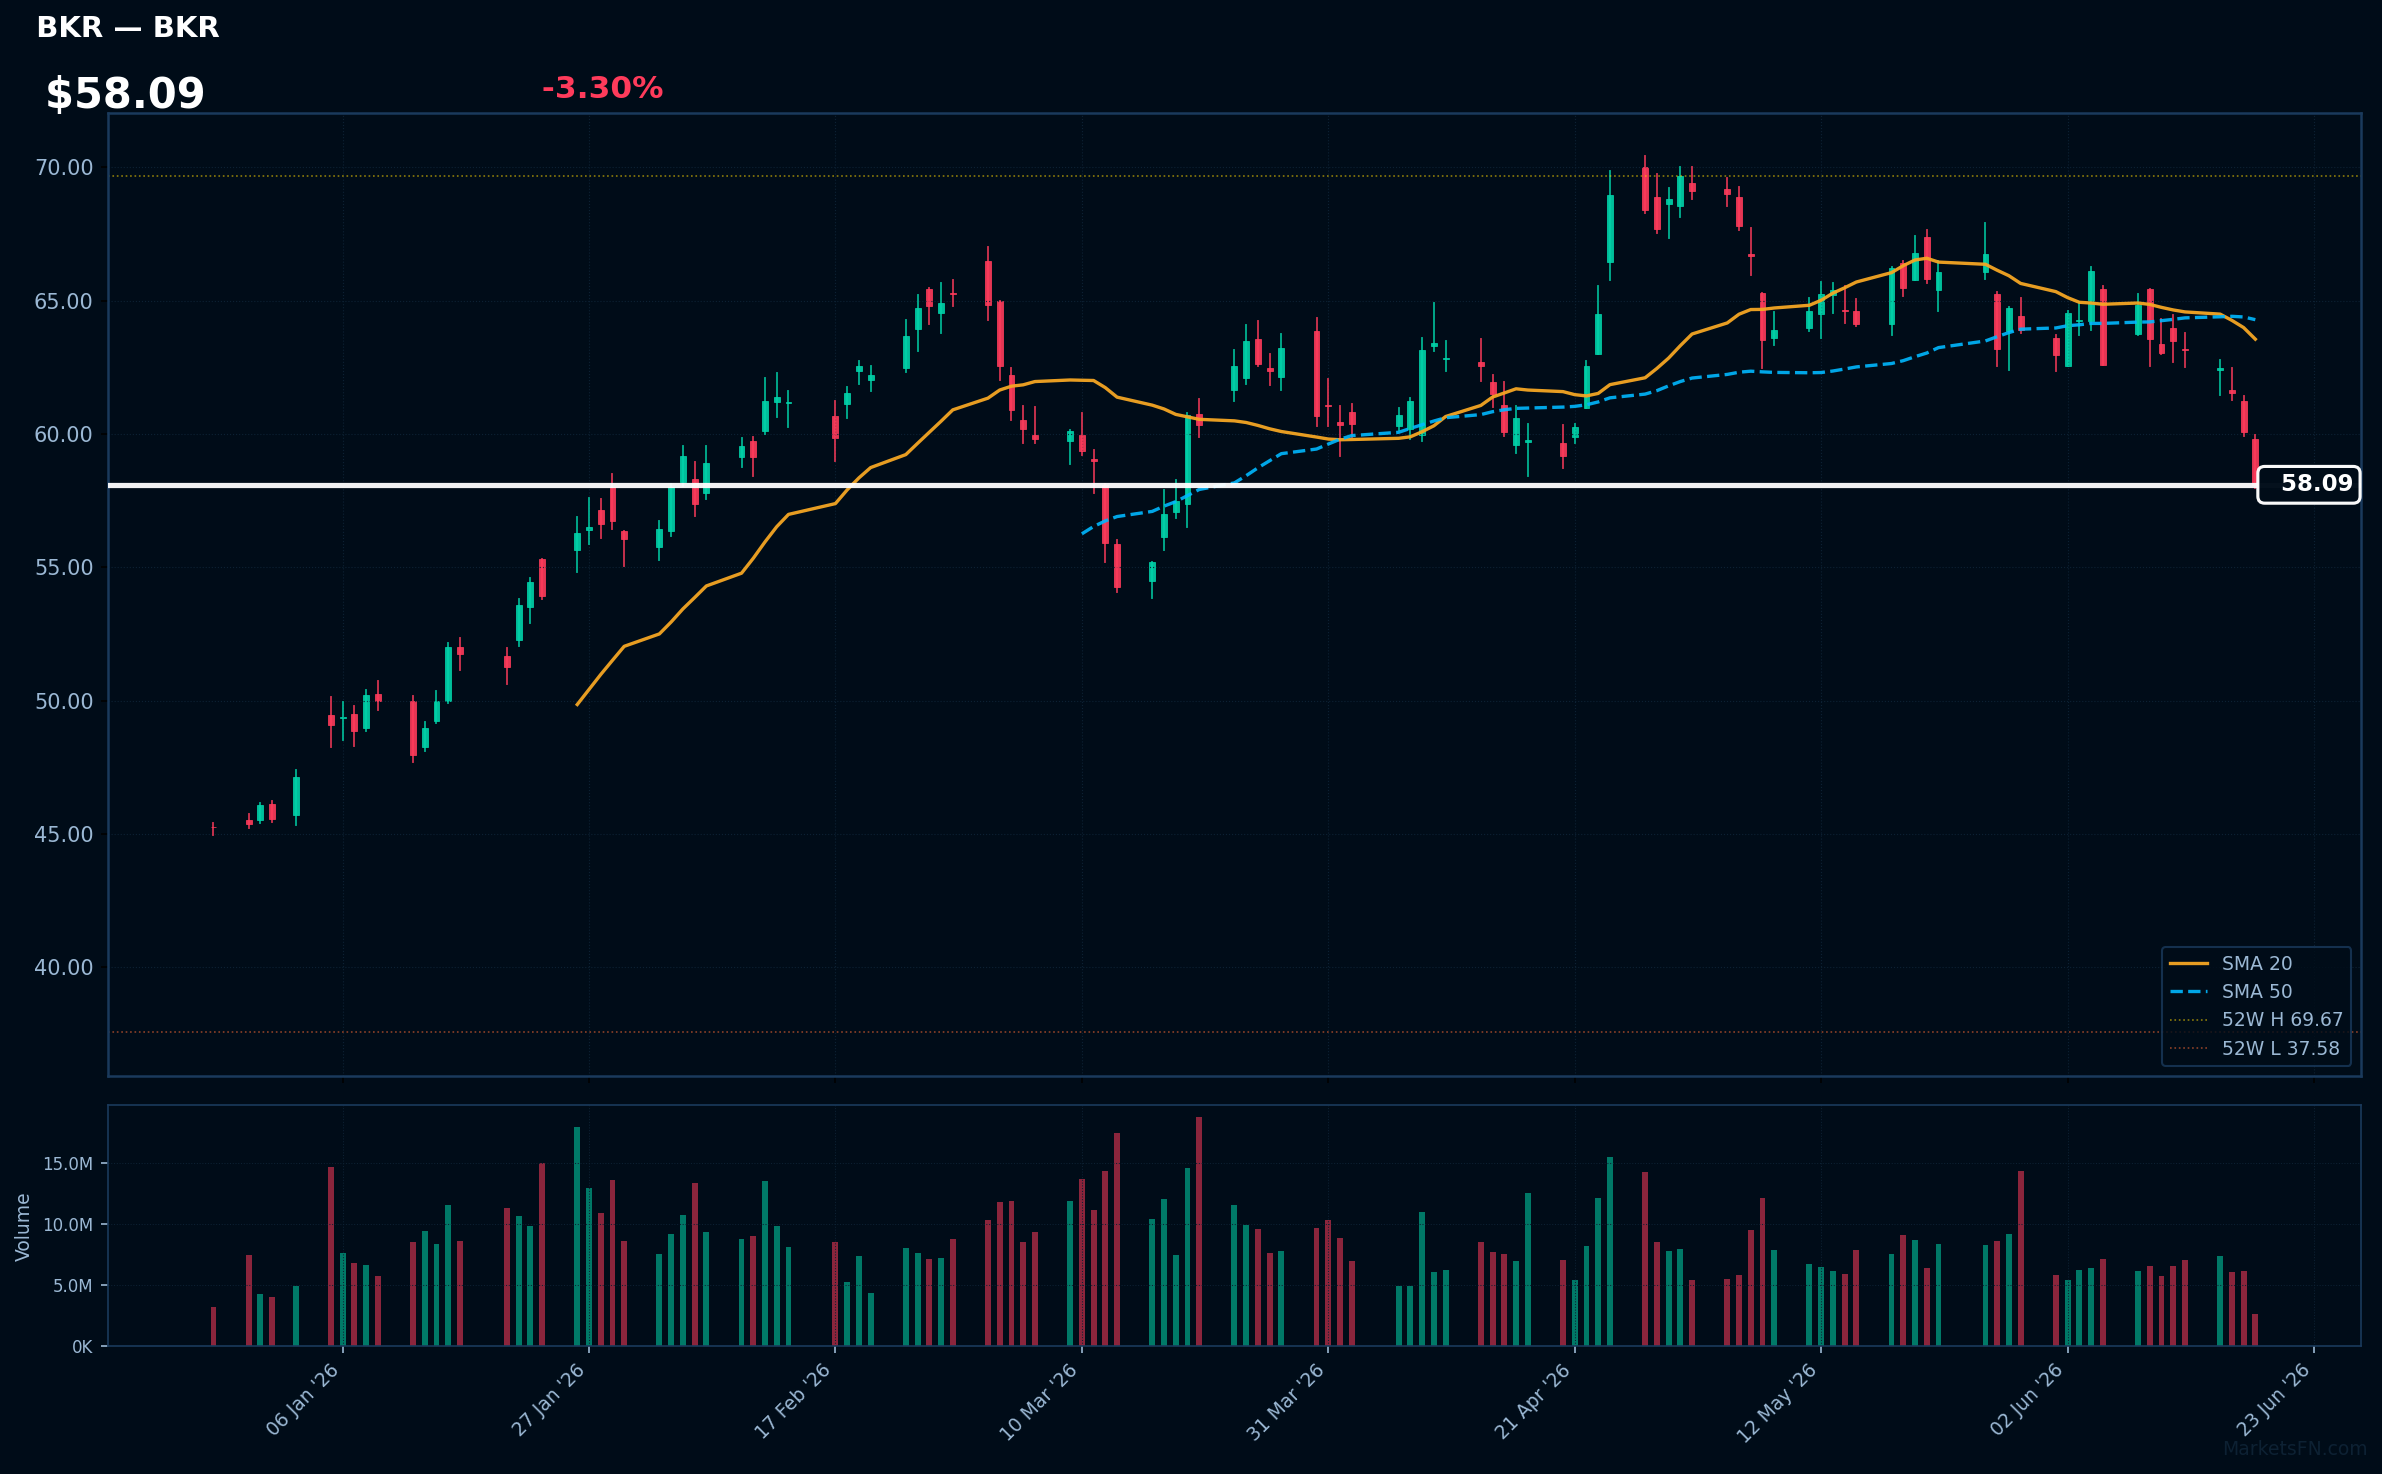
BKR | Baker Hughes Co | Energy | Price: $58.09 | Day: -3.30% | 1W: -8.49% | 1M: -11.27% | RSI: 33.5 | vs MA200: +5.3% | Trend: Above MA200 · Below MA20, MA50
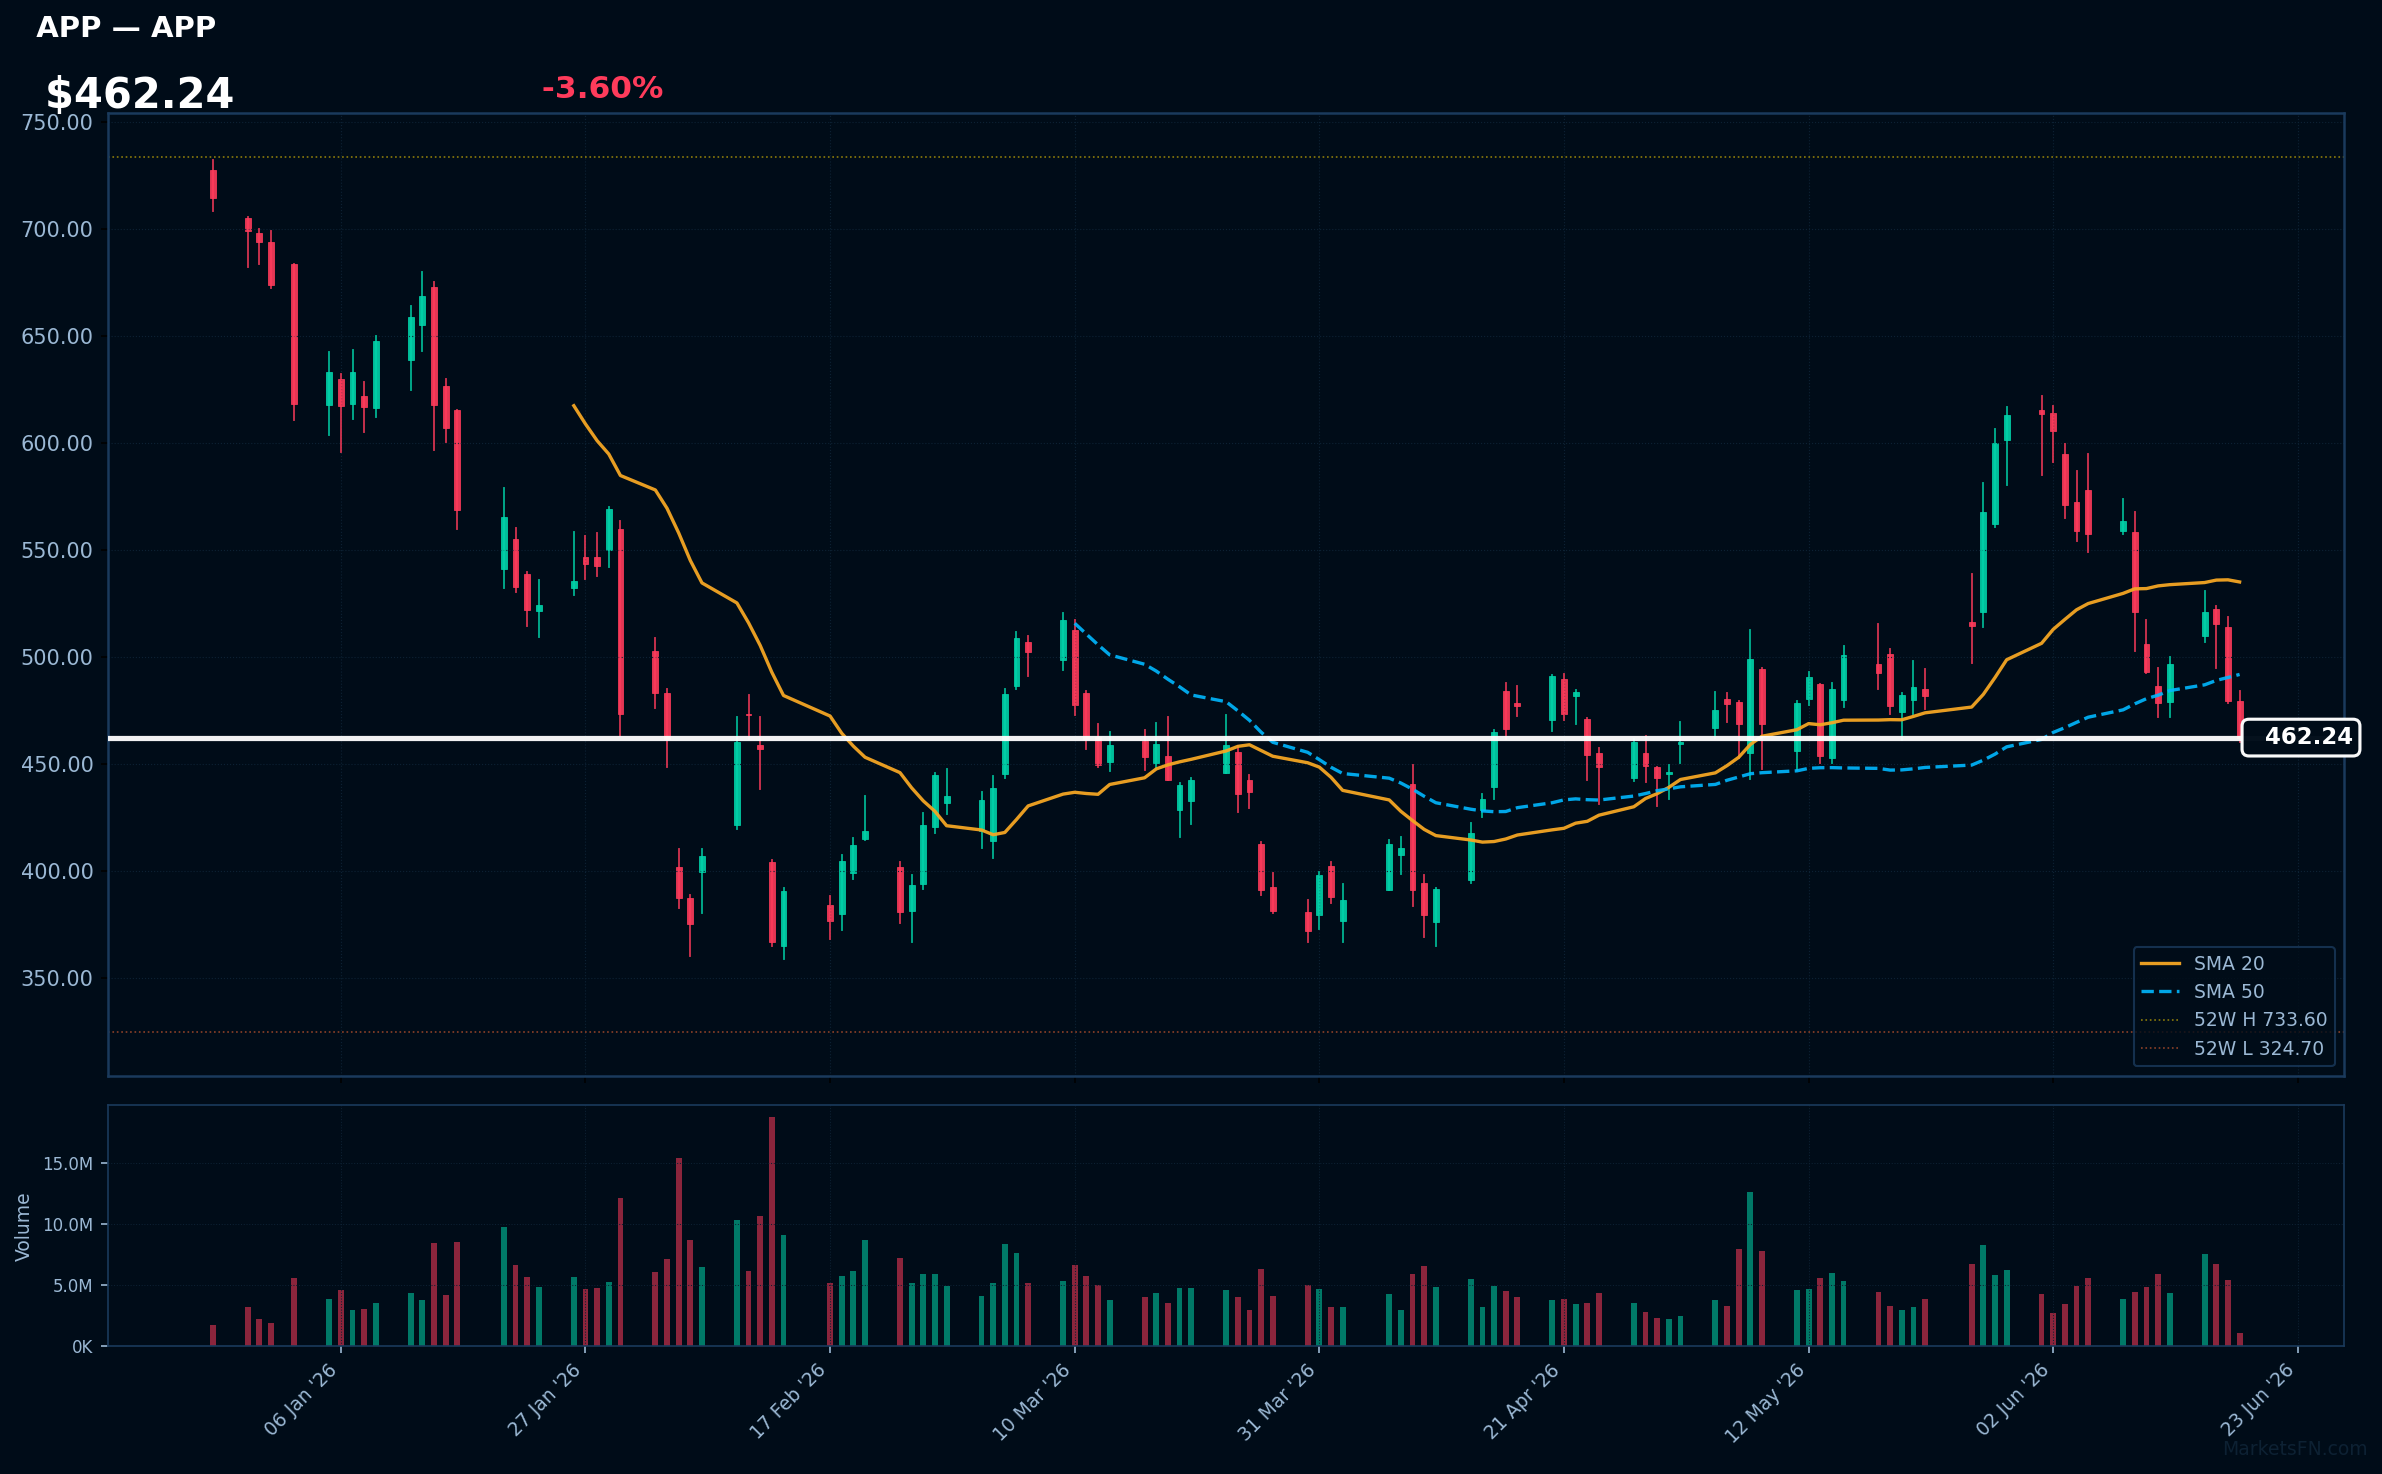
APP | Applovin Corp | Communication Services | Price: $462.24 | Day: -3.60% | 1W: -3.41% | 1M: -3.07% | RSI: 39.9 | vs MA200: -14.7% | Trend: Below MA20, MA50, MA200
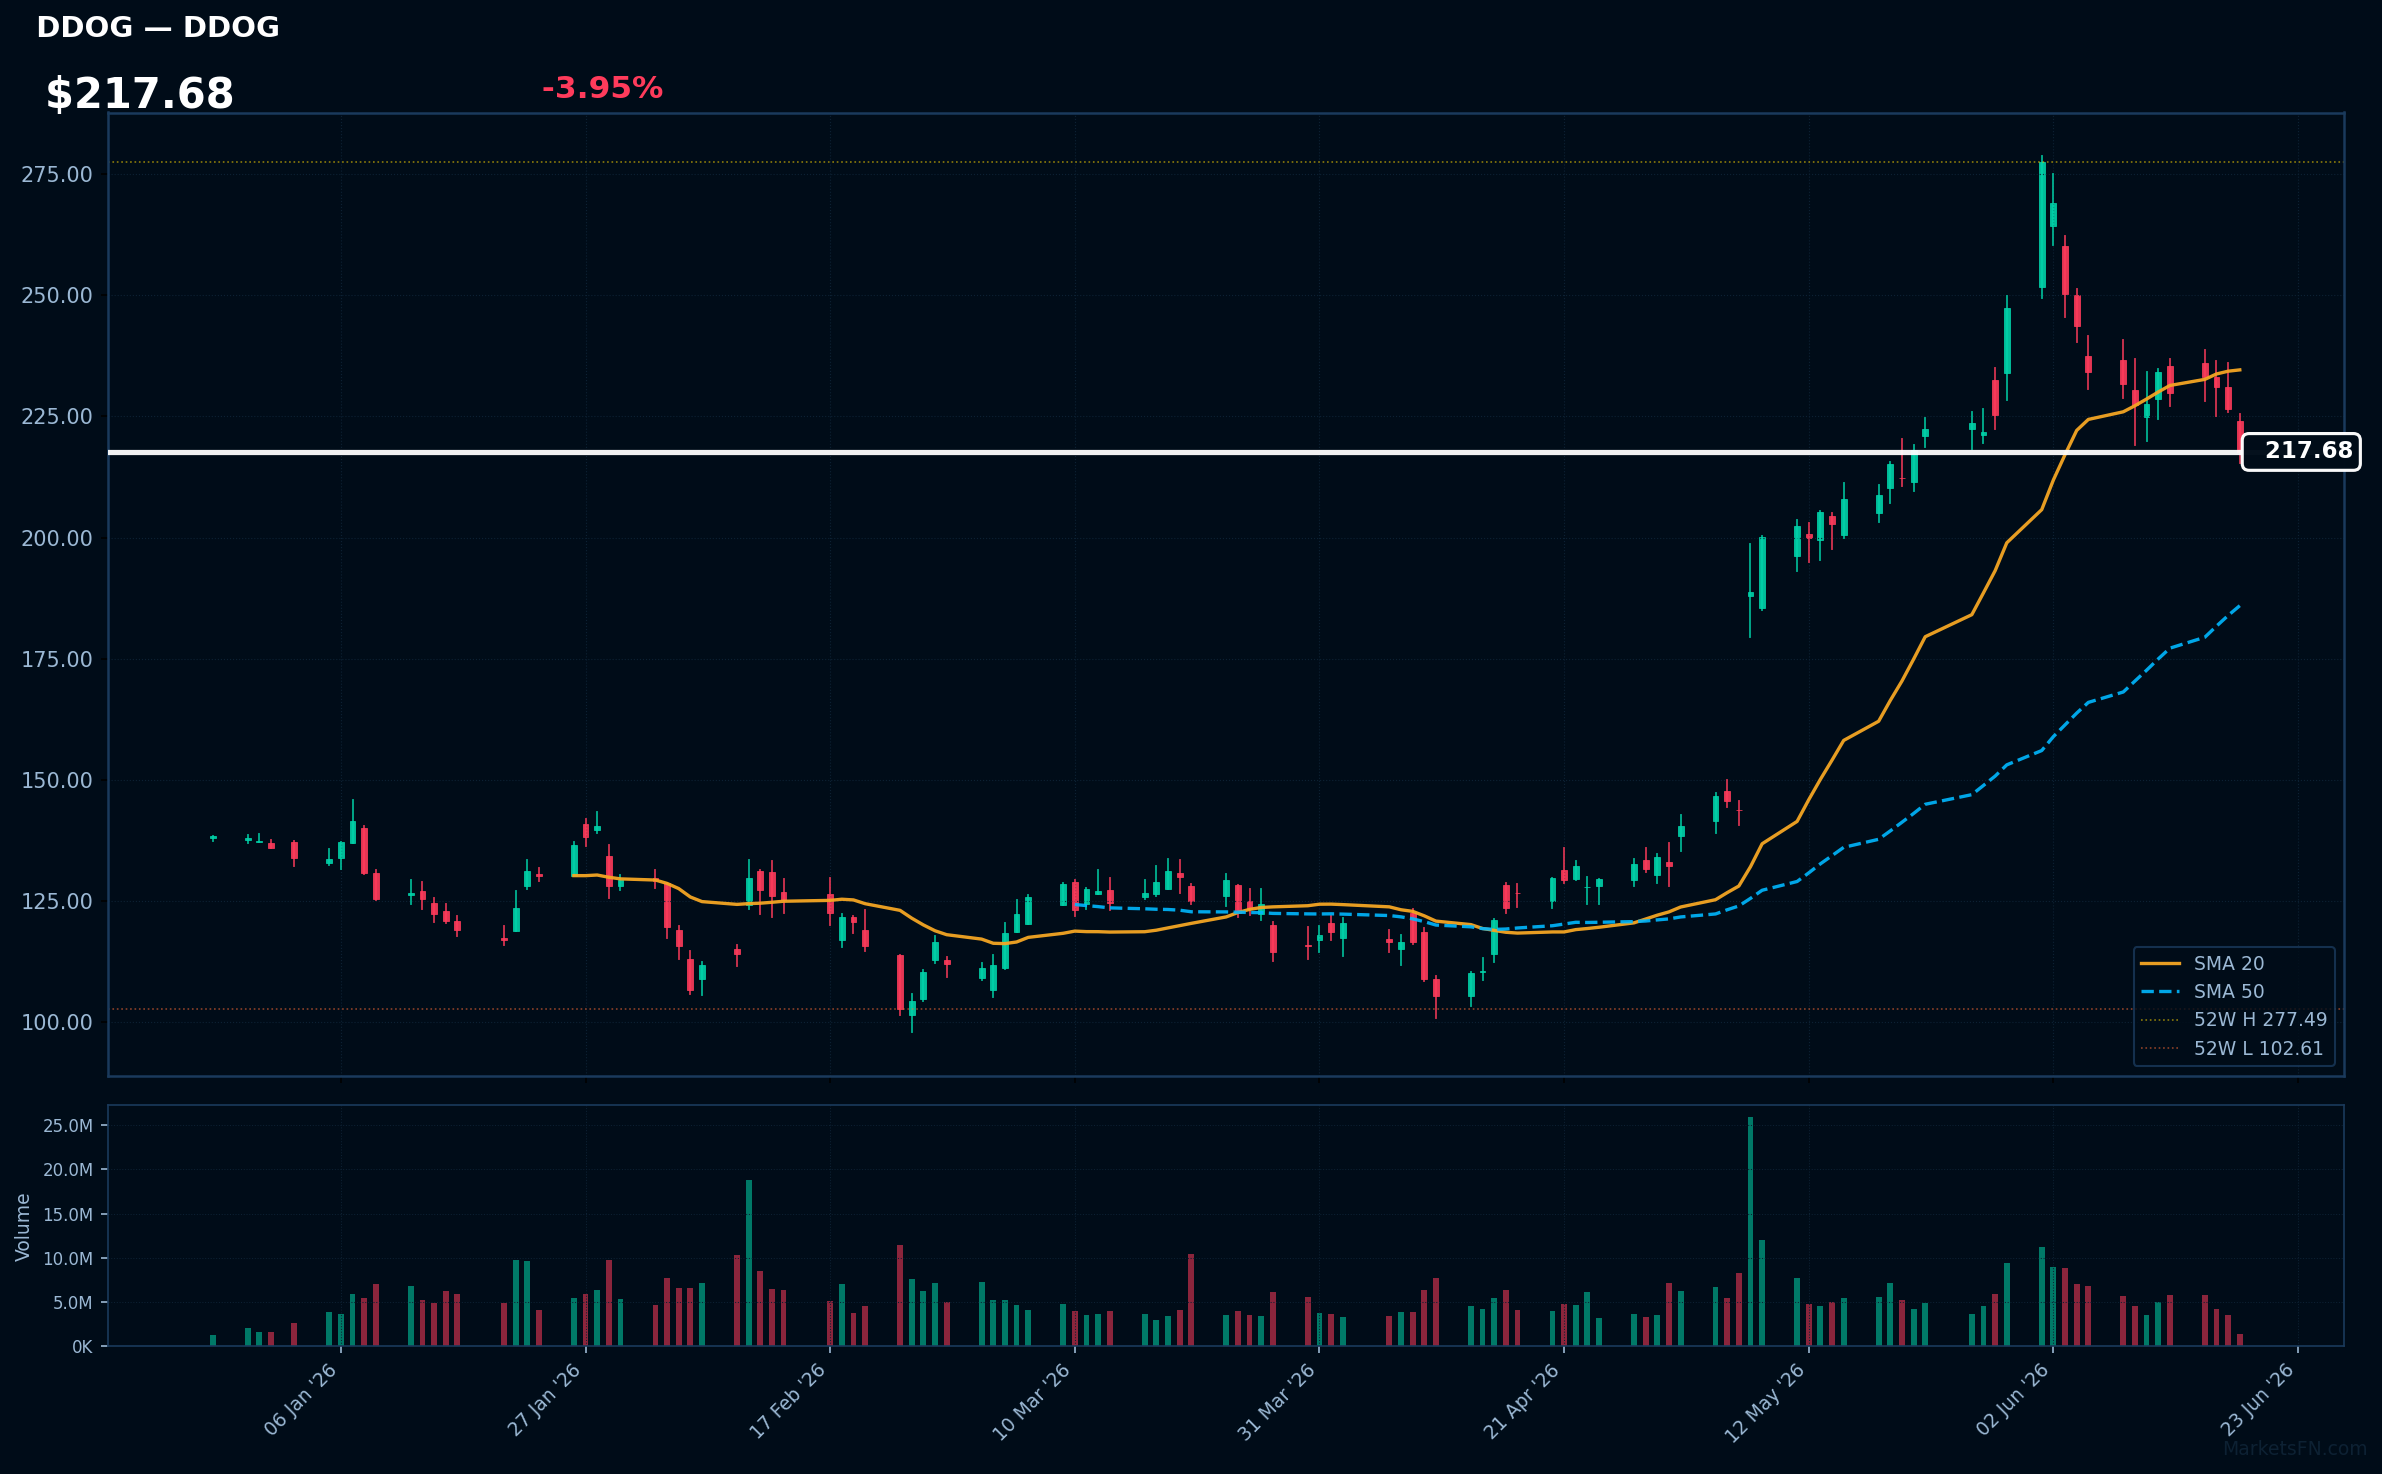
DDOG | Datadog Inc | Technology | Price: $217.68 | Day: -3.95% | 1W: -7.07% | 1M: +1.18% | RSI: 49.3 | vs MA200: +43.8% | Trend: Above MA50, MA200 · Below MA20
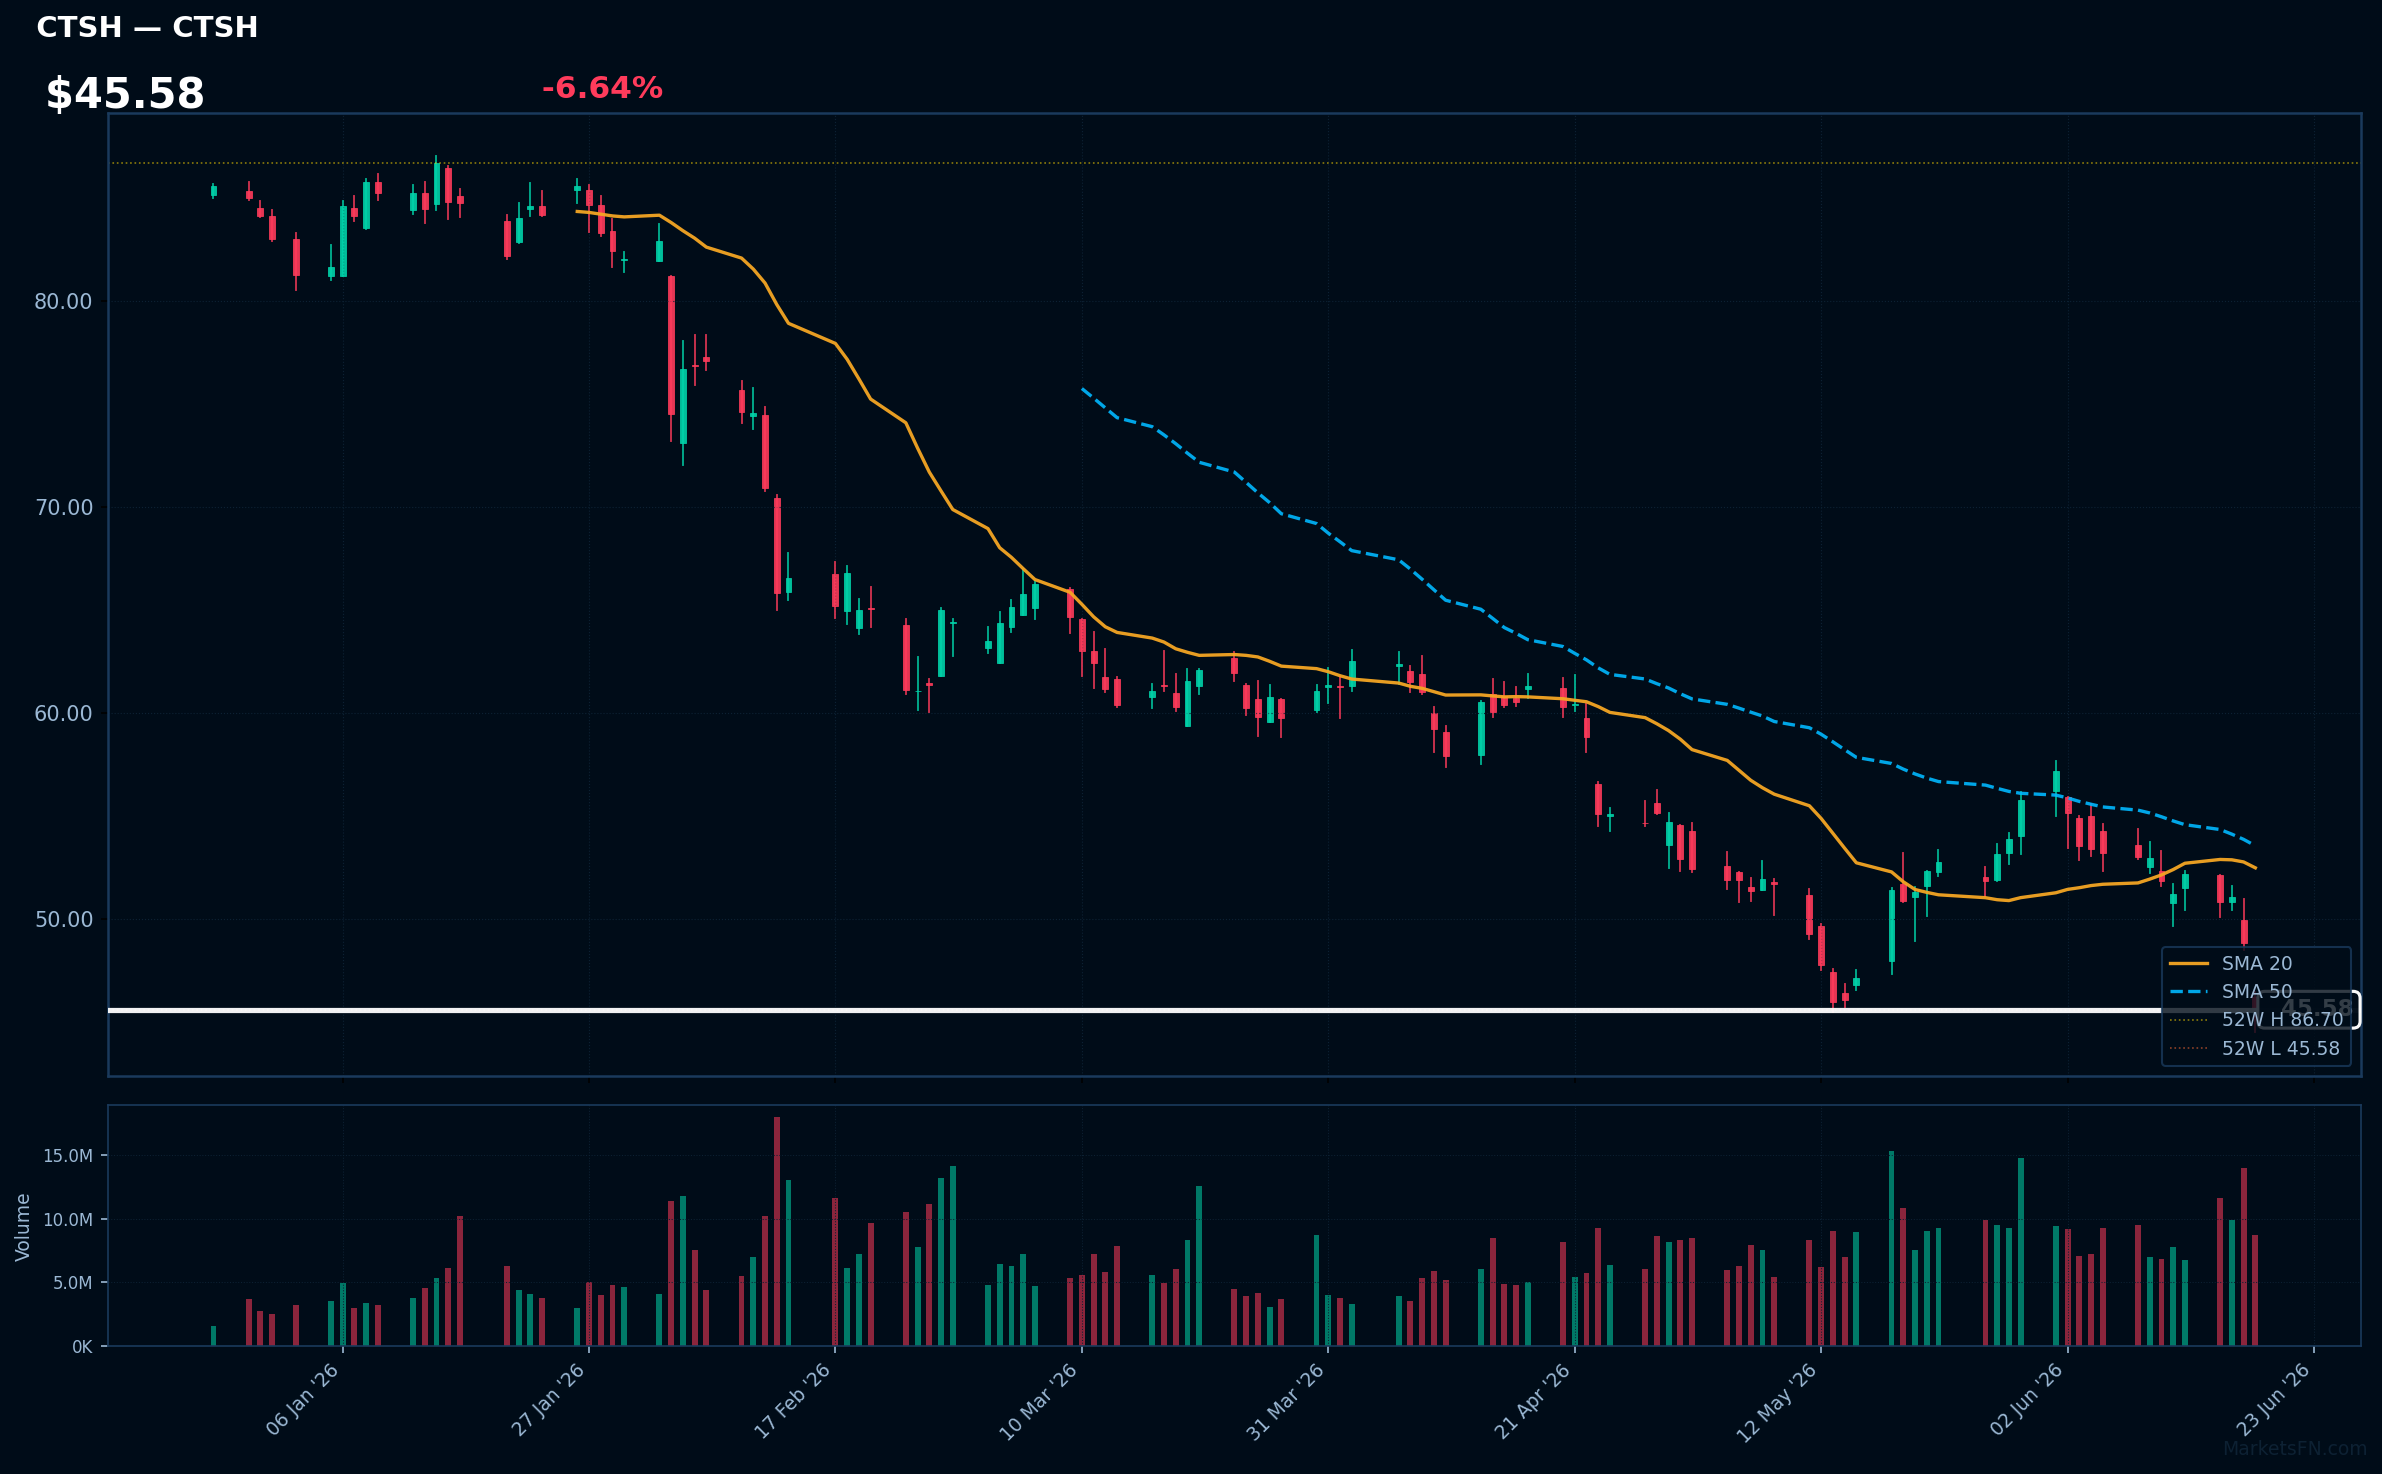
CTSH | Cognizant Technology Solutions Corp | Technology | Price: $45.58 | Day: -6.64% | 1W: -10.94% | 1M: -10.42% | RSI: 28.6 | vs MA200: -32.6% | Trend: Below MA20, MA50, MA200
Recent headlines (last 12h)
- Cognizant expands cross-platform agentic AI with new ServiceNow AI Agent interoperability
- Accenture strikes $4.18 billion cybersecurity deal, shares fall on weak forecast
- Entry-Level Work Remains Essential: 94% of HR Leaders Expect AI to Create New Entry-Level Roles, Cognizant and Pearson Study Reveals
Market Commentary
The Nasdaq 100 session on June 18, 2026, showed a positive tone with 60 constituents advancing (59.4%) against 41 declining (40.6%), accompanied by an average daily change of +0.87%. This indicates a relatively broad-based rally, though not uniformly strong across all holdings.
Technology sector dynamics were mixed, with top gainers like MRVL, KLAC, and TXN leading the upside, while tech stocks like ZS, FANG, and CTSH were among the top losers. The presence of both tech leaders and laggards among the top movers suggests rotation within the sector rather than a uniform trend. Industrials and other sectors also saw significant decliners, indicating a more nuanced market move.
With only 13 stocks (12.9%) trading above their MA200, the index remains vulnerable to further consolidation. Traders should watch the MA200 level closely, as a sustained move above it could signal a shift in the longer-term trend. The next catalyst will be the upcoming earnings reports from key constituents, which could either validate or invalidate the current market tone.
Methodology
Daily ranking uses the latest session close versus the prior close. RSI (14-day EWM), MA20, MA50, and MA200 are computed from 12 months of daily OHLCV data sourced from Yahoo Finance. Charts show the last 120 trading sessions with SMA 20/50, 52-week H/L markers, and volume. Recent news (last 12 h) is sourced from FinViz. Updated every trading day.
Disclaimer
The content on MarketsFN.com is provided for educational and informational purposes only. It does not constitute financial advice, investment recommendations, or trading guidance. All investments involve risks, and past performance does not guarantee future results. You are solely responsible for your investment decisions and should conduct independent research and consult a qualified financial advisor before acting. MarketsFN.com and its authors are not liable for any losses or damages arising from your use of this information.
Related Articles
- Nasdaq 100 52-Week Highs & Lows Radar: ASML Holding NV (ASML), Palantir (PLTR) and more — Nasdaq 100 stocks nearest to their 52-week high and low. Bloomberg-style charts, RSI/MA analysis and Grok commentary.
- The Kroger Co. (KR) Sinks 6.80% After Earnings — Post Earning Analysis The Kroger Co. (KR) Sinks 6.80% After Earnings The Kroger Co. operates a chain of supermarkets…
- Kroger (KR) quarter year Kroger Co. Financial Results Summary — Kroger (KR) Q1 2026: Earnings Growth Amidst Sales Pressure — Cautiously Optimistic Kroger Co. (NYSE: KR) reported its…
- S&P 500 52-Week Highs & Lows Radar: JPMorgan Chase & (JPM), Palantir (PLTR) and more — S&P 500 stocks nearest to their 52-week high and low. Bloomberg-style charts, RSI/MA analysis and Grok commentary.
- Smith & Wesson Brands (SWBI) SWBI Q4 Financial Results Summary — Smith & Wesson Brands, Inc. (SWBI) Q4 2026: Strong Revenue Growth and Improved Profitability — Positive Outlook Smith &…