Ripple Dips to $1.03 as RSI Nears Oversold Zone
· Crypto · QuoteReporter
Ripple Dips to $1.03 as RSI Nears Oversold Zone
Ripple (XRP/USD) | June 26, 2026 $1.0369 -0.46%
🔍 Technical Analysis
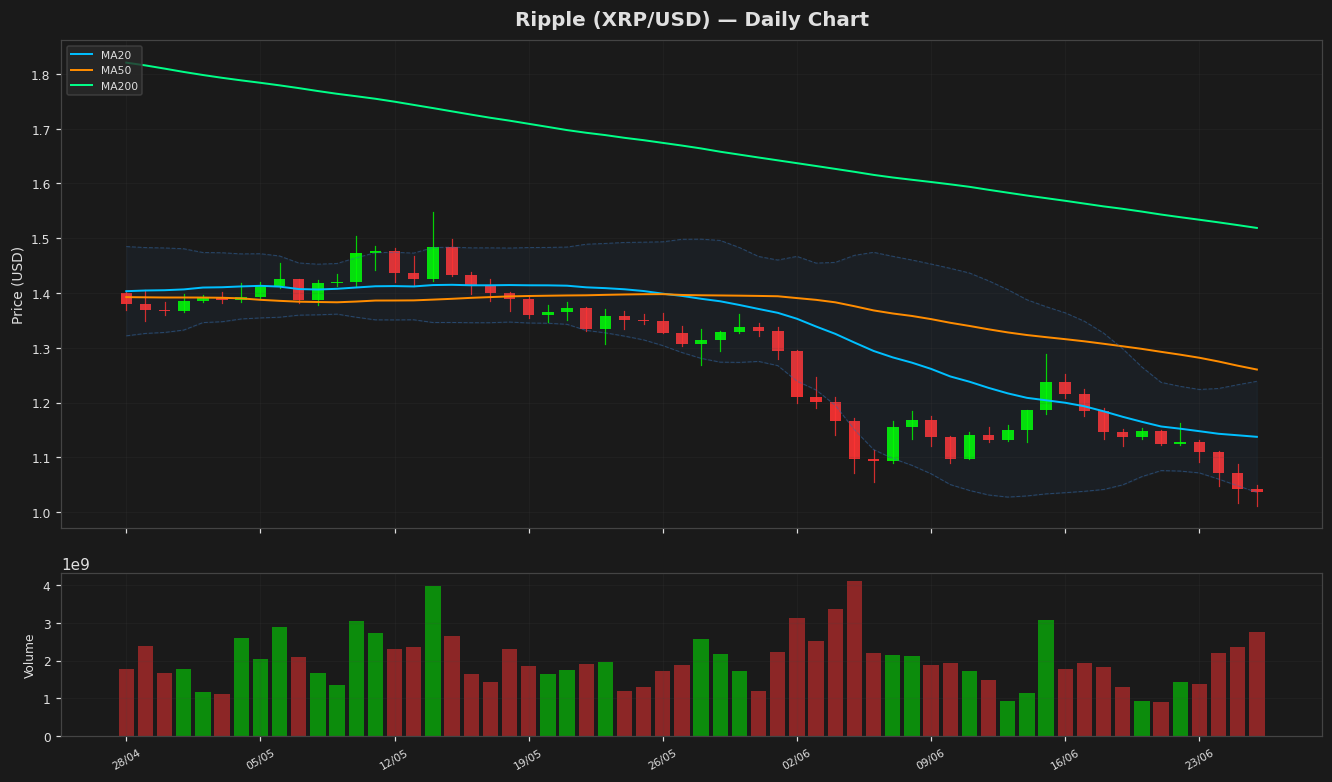
Ripple (XRP) is currently trading at $1.036900, down 0.46% on the day, reflecting bearish pressure in the short term. The price remains below key moving averages, with the MA20 at $1.137513, MA50 at $1.260366, and MA200 at $1.518836, indicating a sustained downtrend. The Bollinger Bands show the upper band at $1.238837 and the lower band at $1.036188, with the price hovering near the lower band, suggesting potential oversold conditions. The RSI(14) at 36.056357 is nearing oversold territory but has not yet signaled a reversal. The MACD histogram is negative at -0.050378, with the signal line at -0.044414, reinforcing bearish momentum.
Key support levels to watch are the recent low at $1.01082575 (52-week low) and psychological support at $1.000. Resistance levels include the MA20 at $1.137513 and the upper Bollinger Band at $1.238837. The ATR(14) at 0.048416 indicates moderate volatility. XRP faces significant overhead resistance, with the 52-week high at $2.69344711 and YTD high at $2.41026402, highlighting the extent of the downtrend. A break below $1.01082575 could trigger further declines, while a move above the MA20 may signal short-term recovery. Traders should monitor RSI for potential divergence and MACD for crossover signals to gauge momentum shifts.
Key support levels to watch are the recent low at $1.01082575 (52-week low) and psychological support at $1.000. Resistance levels include the MA20 at $1.137513 and the upper Bollinger Band at $1.238837. The ATR(14) at 0.048416 indicates moderate volatility. XRP faces significant overhead resistance, with the 52-week high at $2.69344711 and YTD high at $2.41026402, highlighting the extent of the downtrend. A break below $1.01082575 could trigger further declines, while a move above the MA20 may signal short-term recovery. Traders should monitor RSI for potential divergence and MACD for crossover signals to gauge momentum shifts.
Technical Metrics
| Metric | Value |
|---|---|
| Current Price | $1.0369 |
| Daily Change | -0.46% |
| MA 20 | $1.1375 |
| % from MA20 | -8.84% |
| MA 50 | $1.2604 |
| % from MA50 | -17.73% |
| MA 200 | $1.5188 |
| % from MA200 | -31.73% |
| BB Upper | $1.2388 |
| % from BB Upper | -16.30% |
| BB Lower | $1.0362 |
| % from BB Lower | +0.07% |
| RSI (14) | 36.06 |
| MACD | -0.050378 |
| MACD Signal | -0.044414 |
| ATR (14) | 0.048416 |
| 3-Day High | $1.1113 |
| 3-Day Low | $1.0108 |
| 52-Week High | $2.6934 |
| % from 52W High | -61.50% |
| 52-Week Low | $1.0108 |
| % from 52W Low | +2.58% |
| YTD High | $2.4103 |
| % from YTD High | -56.98% |
| YTD Low | $1.0108 |
| % from YTD Low | +2.58% |
📊 Market Commentary
Ripple (XRP) is currently trading at $1.0369, down 0.46% today, as the broader cryptocurrency market shows mixed sentiment. The Relative Strength Index (RSI) at 36.1 suggests XRP is nearing oversold territory, which could attract buyers looking for short-term opportunities. However, the lack of strong momentum indicates cautious trading, with investors weighing macroeconomic factors and regulatory developments.
XRP’s 52-week range of $1.0108 to $2.6934 highlights its volatility, with the current price hovering just above the lower bound. Traders are closely monitoring the $1.00 psychological support level, as a break below could trigger further downside toward the yearly low. On the upside, resistance near $1.10 remains a key hurdle, with a sustained move above needed to shift sentiment more bullish.
Market participants are also watching regulatory updates, particularly regarding Ripple’s ongoing legal case with the SEC, as any resolution could significantly impact XRP’s liquidity and adoption. Additionally, broader crypto market trends, including Bitcoin’s performance, continue to influence XRP’s price action. Trading volumes have been relatively subdued, reflecting a wait-and-see approach among investors.
For now, XRP remains in a consolidation phase, with technical indicators suggesting potential for either a rebound or further weakness depending on market conditions. Traders are advised to watch key support and resistance levels alongside external catalysts for clearer directional cues.
Disclaimer
The content on MarketsFN.com is provided for educational and informational purposes only. It does not constitute financial advice or investment recommendations. All investments involve risk. Cryptocurrency markets are highly volatile. Past performance does not guarantee future results.