Ripple Dips to $1.10 as Bearish Pressure Mounts, RSI Neutral
· Crypto · QuoteReporter
Ripple Dips to $1.10 as Bearish Pressure Mounts, RSI Neutral
Ripple (XRP/USD) | June 23, 2026 $1.1021 -2.35%
🔍 Technical Analysis
### **Technical Analysis: Ripple (XRP)**
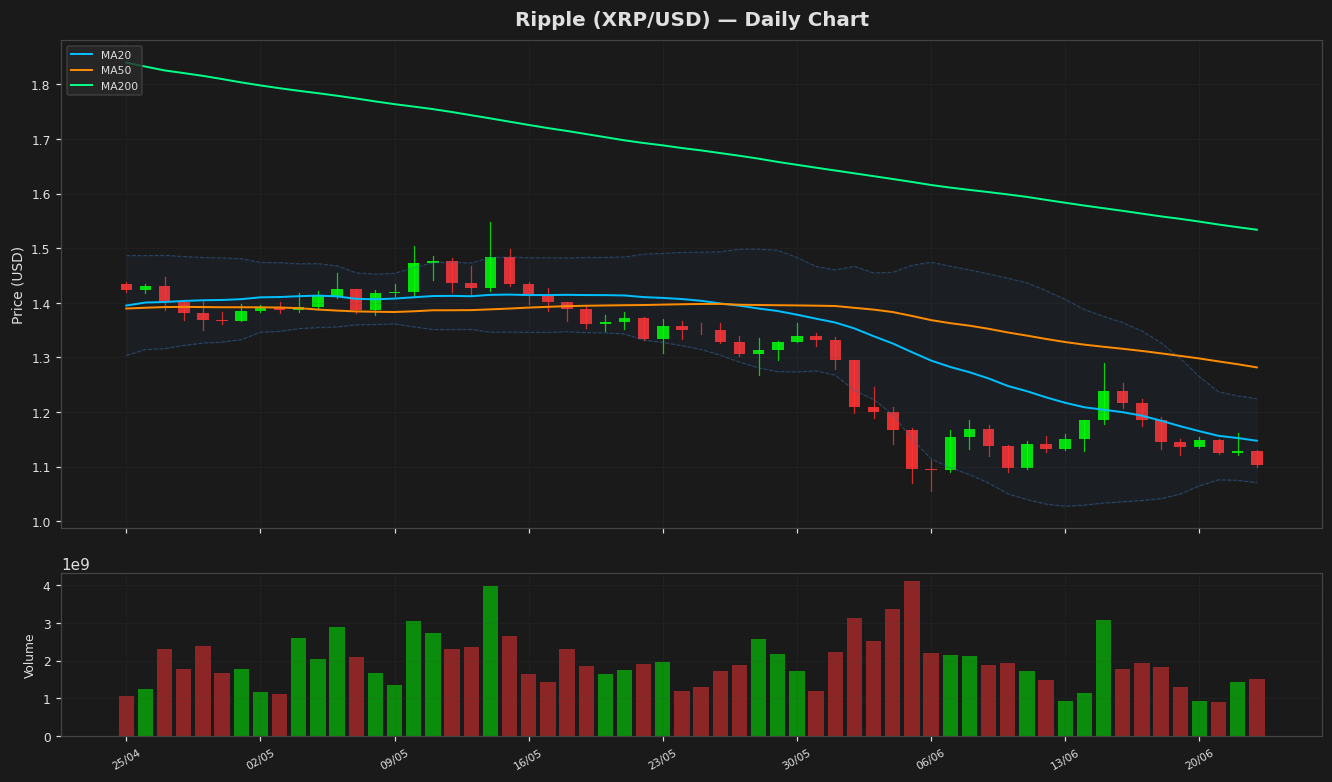
Ripple (XRP) is currently trading at **$1.102100**, down **2.35%** on the day, reflecting short-term bearish pressure. The price remains below key moving averages, with the **20-day MA at $1.147434**, **50-day MA at $1.281703**, and **200-day MA at $1.533791**, indicating a broader downtrend. The widening gap between these averages suggests persistent selling momentum.
Bollinger Bands show **upper resistance at $1.22444** and **lower support at $1.070429**, with price hovering near the lower band, signaling potential oversold conditions. However, the **RSI(14) at 45.248681** remains neutral, neither confirming oversold nor overbought levels. The **MACD (-0.039792)** is below its signal line (-0.041878), reinforcing bearish momentum, though the histogram shows minimal divergence.
Key support lies at the **52-week low of $1.05465698**, while resistance is seen at the **20-day MA ($1.147434)** and **Bollinger mid-band (~$1.147434)**. A break below $1.05465698 could trigger further downside toward psychological support at $1.00. Conversely, reclaiming the 20-day MA may signal a short-term recovery.
Given the **ATR(14) of 0.044773**, volatility remains moderate, but a decisive move outside the Bollinger Bands could accelerate momentum. Traders should watch for RSI divergence or MACD crossover for potential trend reversals.
Technical Metrics
| Metric | Value |
|---|---|
| Current Price | $1.1021 |
| Daily Change | -2.35% |
| MA 20 | $1.1474 |
| % from MA20 | -3.95% |
| MA 50 | $1.2817 |
| % from MA50 | -14.01% |
| MA 200 | $1.5338 |
| % from MA200 | -28.15% |
| BB Upper | $1.2244 |
| % from BB Upper | -9.99% |
| BB Lower | $1.0704 |
| % from BB Lower | +2.96% |
| RSI (14) | 45.25 |
| MACD | -0.039792 |
| MACD Signal | -0.041878 |
| ATR (14) | 0.044773 |
| 3-Day High | $1.1621 |
| 3-Day Low | $1.0988 |
| 52-Week High | $2.6934 |
| % from 52W High | -59.08% |
| 52-Week Low | $1.0547 |
| % from 52W Low | +4.50% |
| YTD High | $2.4103 |
| % from YTD High | -54.27% |
| YTD Low | $1.0547 |
| % from YTD Low | +4.50% |
📊 Market Commentary
**Ripple (XRP) Market Commentary**
XRP is trading at **$1.1021**, down **2.35%** today, as the broader crypto market experiences mild bearish pressure. The Relative Strength Index (RSI) at **45.2** suggests neutral momentum, neither oversold nor overbought, indicating a lack of strong directional bias in the short term. Over the past 52 weeks, XRP has traded between **$1.0547 and $2.6934**, reflecting significant volatility, particularly influenced by regulatory developments and broader market trends.
Market sentiment remains cautious as traders monitor key support and resistance levels. Immediate support lies near **$1.05**, the lower end of the 52-week range, which has held firm in recent weeks. A break below this level could signal further downside toward **$0.90**. On the upside, resistance is seen around **$1.20**, followed by the psychological **$1.50** level, which has acted as a barrier in previous rallies.
Traders are closely watching regulatory updates, particularly the ongoing SEC case, which continues to weigh on sentiment. Additionally, broader macroeconomic factors, including Bitcoin’s price action and risk appetite in traditional markets, remain key drivers. Volume has been subdued, suggesting limited conviction in either direction. For now, XRP appears range-bound, with a neutral RSI reinforcing the need for a catalyst to break out of its current consolidation.
Disclaimer
The content on MarketsFN.com is provided for educational and informational purposes only. It does not constitute financial advice or investment recommendations. All investments involve risk. Cryptocurrency markets are highly volatile. Past performance does not guarantee future results.