Ripple Eyes Recovery as RSI Nears Oversold at $1.08
· Crypto · QuoteReporter
Ripple Eyes Recovery as RSI Nears Oversold at $1.08
Ripple (XRP/USD) | June 25, 2026 $1.0818 +0.89%
🔍 Technical Analysis
### Technical Analysis: Ripple (XRP)
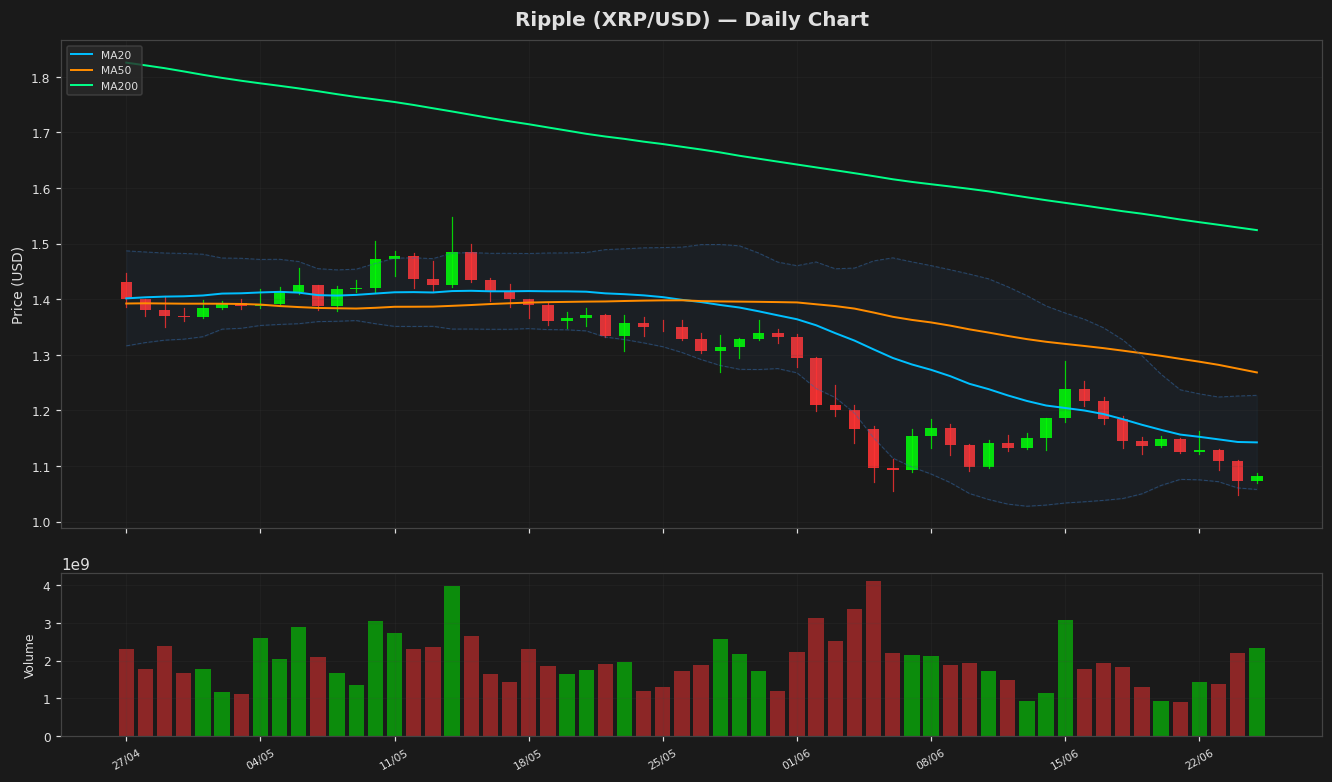
Ripple (XRP) is currently trading at **$1.0818**, up **0.89%** on the day, but remains in a bearish trend as it struggles below key moving averages. The **20-day MA ($1.1423)** and **50-day MA ($1.2682)** act as resistance levels, confirming the downtrend, while the **200-day MA ($1.5242)** looms overhead, reinforcing the long-term bearish bias.
Bollinger Bands show price hovering near the **lower band ($1.0577)**, indicating potential oversold conditions, though volatility remains subdued with the bands narrowing. The **RSI (14) at 40.80** suggests mild bearish momentum but is not yet oversold. The **MACD (-0.0438)** remains below its signal line (-0.0423), reinforcing bearish sentiment, though the histogram shows slight convergence, hinting at weakening downward pressure.
Key support lies at the **52-week low ($1.0473)**, a critical level that, if broken, could trigger further downside. Resistance is seen at the **20-day MA ($1.1423)** and the upper Bollinger Band ($1.2270). A breakout above the 20-day MA could signal a short-term reversal, but sustained bullish momentum would require reclaiming the **50-day MA ($1.2682)**.
Given the weak MACD and RSI below neutrality, XRP remains vulnerable to further declines unless buying pressure increases significantly. Traders should watch for a break above the 20-day MA or a hold above $1.0473 for directional cues.
Technical Metrics
| Metric | Value |
|---|---|
| Current Price | $1.0818 |
| Daily Change | +0.89% |
| MA 20 | $1.1423 |
| % from MA20 | -5.30% |
| MA 50 | $1.2682 |
| % from MA50 | -14.70% |
| MA 200 | $1.5242 |
| % from MA200 | -29.03% |
| BB Upper | $1.2270 |
| % from BB Upper | -11.83% |
| BB Lower | $1.0577 |
| % from BB Lower | +2.28% |
| RSI (14) | 40.80 |
| MACD | -0.043792 |
| MACD Signal | -0.042282 |
| ATR (14) | 0.043985 |
| 3-Day High | $1.1313 |
| 3-Day Low | $1.0473 |
| 52-Week High | $2.6934 |
| % from 52W High | -59.84% |
| 52-Week Low | $1.0473 |
| % from 52W Low | +3.29% |
| YTD High | $2.4103 |
| % from YTD High | -55.12% |
| YTD Low | $1.0473 |
| % from YTD Low | +3.29% |
📊 Market Commentary
Ripple (XRP) is trading at $1.0818, up 0.89% today, as the broader cryptocurrency market shows cautious optimism. The Relative Strength Index (RSI) at 40.8 suggests XRP is neither overbought nor oversold, hovering near neutral territory. This indicates a balanced market sentiment, with traders weighing recent developments against macroeconomic uncertainties.
XRP remains within its 52-week range of $1.0473 to $2.6934, with the current price near the lower end, reflecting subdued momentum compared to its yearly peak. Key support at $1.05 is critical; a sustained break below could signal further downside pressure. On the upside, resistance around $1.20—a level that has previously acted as both support and resistance—is being watched closely. A decisive move above this zone could reignite bullish interest.
Market participants are monitoring regulatory developments, particularly the ongoing SEC case, which continues to influence sentiment. Additionally, broader crypto trends, including Bitcoin’s performance and institutional adoption, are key drivers for XRP. Trading volumes have been modest, suggesting a lack of strong conviction among traders.
In summary, XRP’s price action reflects a wait-and-see approach, with technical indicators pointing to a neutral stance. Traders are focused on key levels and external catalysts for directional cues, avoiding aggressive positions until clearer trends emerge. The $1.05 support and $1.20 resistance remain pivotal in the near term.
Disclaimer
The content on MarketsFN.com is provided for educational and informational purposes only. It does not constitute financial advice or investment recommendations. All investments involve risk. Cryptocurrency markets are highly volatile. Past performance does not guarantee future results.