S&P 500 2026 YTD Highs & Lows Radar: Apple (AAPL), Tesla (TSLA) and more
MarketsFN Team

S&P 500 2026 YTD Highs & Lows Radar: Apple (AAPL), Tesla (TSLA) and more
Screening all 503 S&P 500 constituents for stocks nearest to their 2026 year-to-date high and their 2026 YTD low. Data as of July 29, 2026. % Realized = total return since Jan 1 2026.
Legend: RSI > 70 = overbought · RSI < 30 = oversold · Green % Realized = positive YTD return · Red = negative.
📈 Nearest to 2026 High
Sectors represented: Financial (2), Technology (1), Consumer Defensive (1), Industrials (1)
| Ticker | Company | Sector | Price Last | % Realized | 2026 YTD High Date | RSI | % above MA200 | Trend |
|---|---|---|---|---|---|---|---|---|
| AAPL | Apple Inc | Technology | $336.91 | +24.32% | 2026-07-27 | 69.0 | +21.7% | Above MA20, MA50, MA200 |
| JPM | JPMorgan Chase & Co | Financial | $356.20 | +9.44% | 2026-07-27 | 70.6 | +14.5% | Above MA20, MA50, MA200 |
| BAC | Bank Of America Corp | Financial | $62.13 | +11.05% | 2026-07-27 | 70.3 | +16.4% | Above MA20, MA50, MA200 |
| PM | Philip Morris International Inc | Consumer Defensive | $195.66 | +22.06% | 2026-07-27 | 64.8 | +15.5% | Above MA20, MA50, MA200 |
| RTX | RTX Corp | Industrials | $218.42 | +16.65% | 2026-07-27 | 77.4 | +16.8% | Above MA20, MA50, MA200 |
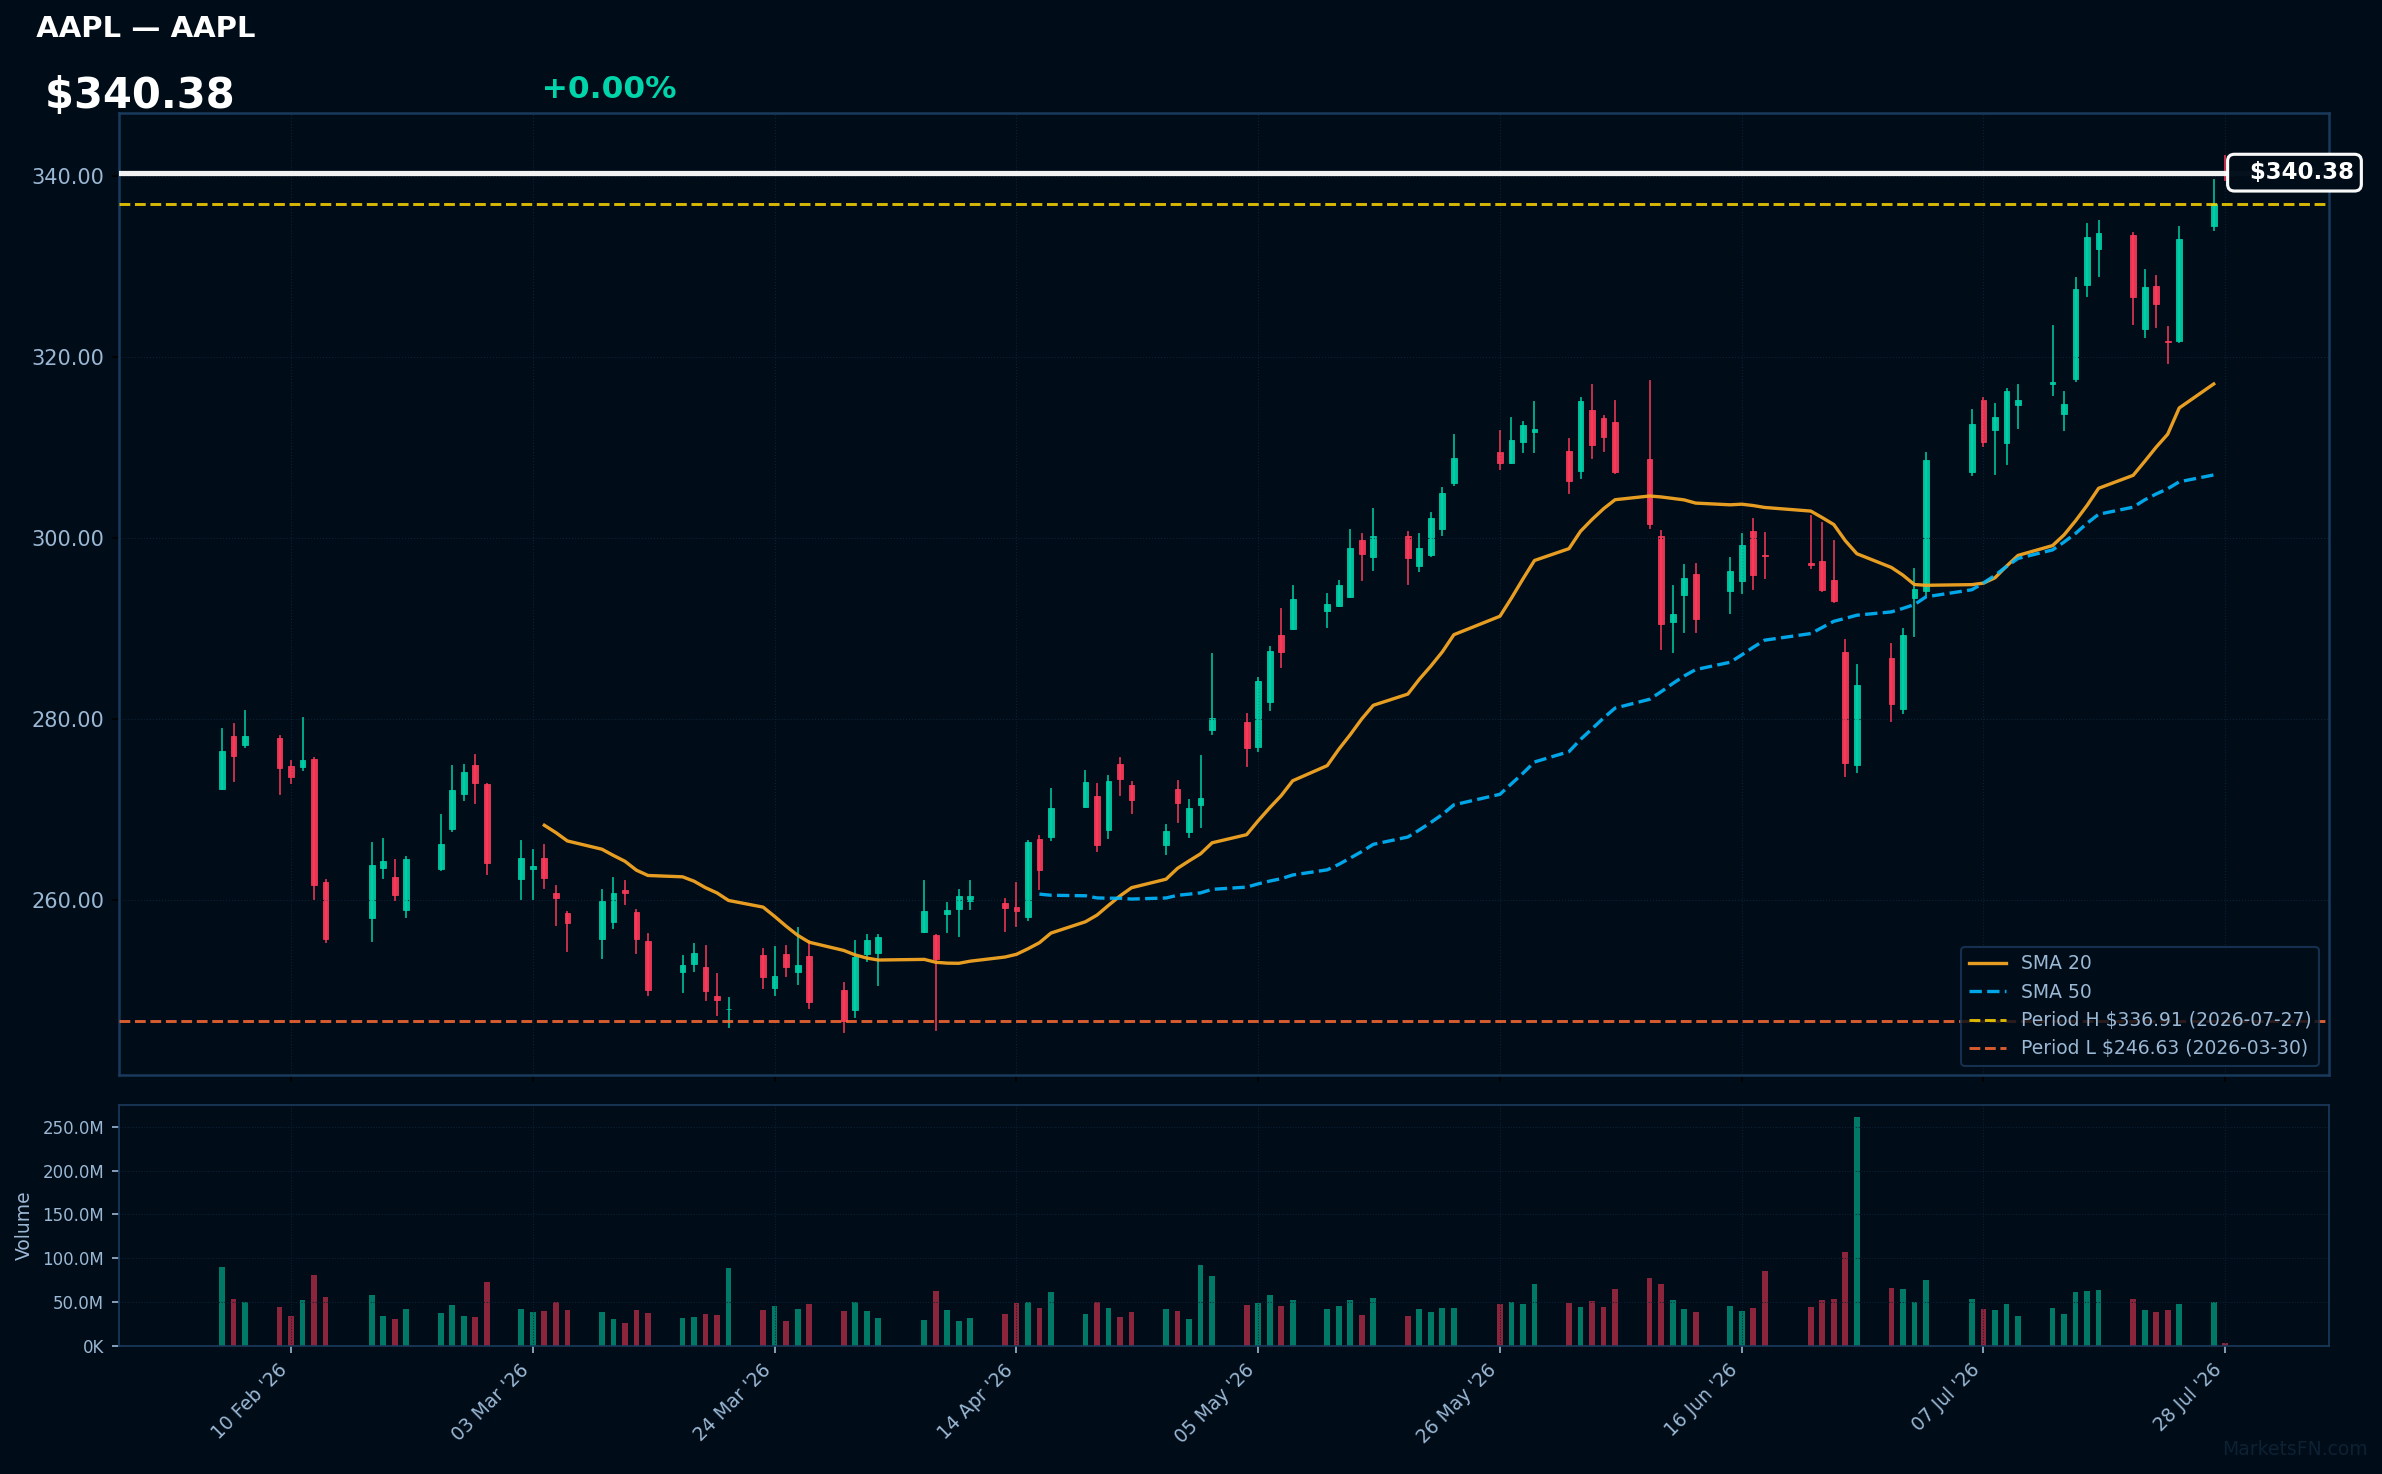
AAPL | Apple Inc | Technology | Price Last: $336.91 | % Realized: +24.32% | RSI: 69.0 | % above MA200: +21.7% | Trend: Above MA20, MA50, MA200
Apple Inc designs, manufactures, and markets consumer electronics, software, and services, generating revenue primarily from iPhone sales and services like Apple Music. Investors care due to its brand loyalty, ecosystem, and growing services segment.
AAPL's RSI(14) is 69.0, nearing overbought territory. The MA alignment is bullish with price > MA20 > MA50 > MA200, indicating a sustained uptrend. The stock is 0.0% below its 2026 YTD high, suggesting potential breakout momentum.
Related headlines
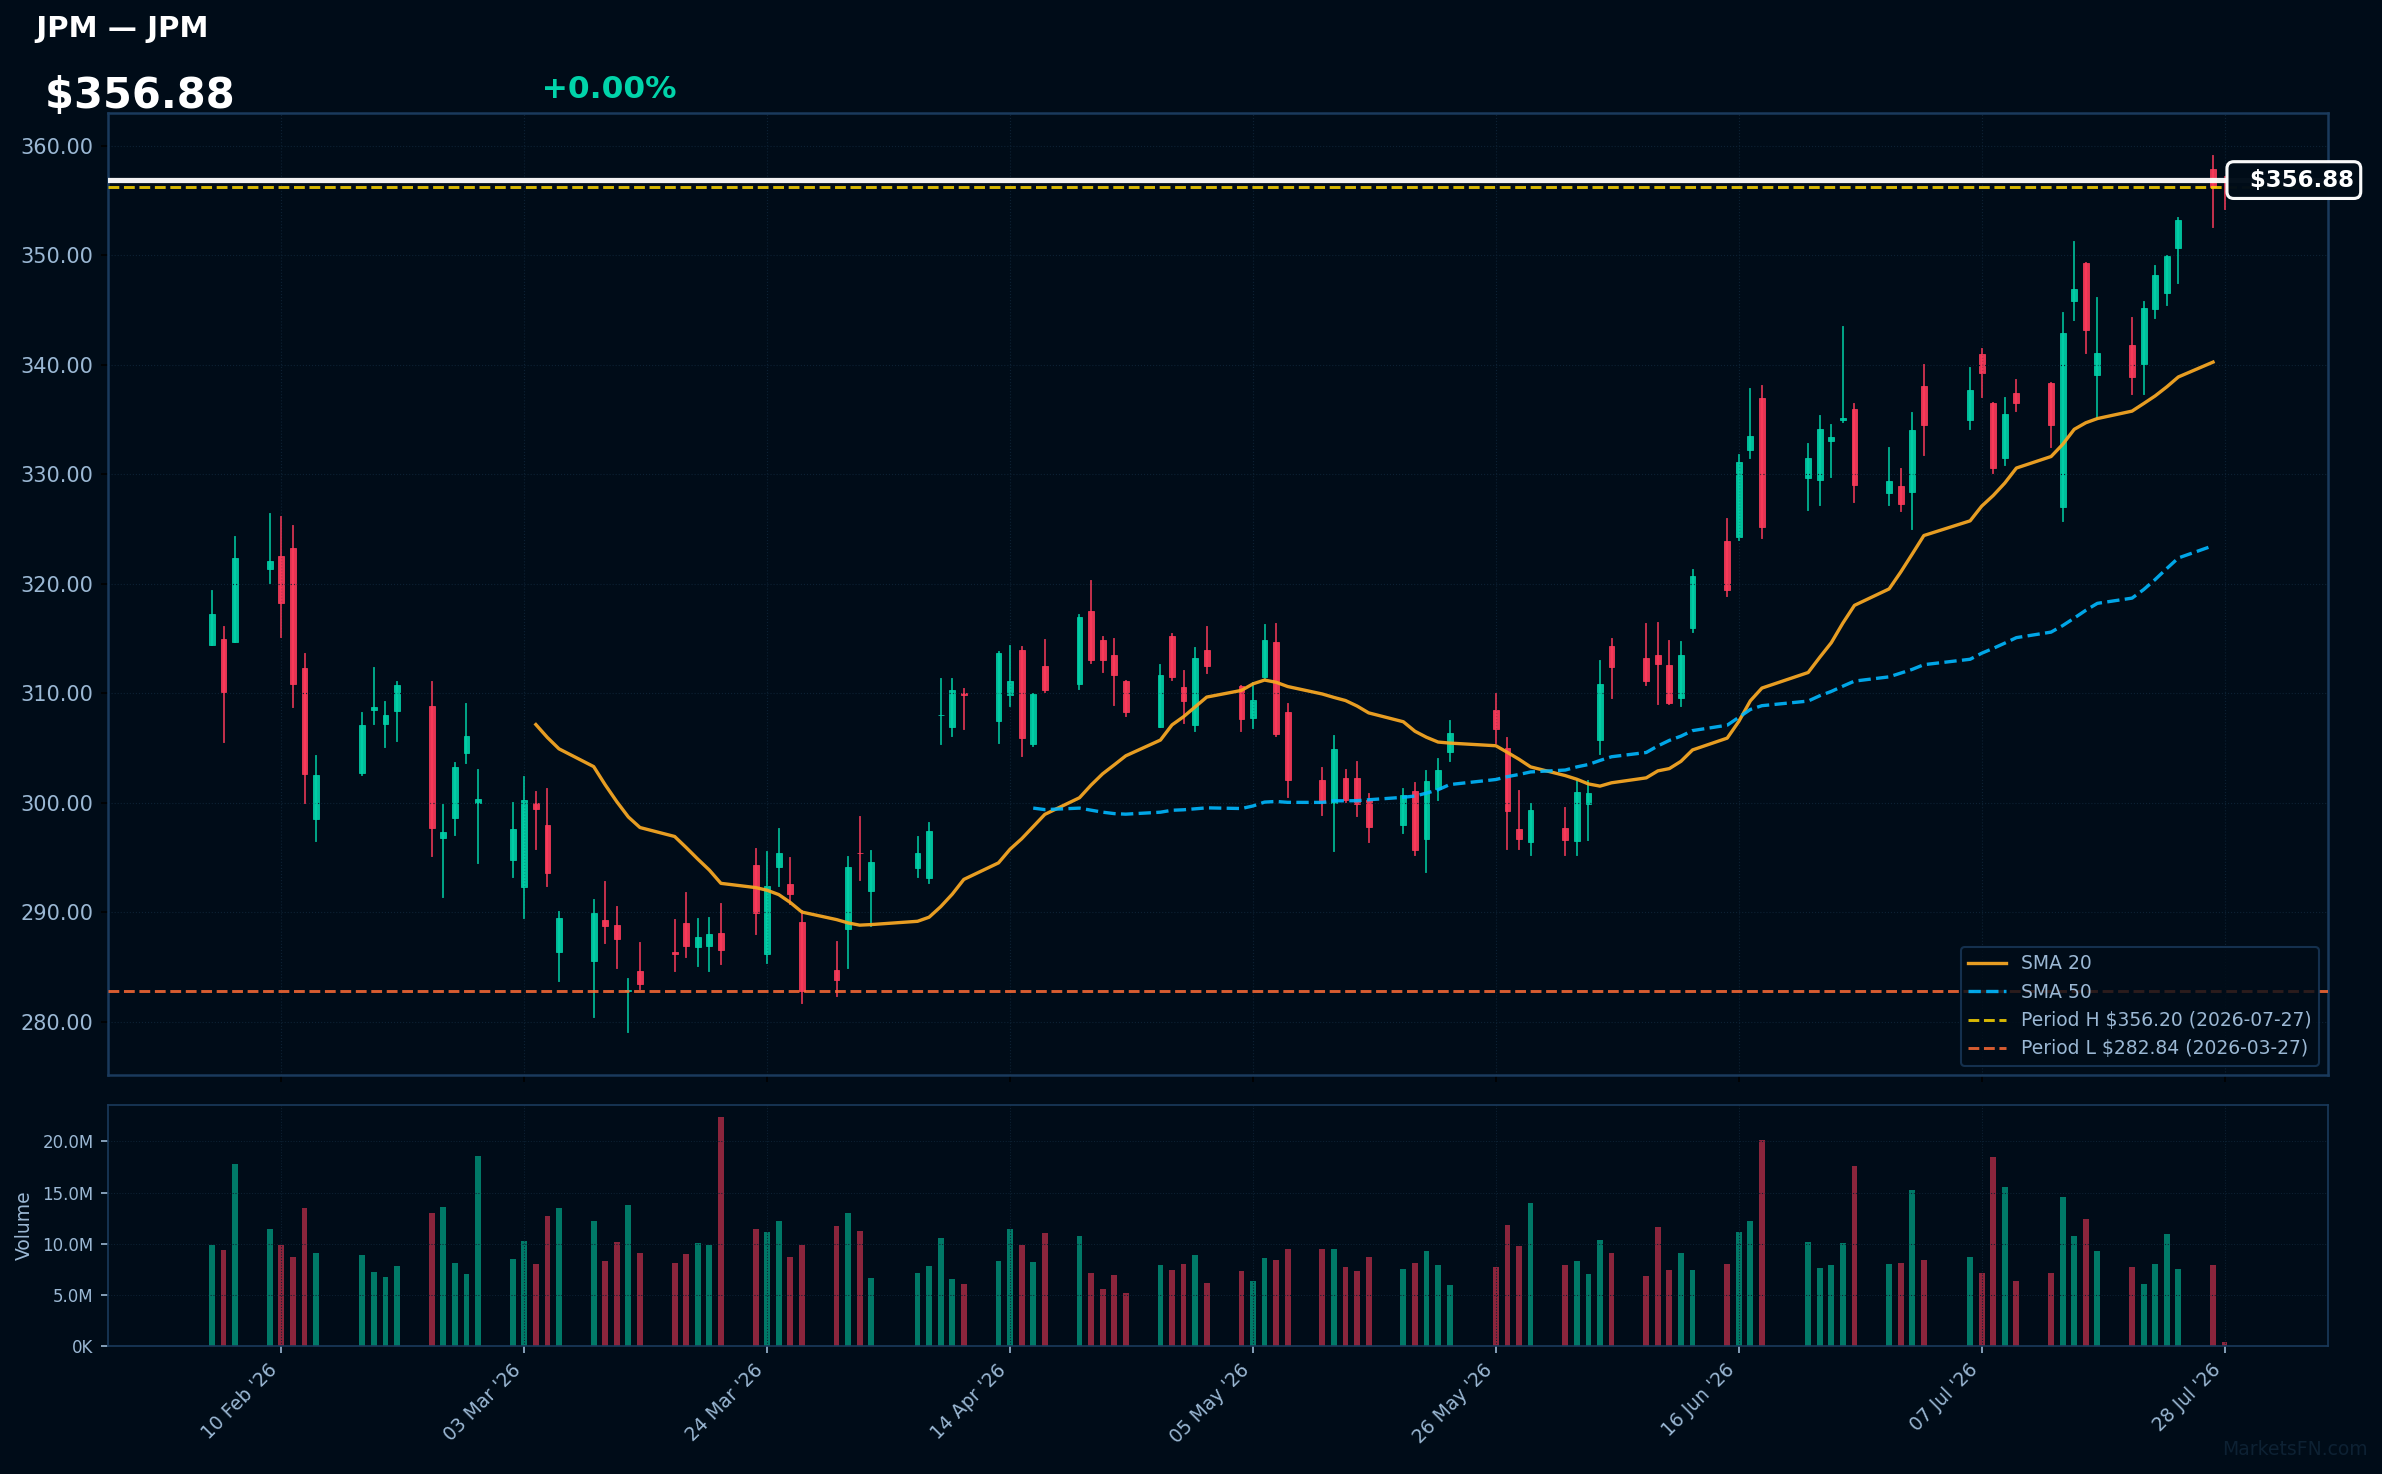
JPM | JPMorgan Chase & Co | Financial | Price Last: $356.20 | % Realized: +9.44% | RSI: 70.6 | % above MA200: +14.5% | Trend: Above MA20, MA50, MA200
JPMorgan Chase & Co is a major financial services firm. Investors should care because it is a leading provider of consumer and investment banking, financial transactions processing, asset management, and corporate and investment bank services, influencing global financial markets.
JPMorgan Chase & Co's RSI is 70.6, indicating strong momentum. With price > MA20 > MA50 > MA200, it shows a sustained uptrend. The stock is 0.0% below its 2026 YTD high, near a potential breakout, reinforcing the bullish technical alignment.
Related headlines
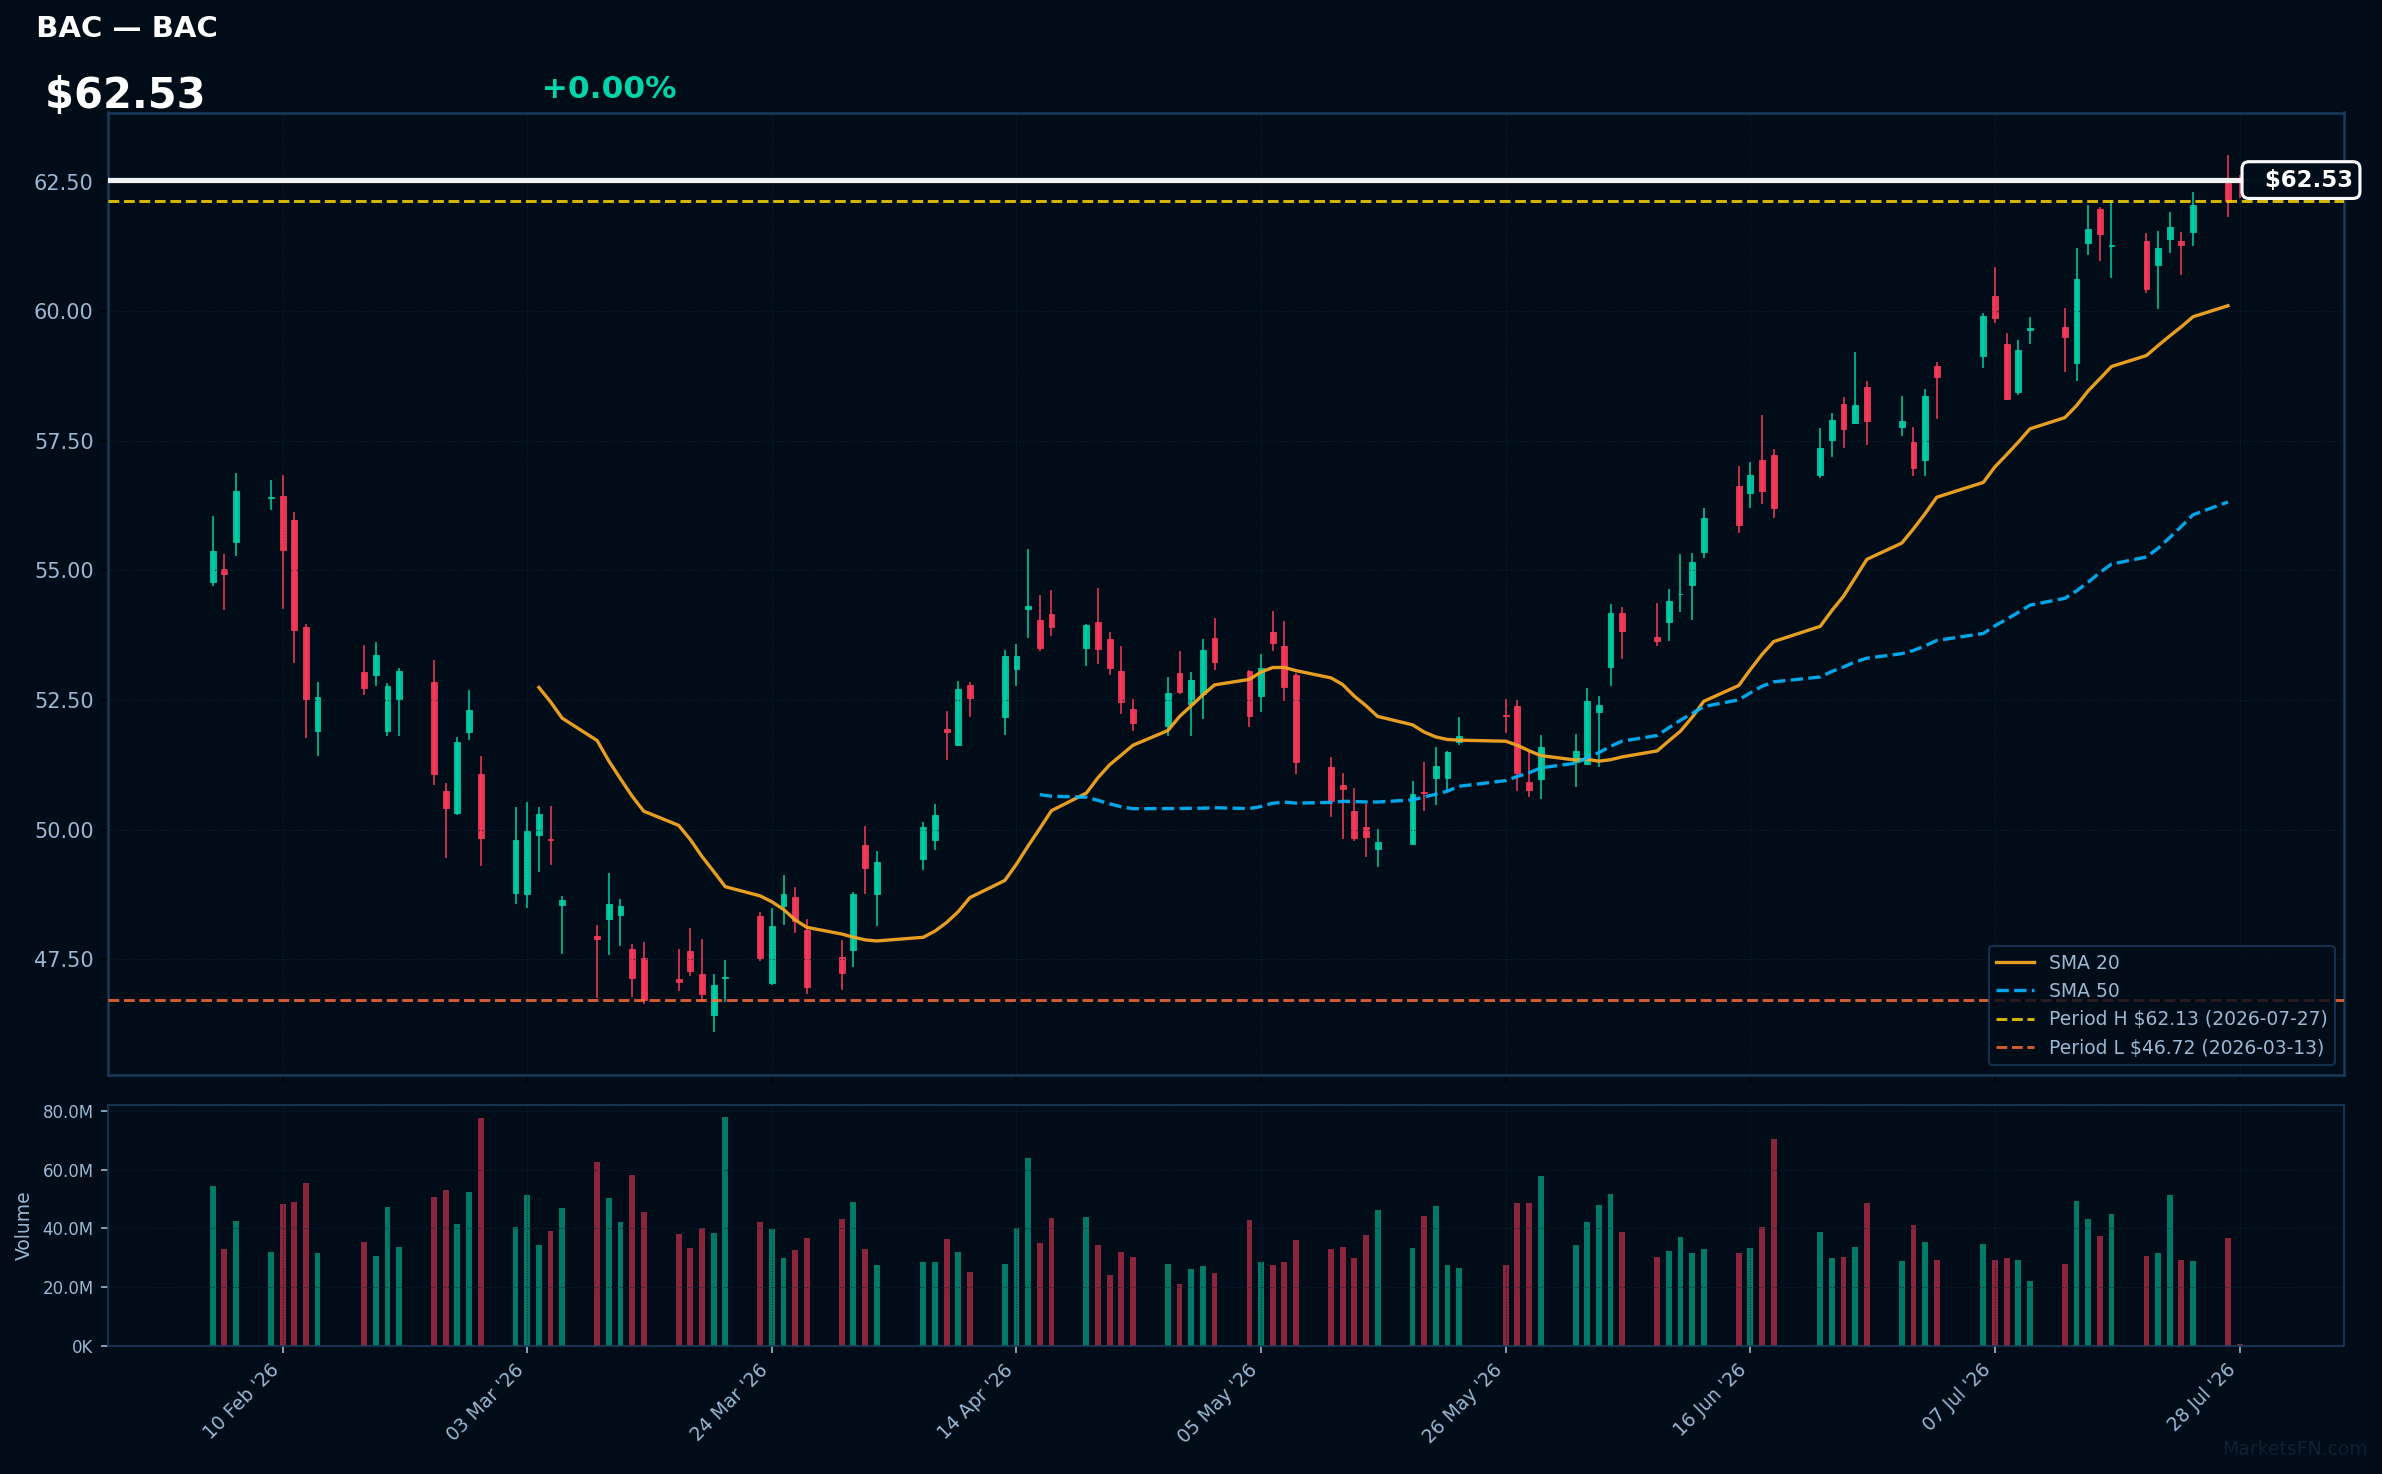
BAC | Bank Of America Corp | Financial | Price Last: $62.13 | % Realized: +11.05% | RSI: 70.3 | % above MA200: +16.4% | Trend: Above MA20, MA50, MA200
Bank Of America Corp is a multinational banking and financial services corporation. Investors should care because its performance reflects the overall health of the US consumer and corporate lending markets, with exposure to interest rate changes and economic cycles.
The stock exhibits bullish MA alignment with price > MA20 > MA50 > MA200, RSI(14) at 70.3, indicating strong momentum; it's near a potential breakout at its 2026 YTD high, up 11.0% YTD.
Related headlines
- Honeywell upgraded by Bank of America on stronger order trends
- Book Your Next Getaway: New Bank of America Travel Center Makes it Easier to Plan and Book Memorable Travel Experiences
- Wall Street Banks Eyed as Overlooked Beneficiaries of AI Trade
- ITG draws bullish initiations from Bank of America and UBS
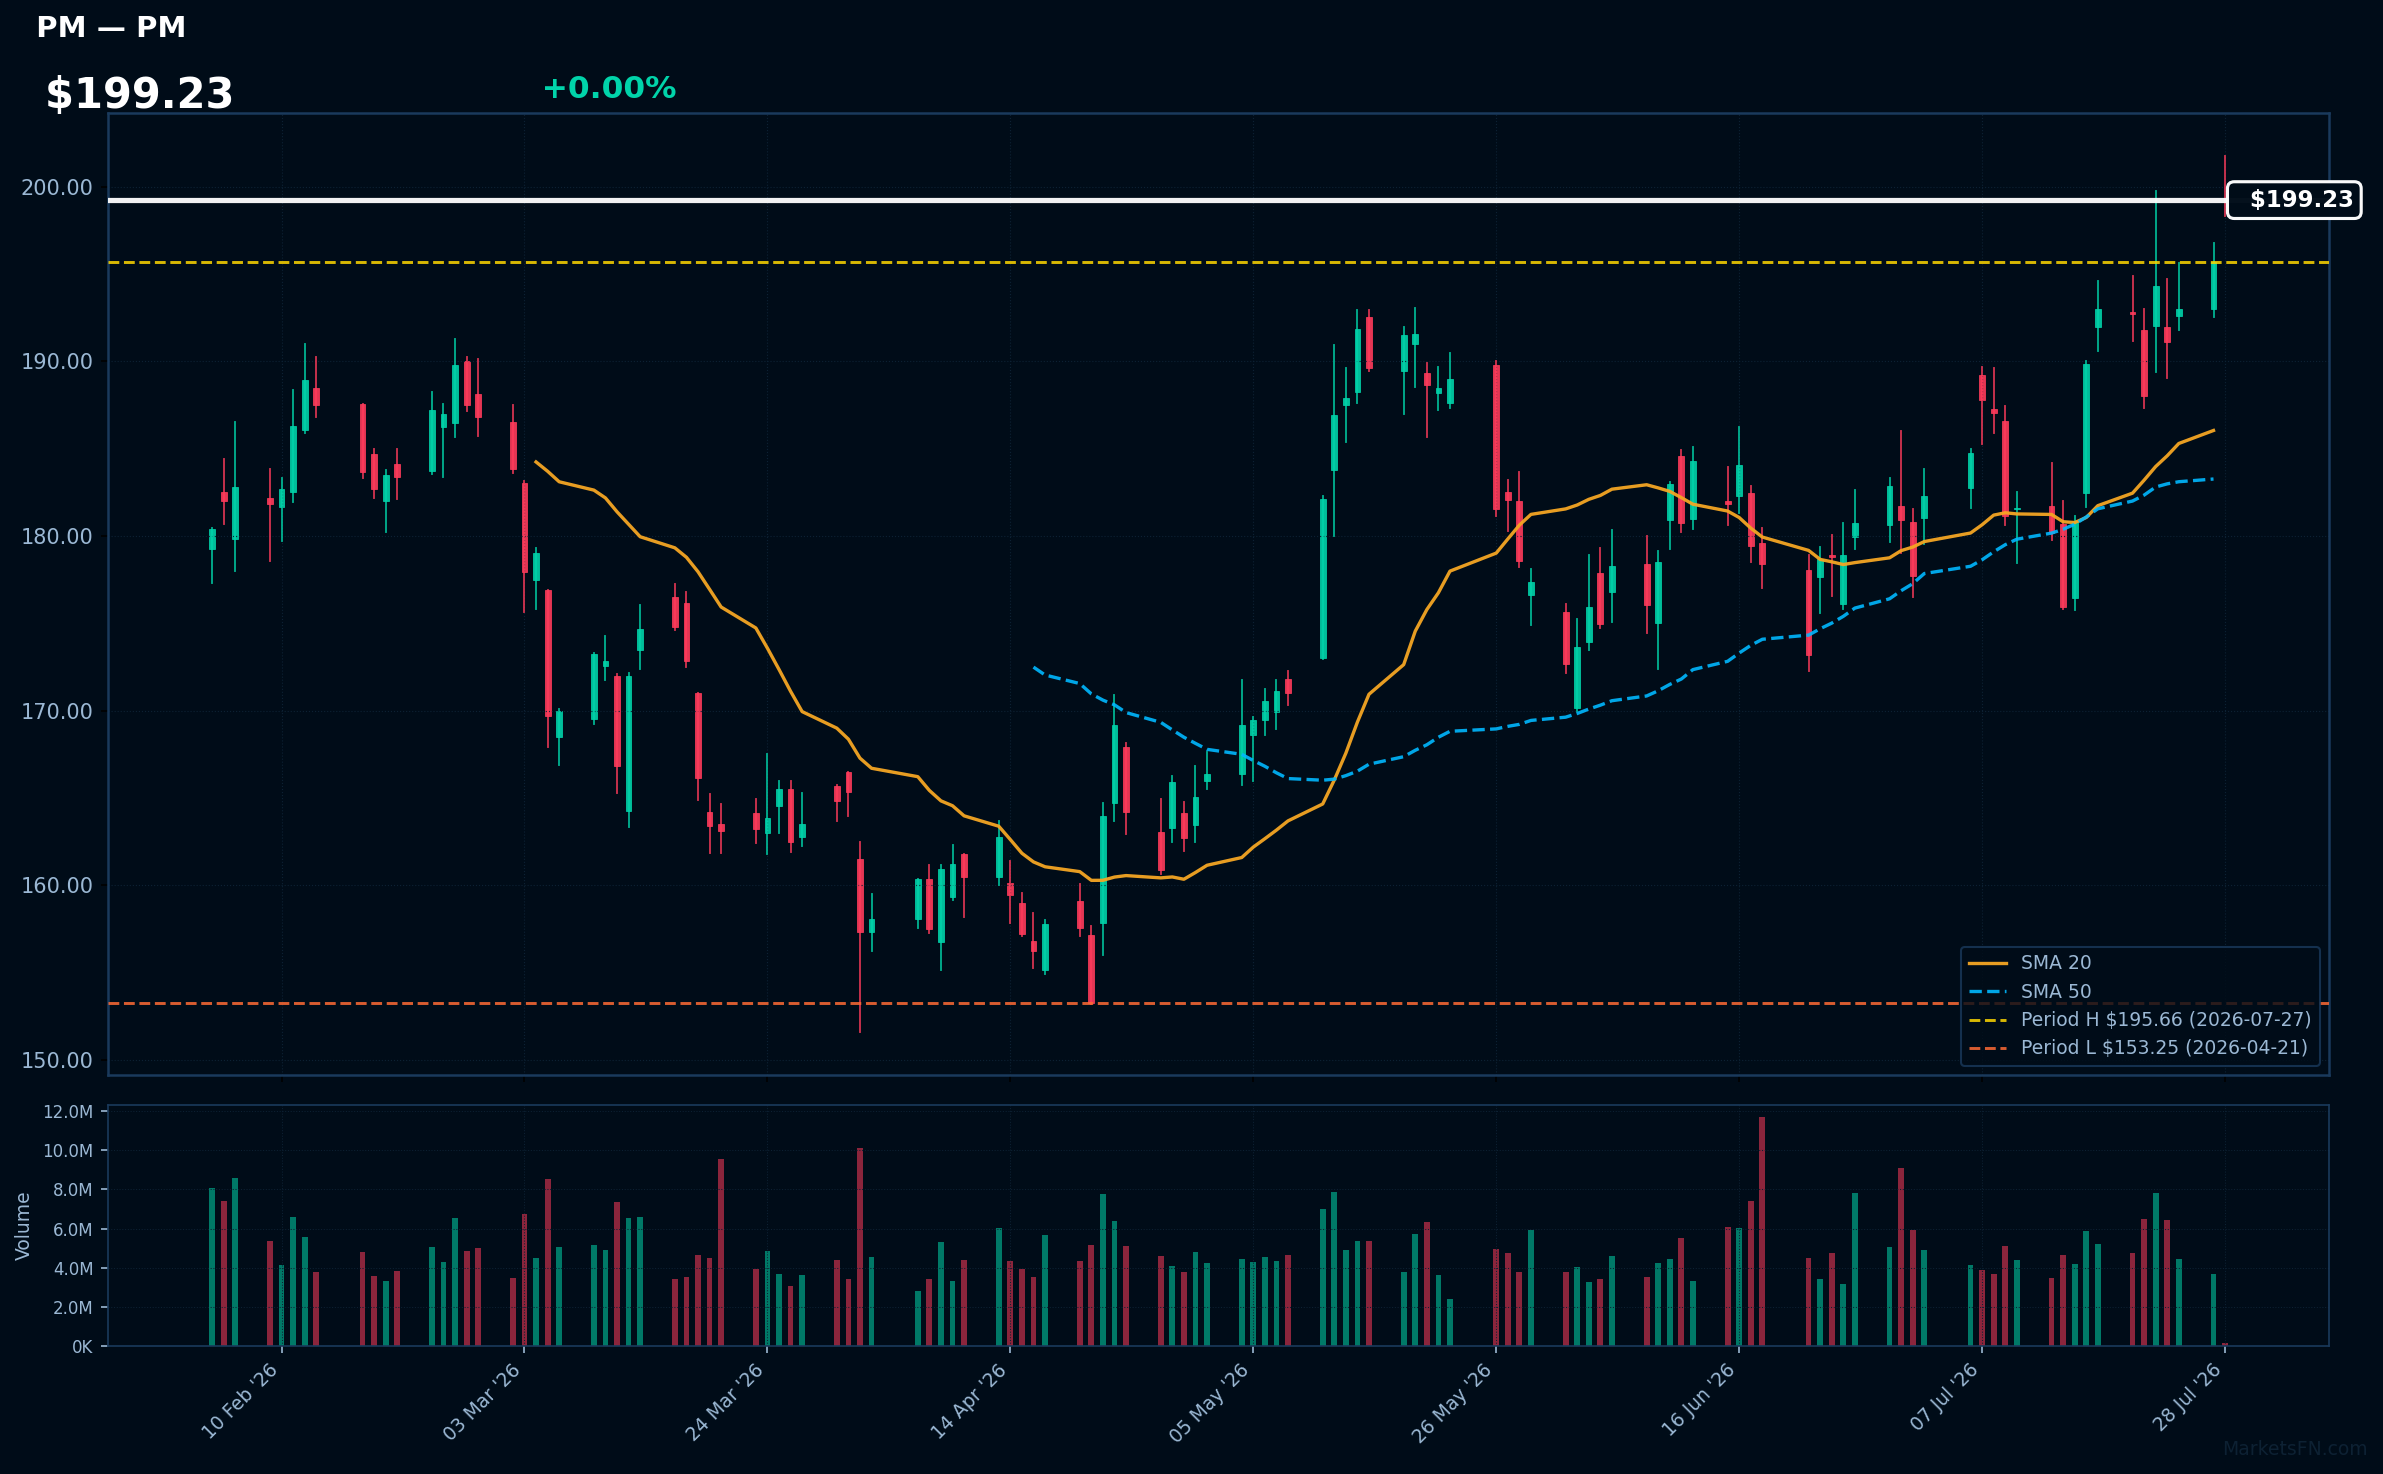
PM | Philip Morris International Inc | Consumer Defensive | Price Last: $195.66 | % Realized: +22.06% | RSI: 64.8 | % above MA200: +15.5% | Trend: Above MA20, MA50, MA200
Philip Morris International Inc is a tobacco company that generates revenue primarily from the sale of smoke-free products and traditional cigarettes outside the US. Investors should care about its transition to smoke-free products and its global market presence.
The stock shows bullish MA alignment with price > MA20 > MA50 > MA200 and RSI(14) at 64.8, indicating sustained uptrend and moderate momentum. It's near its 2026 YTD high, up 22.1% YTD, suggesting potential for further breakout.
Related headlines
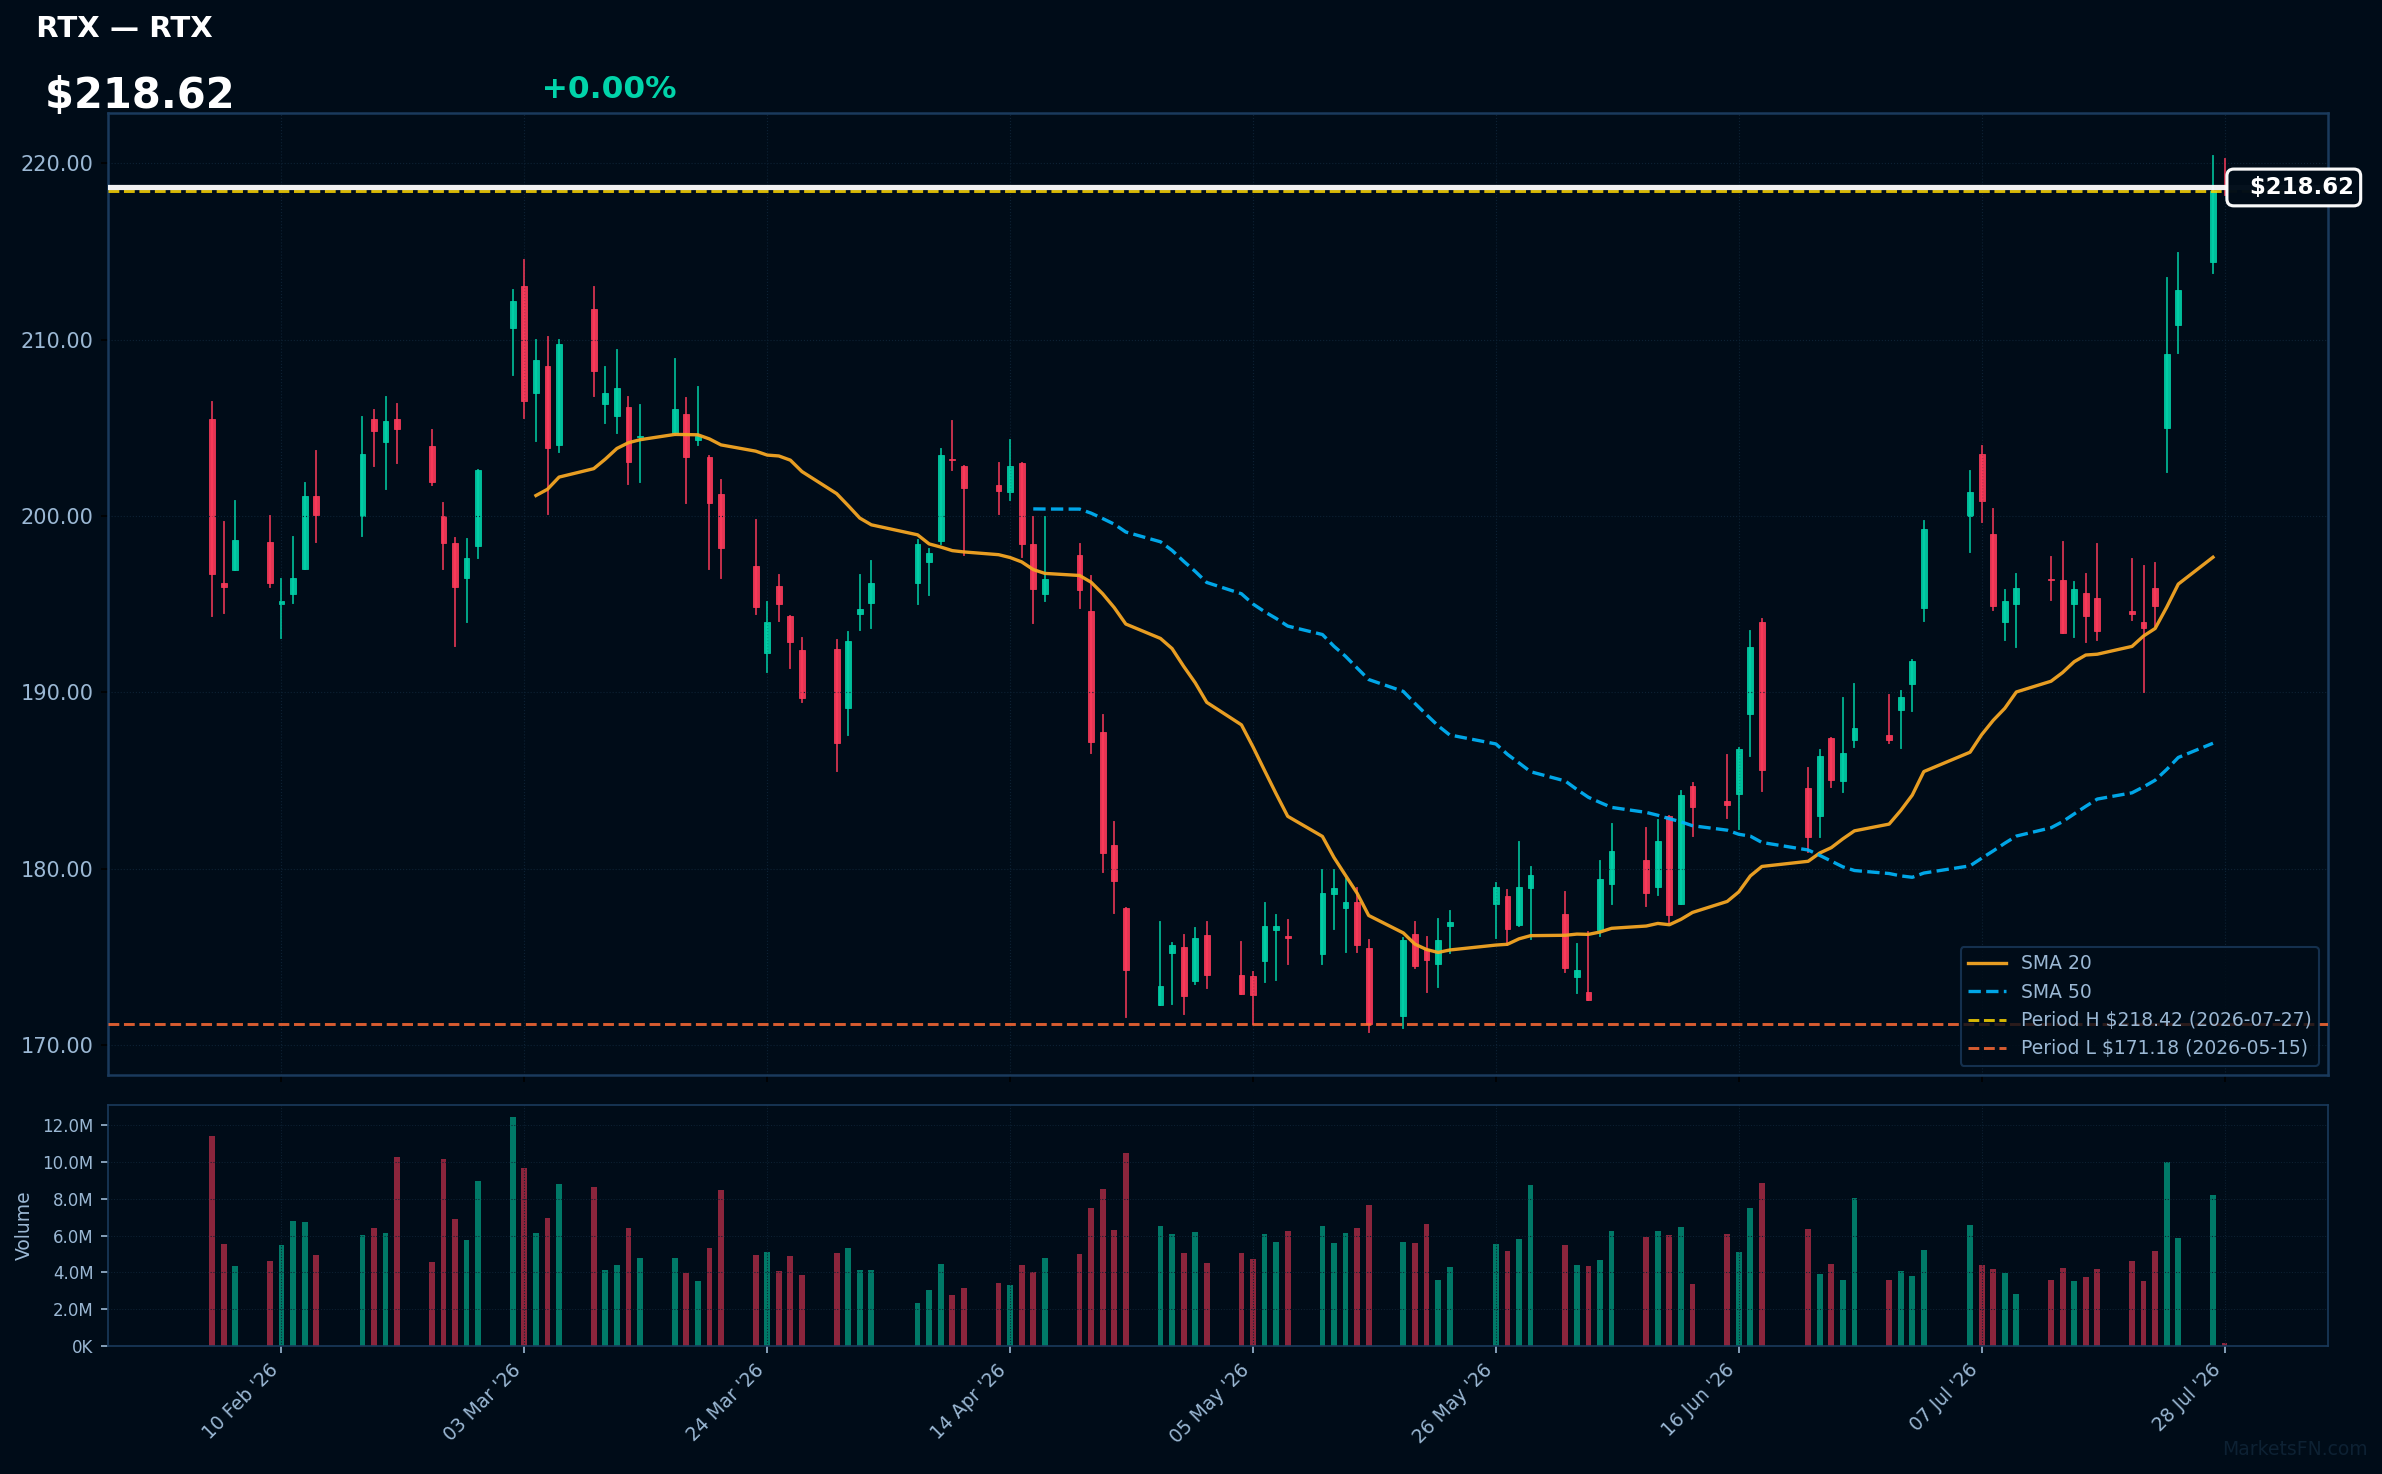
RTX | RTX Corp | Industrials | Price Last: $218.42 | % Realized: +16.65% | RSI: 77.4 | % above MA200: +16.8% | Trend: Above MA20, MA50, MA200
RTX Corp is a diversified aerospace and defense company; investors should care due to its significant presence in the global aerospace industry, though specific business details aren't provided in the data.
RTX Corp's RSI(14) is 77.4, indicating strong momentum with a bullish MA alignment: price ($218.62) > MA20 > MA50 > MA200, and is 0.0% below its 2026 YTD high, suggesting potential breakout level proximity.
Related headlines
📉 Nearest to 2026 Low
Sectors represented: Communication Services (2), Consumer Cyclical (1), Real Estate (1), Basic Materials (1)
| Ticker | Company | Sector | Price Last | % Realized | 2026 YTD Low Date | RSI | % above MA200 | Trend |
|---|---|---|---|---|---|---|---|---|
| TSLA | Tesla Inc | Consumer Cyclical | $309.22 | -29.41% | 2026-07-27 | 26.8 | -25.2% | Below MA20, MA50, MA200 |
| CCI | Crown Castle Inc | Real Estate | $74.13 | -16.43% | 2026-07-27 | 40.4 | -15.3% | Below MA20, MA50, MA200 |
| WBD | Warner Bros. Discovery Inc | Communication Services | $25.28 | -11.33% | 2026-07-27 | 37.5 | -4.0% | Below MA20, MA50, MA200 |
| PSKY | Paramount Skydance Corp | Communication Services | $8.03 | -39.07% | 2026-07-27 | 27.4 | -32.5% | Below MA20, MA50, MA200 |
| ALB | Albemarle Corp | Basic Materials | $116.18 | -19.28% | 2026-07-27 | 25.4 | -23.6% | Below MA20, MA50, MA200 |
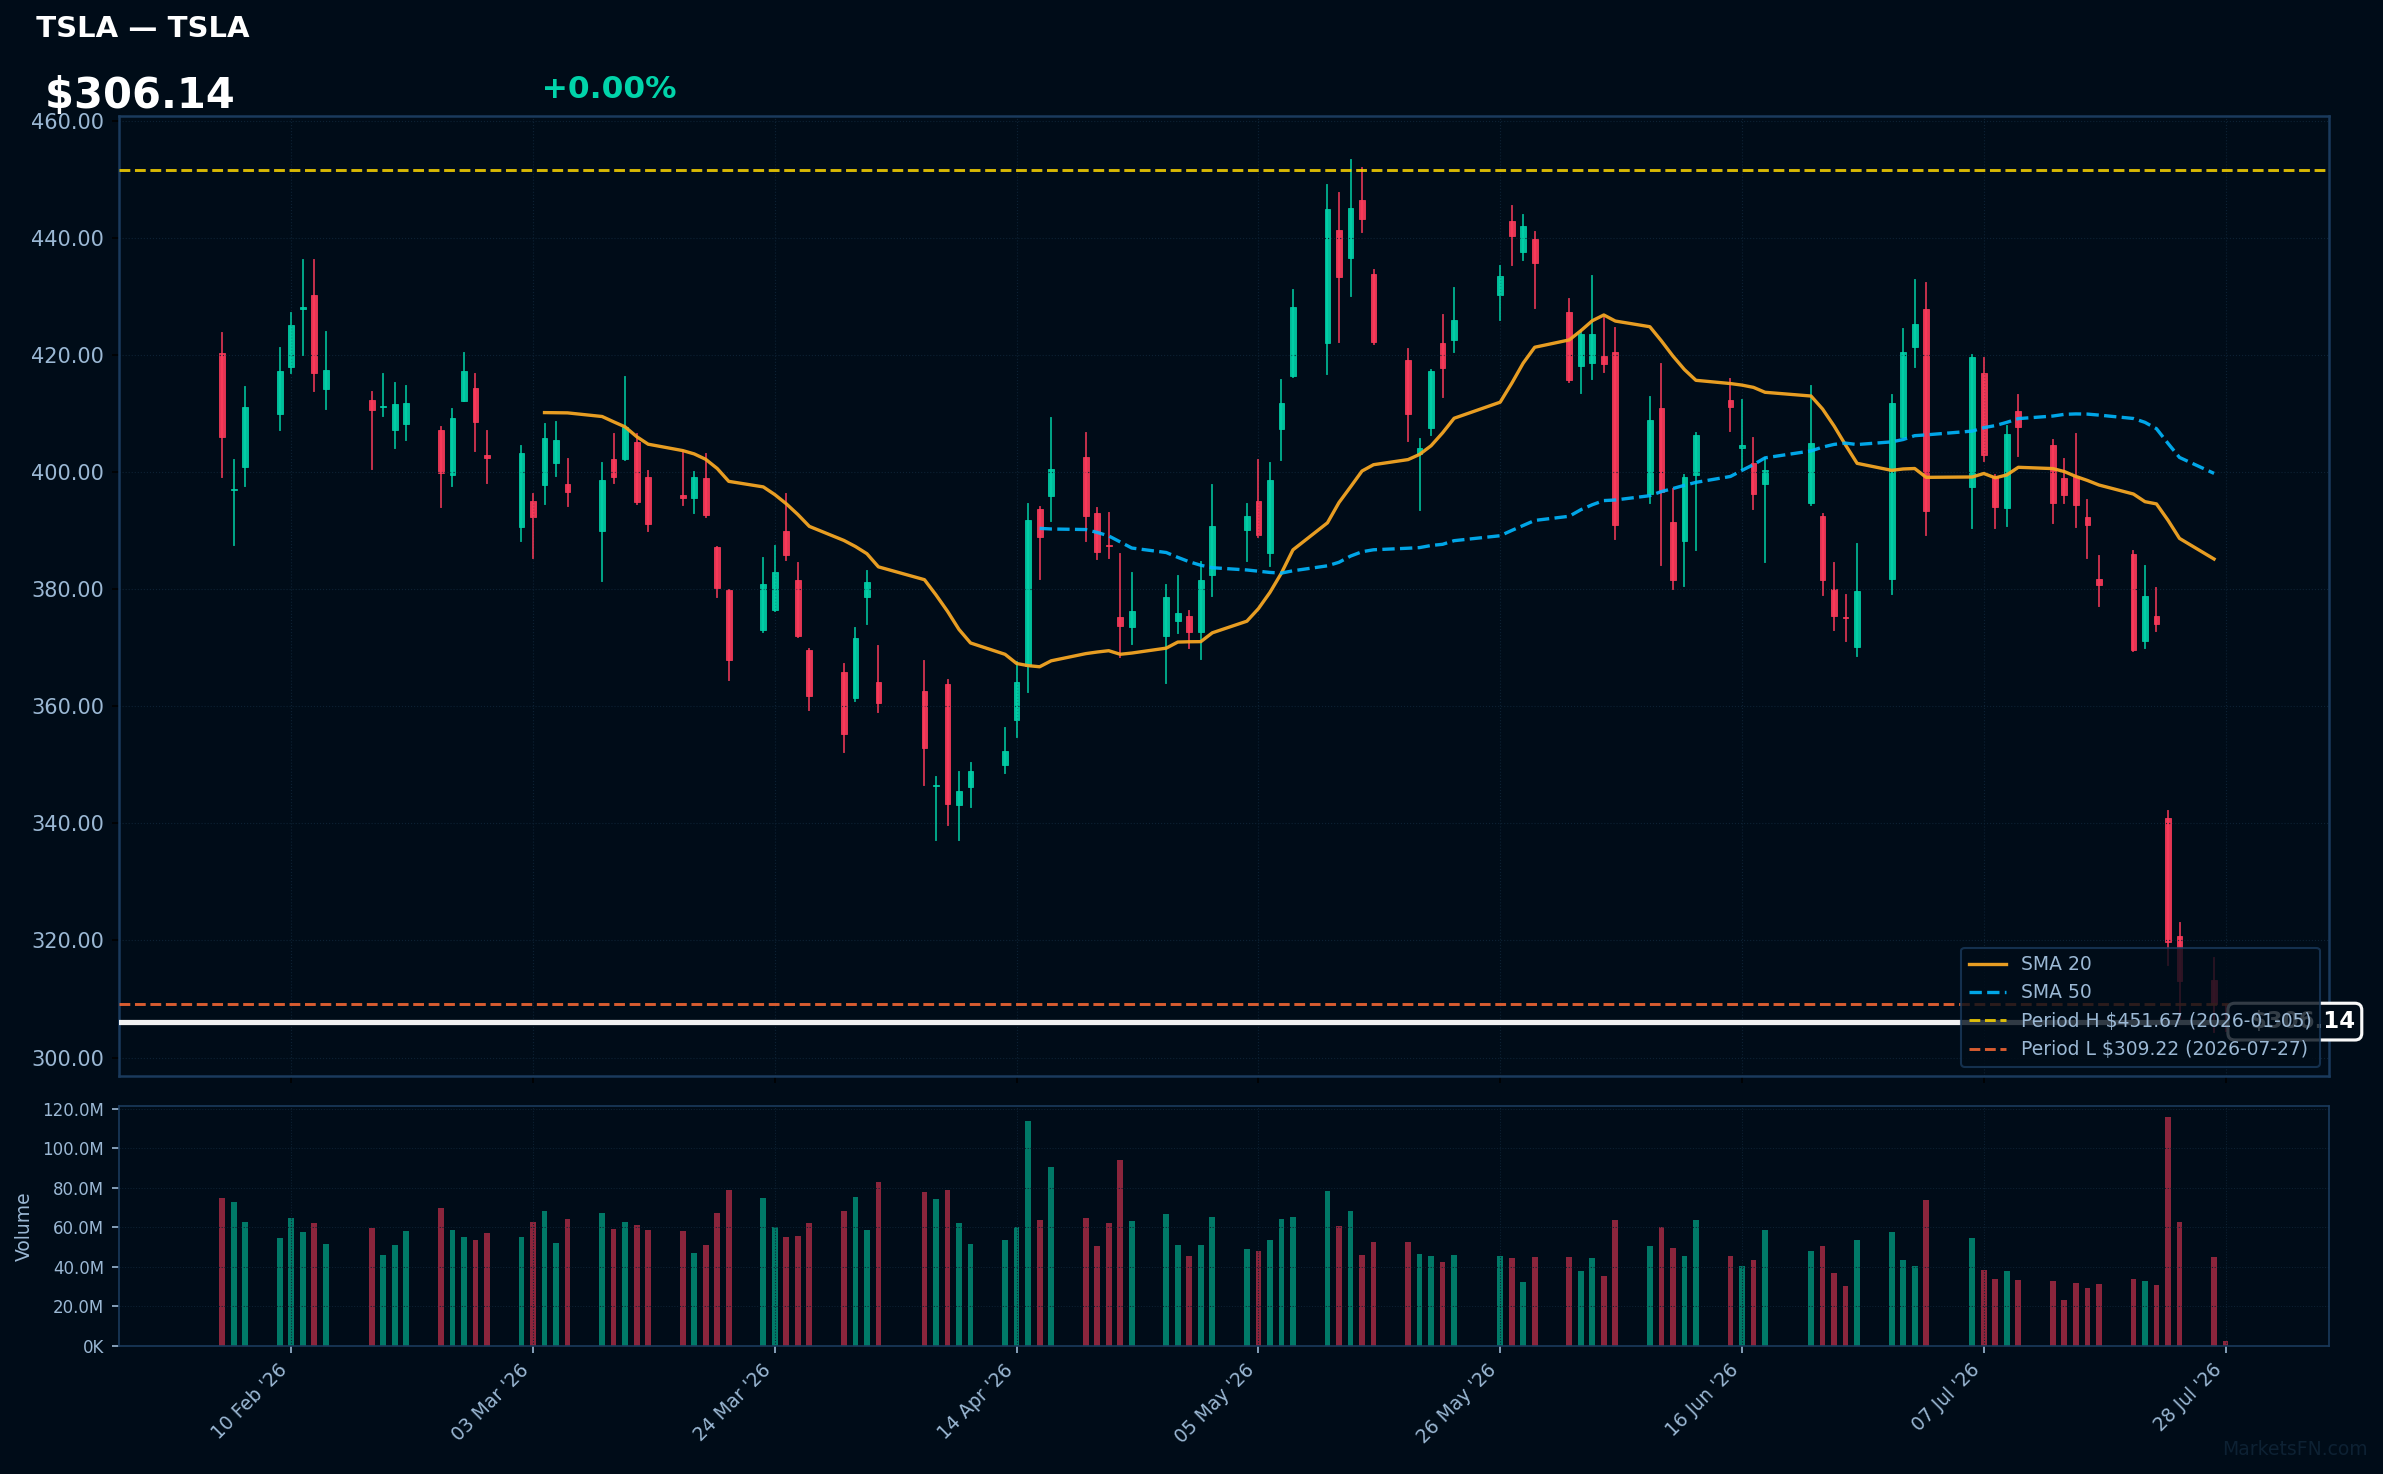
TSLA | Tesla Inc | Consumer Cyclical | Price Last: $309.22 | % Realized: -29.41% | RSI: 26.8 | % above MA200: -25.2% | Trend: Below MA20, MA50, MA200
Tesla Inc is an electric vehicle manufacturer and clean energy company. Investors should care because it's a leader in the EV market and has been disrupting the automotive and energy industries with its innovative products and technology.
Tesla's current technical situation is bearish, with an RSI(14) of 26.8 indicating oversold conditions, and a bearish MA alignment: price ($306.14) < MA20 < MA50 < MA200, suggesting a sustained downtrend. The stock is testing major support at its 2026 YTD low.
Related headlines
- Tesla Stock Falls Again, Putting Trillion-Dollar Status at Risk
- Tesla, ContourGlobal sign 1TWh/year PPA for Project Sterling in Arizona
- A Potential Tesla-SpaceX Merger Could Create Orbit-To-Ground AI Powerhouse With Over $1 Trillion In Chip Savings, Says Analyst
- Cathie Woods ARK Loads Up On Musks SpaceX, Tesla Again As US Tightens Its Grip On AI Competition With Robotics Curbs
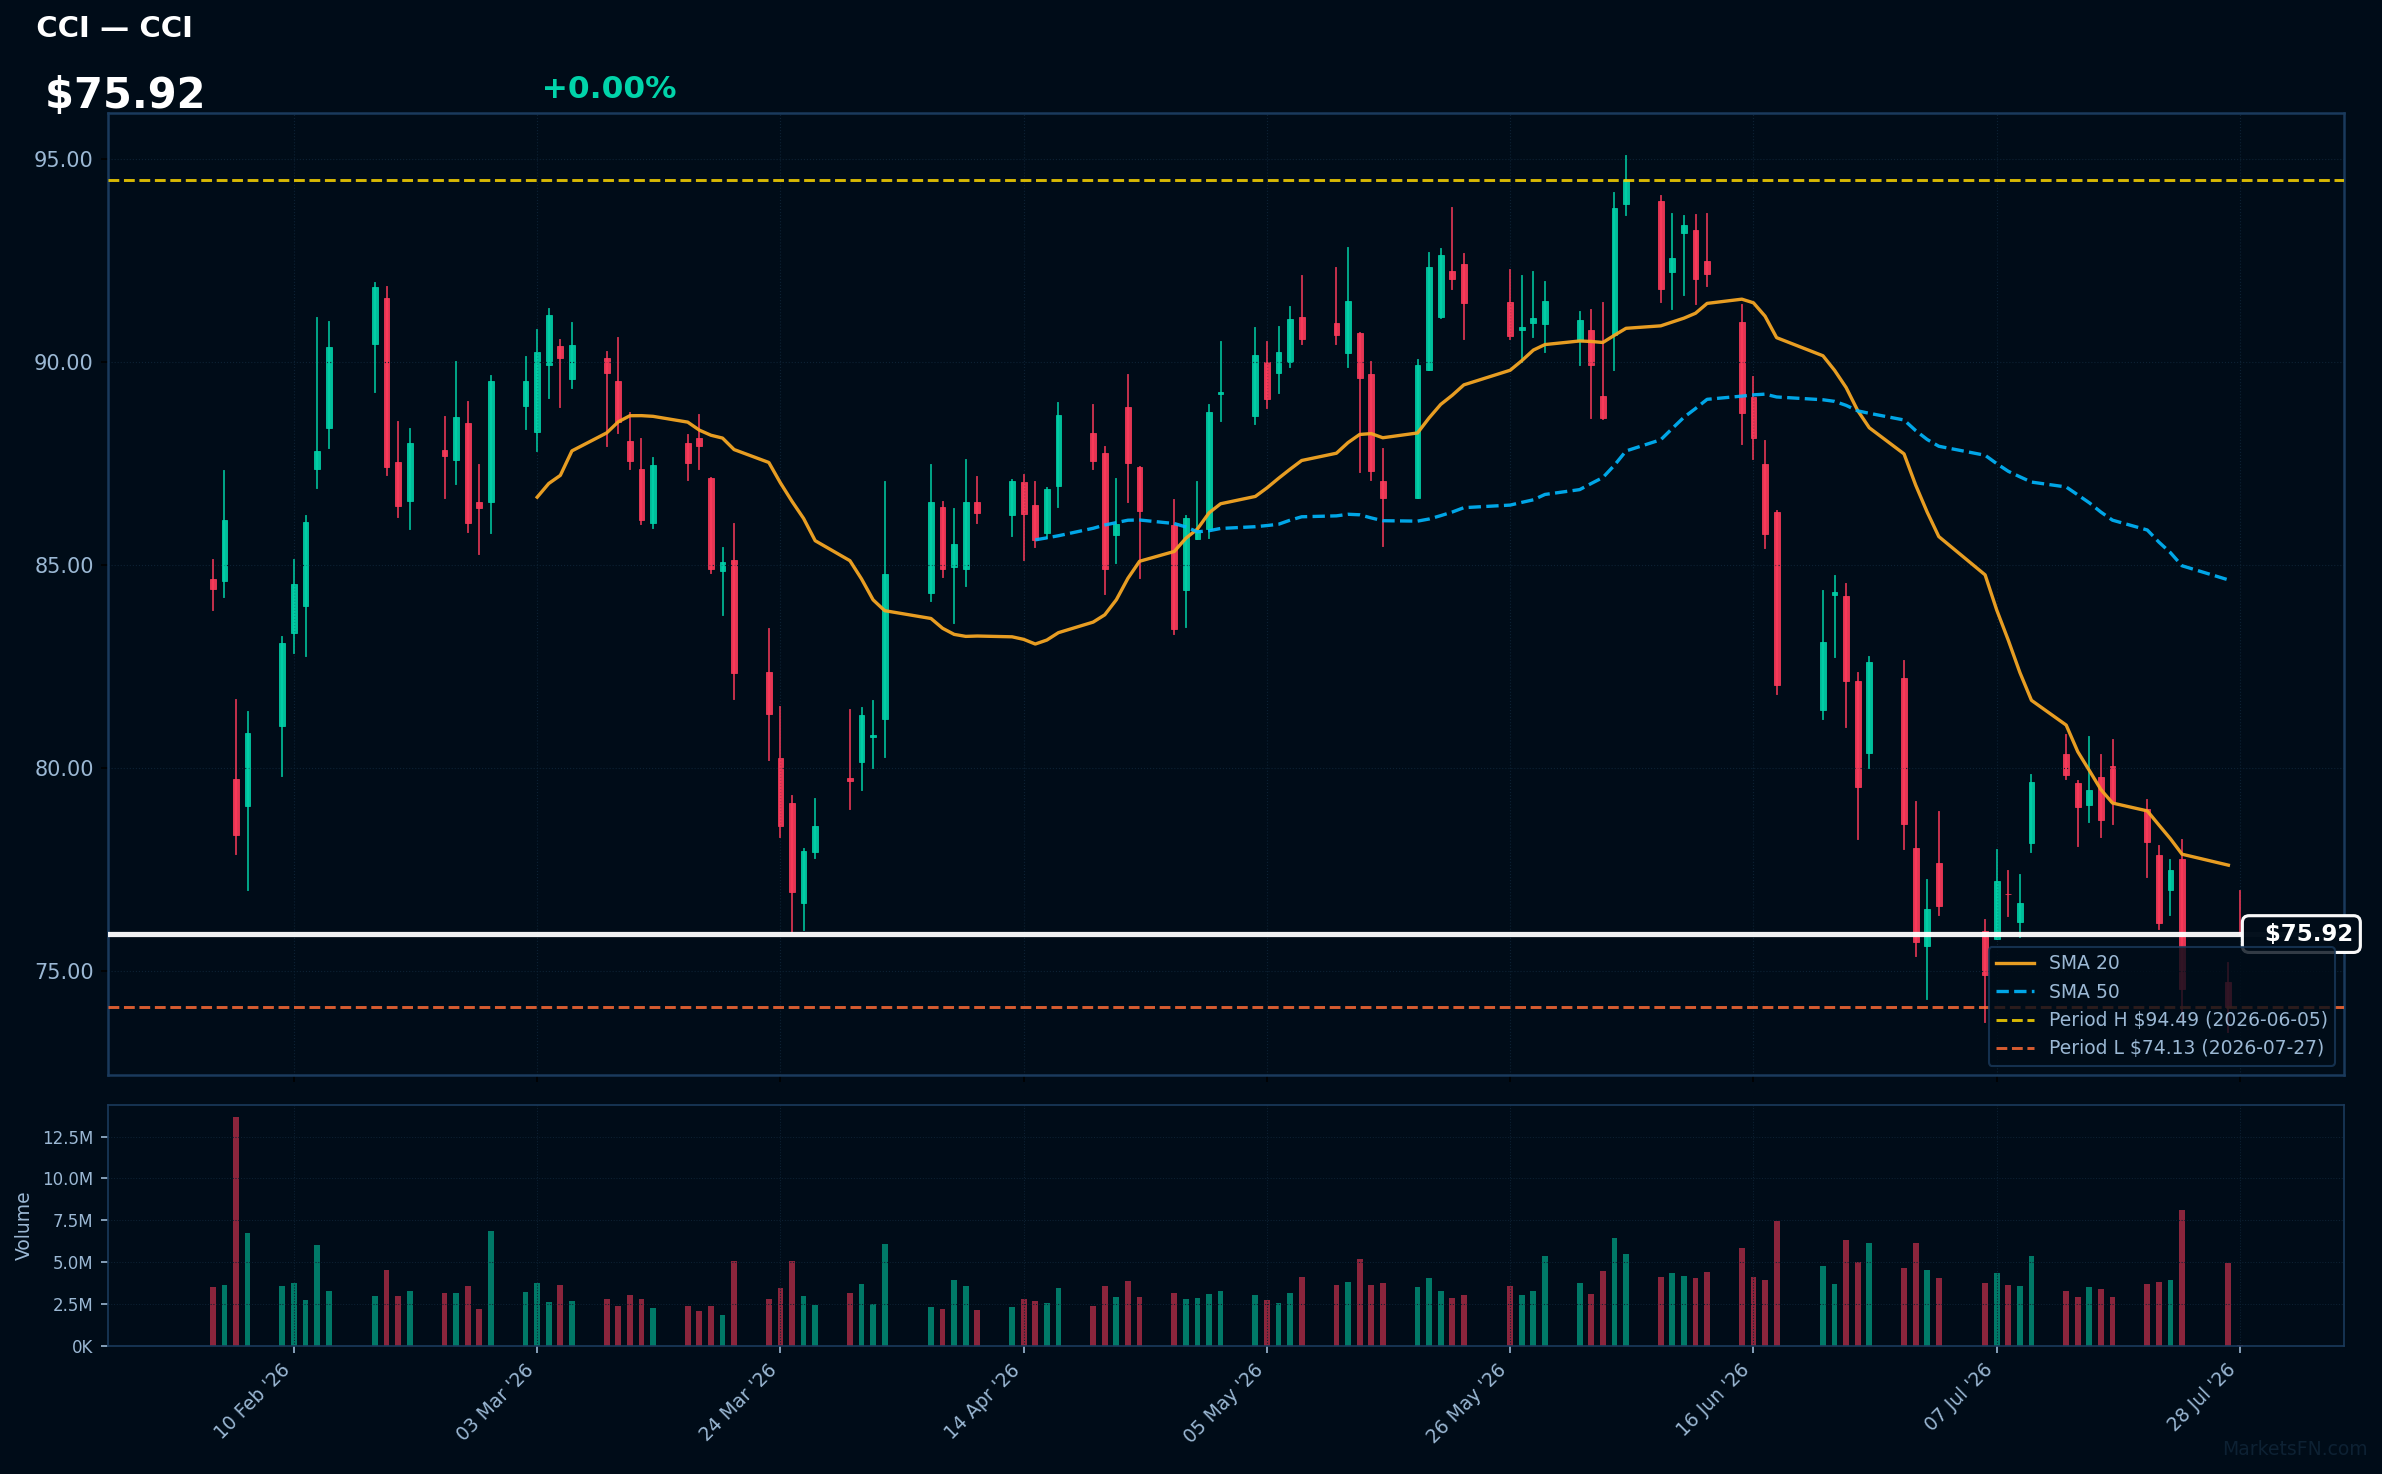
CCI | Crown Castle Inc | Real Estate | Price Last: $74.13 | % Realized: -16.43% | RSI: 40.4 | % above MA200: -15.3% | Trend: Below MA20, MA50, MA200
Crown Castle Inc operates as a real estate investment trust (REIT) specializing in communications infrastructure, including cell towers and fiber networks, which are crucial for telecommunications companies. Investors care due to its role in supporting 5G infrastructure.
Crown Castle Inc is testing major support with its price 0.0% above its 2026 YTD low. The RSI(14) is 40.4, indicating neutral momentum, while the bearish MA alignment (price < MA20 < MA50 < MA200) suggests a sustained downtrend, potentially a warning sign.
Related headlines
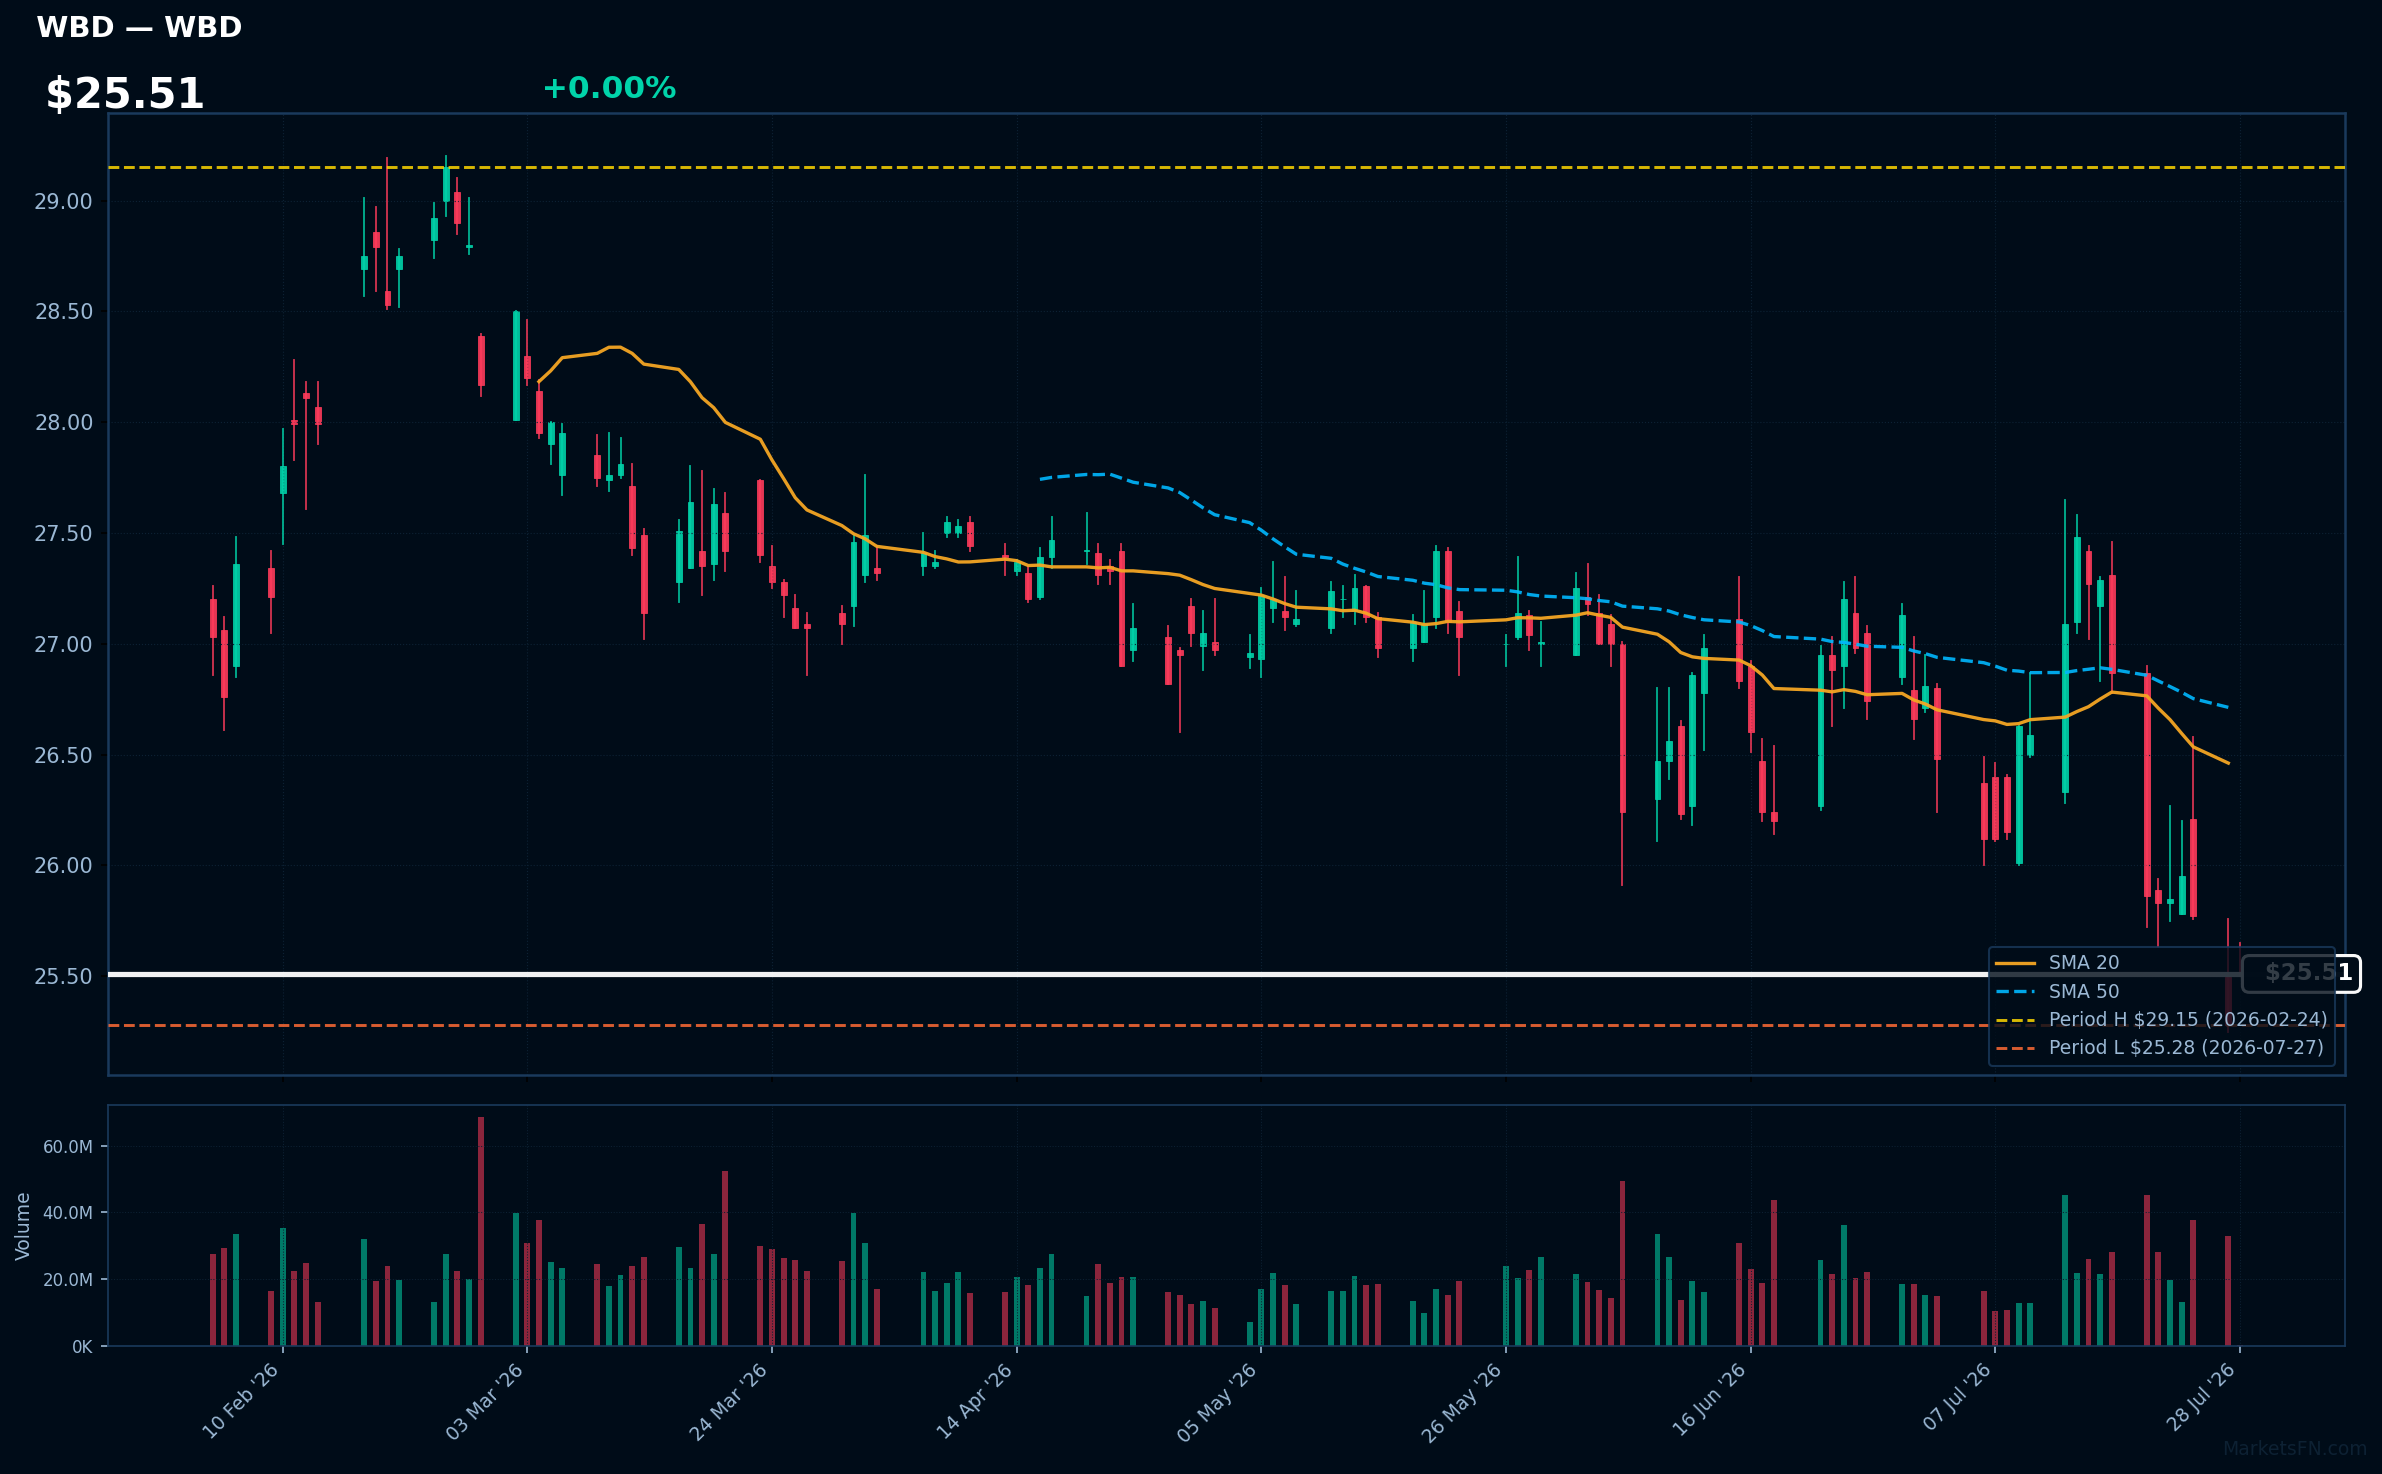
WBD | Warner Bros. Discovery Inc | Communication Services | Price Last: $25.28 | % Realized: -11.33% | RSI: 37.5 | % above MA200: -4.0% | Trend: Below MA20, MA50, MA200
Warner Bros. Discovery Inc is a media conglomerate with a diverse portfolio of television networks, film studios, and streaming services, including HBO, Warner Bros., and Discovery Channel, making it a significant player in the global entertainment industry.
The stock is testing major support at its 2026 YTD low with an RSI(14) of 37.5, indicating oversold conditions, and is below MA20, MA50, and MA200, showing mixed signals; the 2026 YTD return is -11.3%, a warning sign for investors.
Related headlines
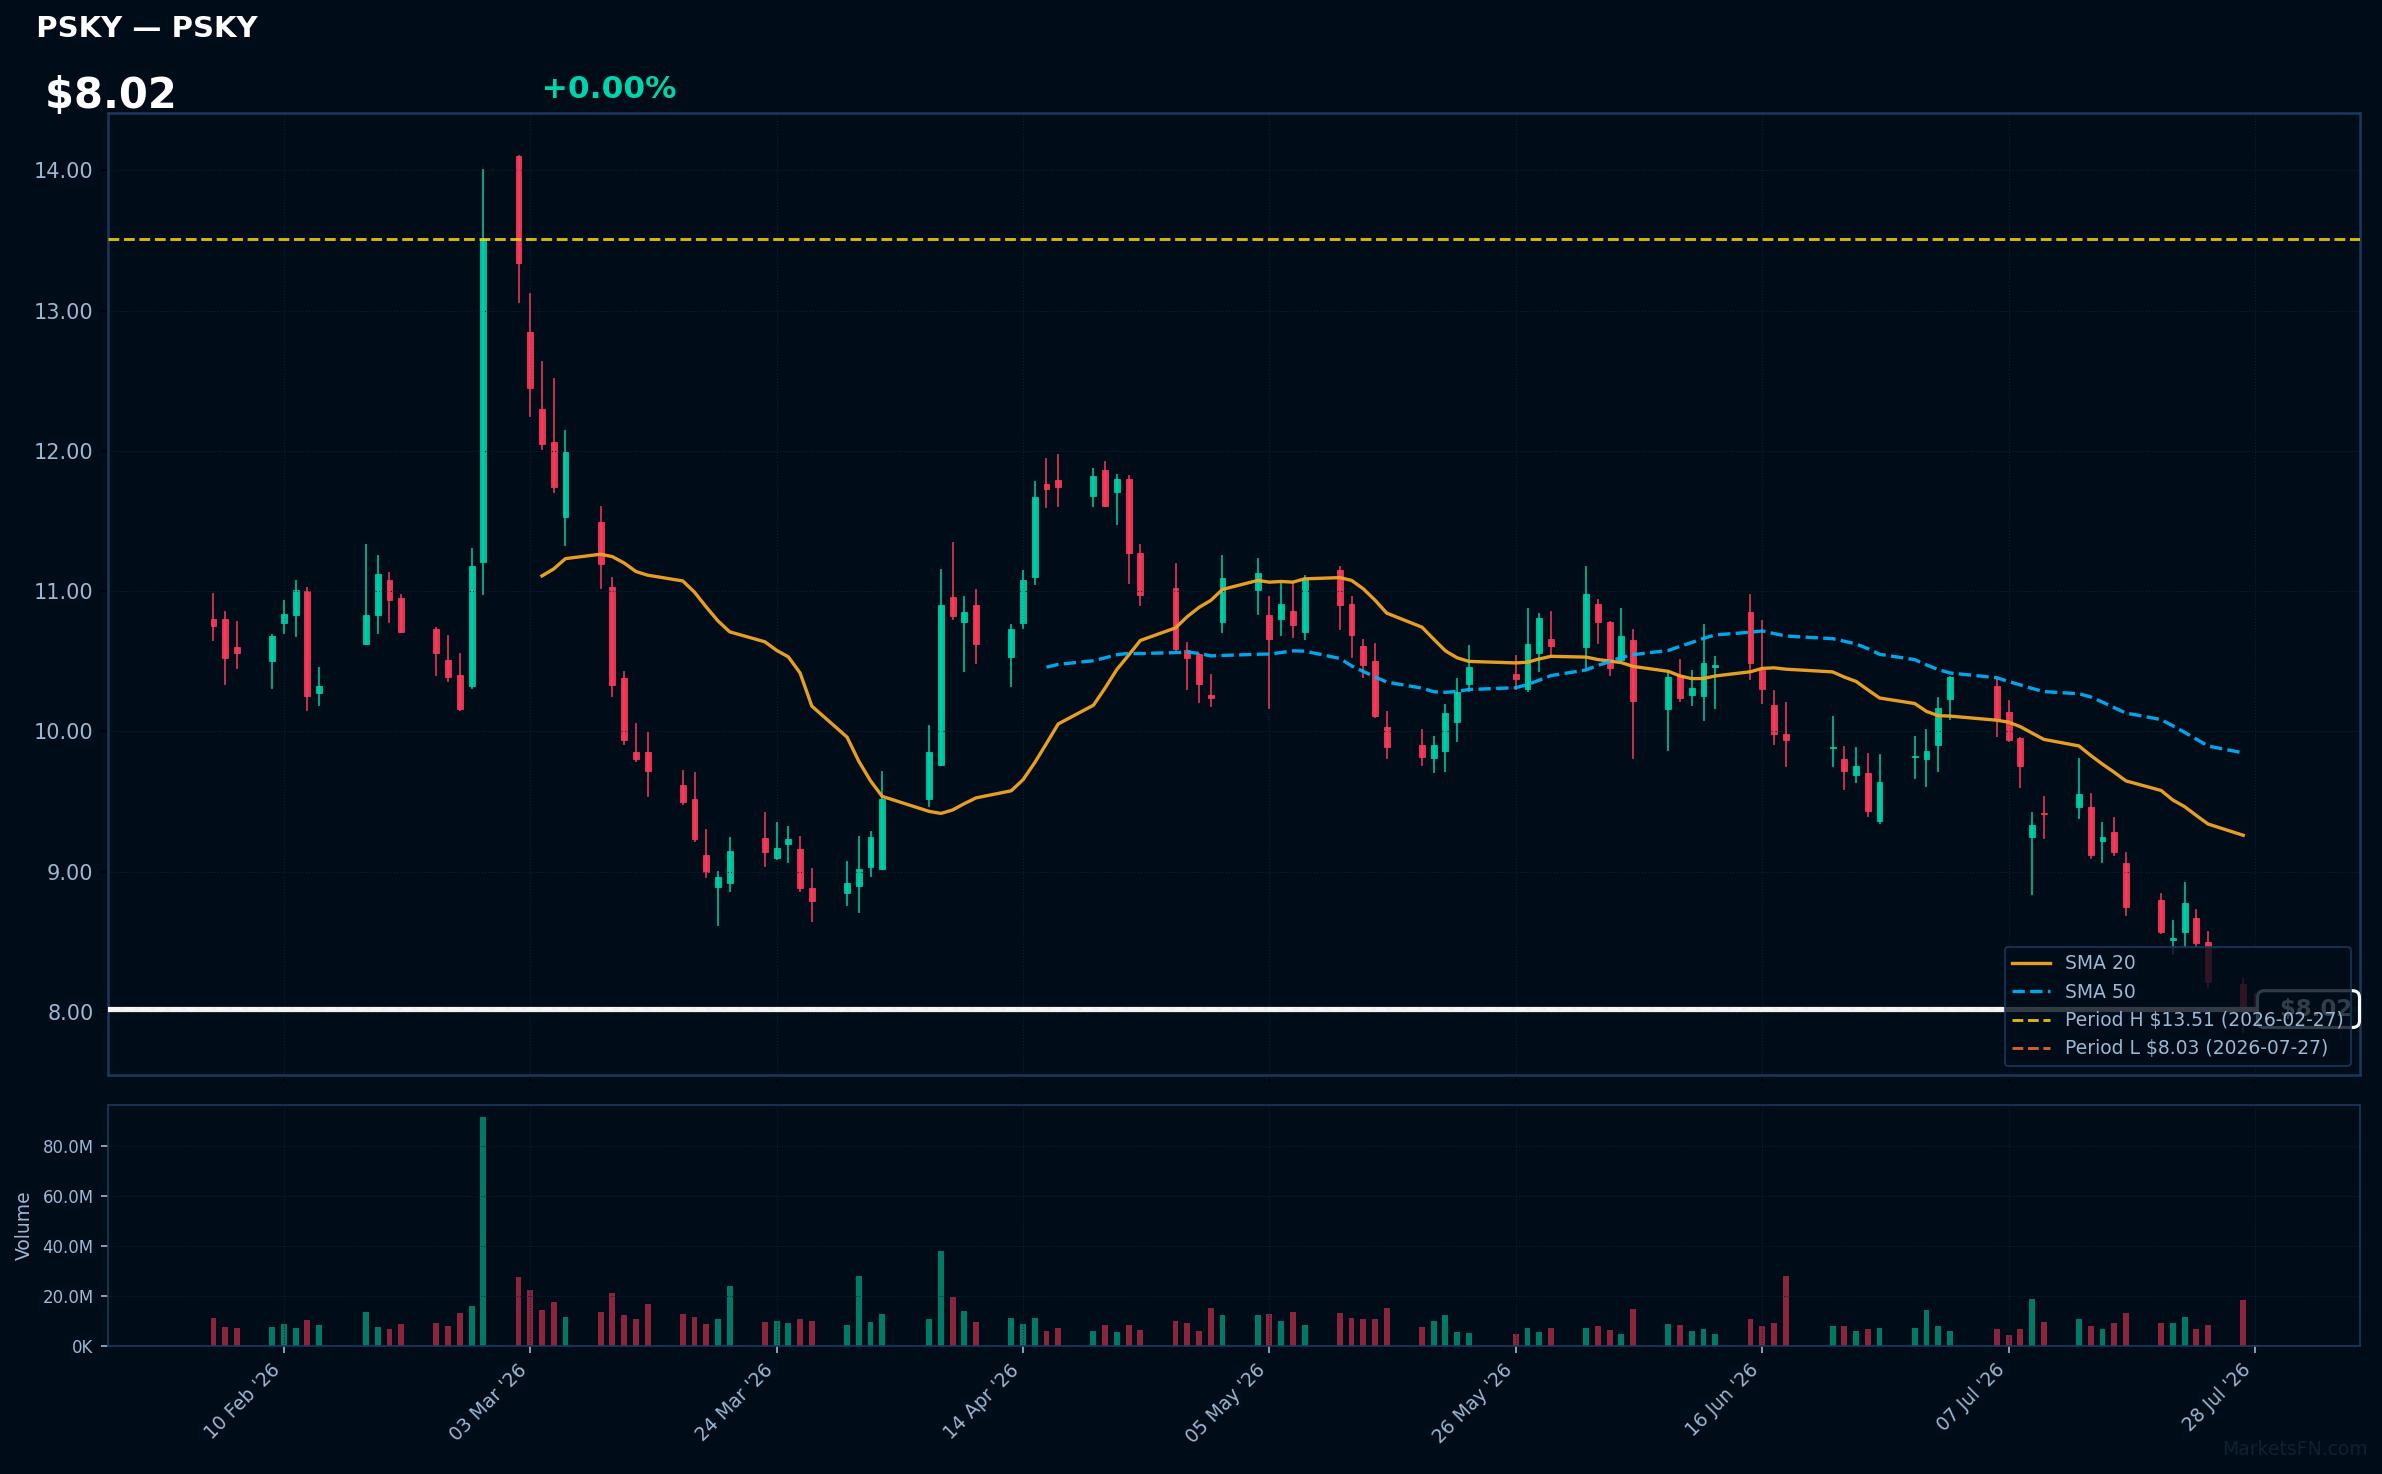
PSKY | Paramount Skydance Corp | Communication Services | Price Last: $8.03 | % Realized: -39.07% | RSI: 27.4 | % above MA200: -32.5% | Trend: Below MA20, MA50, MA200
Paramount Skydance Corp is not described in the data provided, making it impossible to determine its business activities or investor relevance.
The stock is in a sustained downtrend with an RSI(14) of 27.4, indicating oversold conditions. The price is at its 2026 YTD low, testing major support, with bearish MA alignment: $8.02 < MA20 < MA50 < MA200.
Related headlines
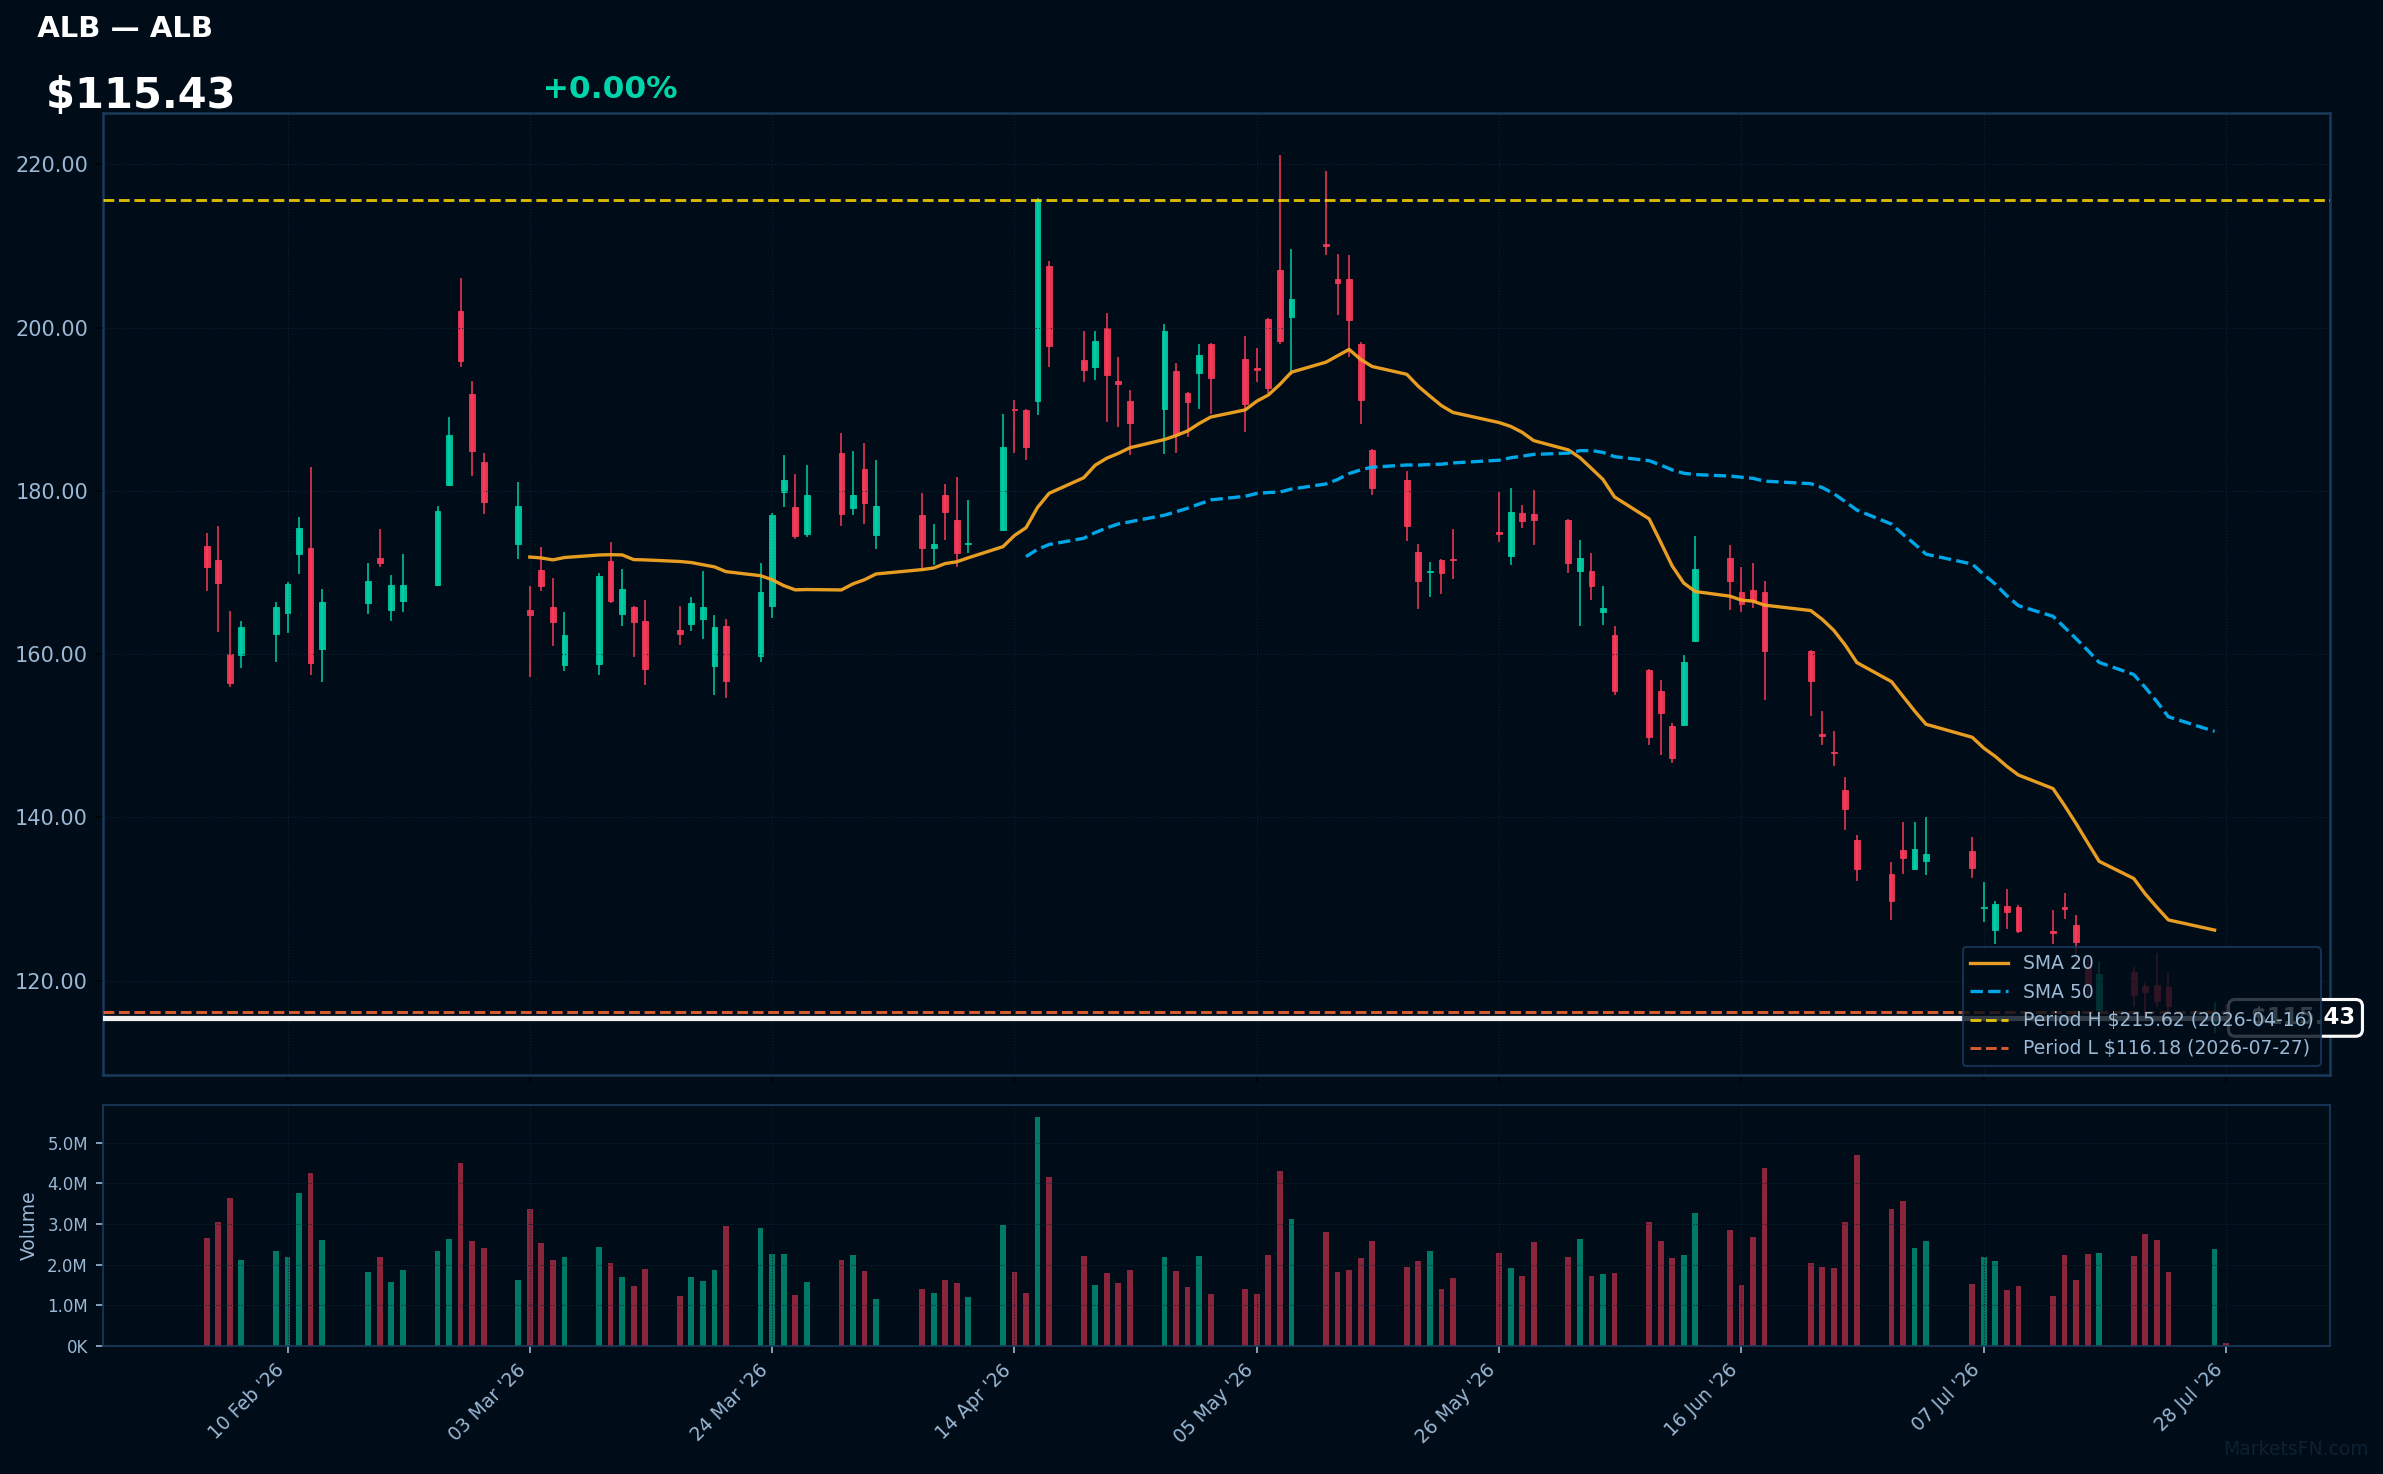
ALB | Albemarle Corp | Basic Materials | Price Last: $116.18 | % Realized: -19.28% | RSI: 25.4 | % above MA200: -23.6% | Trend: Below MA20, MA50, MA200
Albemarle Corp (ALB) is a leading producer of lithium, bromine, and refining catalysts. Investors care due to its critical role in lithium-ion battery production for electric vehicles, making its performance sensitive to trends in the EV and energy storage markets.
ALB's technical situation is bearish, with an RSI(14) of 25.4 indicating oversold conditions. The sustained downtrend is evident as price ($115.43) < MA20 < MA50 < MA200, and it's testing major support at its 2026 YTD low.
Related headlines
Market Commentary
The S&P 500 stocks listed are currently trading near their year-to-date (YTD) extremes for 2026. Stocks like AAPL, JPM, BAC, PM, and RTX are at their YTD highs, while TSLA, CCI, WBD, PSKY, and ALB are at their YTD lows. This indicates that these stocks have not seen significant price movements away from their current levels since the start of 2026.
The stocks at their YTD highs are from diverse sectors, including technology (AAPL), finance (JPM, BAC), consumer staples (PM), and industrials (RTX). In contrast, the stocks at their YTD lows are from technology (TSLA), real estate/infrastructure (CCI), communications (WBD, PSKY), and materials (ALB). This suggests varying sectoral performances, potentially influenced by factors such as earnings reports, industry trends, and macroeconomic conditions.
Investors should monitor upcoming earnings announcements, industry developments, and broader market trends to gauge the next direction for these stocks. As these stocks are near their YTD extremes, any significant move away from these levels could indicate a shift in market sentiment or sectoral dynamics.
Methodology: All 503 S&P 500 constituents screened. Close prices downloaded from 2026-01-01. Period high = highest close since Jan 1 2026; period low = lowest close since Jan 1 2026. Distance = (current price / period extreme − 1) × 100. Technical indicators computed on up to 1 year of daily OHLCV data.
Disclaimer: For informational purposes only. Not investment advice. Past performance is not indicative of future results.

