S&P 500 2026 YTD Highs & Lows Radar: Bristol-Myers Squibb (BMY), Synopsys, (SNPS) and more
MarketsFN Team

S&P 500 2026 YTD Highs & Lows Radar: Bristol-Myers Squibb (BMY), Synopsys, (SNPS) and more
Screening all 503 S&P 500 constituents for stocks nearest to their 2026 year-to-date high and their 2026 YTD low. Data as of July 31, 2026. % Realized = total return since Jan 1 2026.
Legend: RSI > 70 = overbought · RSI < 30 = oversold · Green % Realized = positive YTD return · Red = negative.
📈 Nearest to 2026 High
Sectors represented: Healthcare (2), Consumer Cyclical (1), Technology (1), Communication Services (1)
| Ticker | Company | Sector | Price Last | % Realized | 2026 YTD High Date | RSI | % above MA200 | Trend |
|---|---|---|---|---|---|---|---|---|
| BMY | Bristol-Myers Squibb Co | Healthcare | $64.86 | +21.32% | 2026-07-30 | 69.4 | +16.7% | Above MA20, MA50, MA200 |
| ROST | Ross Stores, Inc | Consumer Cyclical | $252.57 | +38.21% | 2026-07-30 | 70.8 | +24.8% | Above MA20, MA50, MA200 |
| GRMN | Garmin Ltd | Technology | $297.55 | +46.98% | 2026-07-30 | 75.7 | +29.7% | Above MA20, MA50, MA200 |
| EA | Electronic Arts, Inc | Communication Services | $209.59 | +2.53% | 2026-07-30 | 79.0 | +3.4% | Above MA20, MA50, MA200 |
| LH | Labcorp Holdings Inc | Healthcare | $315.53 | +25.38% | 2026-07-30 | 71.3 | +17.6% | Above MA20, MA50, MA200 |
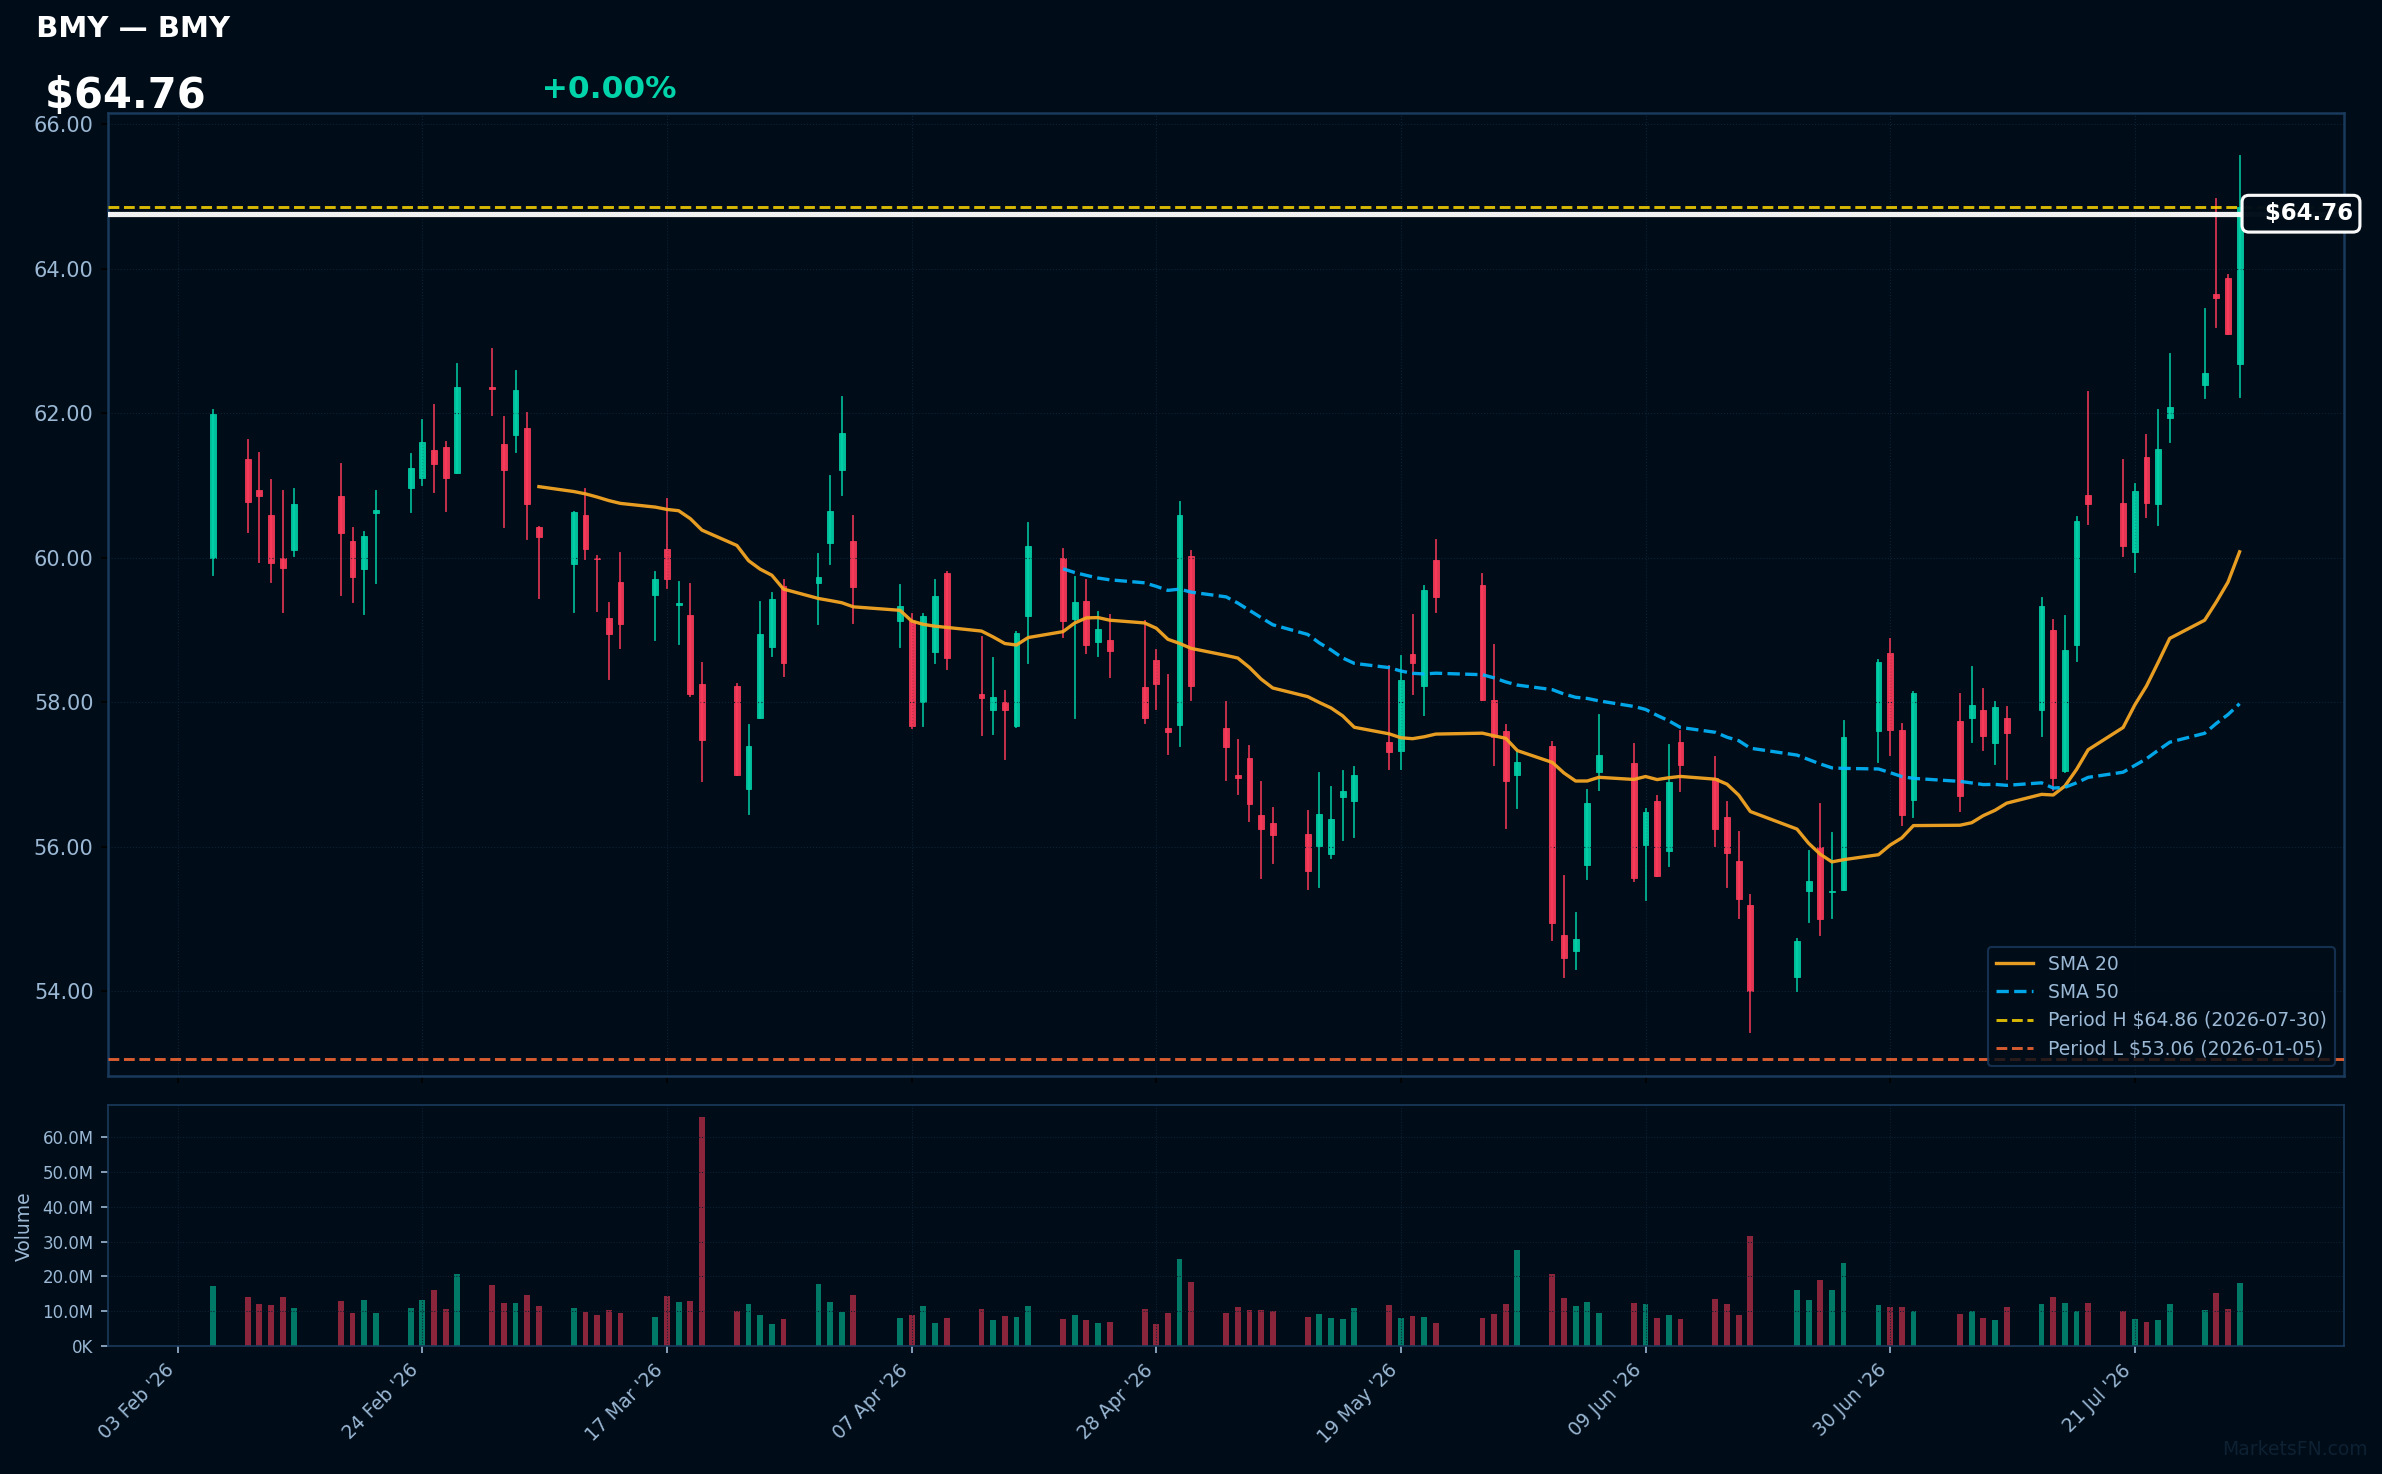
BMY | Bristol-Myers Squibb Co | Healthcare | Price Last: $64.86 | % Realized: +21.32% | RSI: 69.4 | % above MA200: +16.7% | Trend: Above MA20, MA50, MA200
Bristol-Myers Squibb Co develops innovative pharmaceuticals, focusing on oncology, immunology, and cardiovascular diseases. Investors should care due to its strong pipeline and market position, which can drive growth and profitability in a competitive healthcare landscape.
The stock shows bullish momentum with an RSI(14) of 69.4 and a strong MA alignment: price > MA20 > MA50 > MA200. It is 0.0% below its 2026 YTD high, indicating a potential breakout.
Related headlines
- Bristol-Myers Squibb Company Q2 2026 Earnings Call Summary
- Bristol-Myers Squibb Co (BMY) (Q2 2026) Earnings Call Highlights: Growth Portfolio Surges 14%, ...
- Bristol-Myers Squibb raises annual outlook as Q2 tops estimates; shares up
- SLS Stock Snaps 2-Day Slide: Sellas SLS009 AML Trial Spotlights Big Pharma Drug Combo From ABBV, RHHBY And BMY
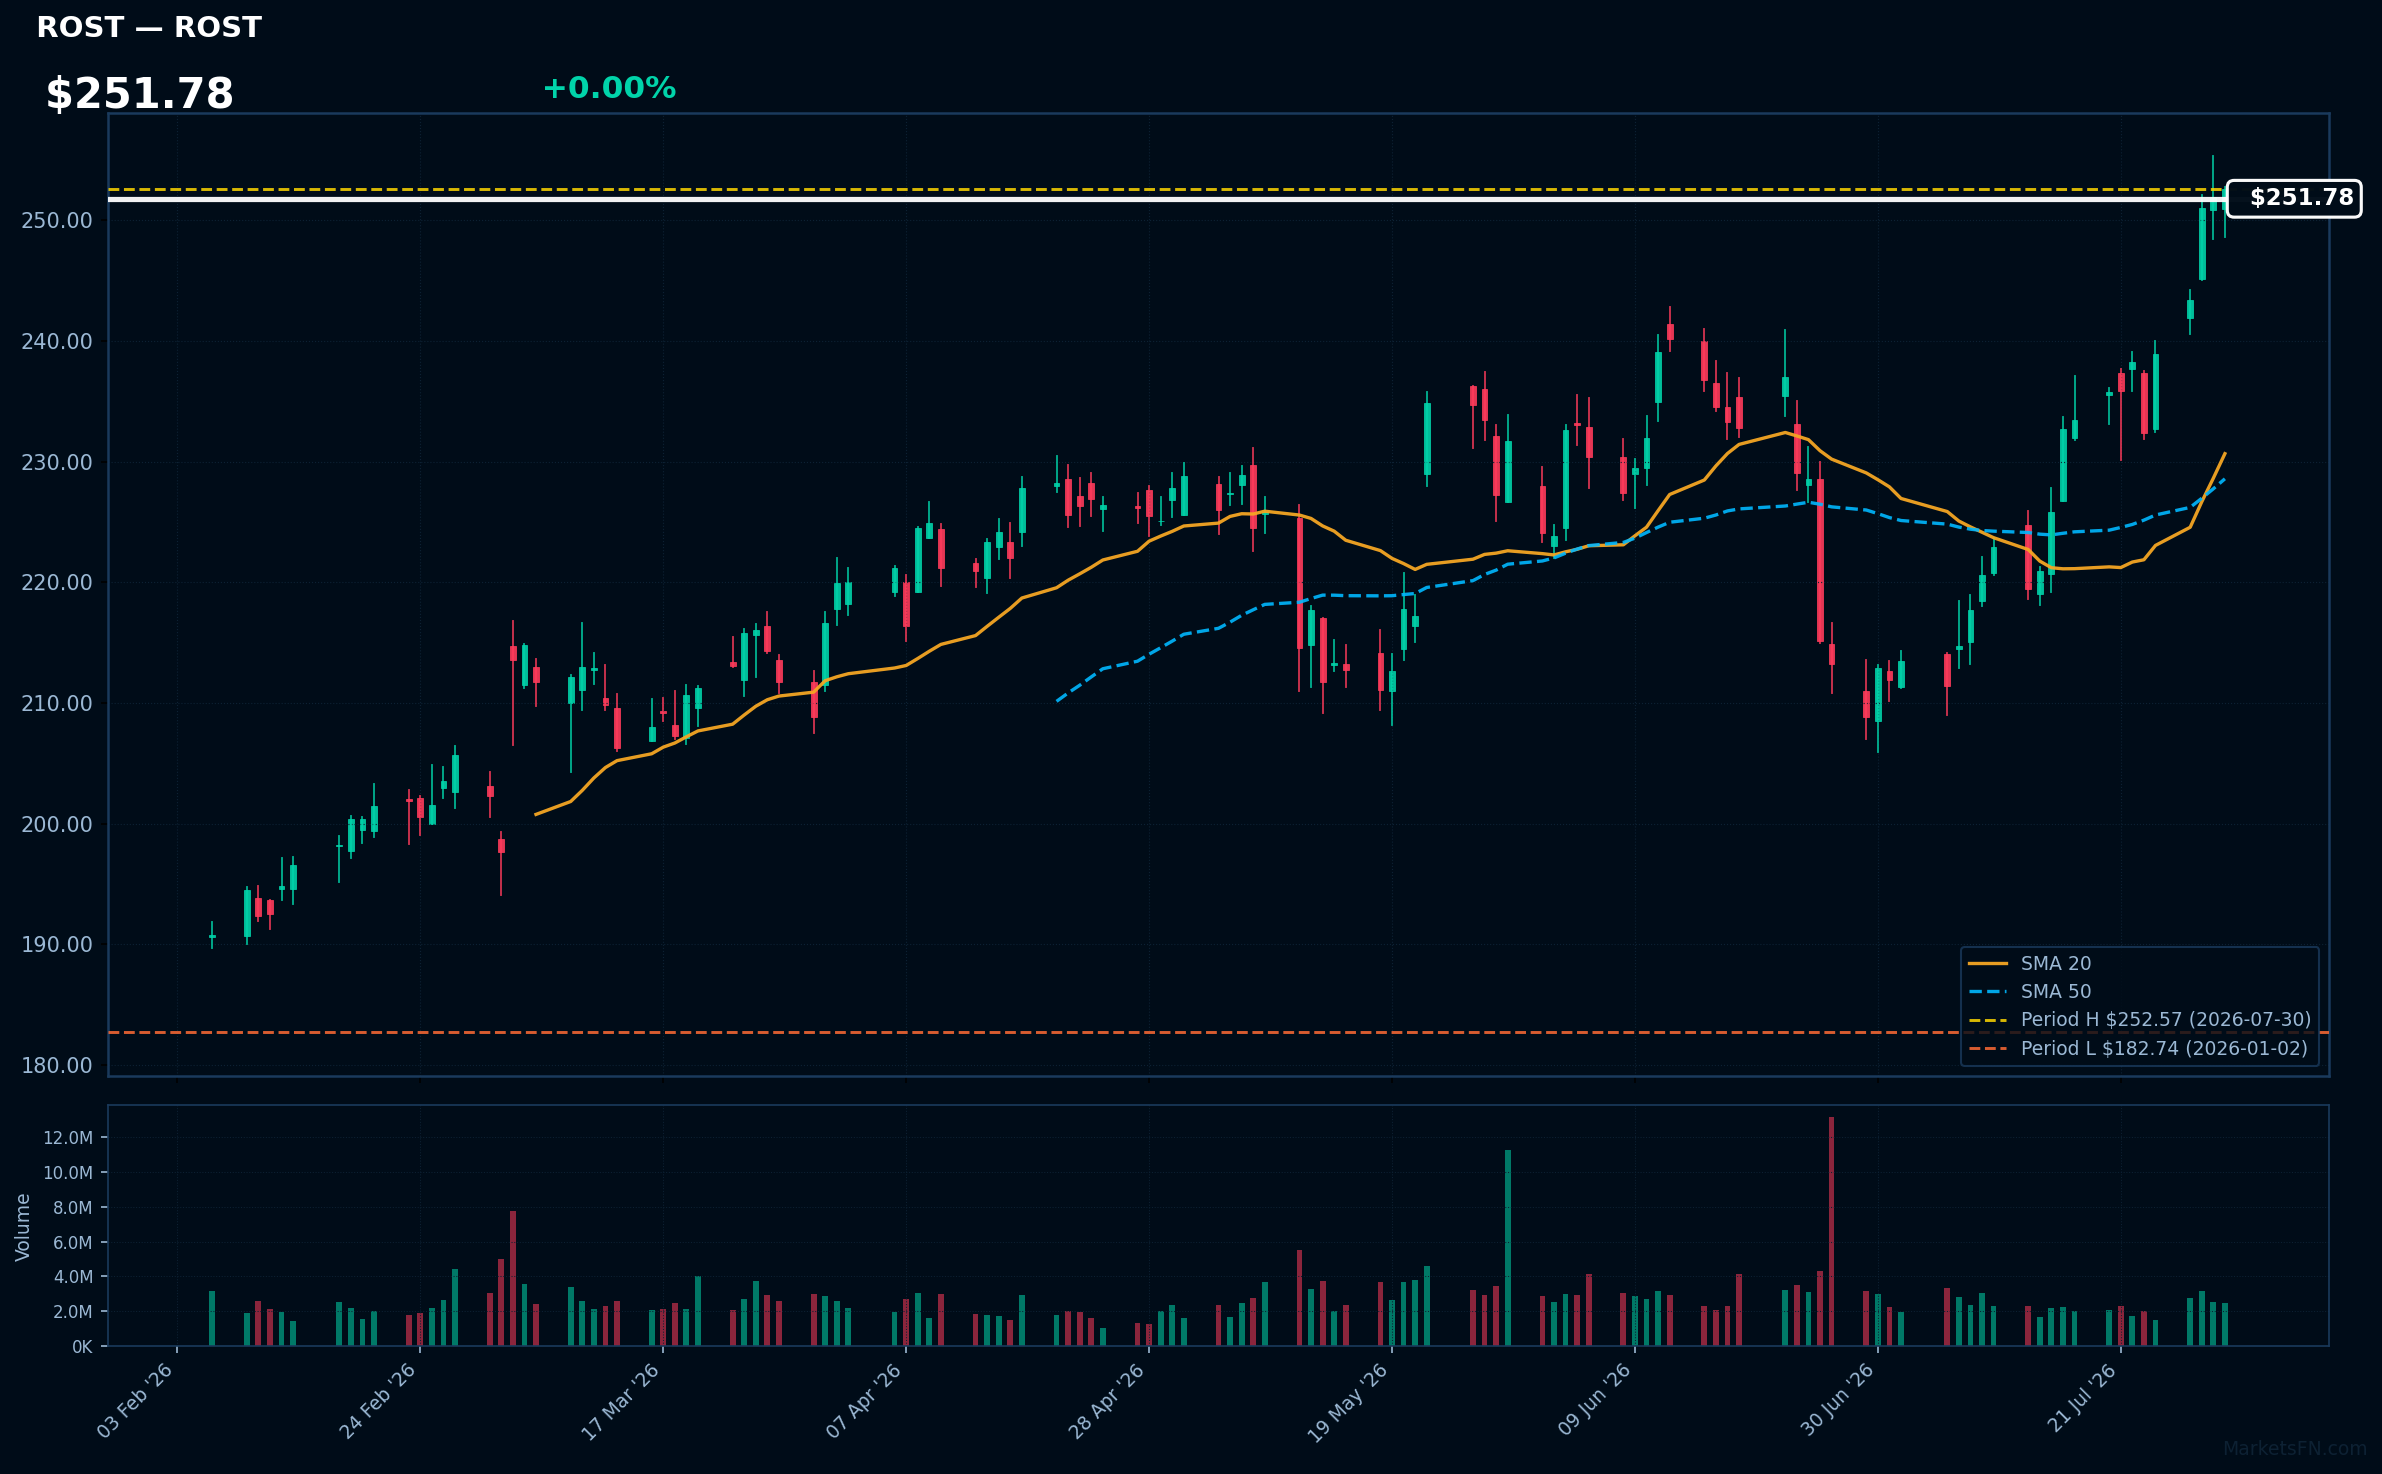
ROST | Ross Stores, Inc | Consumer Cyclical | Price Last: $252.57 | % Realized: +38.21% | RSI: 70.8 | % above MA200: +24.8% | Trend: Above MA20, MA50, MA200
Ross Stores, Inc operates off-price retail chains, offering discounted apparel and home goods. Investors should care due to its strong market position and ability to attract cost-conscious consumers, especially in economic downturns, which can drive sales growth and profitability.
The current technical situation indicates bullish momentum, with an RSI(14) of 70.8 and a bullish MA alignment: price > MA20 > MA50 > MA200. The stock is also 0.0% below its 2026 YTD high, suggesting a potential breakout.
Related headlines
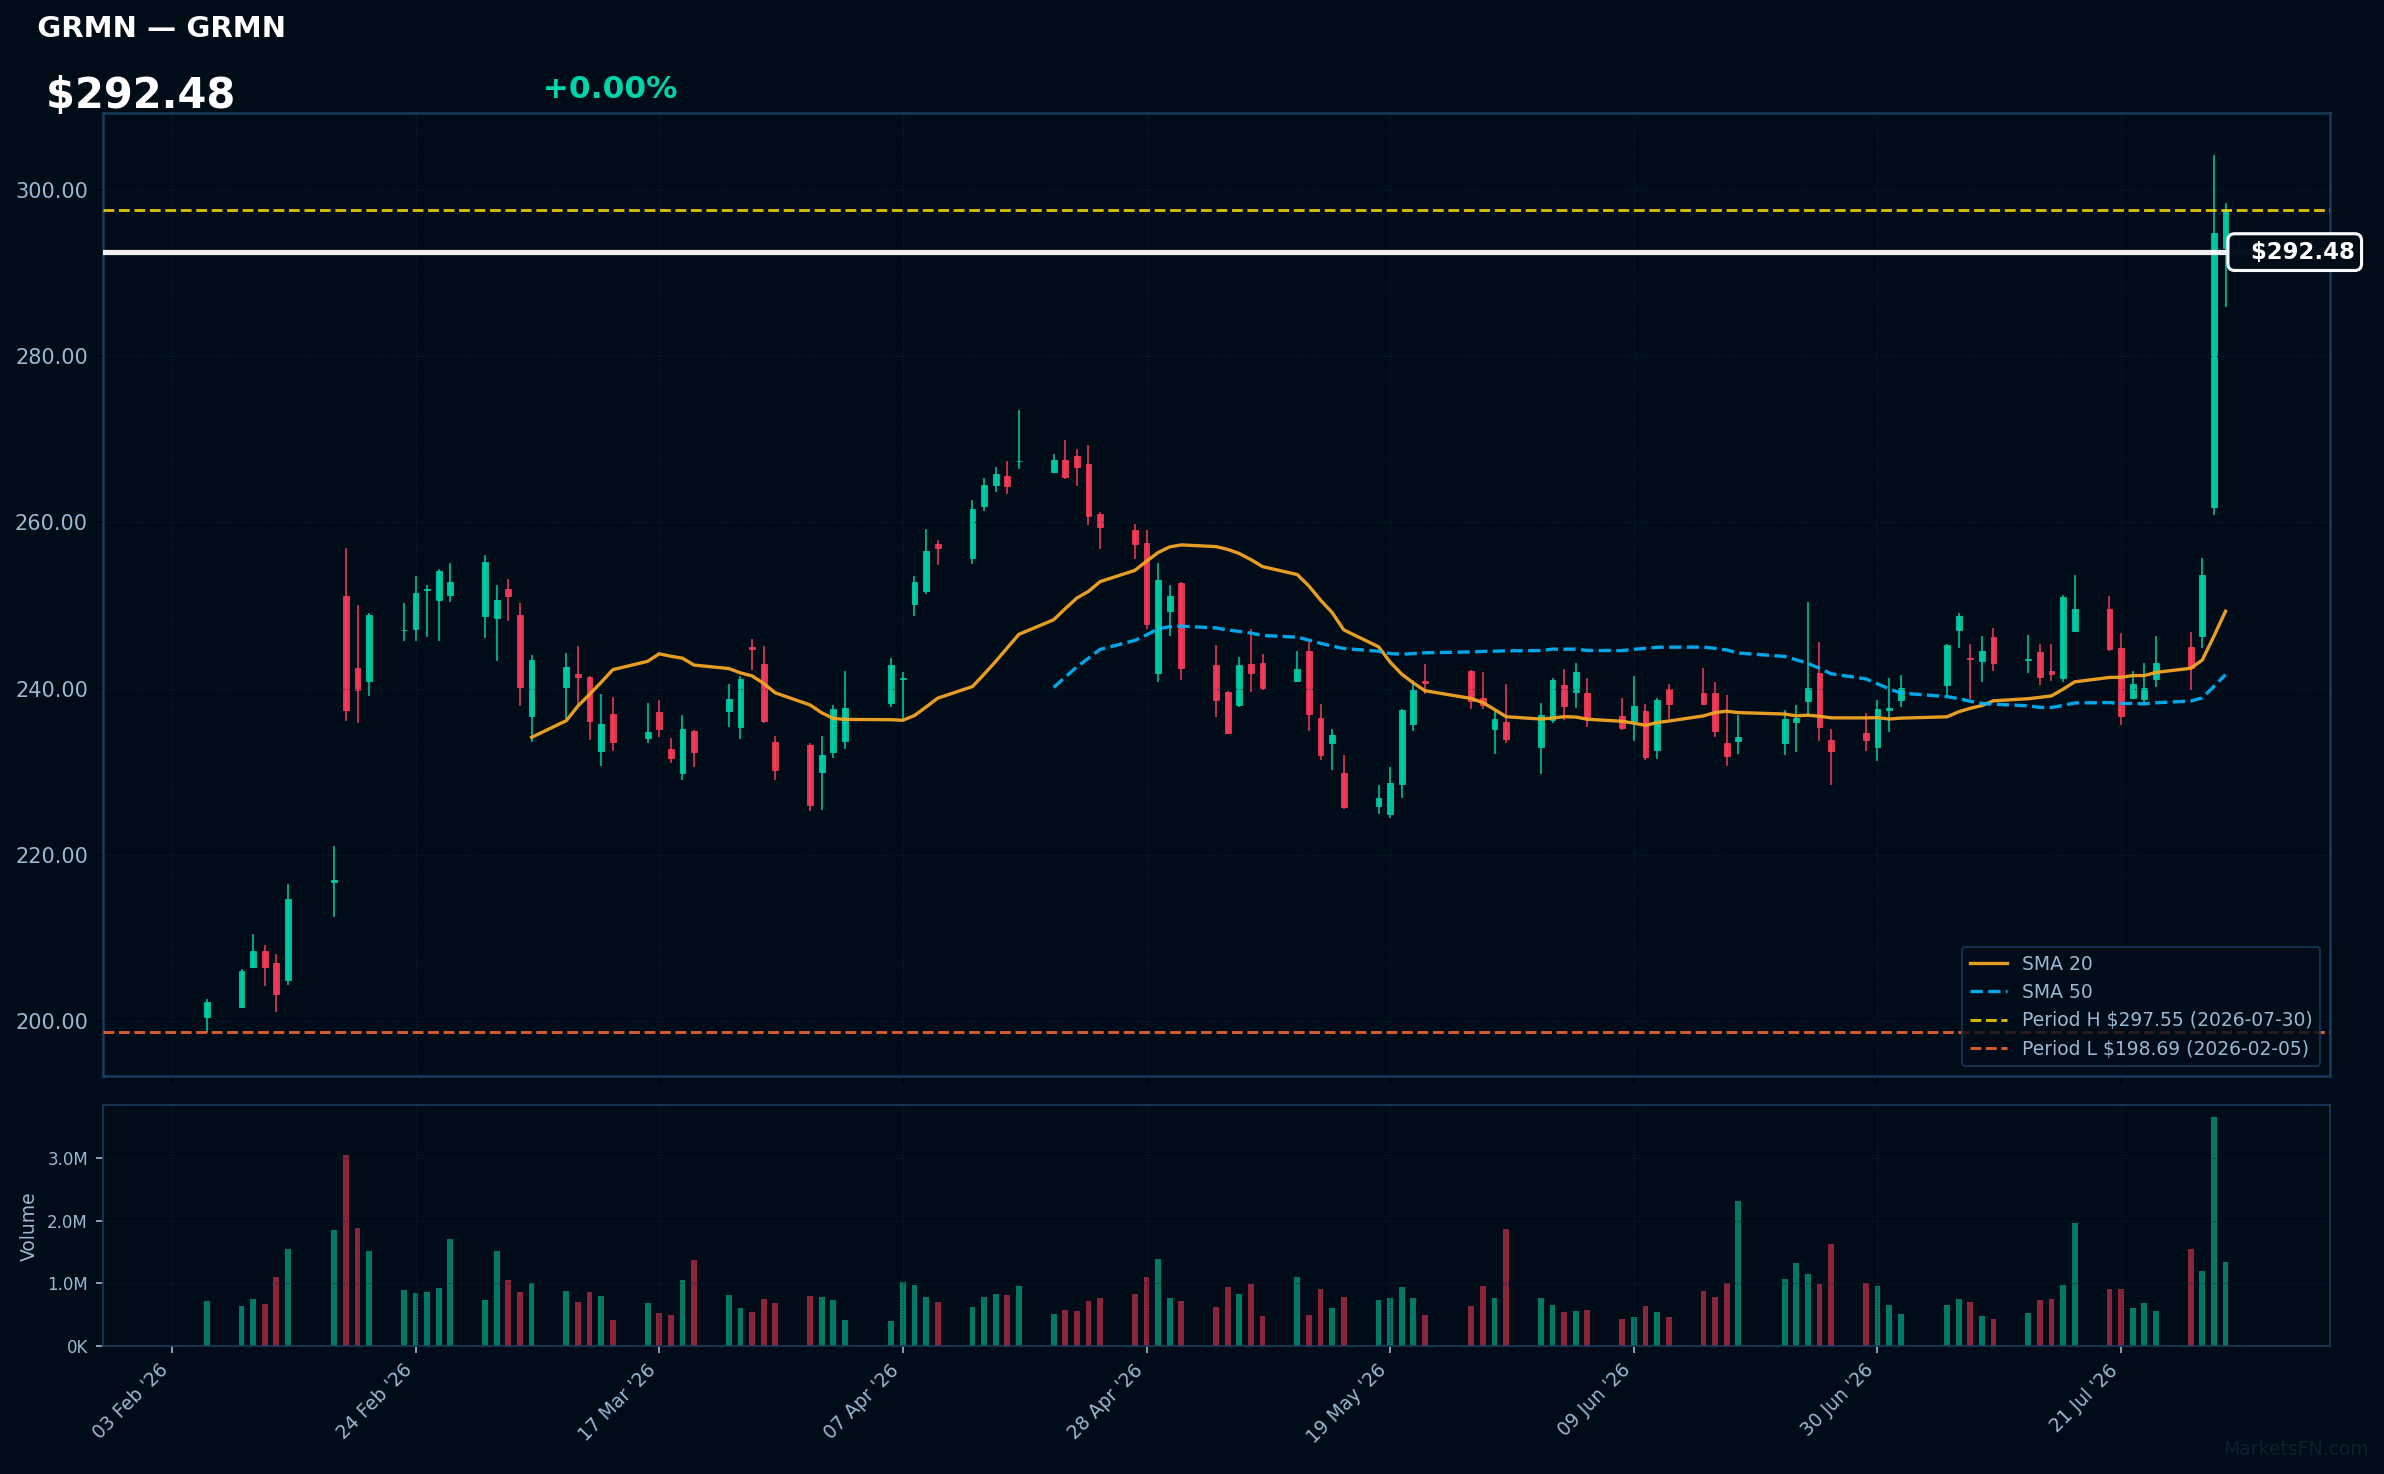
GRMN | Garmin Ltd | Technology | Price Last: $297.55 | % Realized: +46.98% | RSI: 75.7 | % above MA200: +29.7% | Trend: Above MA20, MA50, MA200
Garmin Ltd (GRMN) specializes in GPS technology and wearable fitness devices, catering to diverse markets including automotive, aviation, marine, and outdoor recreation. Investors should care due to its innovative product offerings and strong brand presence, which drive consistent revenue growth.
The current technical situation indicates strong momentum, with an RSI(14) of 75.7 and a bullish MA alignment: price > MA20 > MA50 > MA200. The stock is also 0.0% below its 2026 YTD high, signaling a potential breakout.
Related headlines
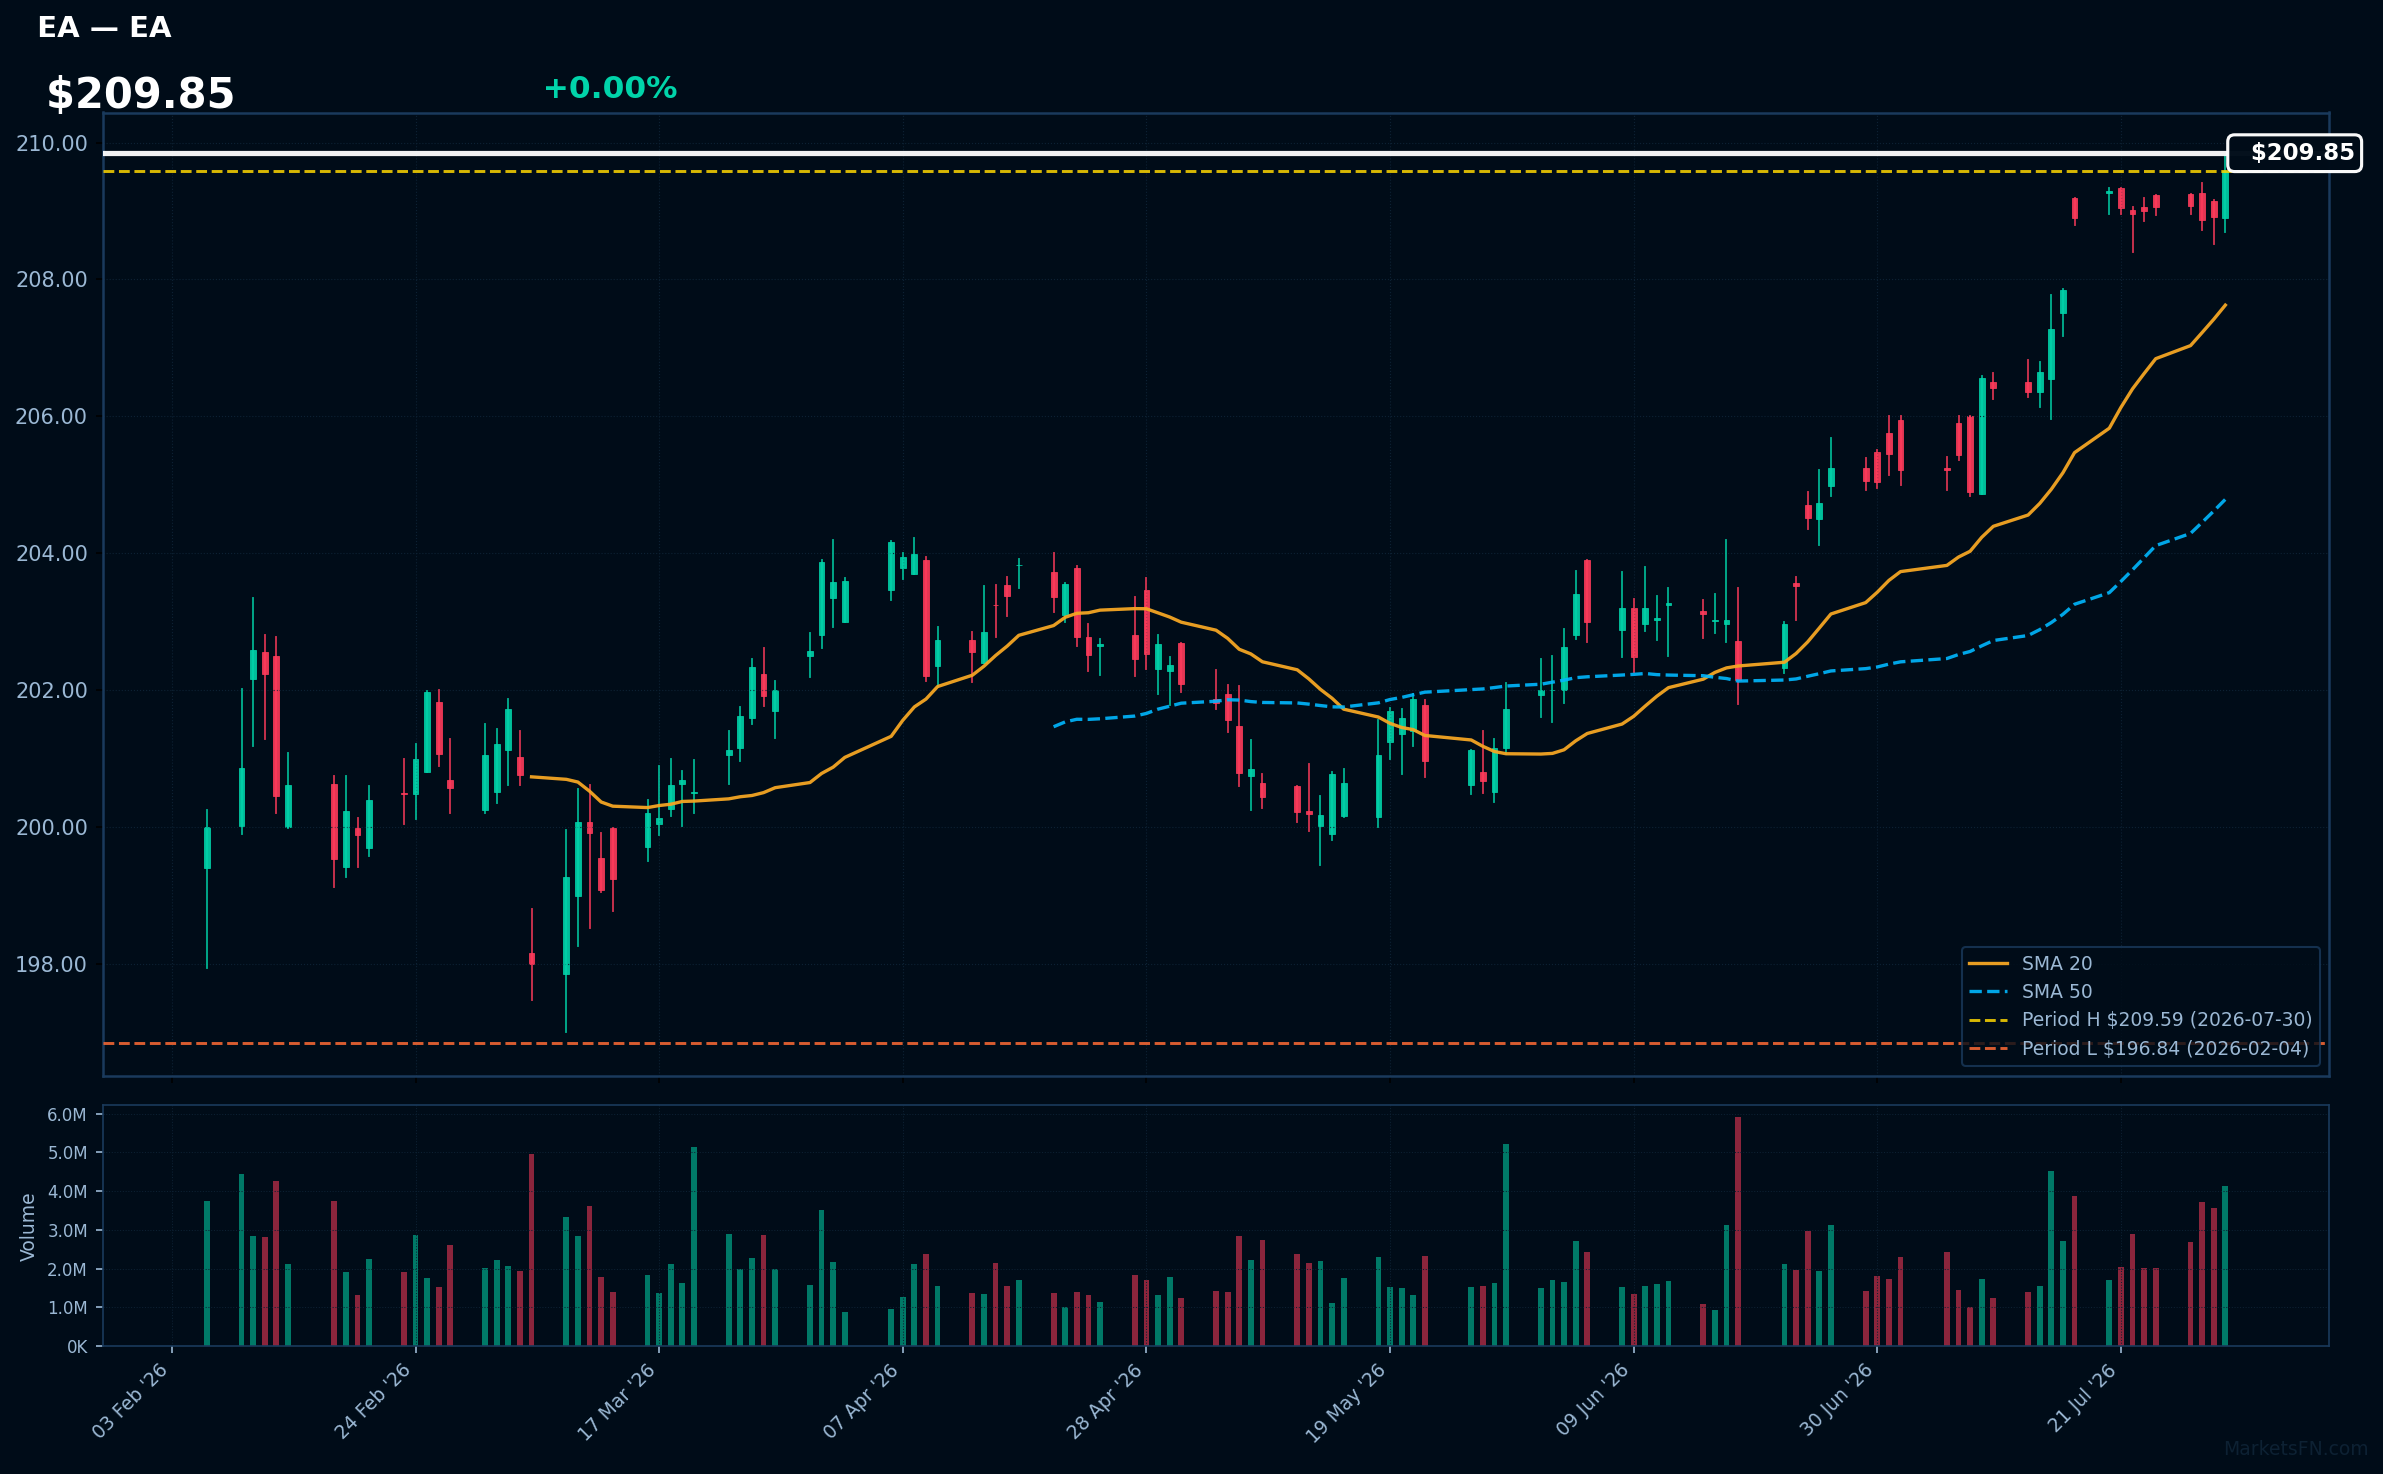
EA | Electronic Arts, Inc | Communication Services | Price Last: $209.59 | % Realized: +2.53% | RSI: 79.0 | % above MA200: +3.4% | Trend: Above MA20, MA50, MA200
Electronic Arts, Inc. develops and publishes interactive entertainment software, including popular franchises like FIFA and The Sims. Investors should care due to its strong market position and consistent revenue generation in the competitive gaming industry.
The current technical situation shows bullish momentum with an RSI of 79.0 and a MA alignment of price > MA20 > MA50 > MA200, indicating a sustained uptrend.
Related headlines
- Saudi PIF's $55 billion EA deal gets EU approval under subsidy rules
- EU clears PIF acquisition of sole control of EA in $55bn deal
- Kylian Mbappe and Jude Bellingham Welcome You to EA SPORTS FC 27, Launching Worldwide on September 25
- Kylian Mbapp and Jude Bellingham Welcome You to EA SPORTS FC 27, Launching Worldwide on September 25
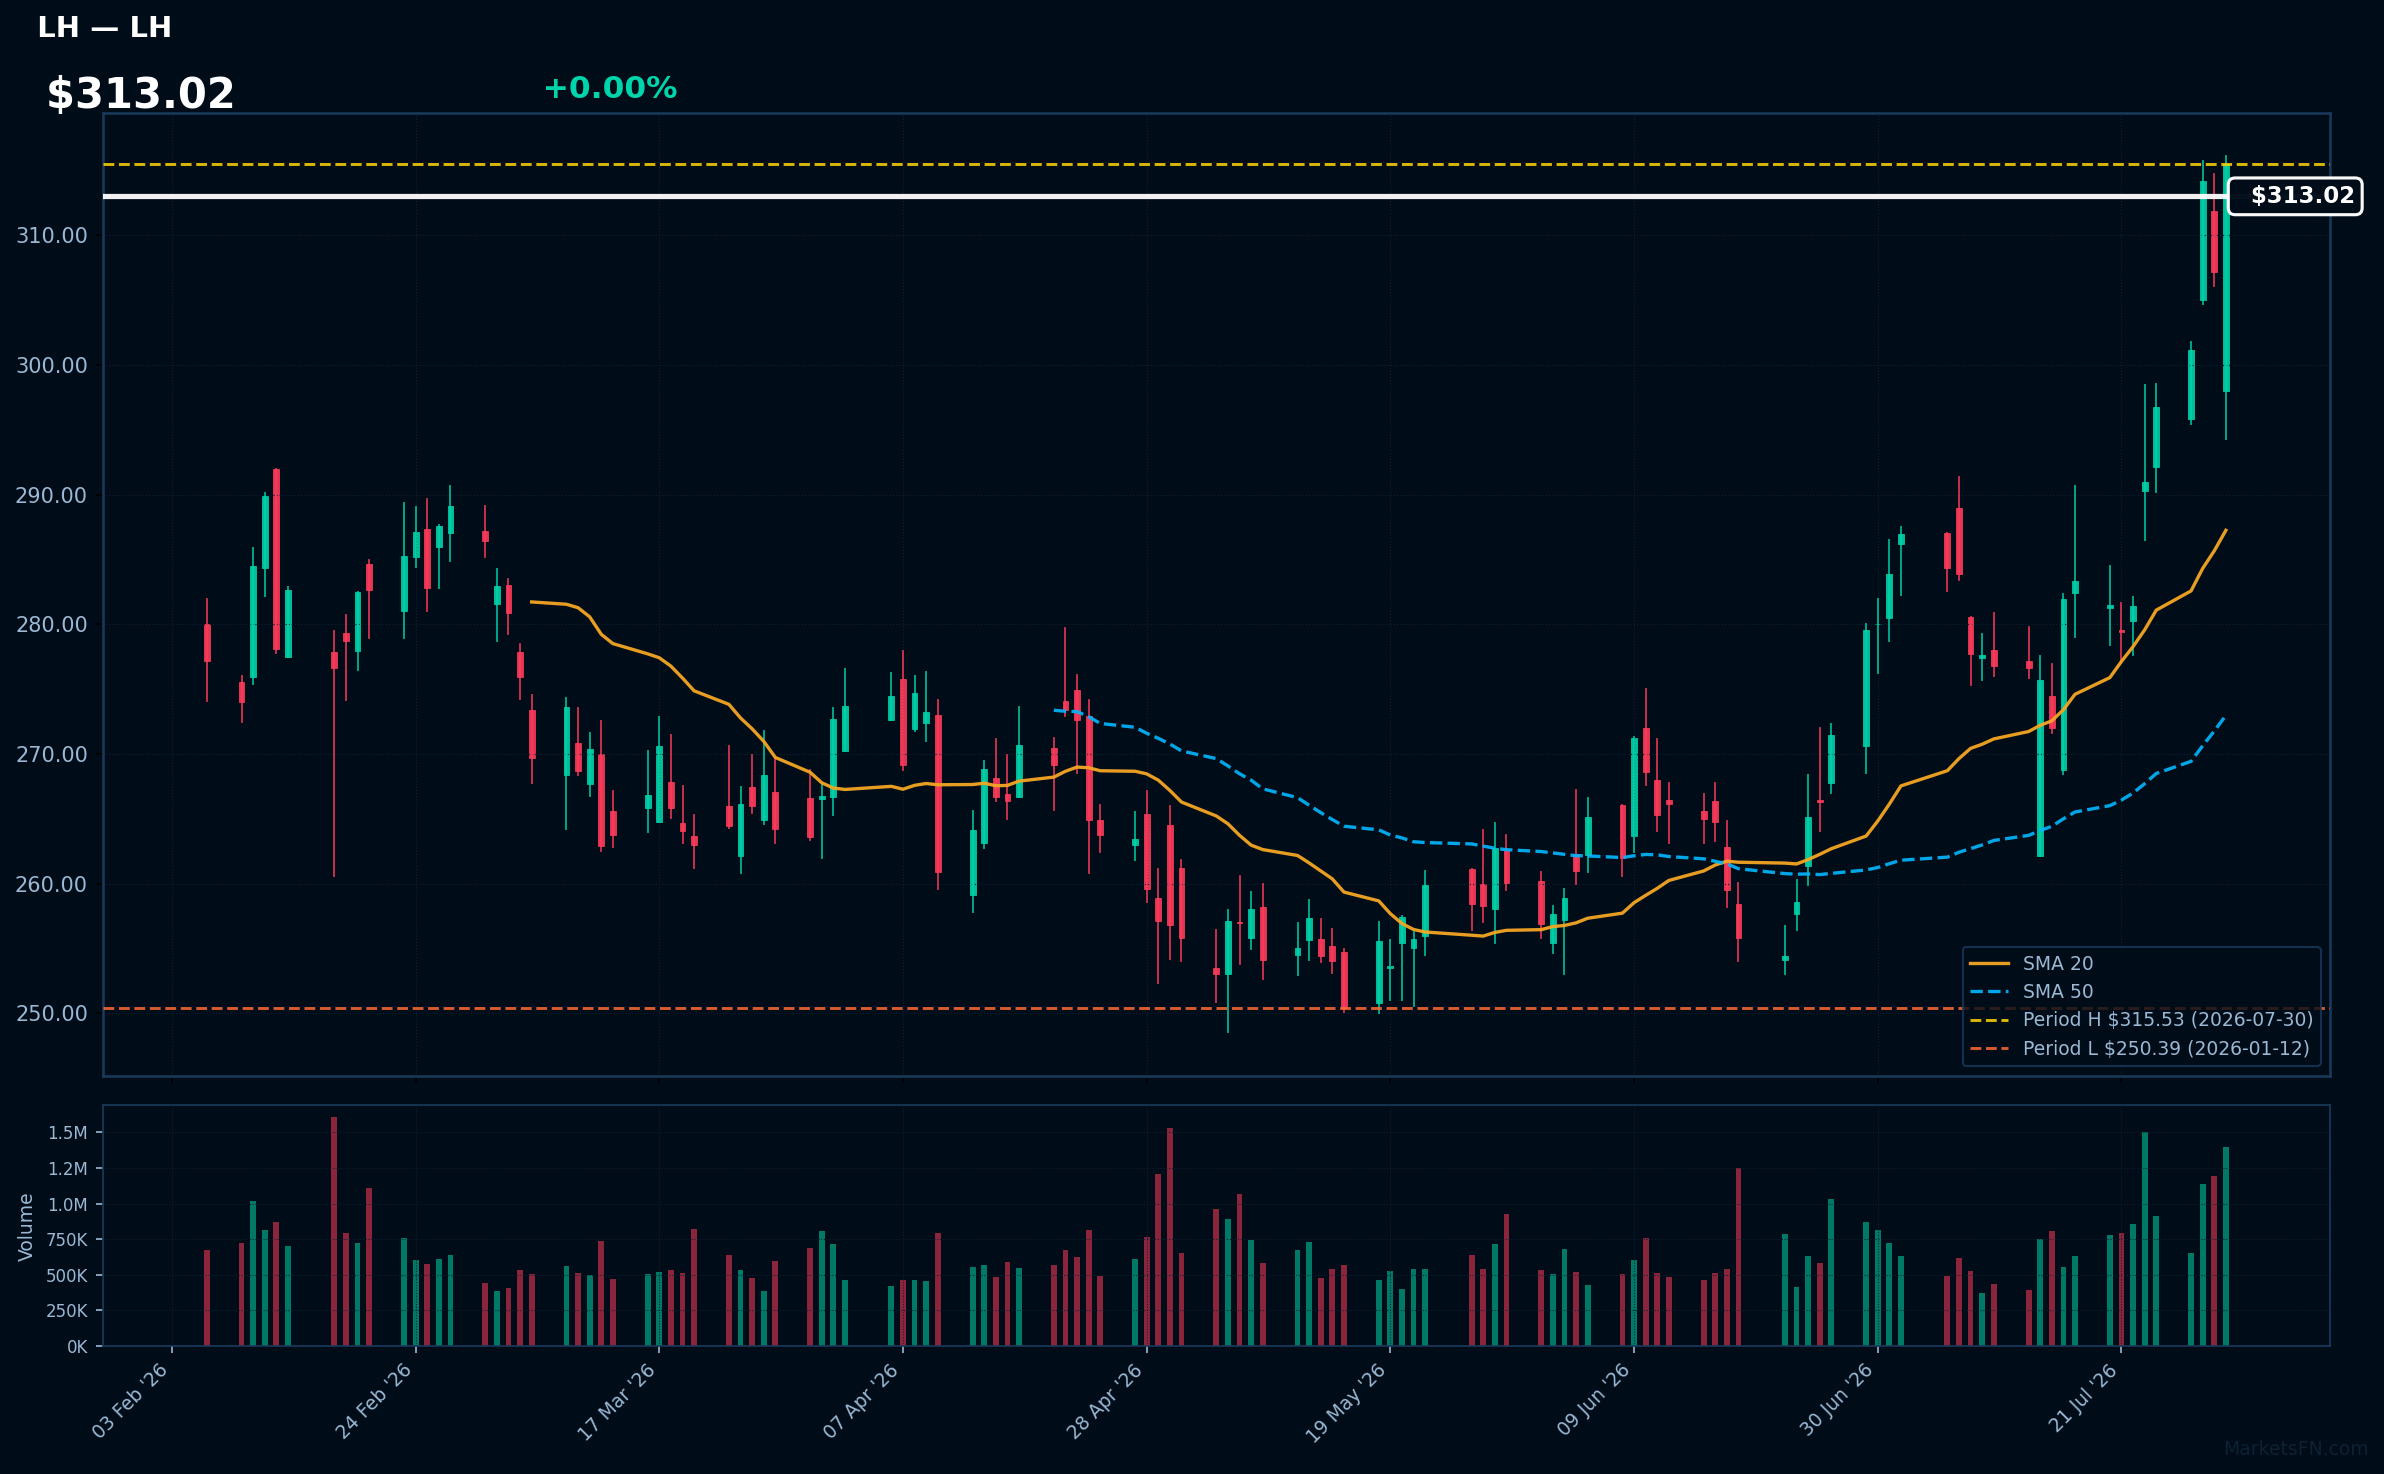
LH | Labcorp Holdings Inc | Healthcare | Price Last: $315.53 | % Realized: +25.38% | RSI: 71.3 | % above MA200: +17.6% | Trend: Above MA20, MA50, MA200
Labcorp Holdings Inc (LH) provides comprehensive laboratory services and diagnostic solutions, crucial for healthcare providers and pharmaceutical companies. Investors should care due to its pivotal role in improving patient outcomes and supporting drug development, which drives demand for its services.
The current technical situation indicates strong momentum, with an RSI(14) of 71.3 and a bullish MA alignment: price > MA20 > MA50 > MA200. The stock is 0.0% below its 2026 YTD high, suggesting a potential breakout.
Related headlines
📉 Nearest to 2026 Low
Sectors represented: Industrials (2), Technology (1), Consumer Cyclical (1), Communication Services (1)
| Ticker | Company | Sector | Price Last | % Realized | 2026 YTD Low Date | RSI | % above MA200 | Trend |
|---|---|---|---|---|---|---|---|---|
| SNPS | Synopsys, Inc | Technology | $372.33 | -22.50% | 2026-07-30 | 38.7 | -17.2% | Below MA20, MA50, MA200 |
| LHX | L3Harris Technologies Inc | Industrials | $271.90 | -10.70% | 2026-07-30 | 36.9 | -14.0% | Below MA20, MA50, MA200 |
| ROL | Rollins, Inc | Consumer Cyclical | $38.35 | -35.01% | 2026-07-30 | 26.2 | -30.1% | Below MA20, MA50, MA200 |
| LII | Lennox International Inc | Industrials | $417.45 | -16.33% | 2026-07-30 | 25.0 | -18.0% | Below MA20, MA50, MA200 |
| PSKY | Paramount Skydance Corp | Communication Services | $7.81 | -40.74% | 2026-07-30 | 25.0 | -33.6% | Below MA20, MA50, MA200 |
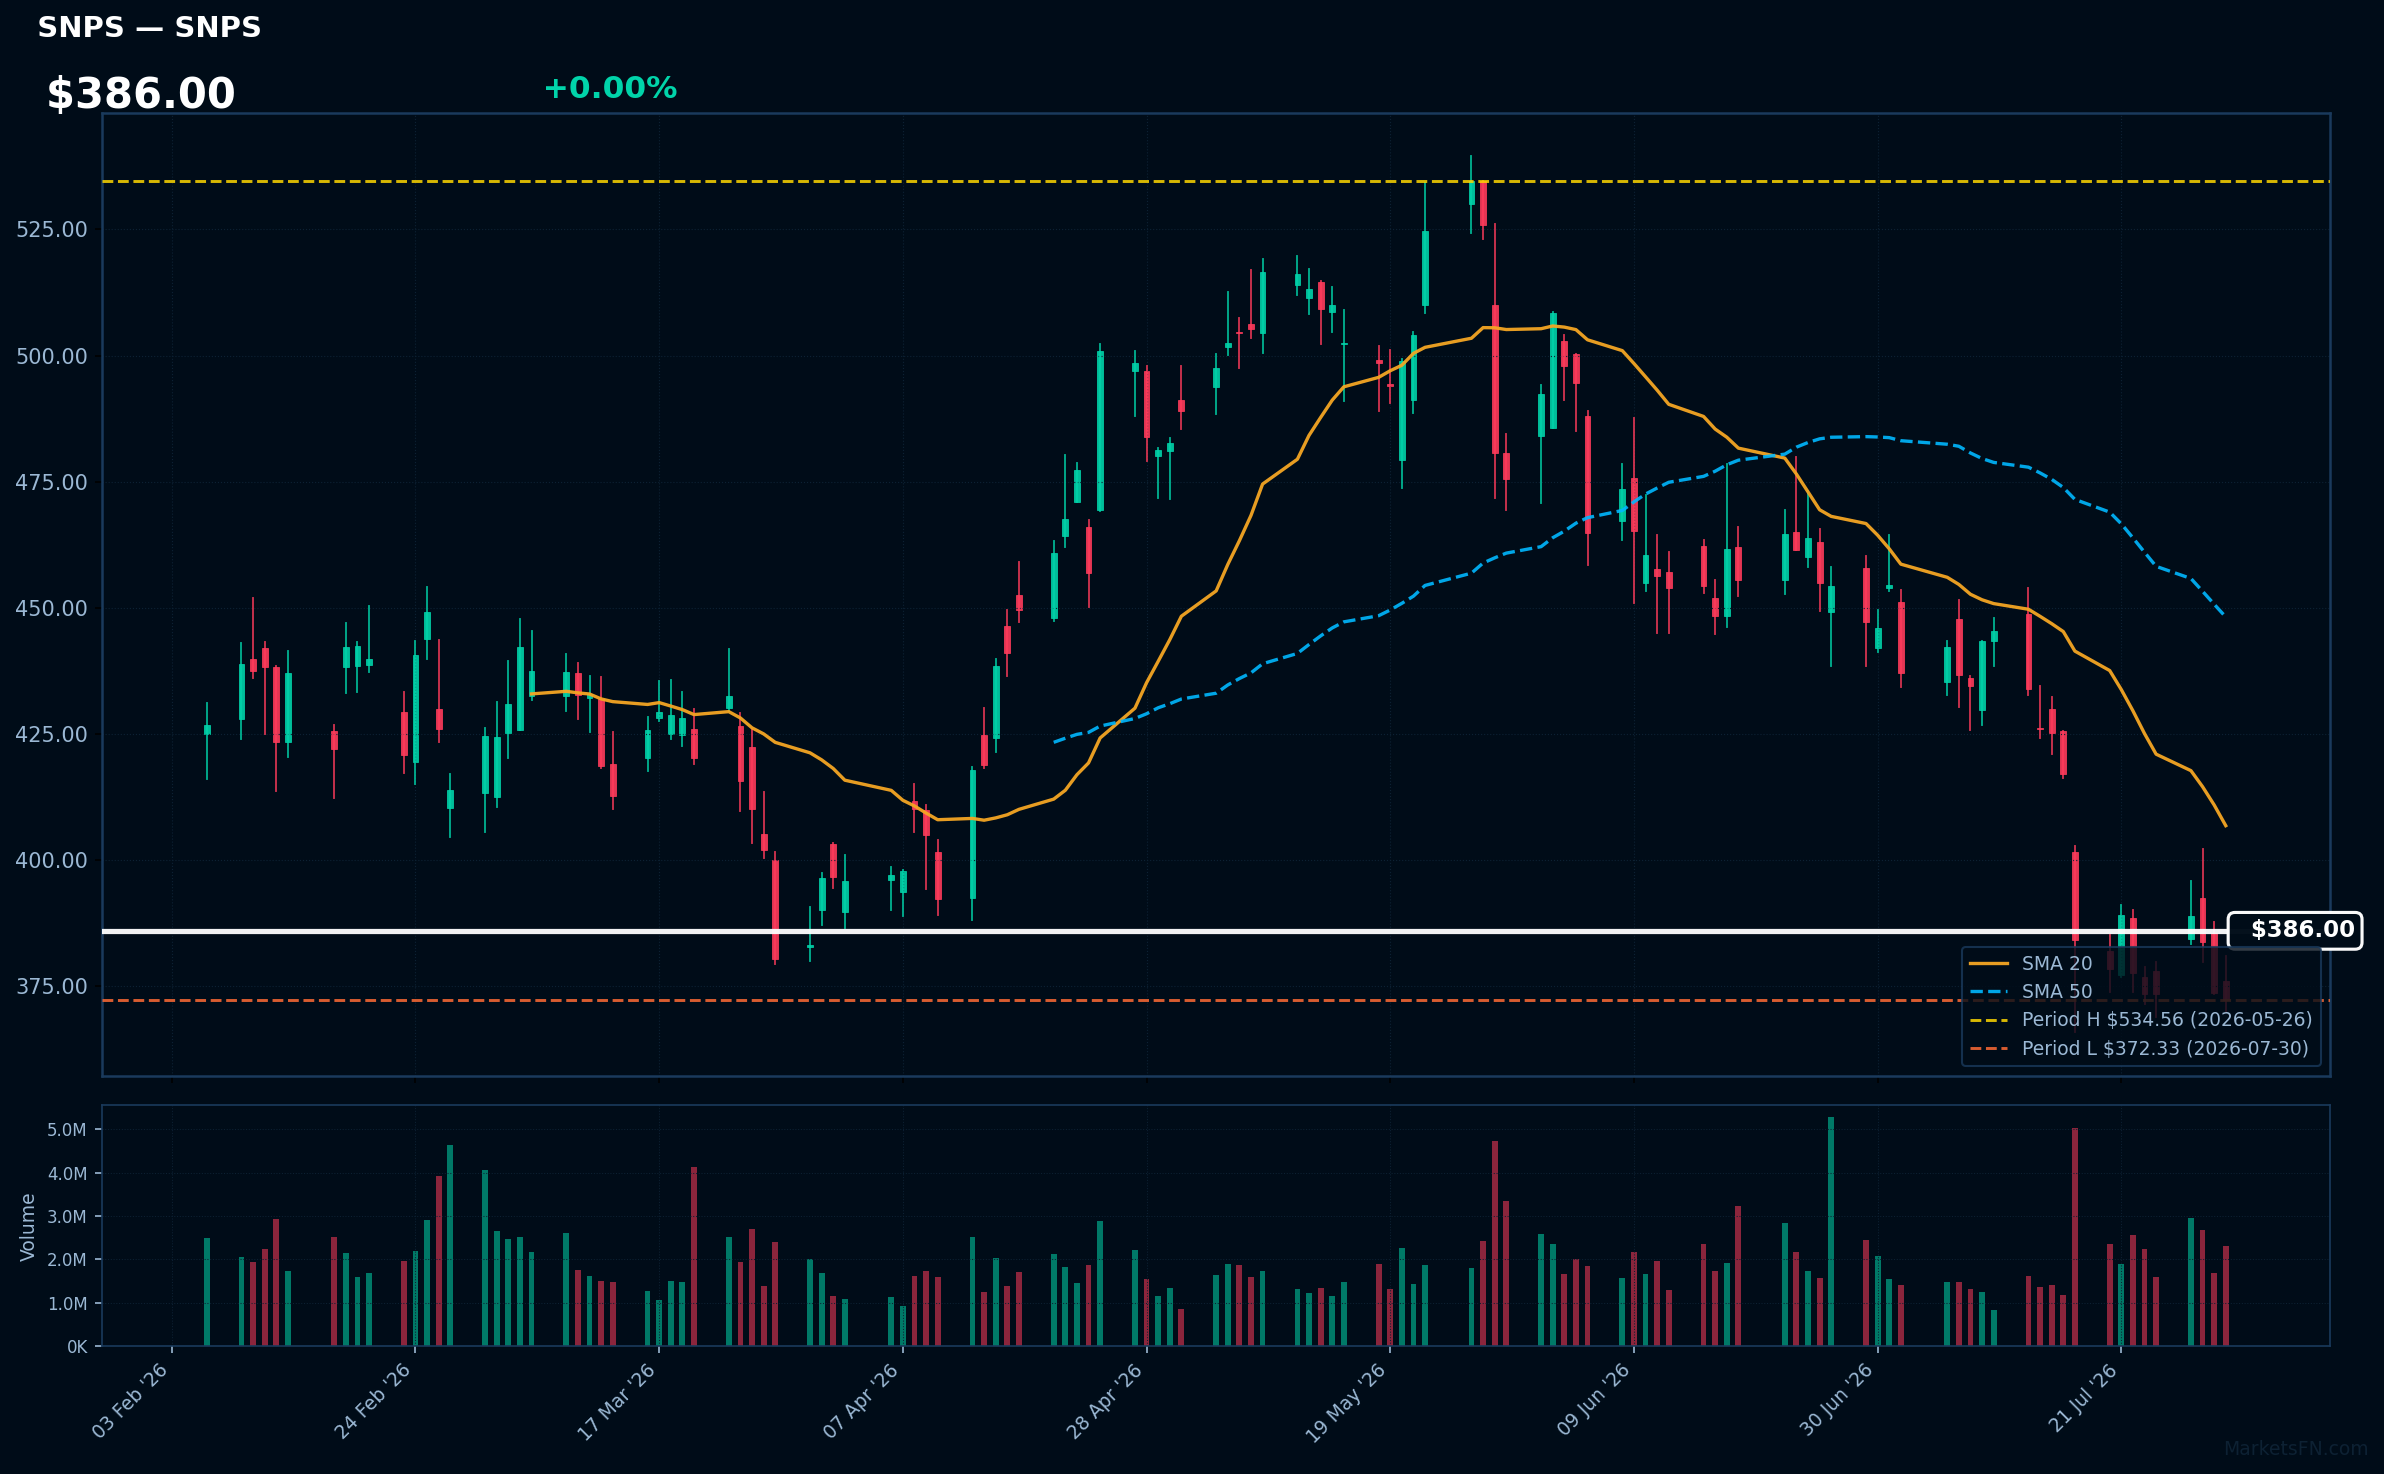
SNPS | Synopsys, Inc | Technology | Price Last: $372.33 | % Realized: -22.50% | RSI: 38.7 | % above MA200: -17.2% | Trend: Below MA20, MA50, MA200
Synopsys, Inc. provides software and services for electronic design automation, enabling companies to create complex semiconductor designs efficiently. Investors should care due to its critical role in the tech supply chain, impacting sectors like AI, automotive, and consumer electronics.
The current technical situation indicates a bearish trend, with an RSI(14) of 38.7 and a MA alignment of price < MA20 < MA50 < MA200, suggesting a sustained downtrend and testing major support.
Related headlines
- Synopsys unveils autonomous chip design workflows with Microsoft and AMD collaboration
- Synopsys and Intel Foundry Fast-Track Customer Readiness from Silicon to Systems on Intel 14A
- Synopsys Advances Agentic AI Chip Design with AMD and Microsoft
- Synopsys Showcases Comprehensive Autonomous Engineering Workflows from Silicon to Systems, Developed with NVIDIA Technology
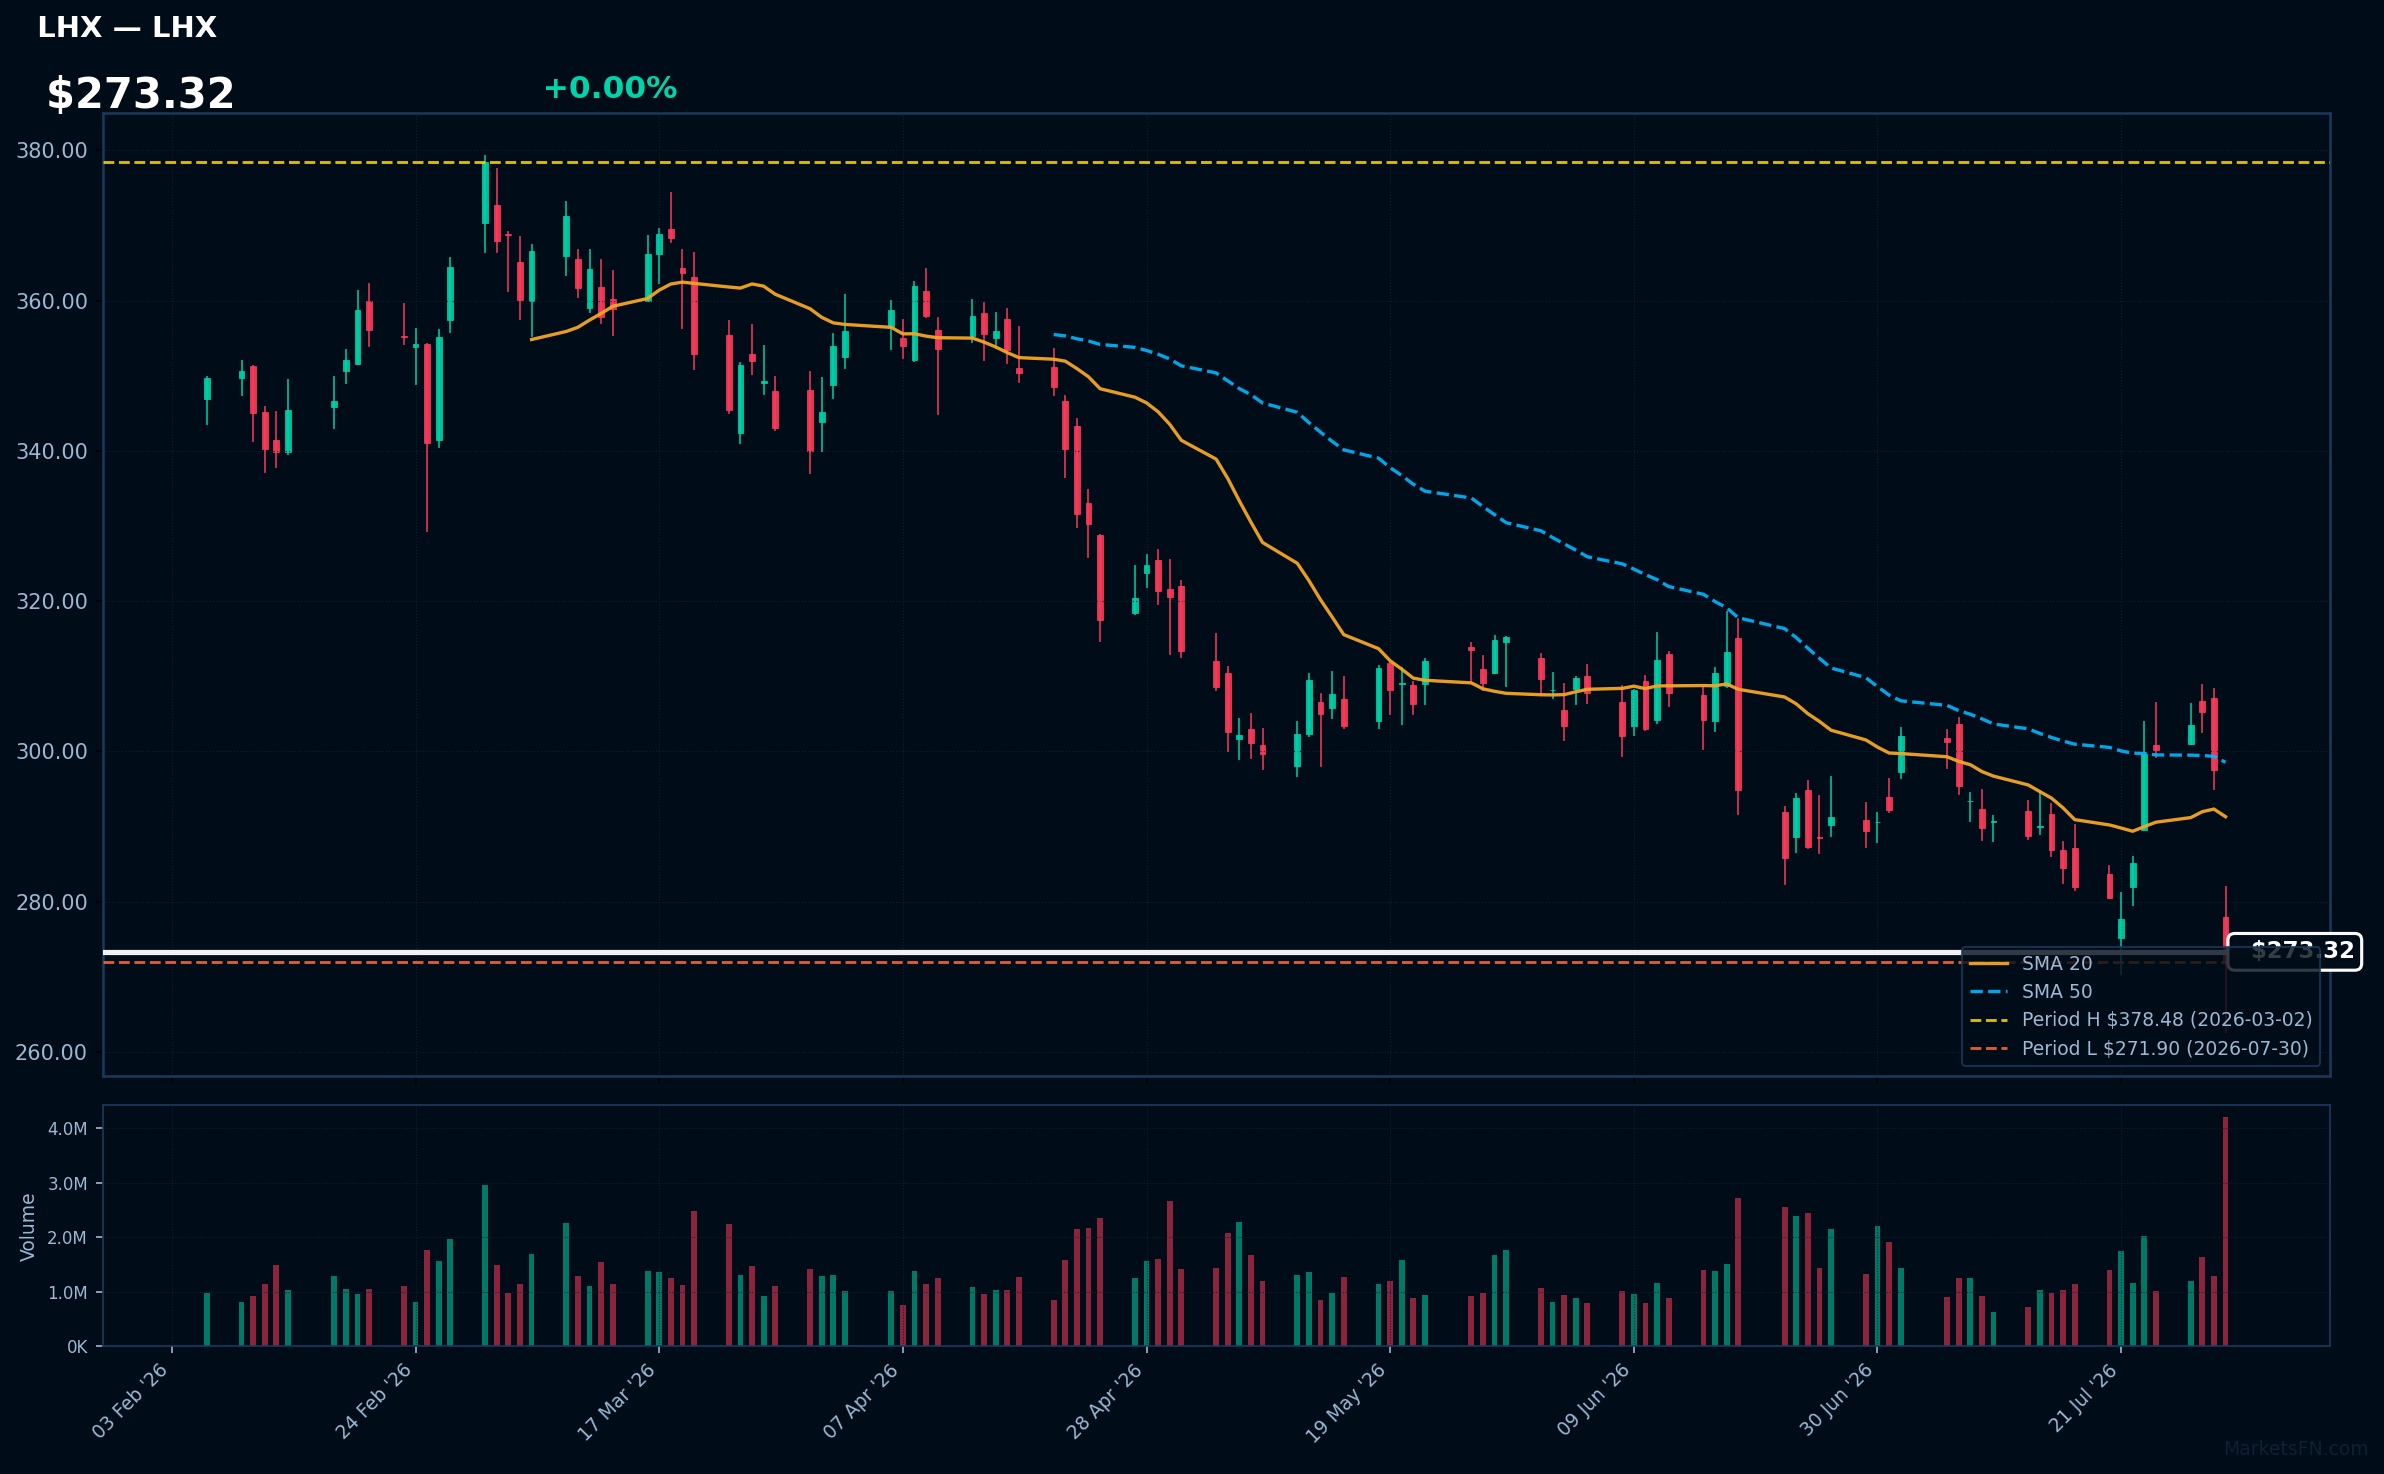
LHX | L3Harris Technologies Inc | Industrials | Price Last: $271.90 | % Realized: -10.70% | RSI: 36.9 | % above MA200: -14.0% | Trend: Below MA20, MA50, MA200
L3Harris Technologies Inc specializes in communication and electronic systems for defense, aerospace, and commercial markets. Investors should care due to its critical role in national security and technological advancements, positioning it for potential growth amid increasing defense budgets.
The current technical situation indicates a bearish trend, with an RSI(14) of 36.9 and a MA alignment of price < MA20 < MA50 < MA200, suggesting sustained downtrend and testing major support.
Related headlines
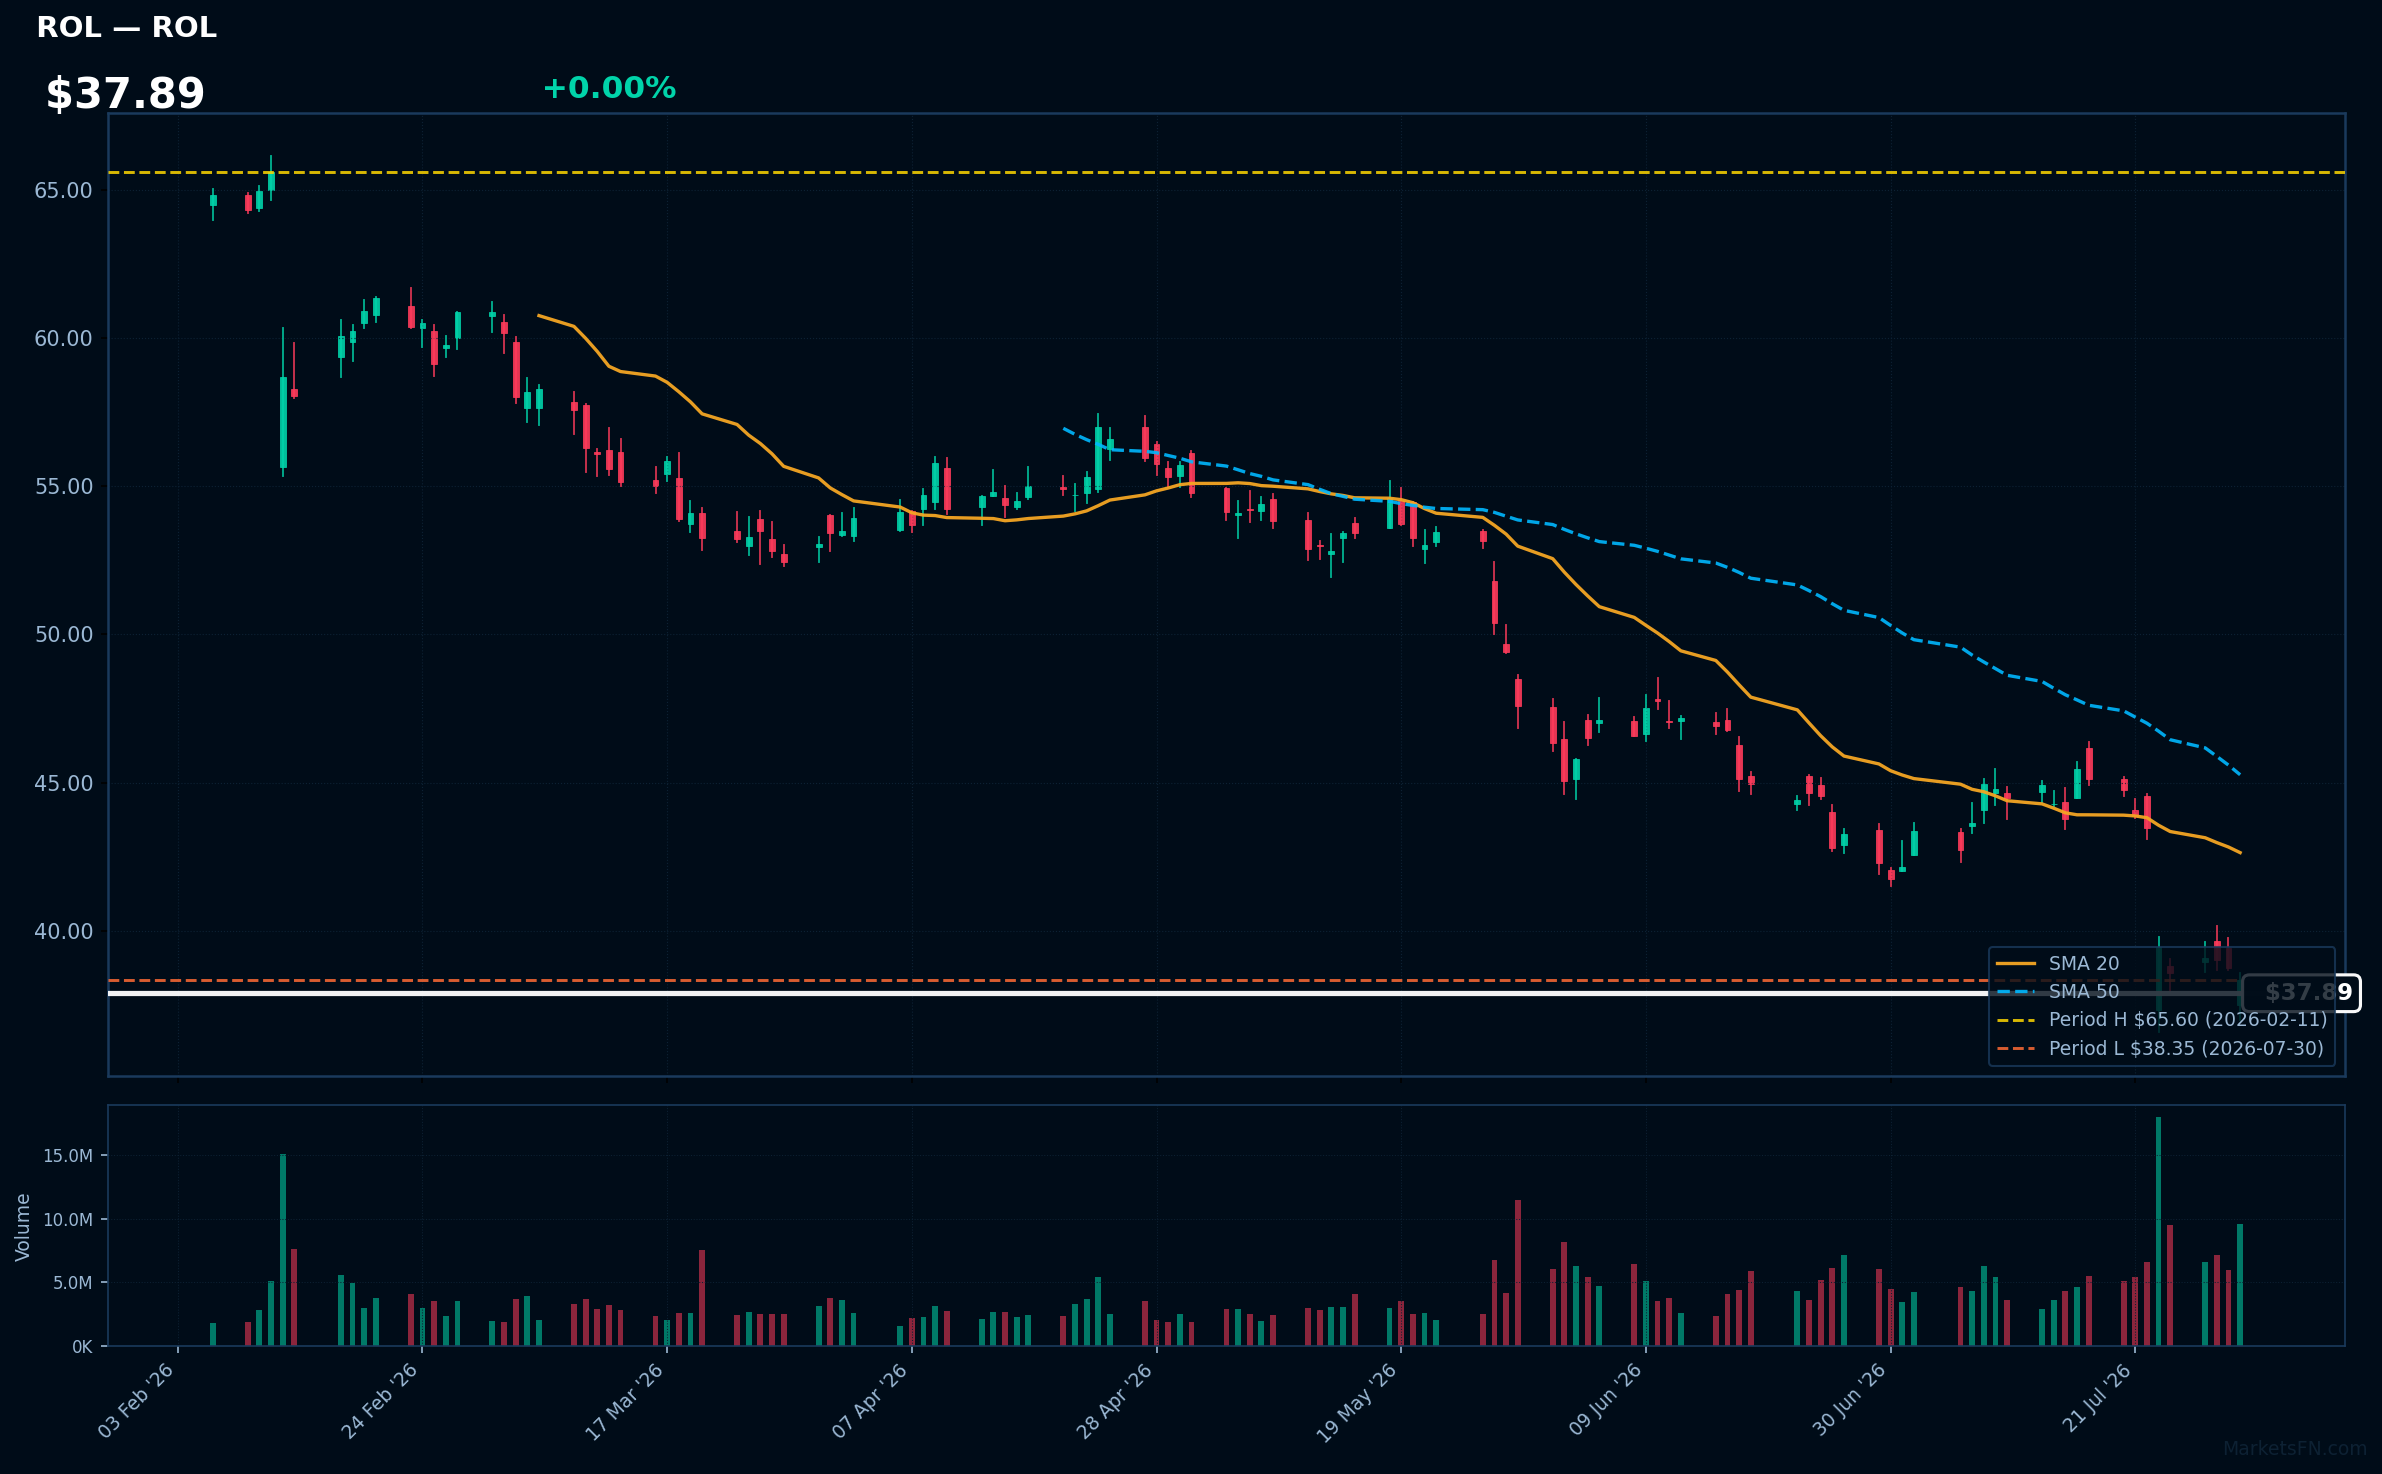
ROL | Rollins, Inc | Consumer Cyclical | Price Last: $38.35 | % Realized: -35.01% | RSI: 26.2 | % above MA200: -30.1% | Trend: Below MA20, MA50, MA200
Rollins, Inc. provides pest control services through its subsidiaries, focusing on residential and commercial markets. Investors should care due to its significant market presence and potential for growth in a sector that remains essential for health and safety.
The current technical situation indicates a warning sign, with an RSI(14) of 26.2 and a bearish MA alignment: price < MA20 < MA50 < MA200, reflecting a sustained downtrend and testing major support.
Related headlines
- JPMorgan cuts Rollins to Neutral on demand uncertainty, slashes price target
- Rollins Inc (ROL) Q2 2026 Earnings Call Highlights: Strong Growth in Termite and Ancillary ...
- Rollins Inc. stock underperforms Thursday when compared to competitors
- Rollins shares plunge premarket after Q2 miss triggers downgrades
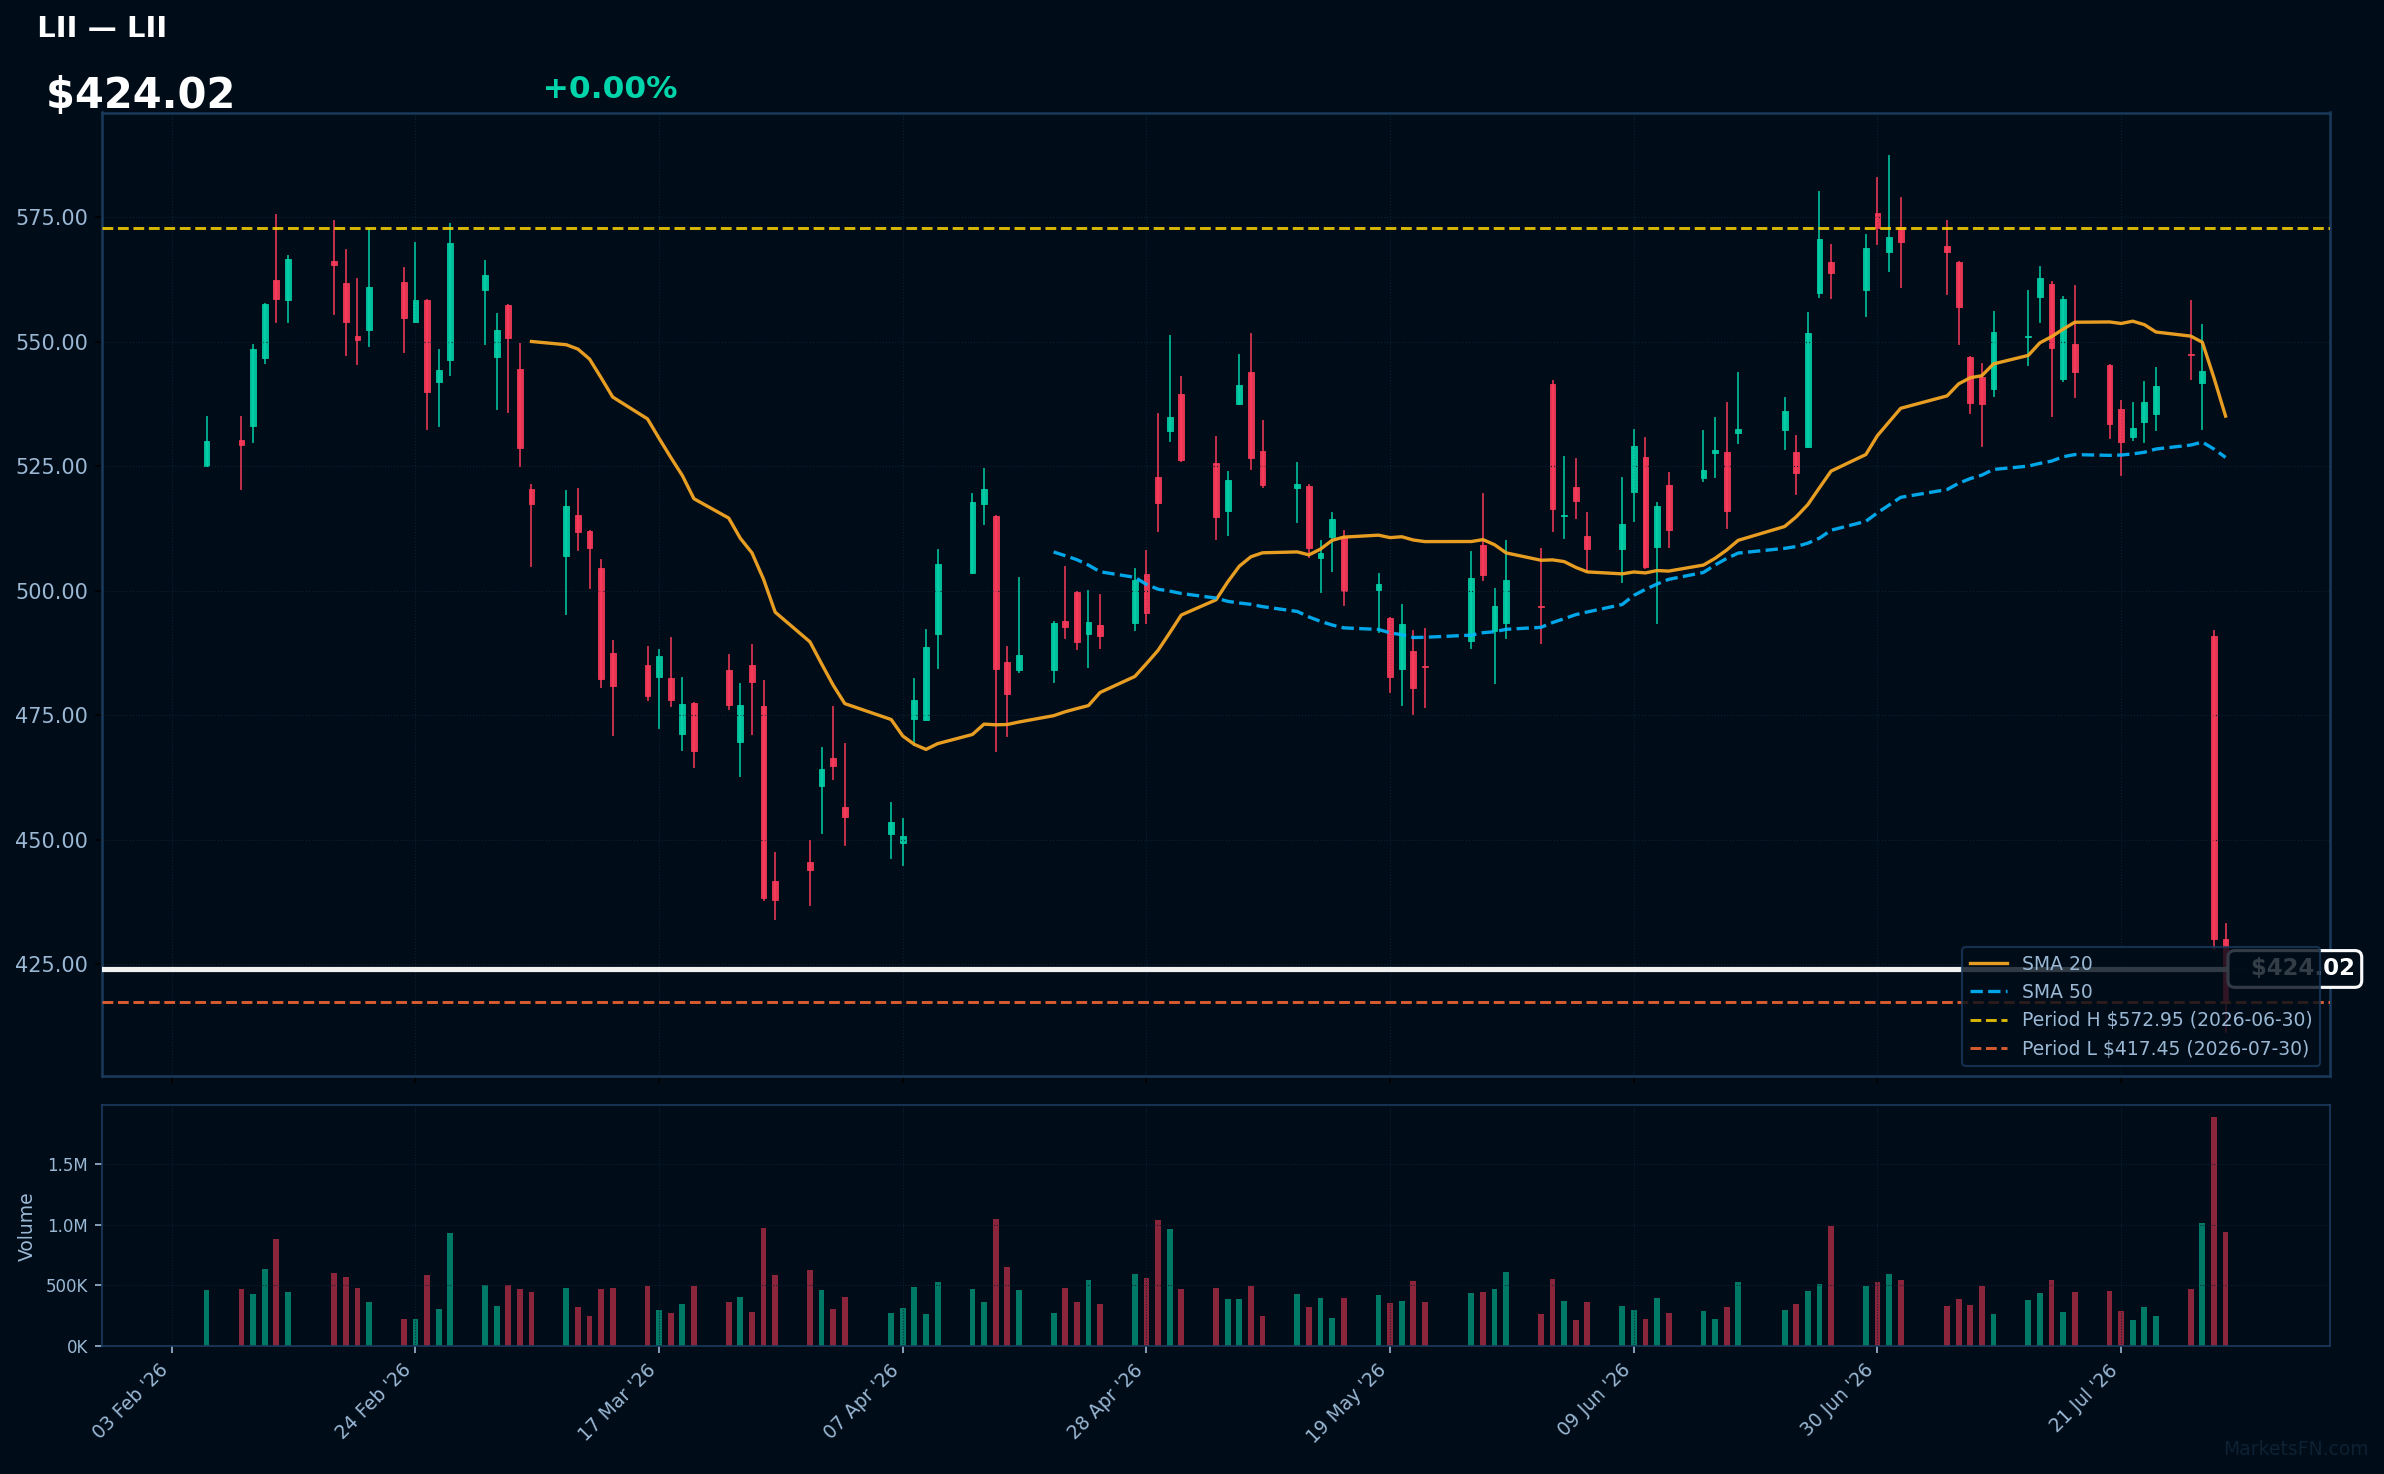
LII | Lennox International Inc | Industrials | Price Last: $417.45 | % Realized: -16.33% | RSI: 25.0 | % above MA200: -18.0% | Trend: Below MA20, MA50, MA200
Lennox International Inc designs and manufactures heating, ventilation, and air conditioning (HVAC) systems. Investors should care due to its significant role in the energy-efficient solutions market, which is increasingly vital as climate concerns grow and regulations tighten.
The current technical situation shows a bearish trend, with an RSI(14) of 25.0 indicating oversold conditions. The stock is below MA20, MA50, and MA200, signaling mixed signals and testing major support just 0.0% above its 2026 YTD low.
Related headlines
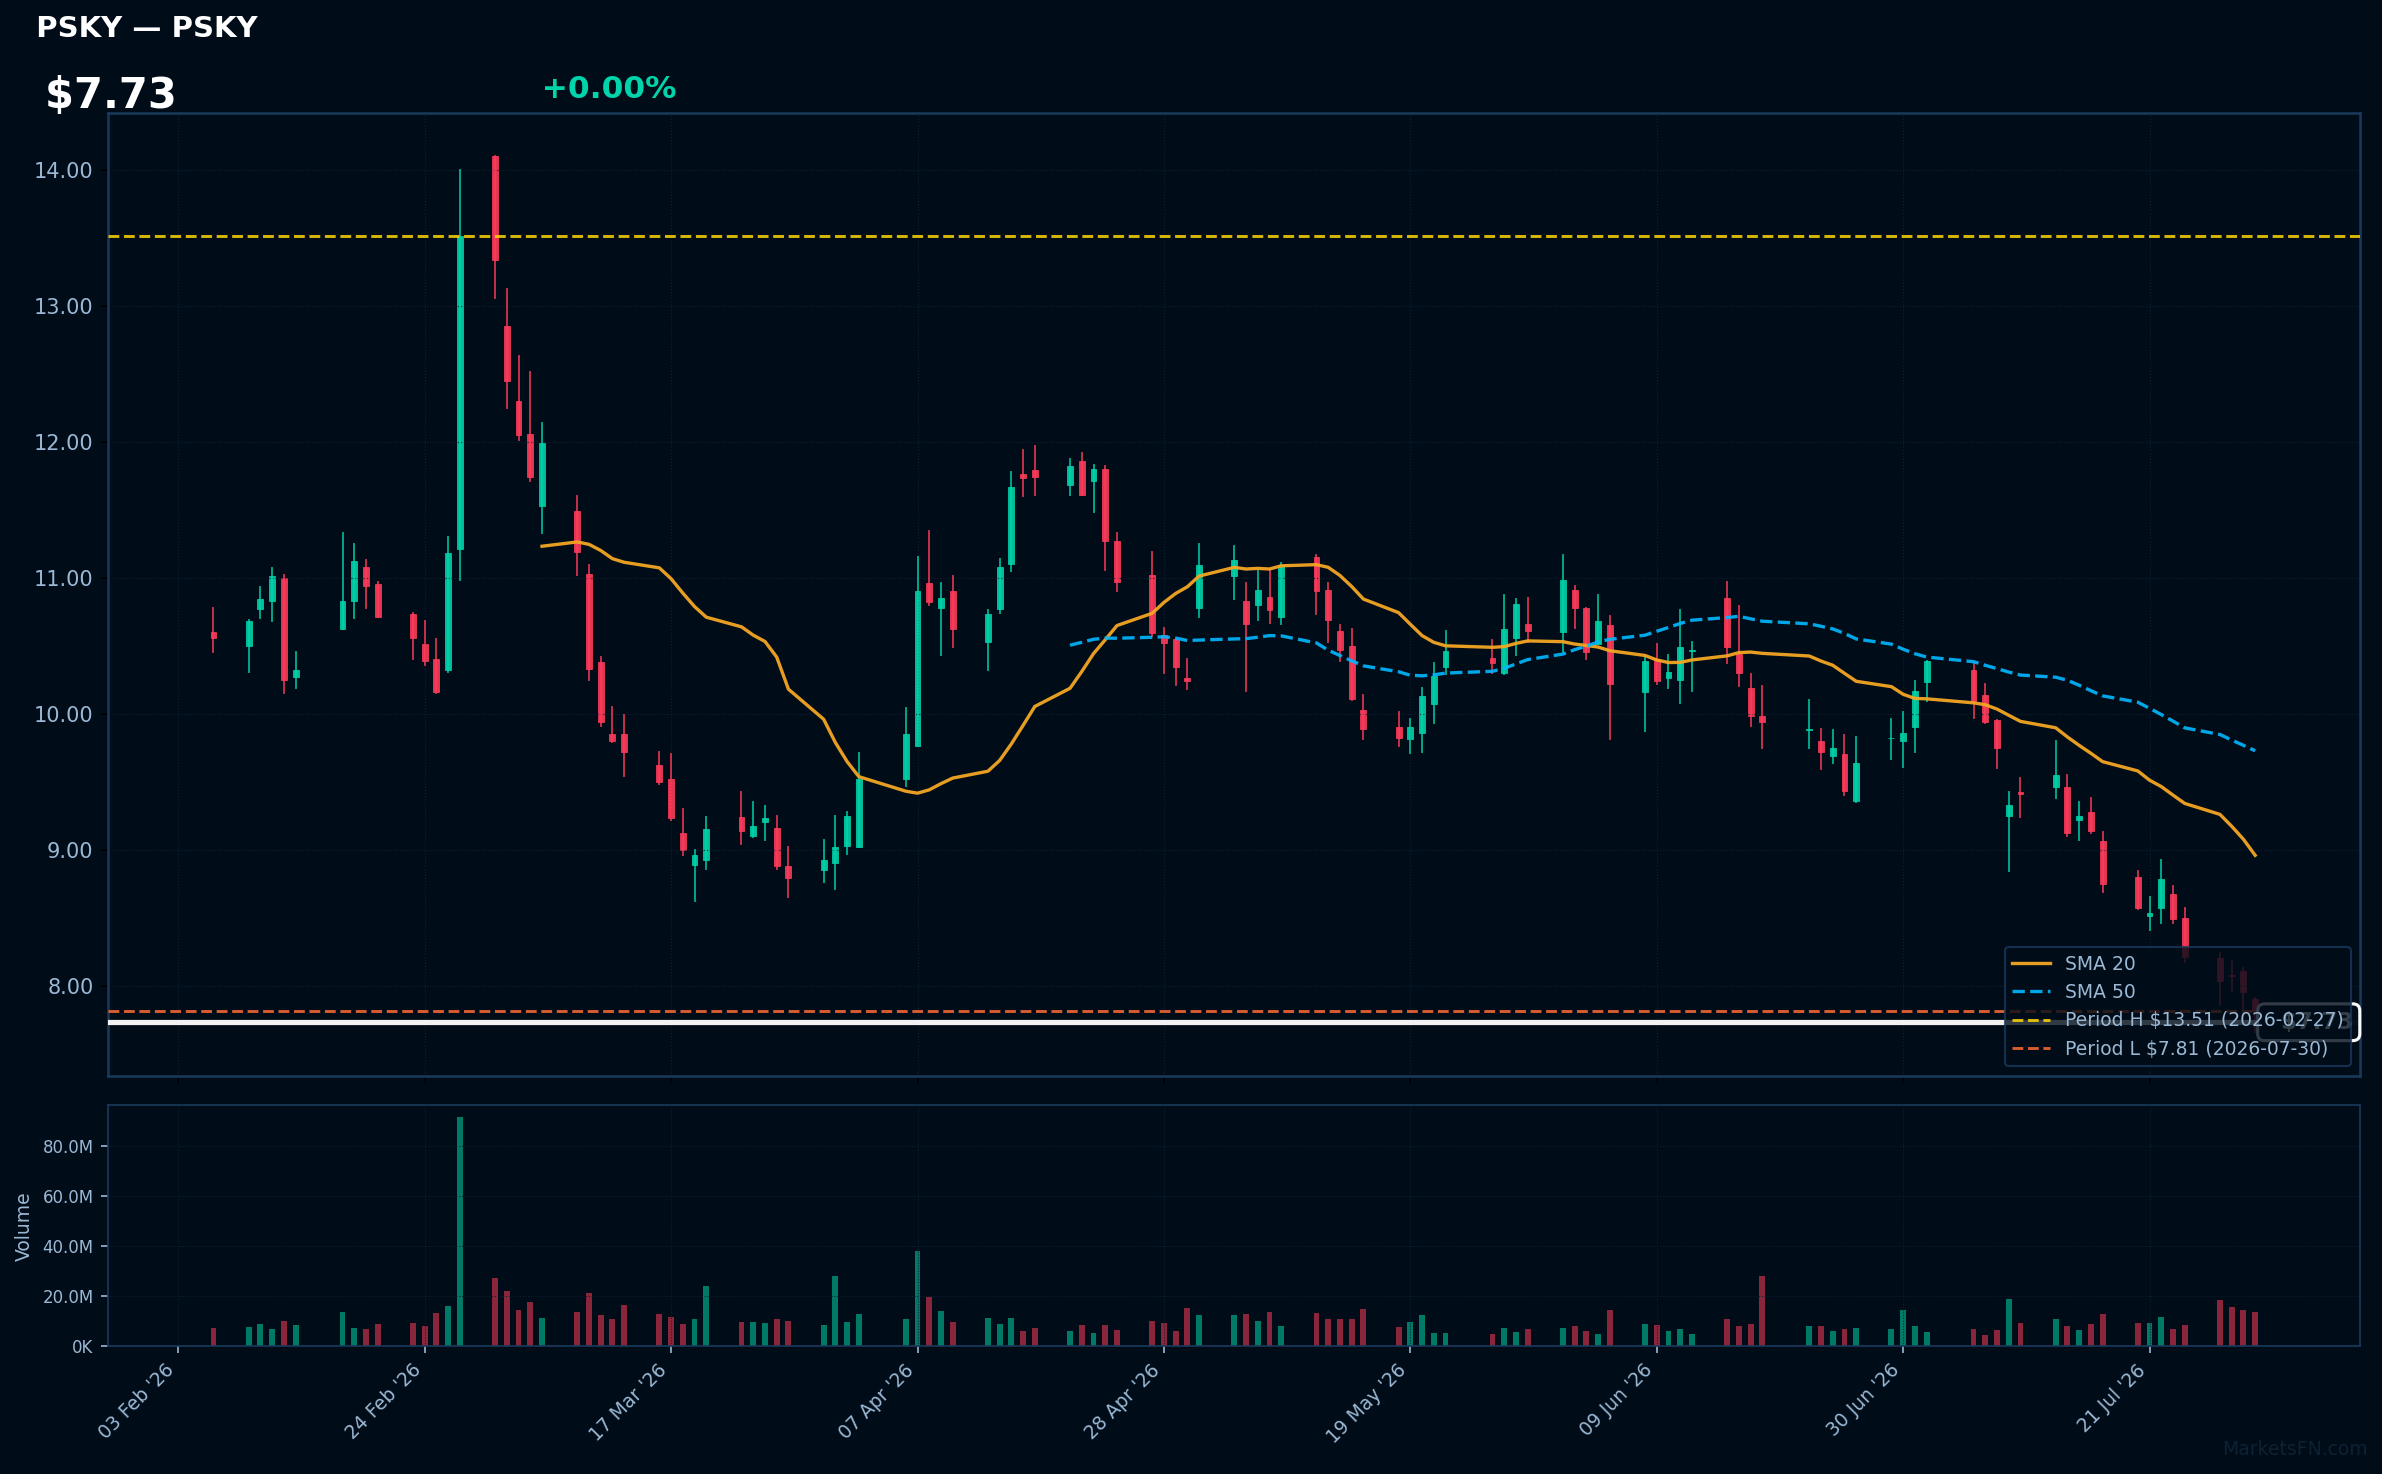
PSKY | Paramount Skydance Corp | Communication Services | Price Last: $7.81 | % Realized: -40.74% | RSI: 25.0 | % above MA200: -33.6% | Trend: Below MA20, MA50, MA200
Paramount Skydance Corp (PSKY) is involved in film and television production, focusing on high-profile projects that attract significant audience interest. Investors should care due to its potential for box office success and content monetization in a competitive media landscape.
The current technical situation is concerning, with an RSI(14) of 25.0 indicating oversold conditions. The bearish MA alignment shows price < MA20 < MA50 < MA200, reflecting a sustained downtrend and testing major support just 0.0% above its 2026 YTD low.
Related headlines
Market Commentary
The presence of S&P 500 stocks near their 2026 extremes indicates a significant divergence in market performance, with certain companies reaching their highs while others are close to their lows. Stocks like Bristol-Myers Squibb Co, Ross Stores, Garmin Ltd, Electronic Arts, and Labcorp Holdings are all at 0.0% from their highs, suggesting strong investor confidence and robust fundamentals in these sectors. Conversely, companies such as Synopsys, L3Harris Technologies, Rollins, Lennox International, and Paramount Skydance are only slightly above their lows, indicating potential challenges or market skepticism regarding their growth prospects.
This divergence can be attributed to varying sector themes and market conditions. The high-performing stocks may be benefiting from trends such as increased consumer demand, innovation in technology, or strong healthcare performance, while those near their lows might be facing headwinds like regulatory pressures, supply chain issues, or shifts in consumer preferences. The overall market sentiment appears mixed, reflecting both optimism in certain sectors and caution in others.
Investors should closely monitor upcoming earnings reports and economic indicators that could impact these stocks. Key metrics such as consumer spending, inflation rates, and sector-specific developments will be crucial in determining whether the high-flying stocks can maintain their momentum or if the lagging stocks will rebound. Additionally, any shifts in monetary policy could also influence market dynamics significantly.
Methodology: All 503 S&P 500 constituents screened. Close prices downloaded from 2026-01-01. Period high = highest close since Jan 1 2026; period low = lowest close since Jan 1 2026. Distance = (current price / period extreme − 1) × 100. Technical indicators computed on up to 1 year of daily OHLCV data.
Disclaimer: For informational purposes only. Not investment advice. Past performance is not indicative of future results.

