S&P 500 2026 YTD Highs & Lows Radar: JPMorgan Chase & (JPM), International Business Machines (IBM) and more
MarketsFN Team

S&P 500 2026 YTD Highs & Lows Radar: JPMorgan Chase & (JPM), International Business Machines (IBM) and more
Screening all 503 S&P 500 constituents for stocks nearest to their 2026 year-to-date high and their 2026 YTD low. Data as of July 23, 2026. % Realized = total return since Jan 1 2026.
Legend: RSI > 70 = overbought · RSI < 30 = oversold · Green % Realized = positive YTD return · Red = negative.
📈 Nearest to 2026 High
Sectors represented: Financial (4), Consumer Defensive (1)
| Ticker | Company | Sector | Price Last | % Realized | 2026 YTD High Date | RSI | % above MA200 | Trend |
|---|---|---|---|---|---|---|---|---|
| JPM | JPMorgan Chase & Co | Financial | $348.21 | +6.98% | 2026-07-22 | 65.4 | +12.2% | Above MA20, MA50, MA200 |
| BAC | Bank Of America Corp | Financial | $61.62 | +10.13% | 2026-07-22 | 66.2 | +15.8% | Above MA20, MA50, MA200 |
| PM | Philip Morris International Inc | Consumer Defensive | $194.30 | +21.21% | 2026-07-22 | 60.1 | +15.1% | Above MA20, MA50, MA200 |
| USB | U.S. Bancorp | Financial | $64.47 | +19.54% | 2026-07-22 | 62.5 | +19.0% | Above MA20, MA50, MA200 |
| TRV | Travelers Companies Inc | Financial | $372.08 | +30.47% | 2026-07-22 | 76.5 | +25.3% | Above MA20, MA50, MA200 |
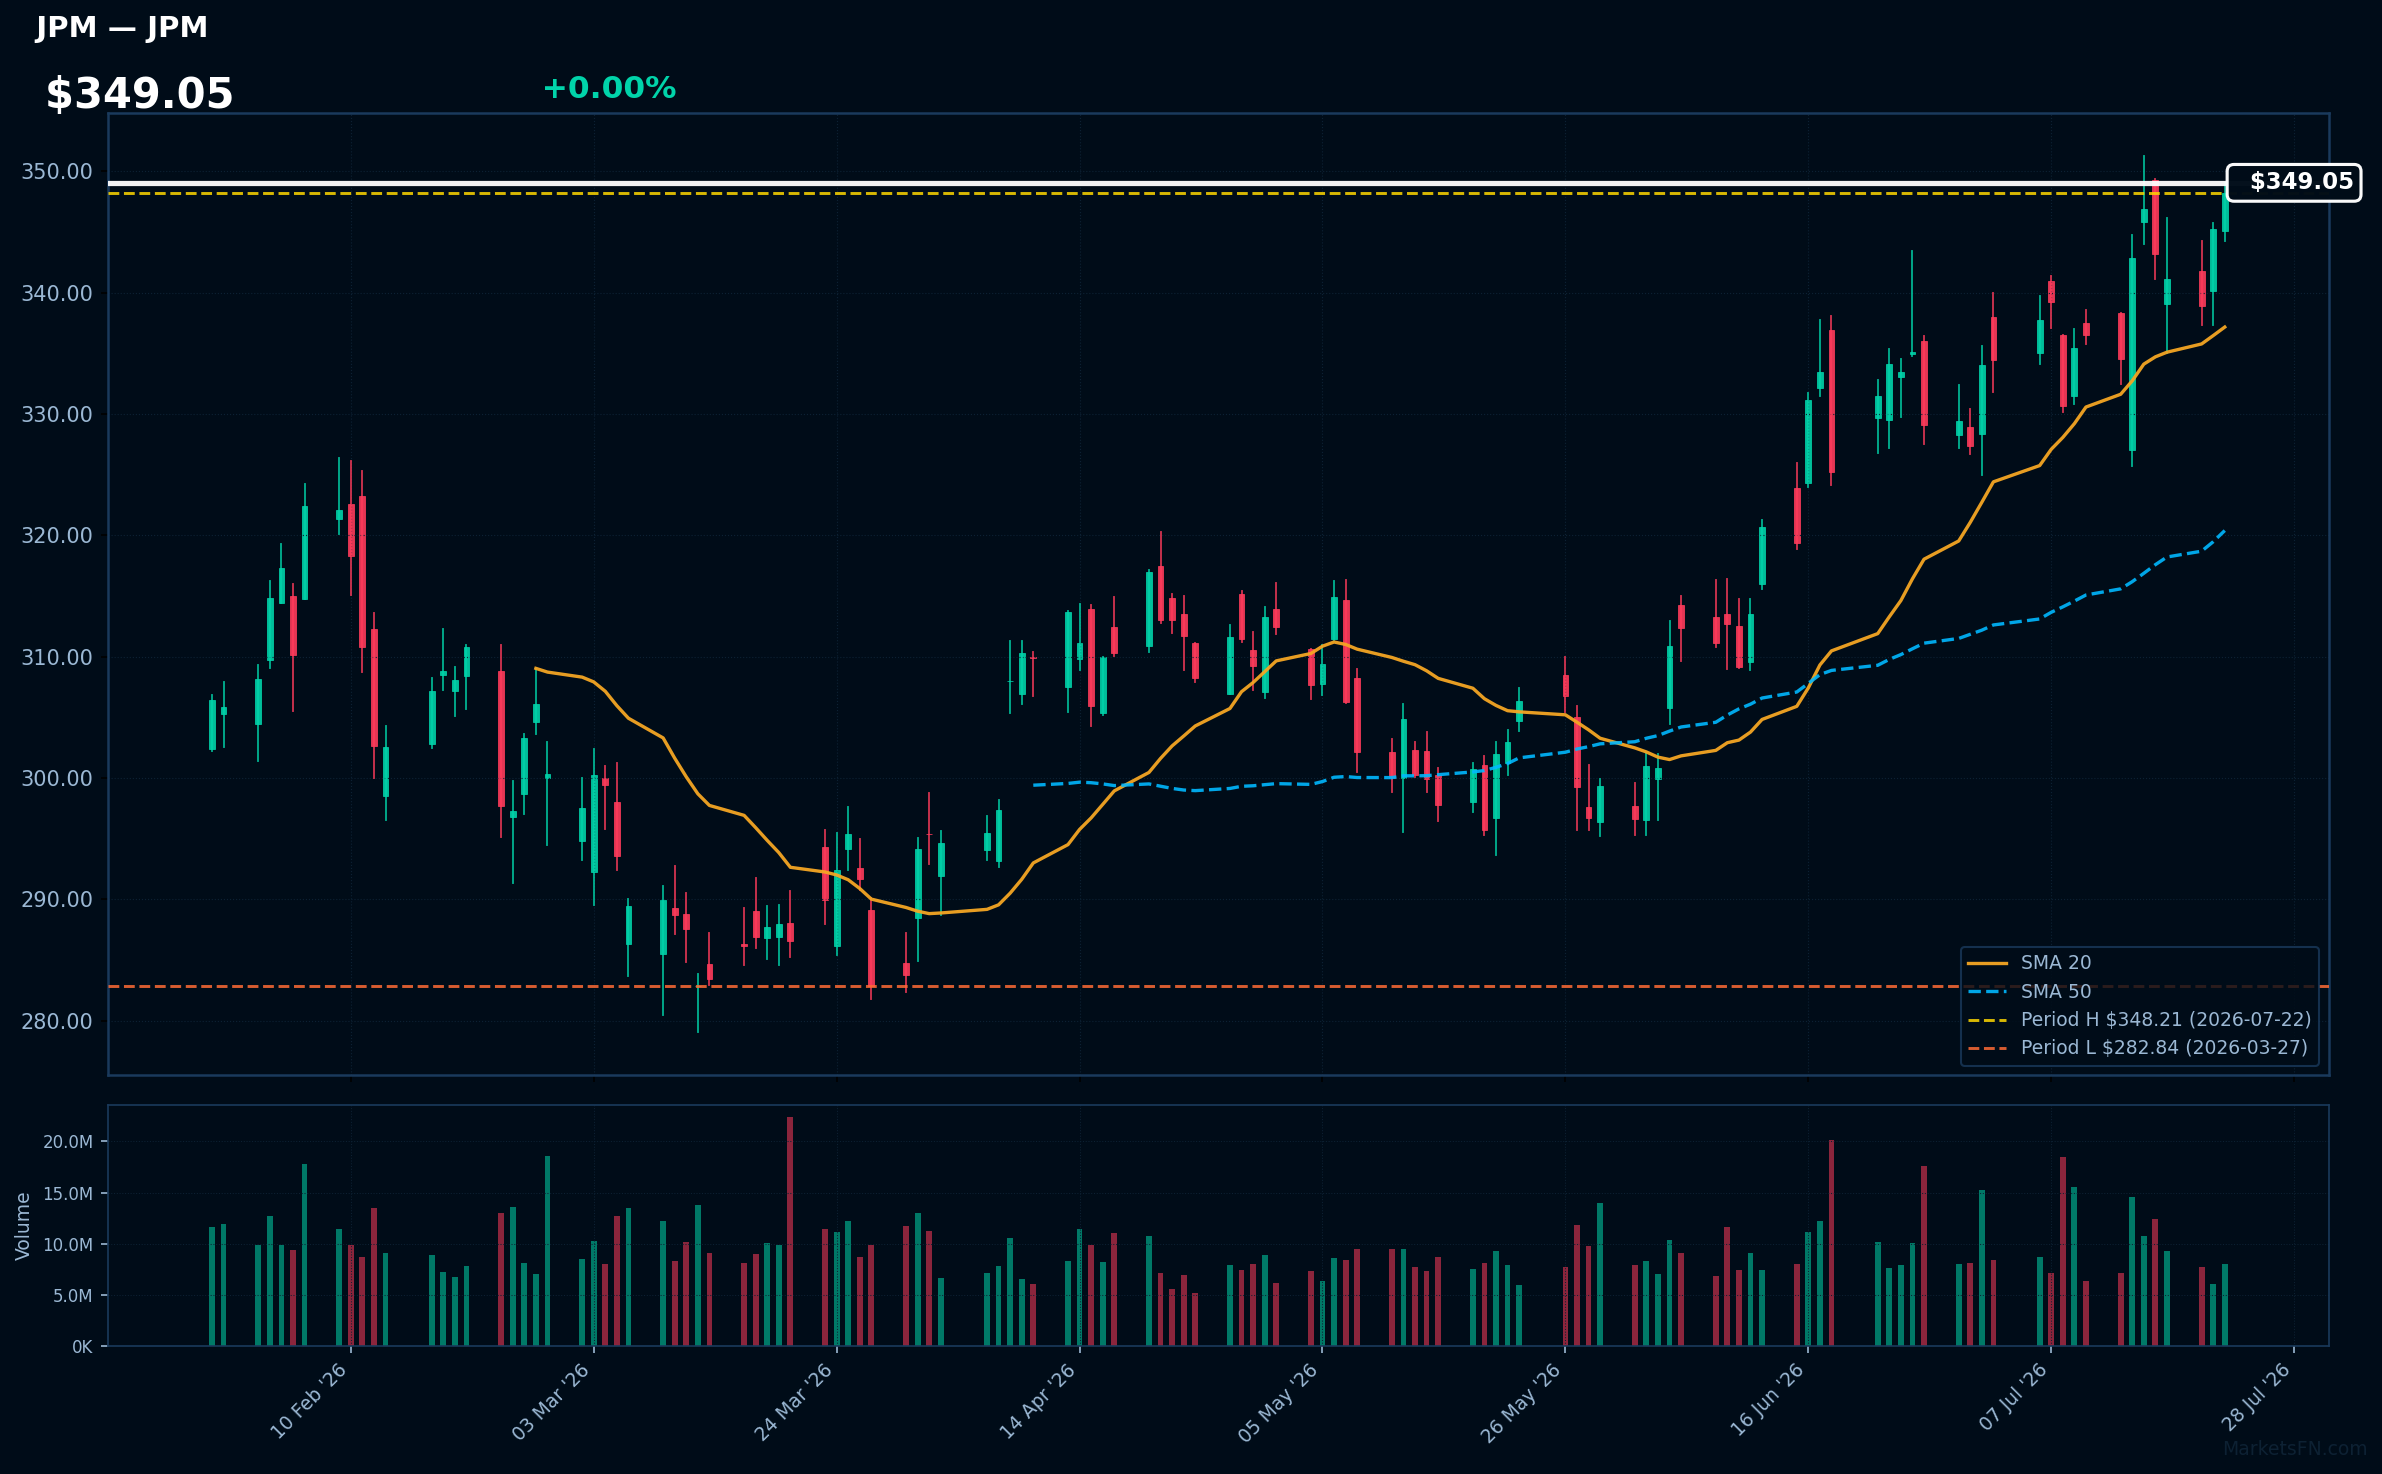
JPM | JPMorgan Chase & Co | Financial | Price Last: $348.21 | % Realized: +6.98% | RSI: 65.4 | % above MA200: +12.2% | Trend: Above MA20, MA50, MA200
JPMorgan Chase & Co is a global financial services firm providing consumer and investment banking, financial transactions processing, asset management, and more. Investors care due to its systemic importance and exposure to global economic trends.
JPMorgan Chase & Co is in a sustained uptrend with price at $349.05, RSI(14) at 65.4, and MA alignment: price > MA20 > MA50 > MA200. It's near its 2026 YTD high, 0.0% below, indicating potential breakout momentum.
Related headlines
- JPMorgan Sees AI-Powered Growth For Banks; Stock Pops Into Buy Zone After Earnings Growth
- Battery Mineral Resources' ESI Subsidiary Secures Strategic Financing with JPMorgan Chase
- JPMorgan CEO Jamie Dimon Says This One Trait Is a Bad Leaders Biggest Downfall
- JPMorgan, Goldman Set for $100 Million Paydays on SoftBanks Record Loan
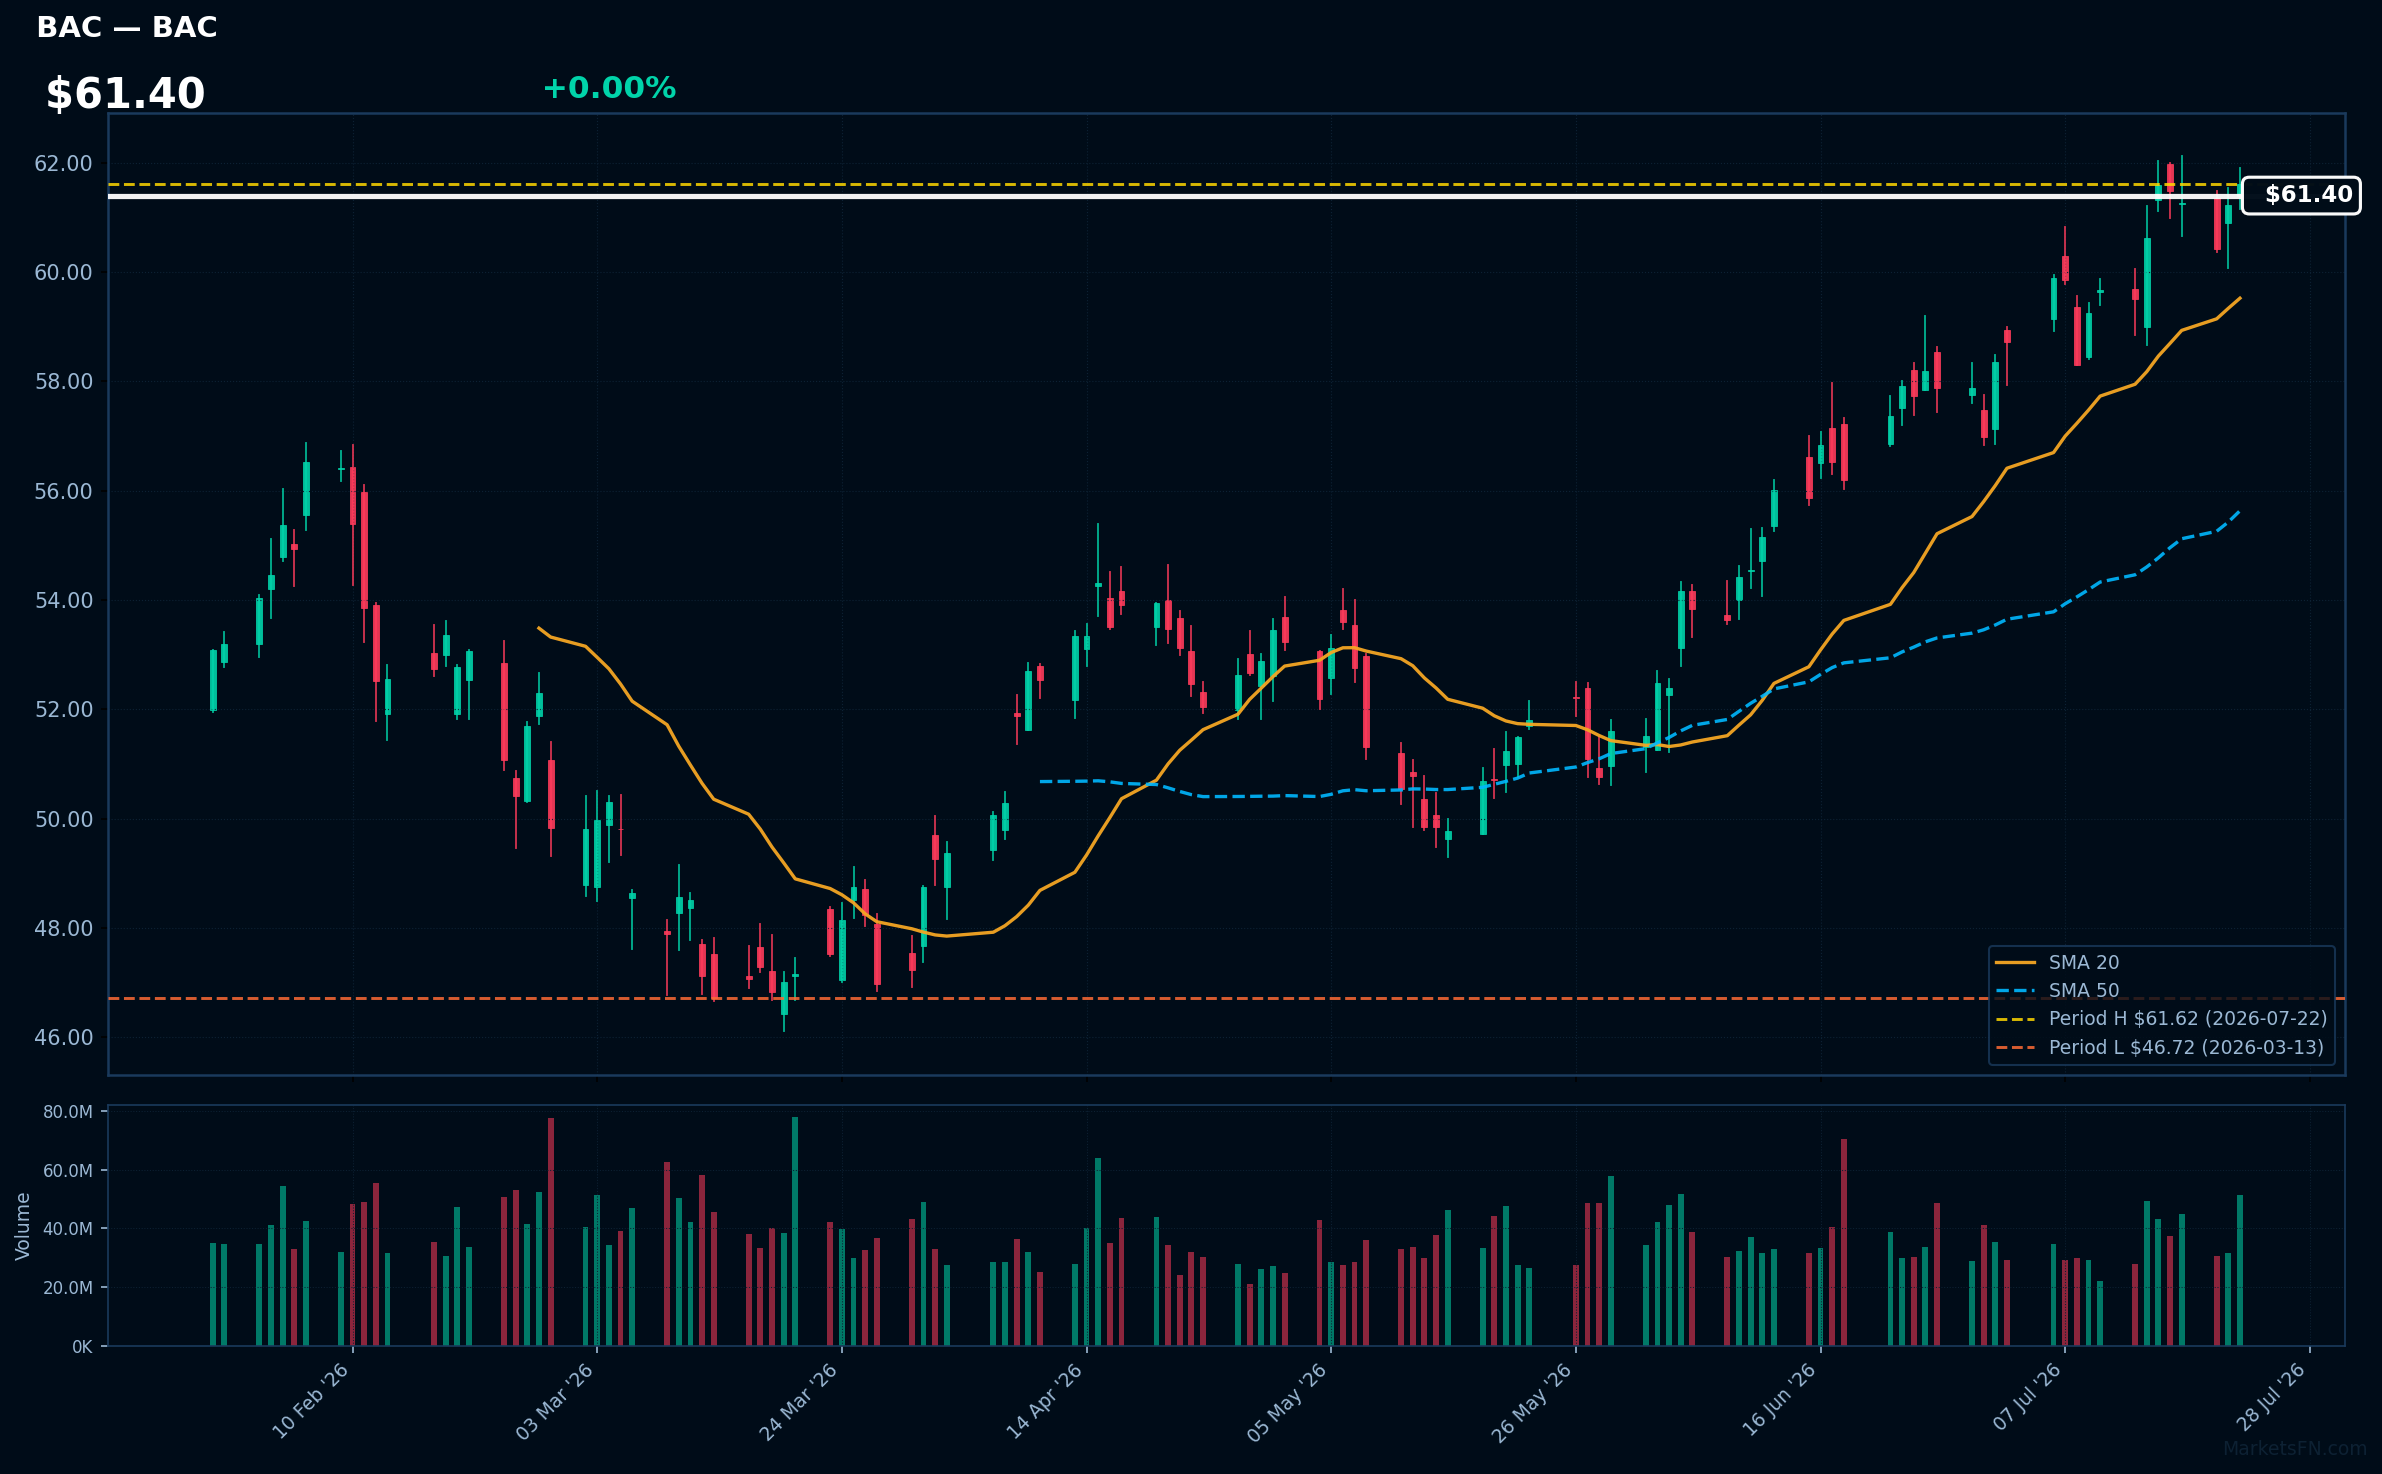
BAC | Bank Of America Corp | Financial | Price Last: $61.62 | % Realized: +10.13% | RSI: 66.2 | % above MA200: +15.8% | Trend: Above MA20, MA50, MA200
Bank Of America Corp is a multinational banking and financial services corporation. Investors should care about its performance as it is one of the largest banks in the US, influencing the financial sector and overall economy.
The stock shows bullish MA alignment with price > MA20 > MA50 > MA200 and RSI(14) at 66.2, indicating sustained uptrend and momentum. It's near its 2026 YTD high, 0.0% below, suggesting a potential breakout.
Related headlines
- Bank of America and Carolina Panthers Extend Naming Rights for Bank of America Stadium, Reinforcing Long-Term Commitment to Charlotte and the Carolinas
- Micron Gets a Major Vote of Confidence From Bank of America
- Why Bank Stocks May Beat REITs for Dividends
- Wall Street Banks Trading Parts of $35 Billion AI Chip Deal
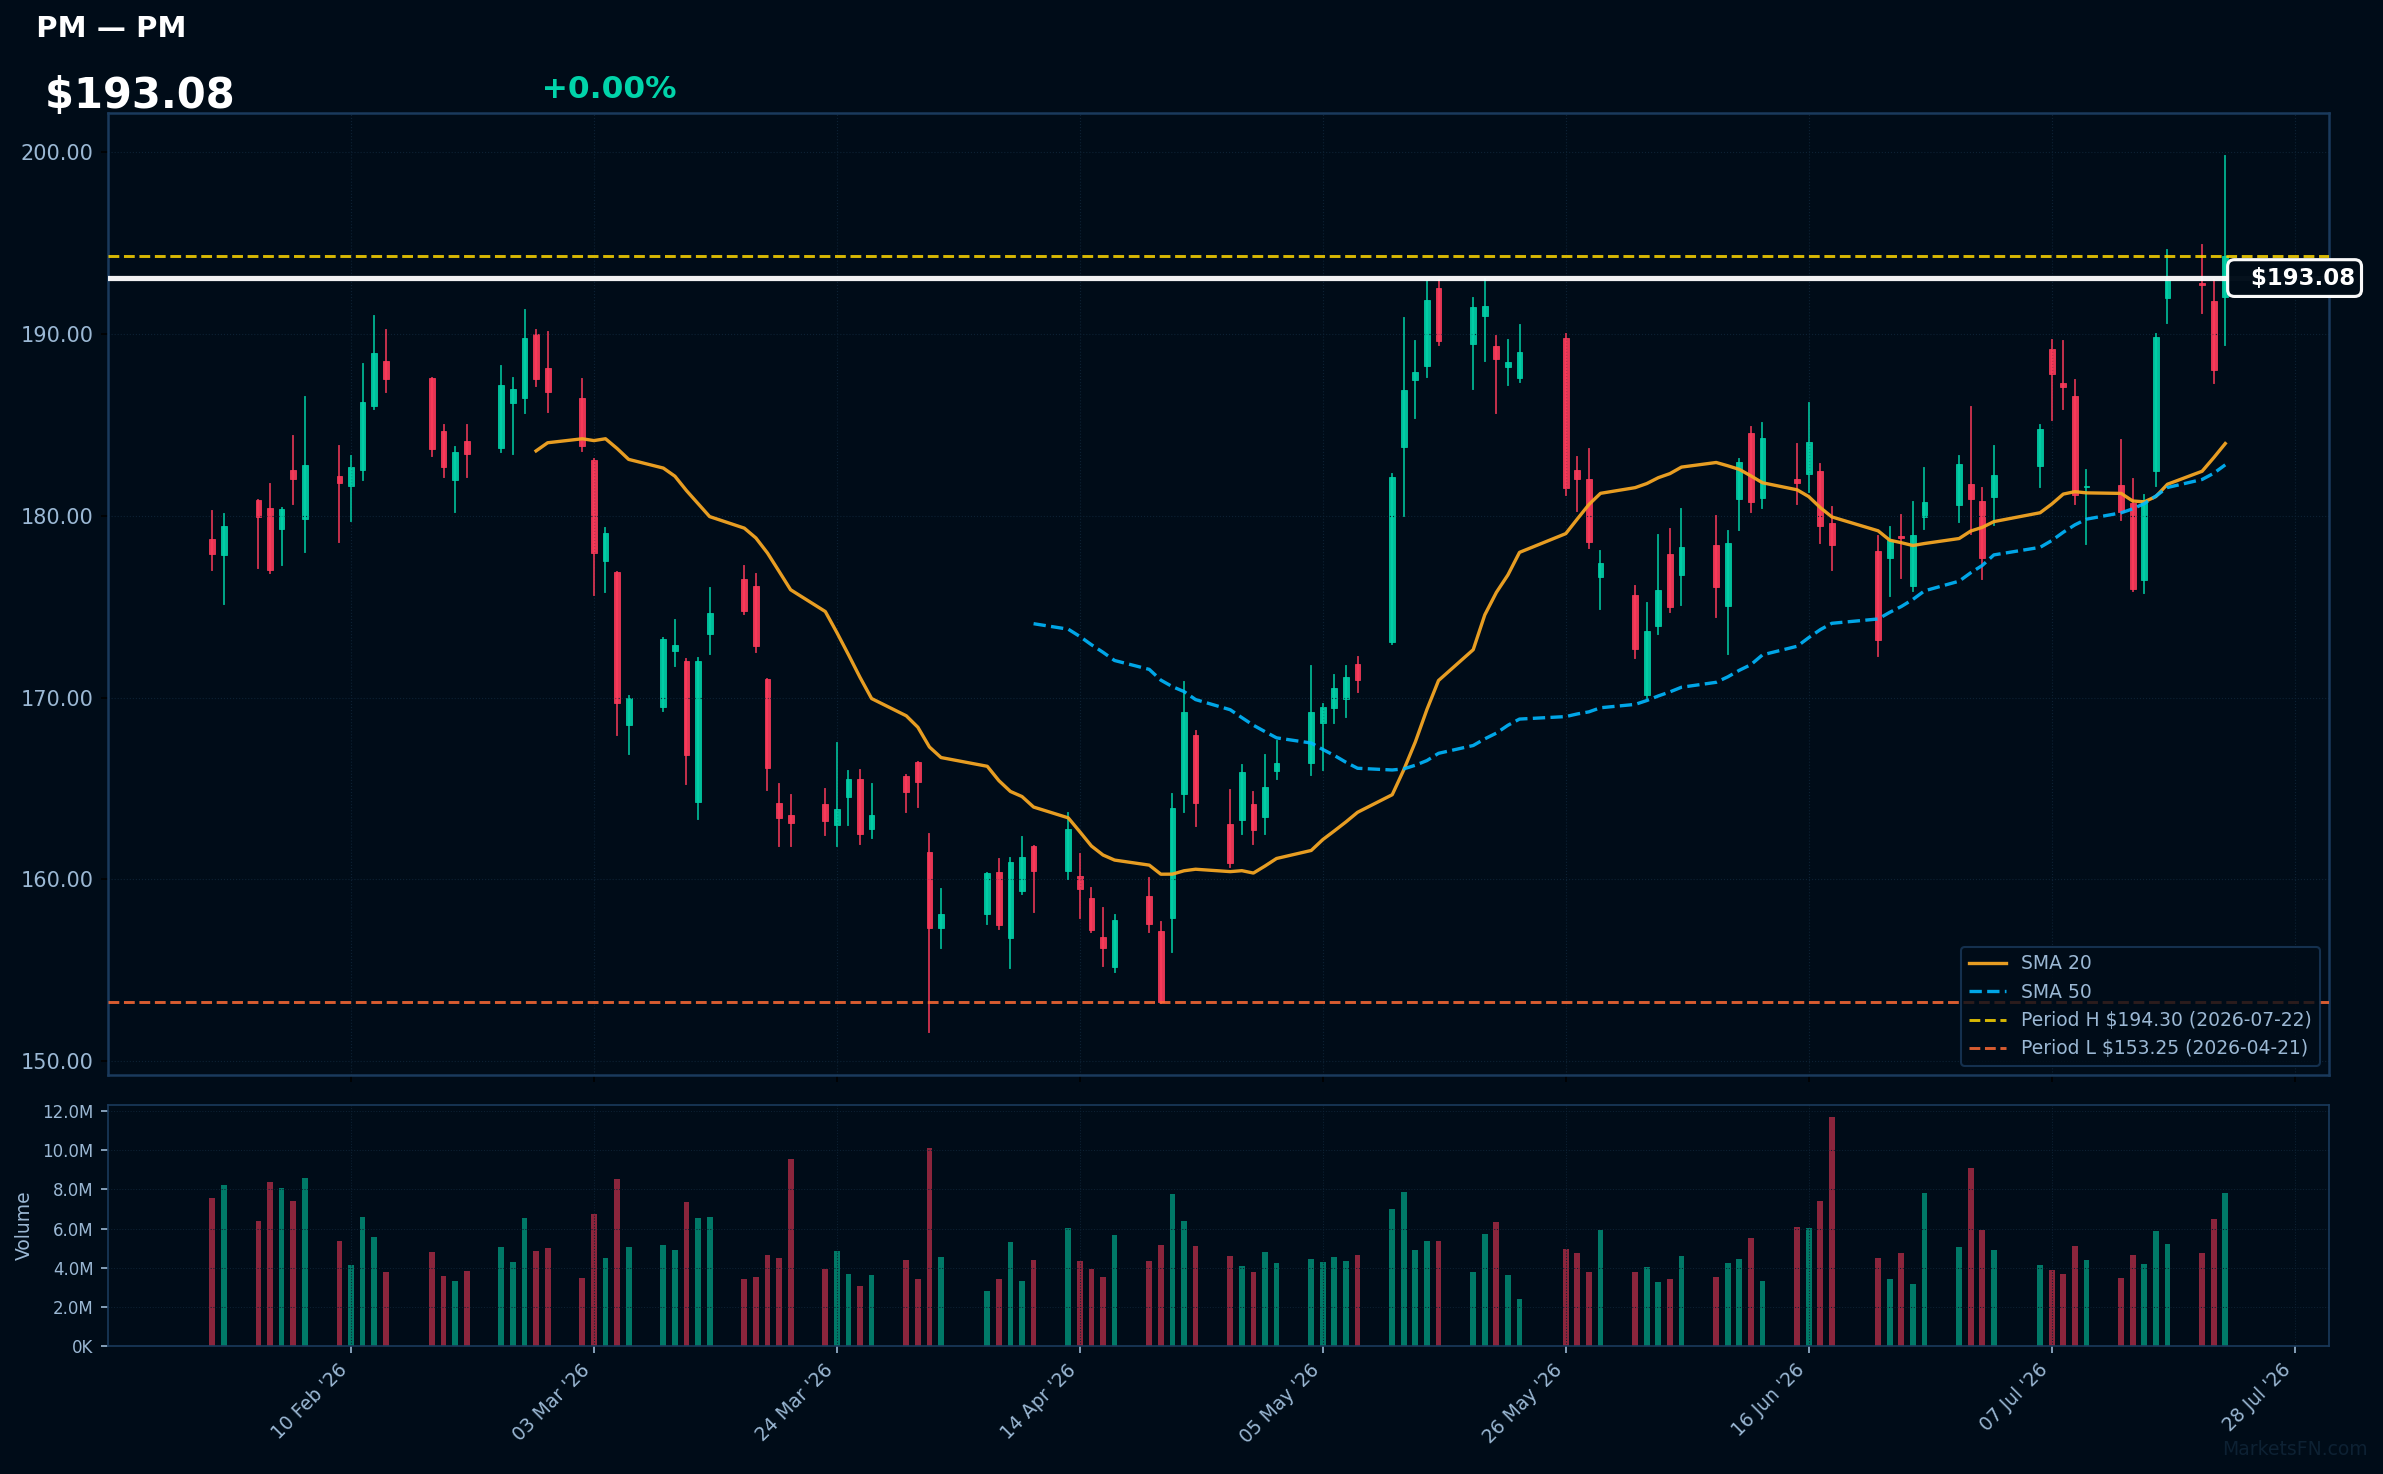
PM | Philip Morris International Inc | Consumer Defensive | Price Last: $194.30 | % Realized: +21.21% | RSI: 60.1 | % above MA200: +15.1% | Trend: Above MA20, MA50, MA200
Philip Morris International Inc is a tobacco company that generates revenue primarily from the sale of smoke-free products and traditional cigarettes outside the US. Investors should care about its transition to smoke-free products and its global market presence.
The stock shows bullish MA alignment with price > MA20 > MA50 > MA200 and RSI(14) at 60.1, indicating sustained uptrend momentum. It's near its 2026 YTD high, 0.0% below, suggesting a potential breakout.
Related headlines
- Philip Morris International Inc (PM) Q2 2026 Earnings Call Highlights: Strong Revenue Growth ...
- Philip Morris shares edge lower despite second-quarter earnings beat and record revenue (NYSE:PM)
- Philip Morris Stock Falls After It Cuts Guidance, but There Is One Bright Spot
- Philip Morris beats on earnings but stock edges lower on weak guidance
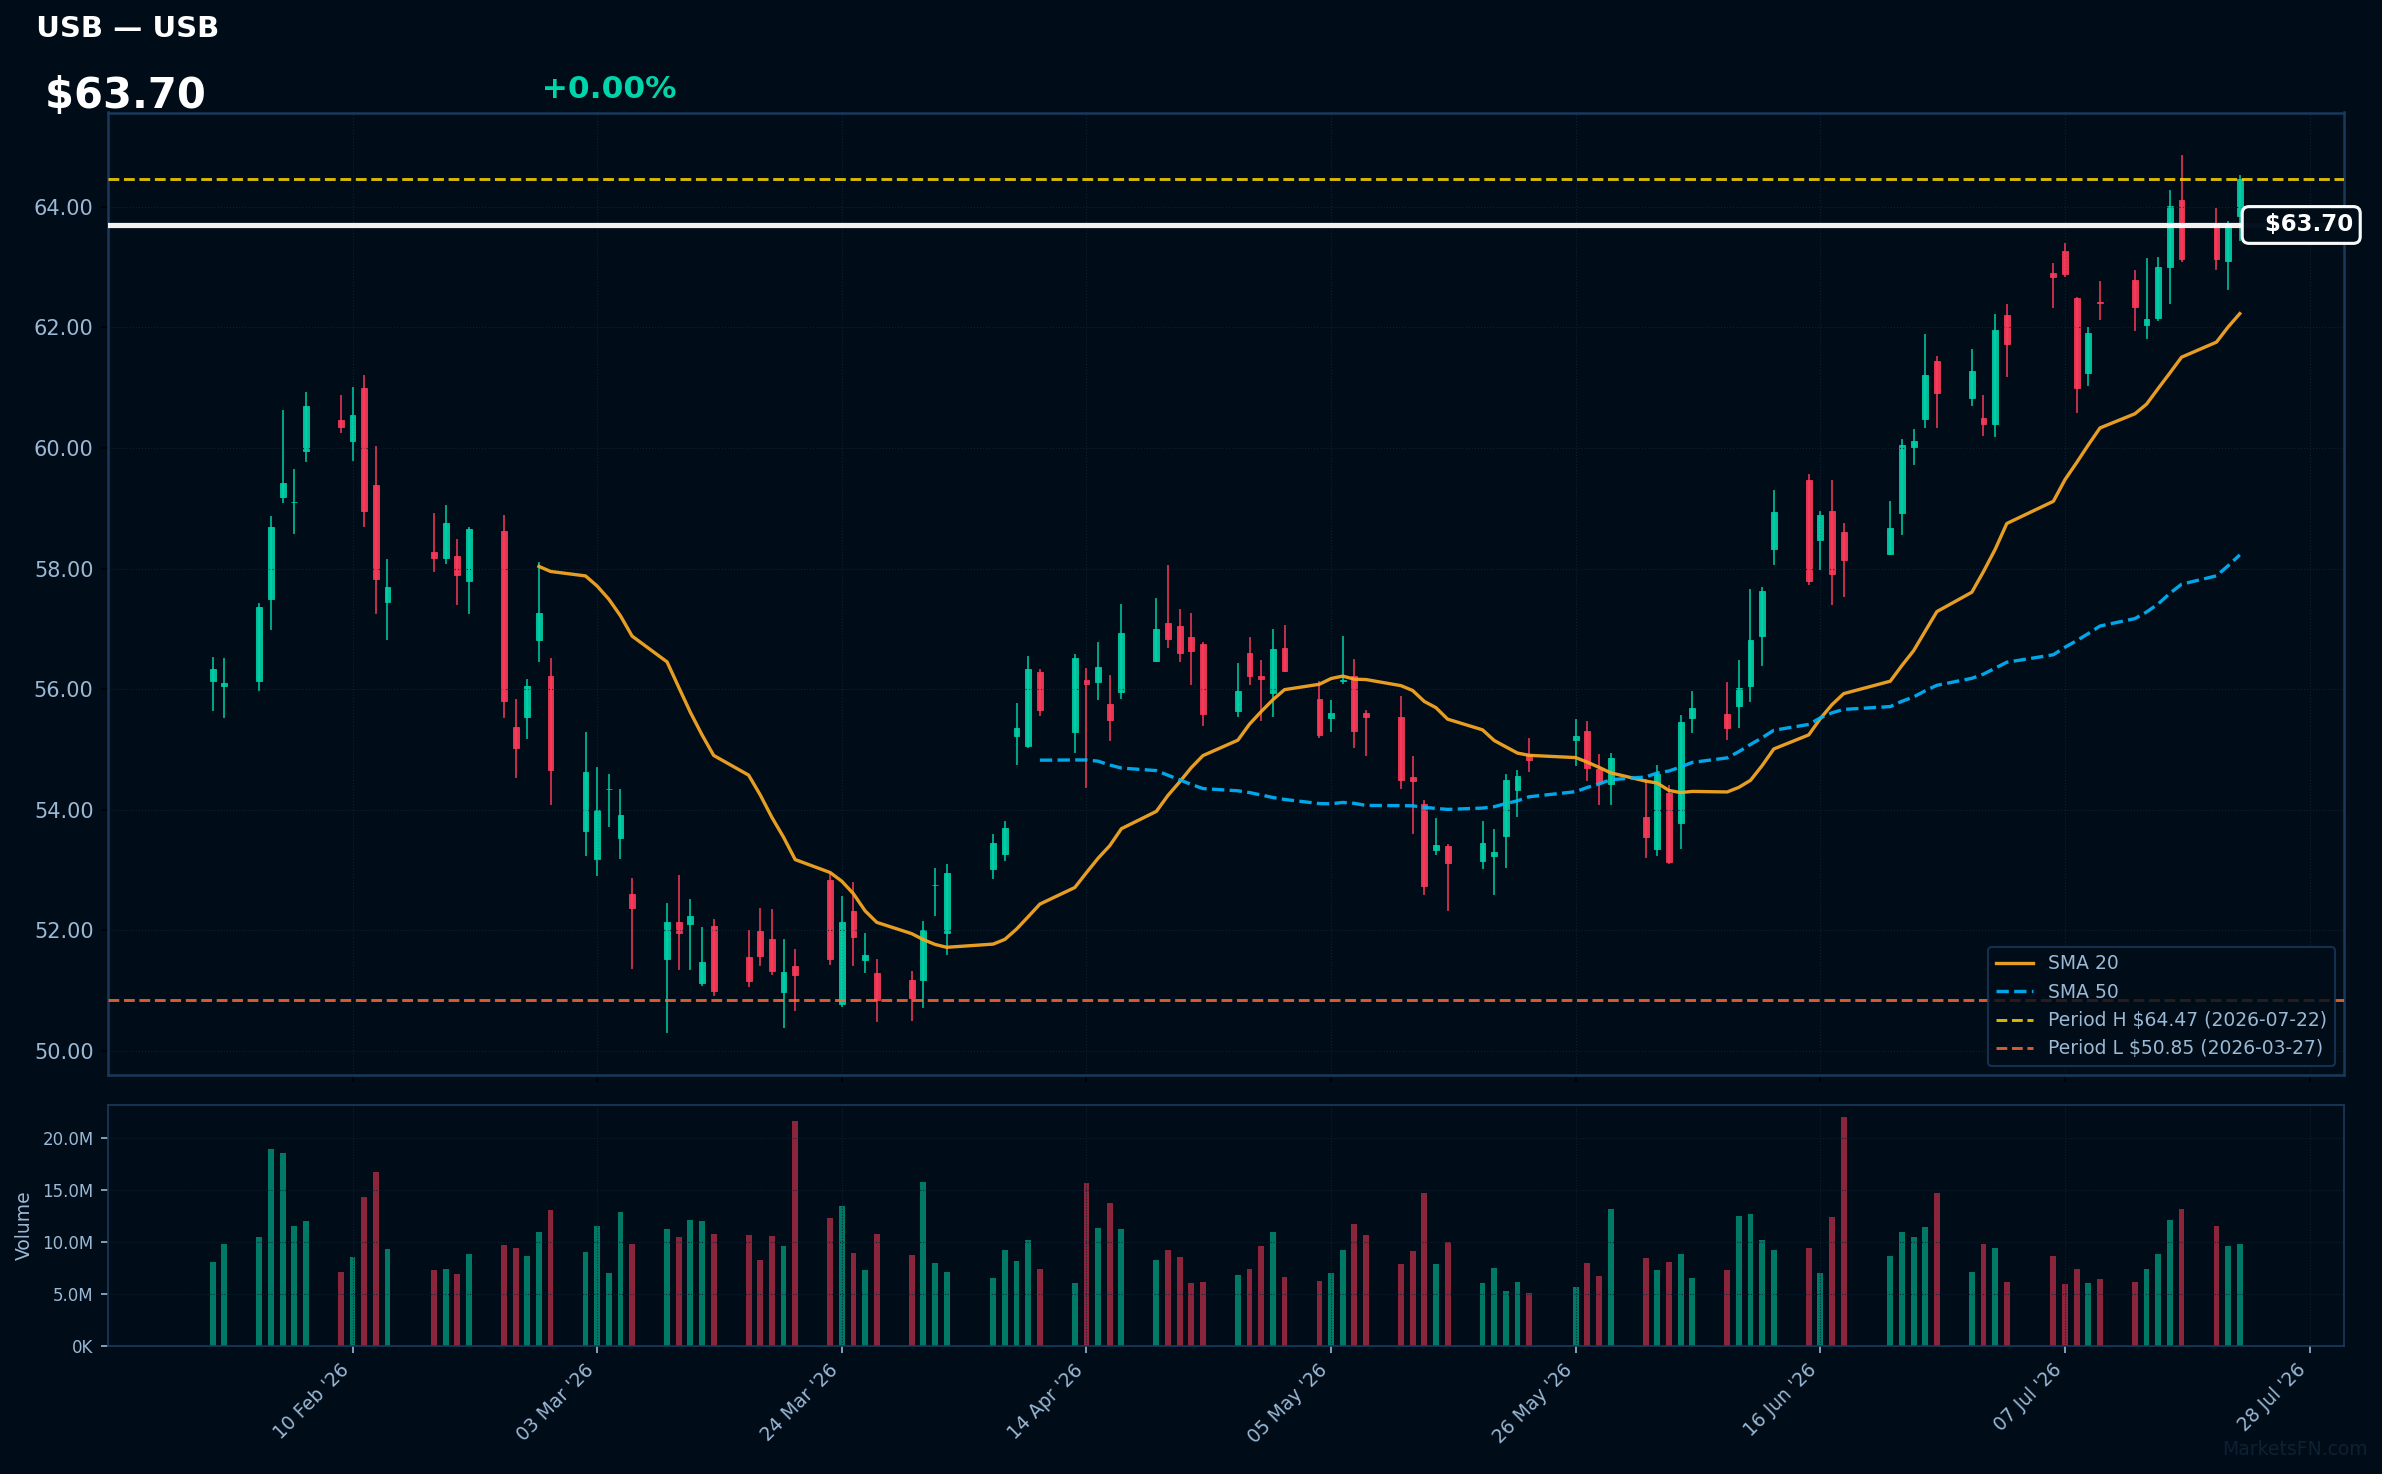
USB | U.S. Bancorp | Financial | Price Last: $64.47 | % Realized: +19.54% | RSI: 62.5 | % above MA200: +19.0% | Trend: Above MA20, MA50, MA200
U.S. Bancorp is a bank holding company providing consumer and commercial banking services, payment processing, and trust and investment management. Investors should care about its performance as it reflects the overall health of the banking sector and economy.
U.S. Bancorp's current technical situation indicates sustained uptrend with price at $63.70, RSI(14) at 62.5, and bullish MA alignment (price > MA20 > MA50 > MA200). It's near its 2026 YTD high, up 19.5% YTD, suggesting momentum.
Related headlines
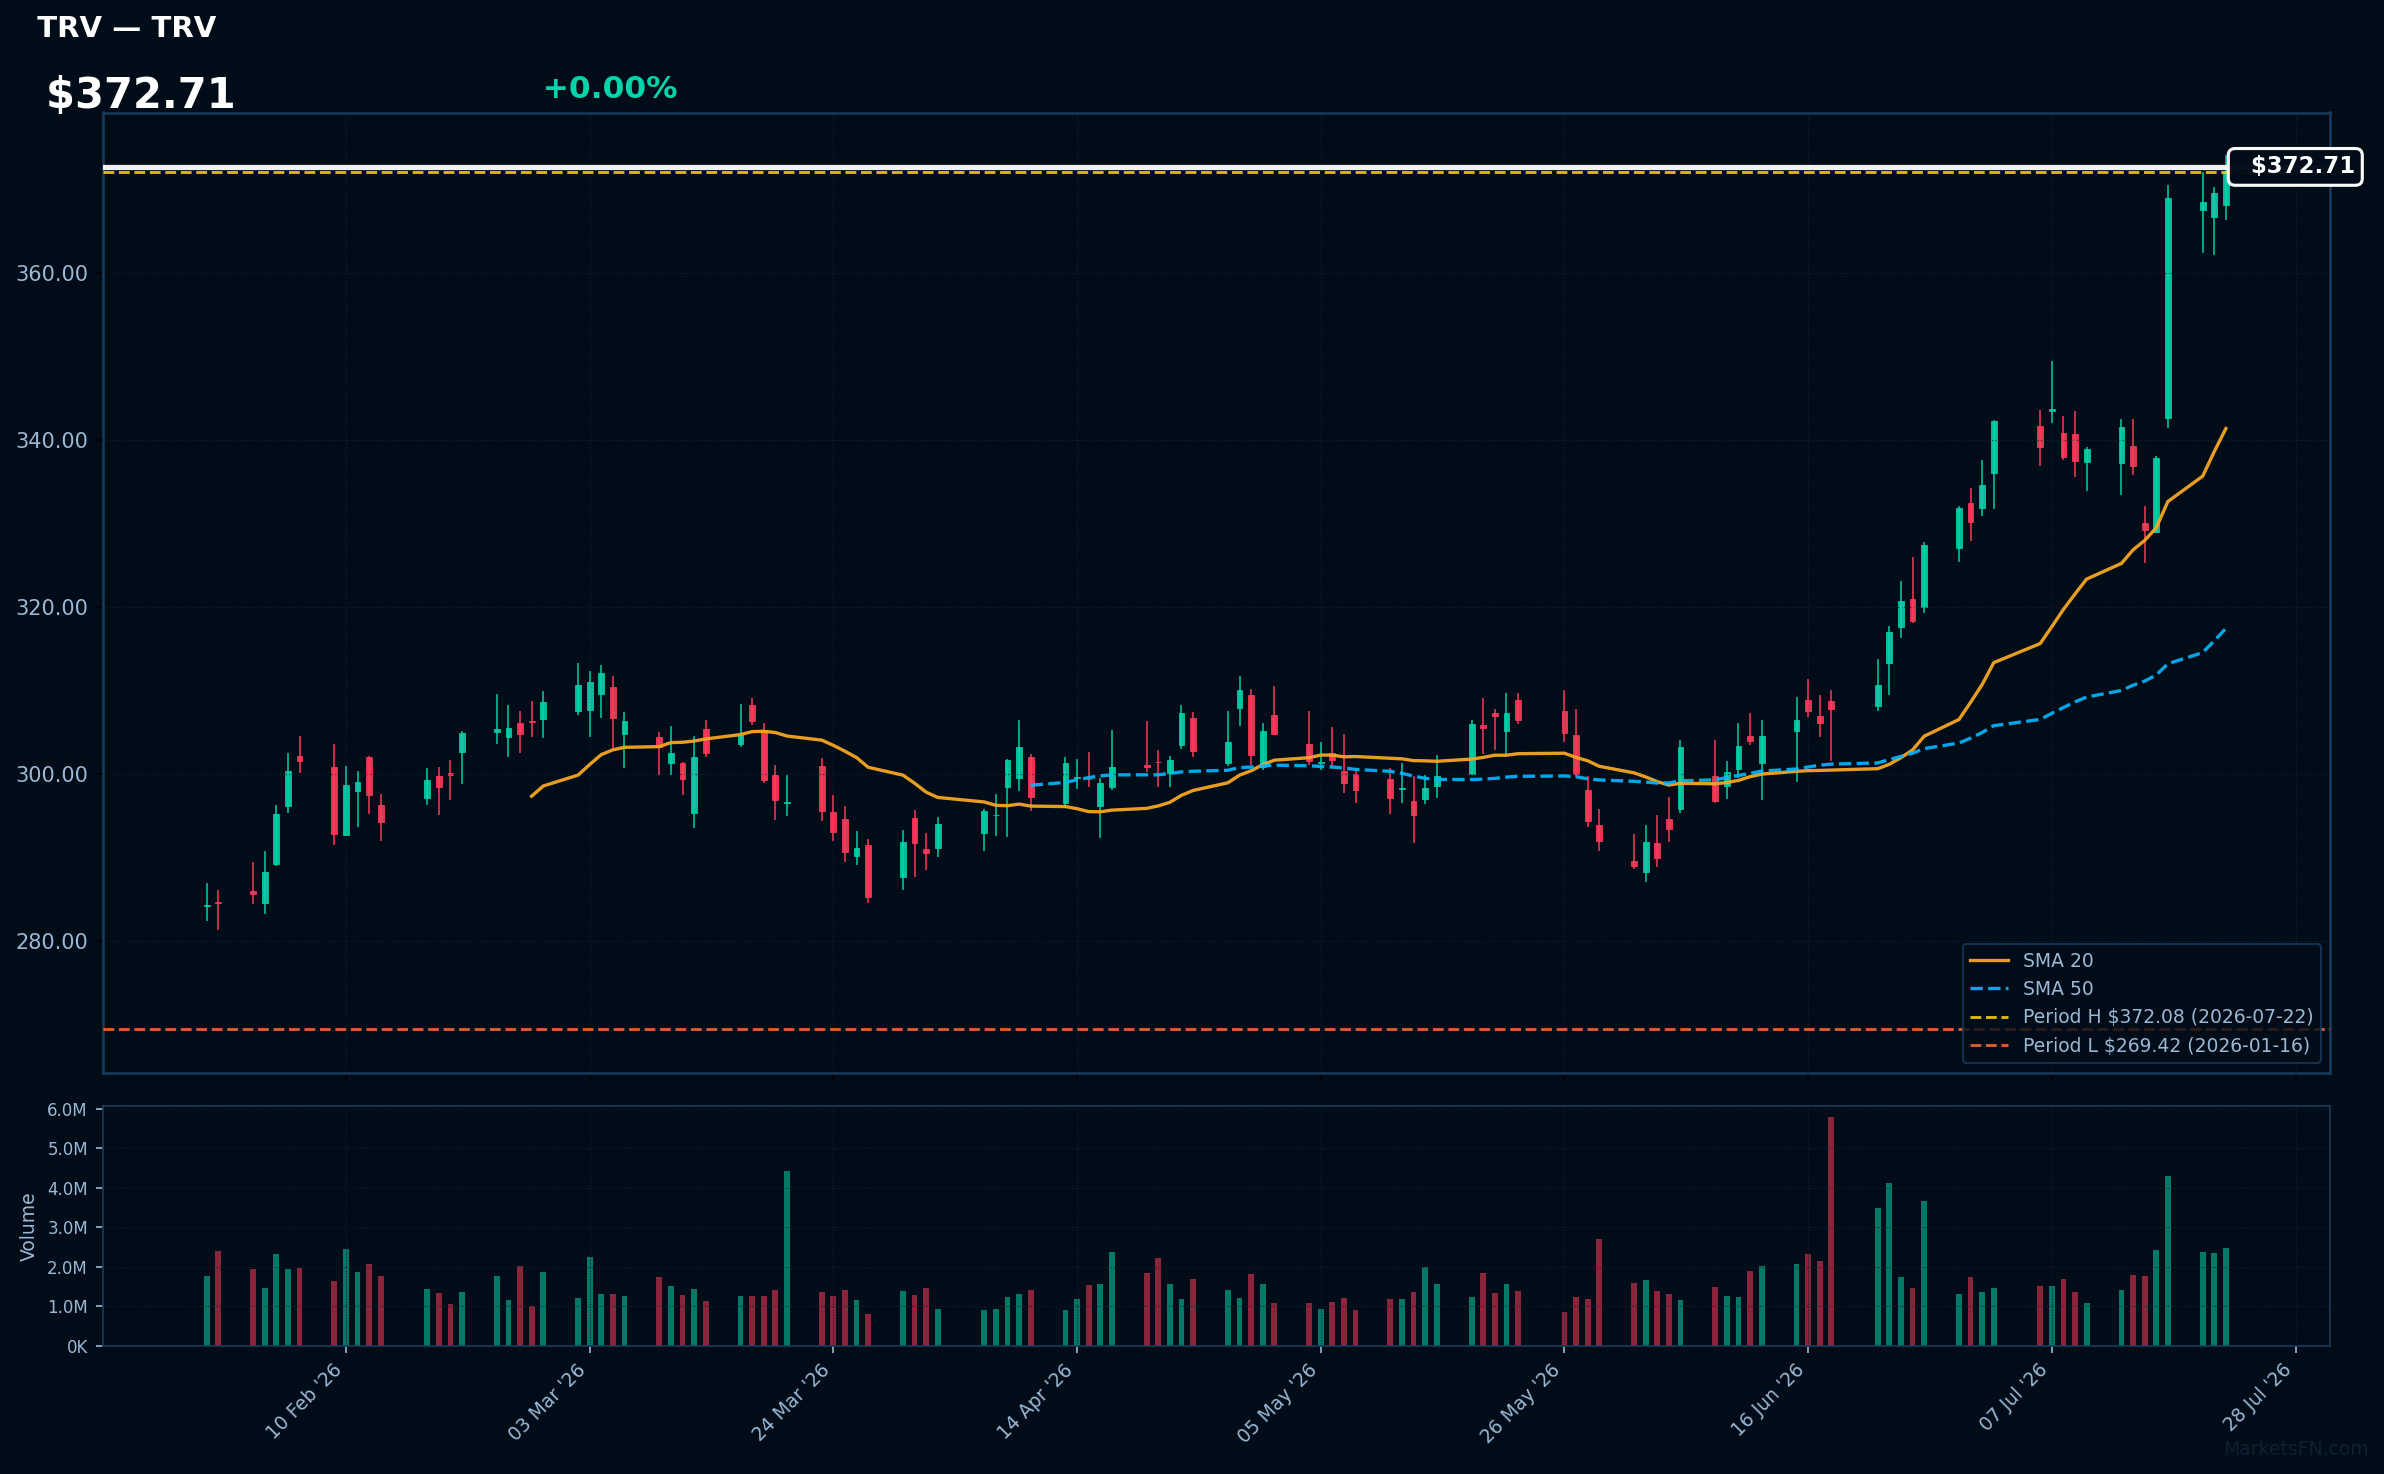
TRV | Travelers Companies Inc | Financial | Price Last: $372.08 | % Realized: +30.47% | RSI: 76.5 | % above MA200: +25.3% | Trend: Above MA20, MA50, MA200
Travelers Companies Inc (TRV) is a property casualty insurer providing various insurance products. Investors should care because its performance reflects the overall insurance market's health and its ability to manage risk, impacting its profitability and stock performance.
TRV's RSI(14) is 76.5, indicating strong momentum. The MA alignment (price > MA20 > MA50 > MA200) suggests a sustained uptrend. With the stock 0.0% below its 2026 YTD high, it nears a potential breakout level, reinforcing the bullish technical situation.
Related headlines
- Why Did ATAI, PANW, TRV Stocks Surge To 52-Week Highs Last Week?
- The Travelers Companies Inc (TRV) Q2 2026 Earnings Call Highlights: Robust Growth and Strategic ...
- Travelers Cos. Inc. stock outperforms competitors on strong trading day
- Travelers shares rise after Q2 earnings crush estimates on lower catastrophe losses
📉 Nearest to 2026 Low
Sectors represented: Technology (2), Consumer Cyclical (1), Healthcare (1), Industrials (1)
| Ticker | Company | Sector | Price Last | % Realized | 2026 YTD Low Date | RSI | % above MA200 | Trend |
|---|---|---|---|---|---|---|---|---|
| IBM | International Business Machines Corp | Technology | $205.77 | -29.41% | 2026-07-22 | 28.9 | -24.5% | Below MA20, MA50, MA200 |
| MCD | McDonald's Corp | Consumer Cyclical | $263.57 | -13.09% | 2026-07-22 | 38.2 | -12.5% | Below MA20, MA50, MA200 |
| ISRG | Intuitive Surgical Inc | Healthcare | $340.69 | -39.38% | 2026-07-22 | 29.8 | -29.7% | Below MA20, MA50, MA200 |
| SNPS | Synopsys, Inc | Technology | $377.61 | -21.40% | 2026-07-22 | 26.4 | -16.5% | Below MA20, MA50, MA200 |
| CPRT | Copart, Inc | Industrials | $27.17 | -28.06% | 2026-07-21 | 35.3 | -25.2% | Below MA20, MA50, MA200 |
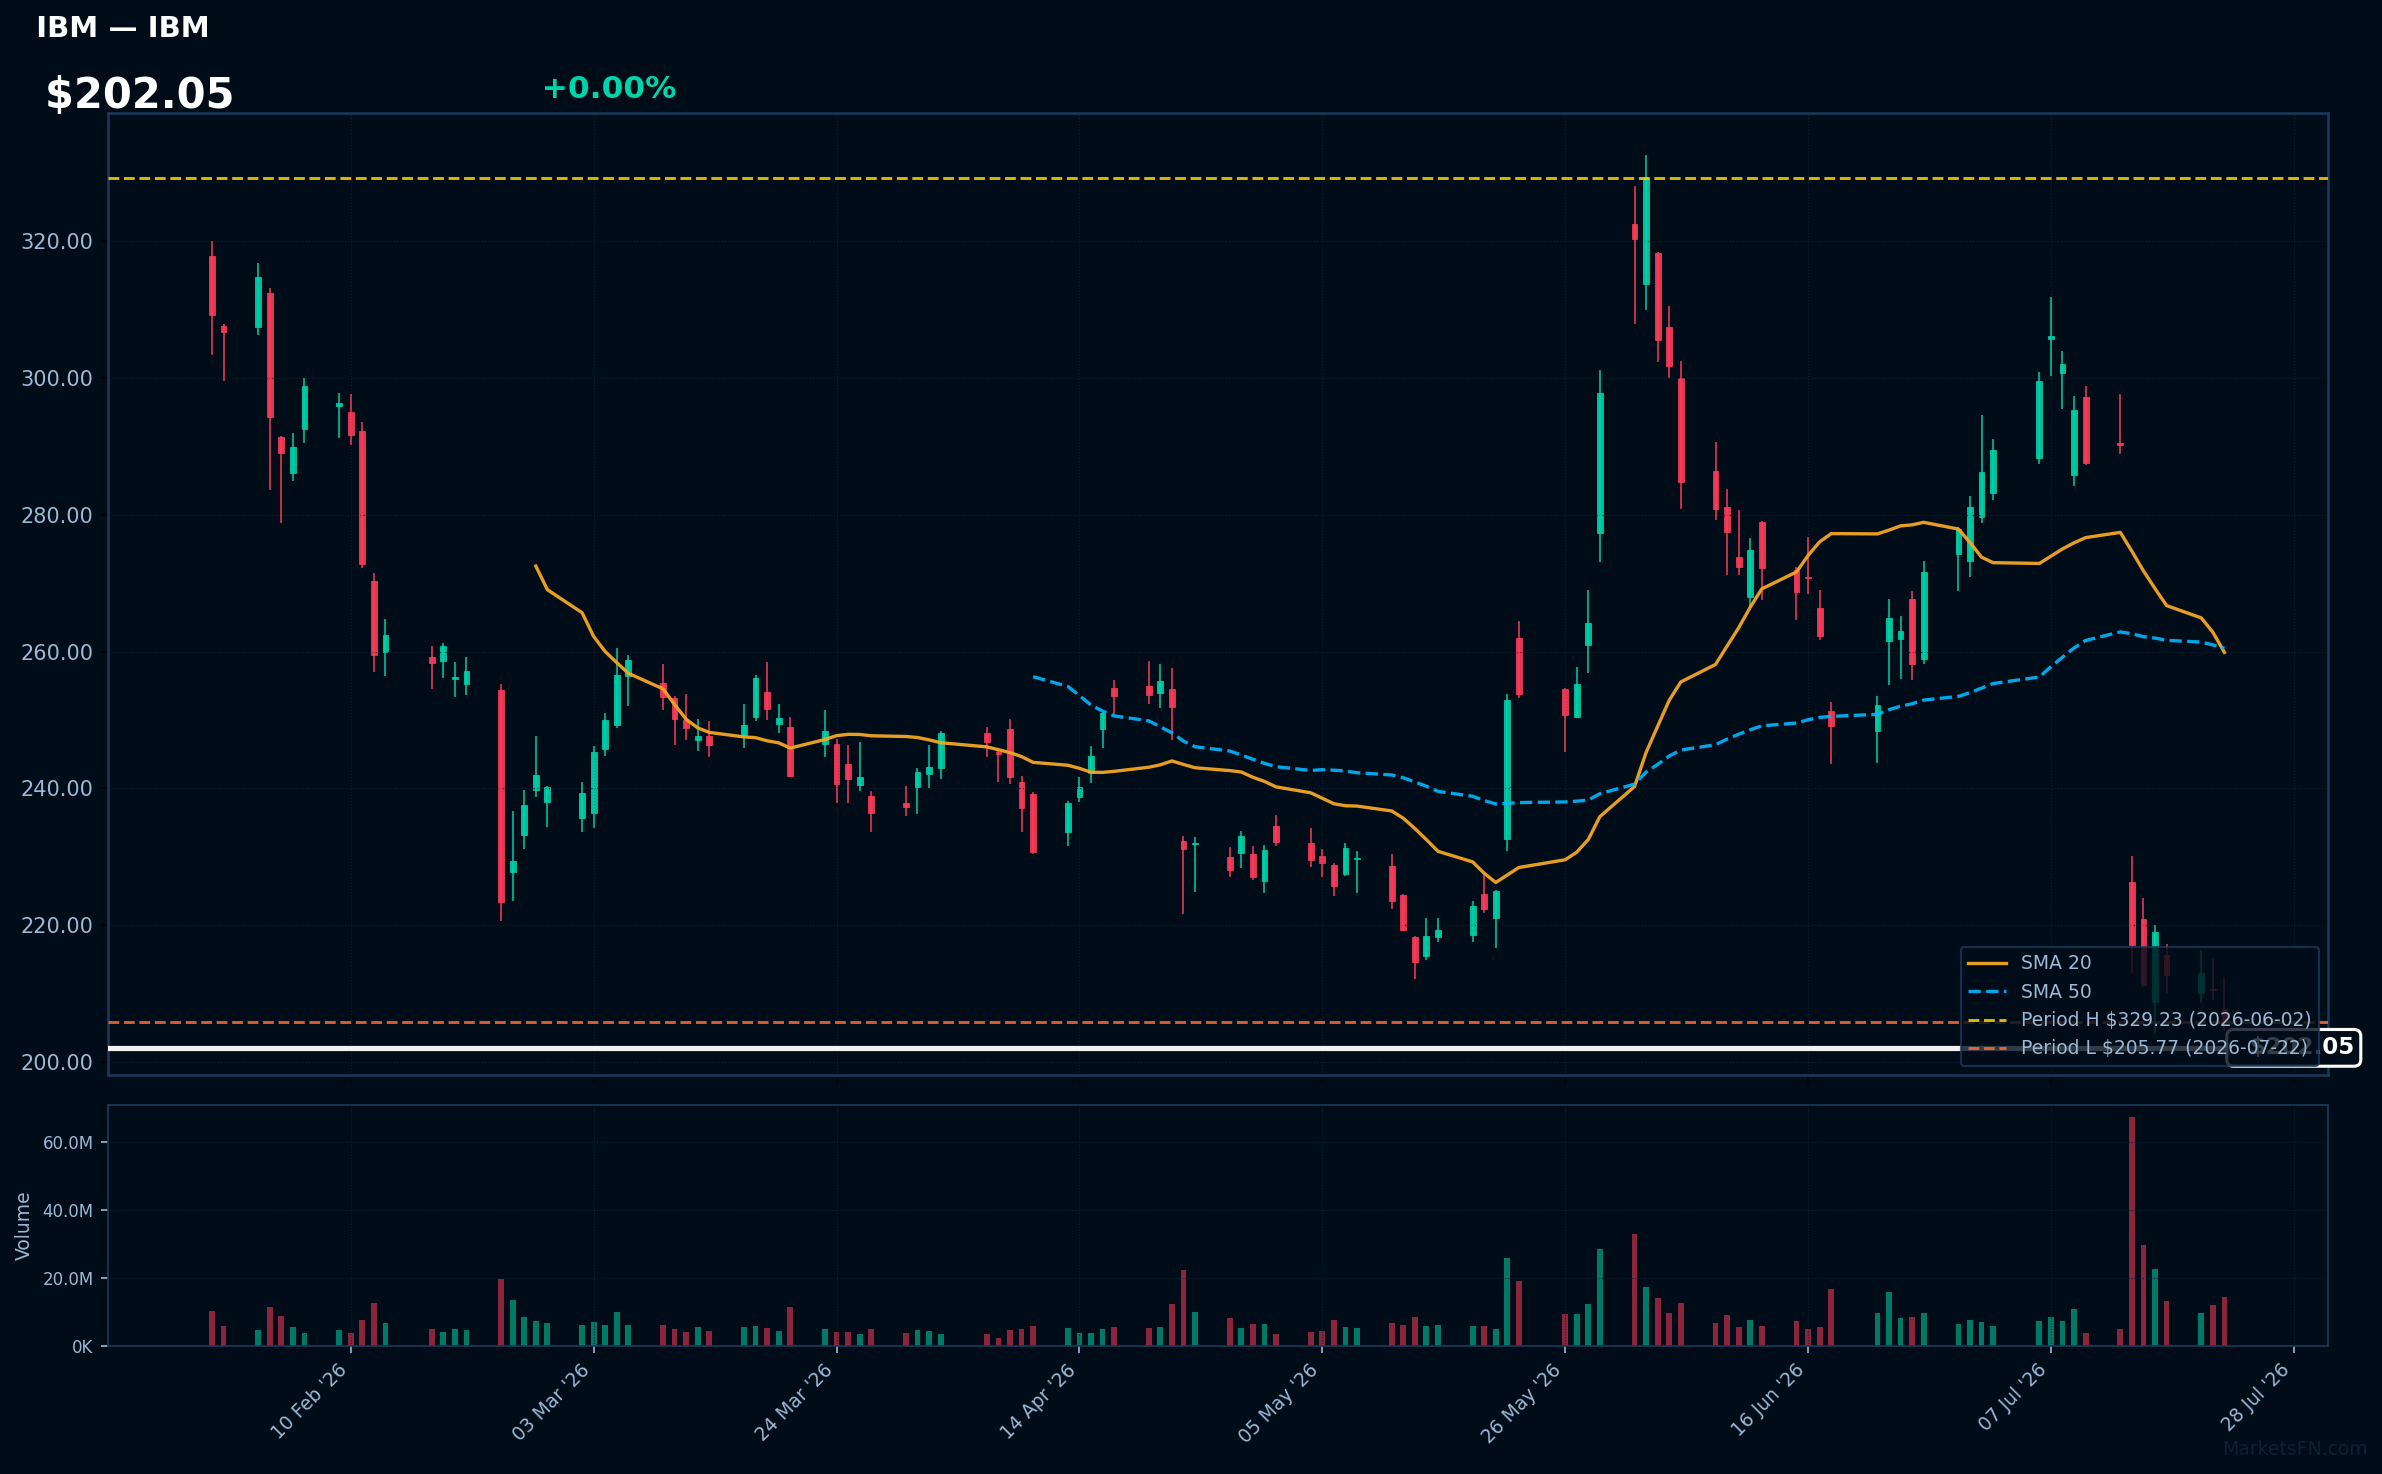
IBM | International Business Machines Corp | Technology | Price Last: $205.77 | % Realized: -29.41% | RSI: 28.9 | % above MA200: -24.5% | Trend: Below MA20, MA50, MA200
International Business Machines Corp (IBM) is a technology company that provides hardware, software, and services, including cloud computing, AI, and IT consulting. Investors care about its transition to high-growth areas like hybrid cloud and AI.
IBM's technical situation is bearish, with an RSI(14) of 28.9 indicating oversold conditions, and a sustained downtrend as price ($202.05) remains below MA20, MA50, and MA200, with the stock testing major support at its 2026 YTD low.
Related headlines
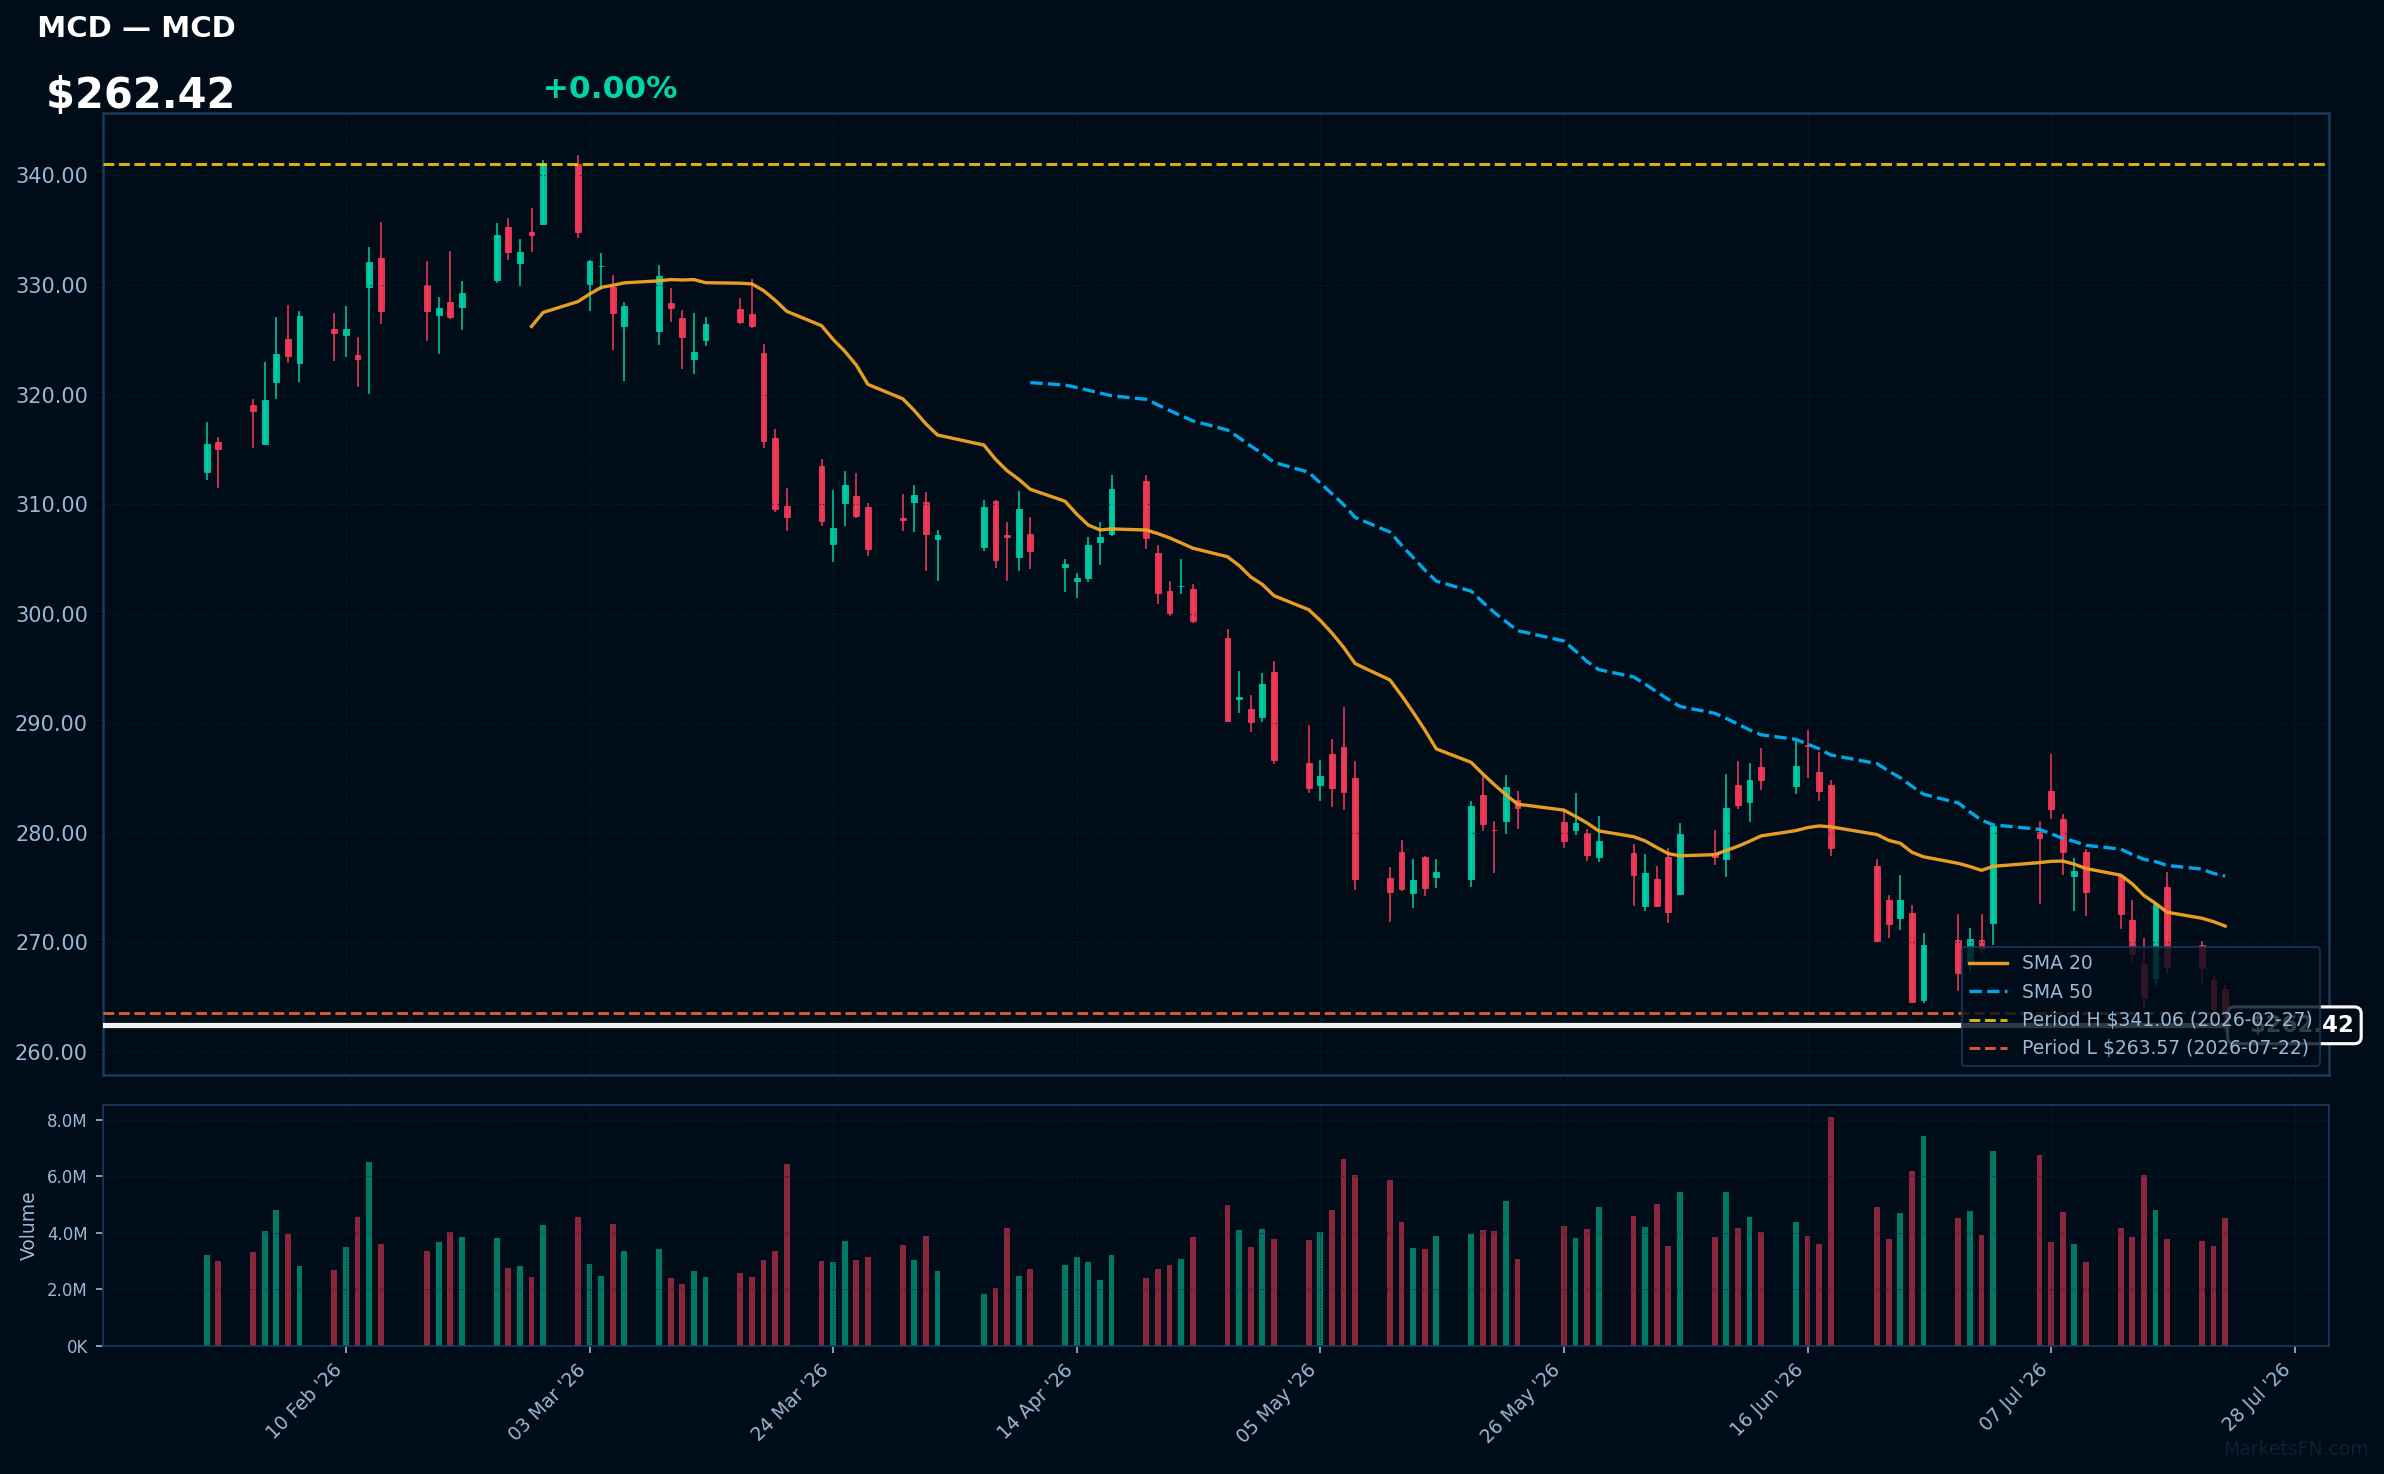
MCD | McDonald's Corp | Consumer Cyclical | Price Last: $263.57 | % Realized: -13.09% | RSI: 38.2 | % above MA200: -12.5% | Trend: Below MA20, MA50, MA200
McDonald's Corp operates quick-service restaurants, serving burgers, fries, and beverages globally. Investors should care about its brand strength, global footprint, and operational efficiency, as these factors influence revenue growth and profitability.
McDonald's Corp is in a sustained downtrend with price ($262.42) below MA20, MA50, and MA200. The RSI(14) is 38.2, near oversold territory. Testing major support at its 2026 YTD low, a -13.1% YTD return indicates weakness, potentially a warning sign.
Related headlines
- Why Did PEGA, ISRG, MCD Stocks Plunge To 52-Week Lows Today?
- Why Did PSKY, MCD, NOC Stocks Tumble To 52-Week Lows Today?
- A weak yen turned Tokyo into a steal. A strong shekel turned Tel Aviv into the worlds most expensive city to buy McDonalds
- McDonald's is adding honey brown butter breakfast biscuits to its menu
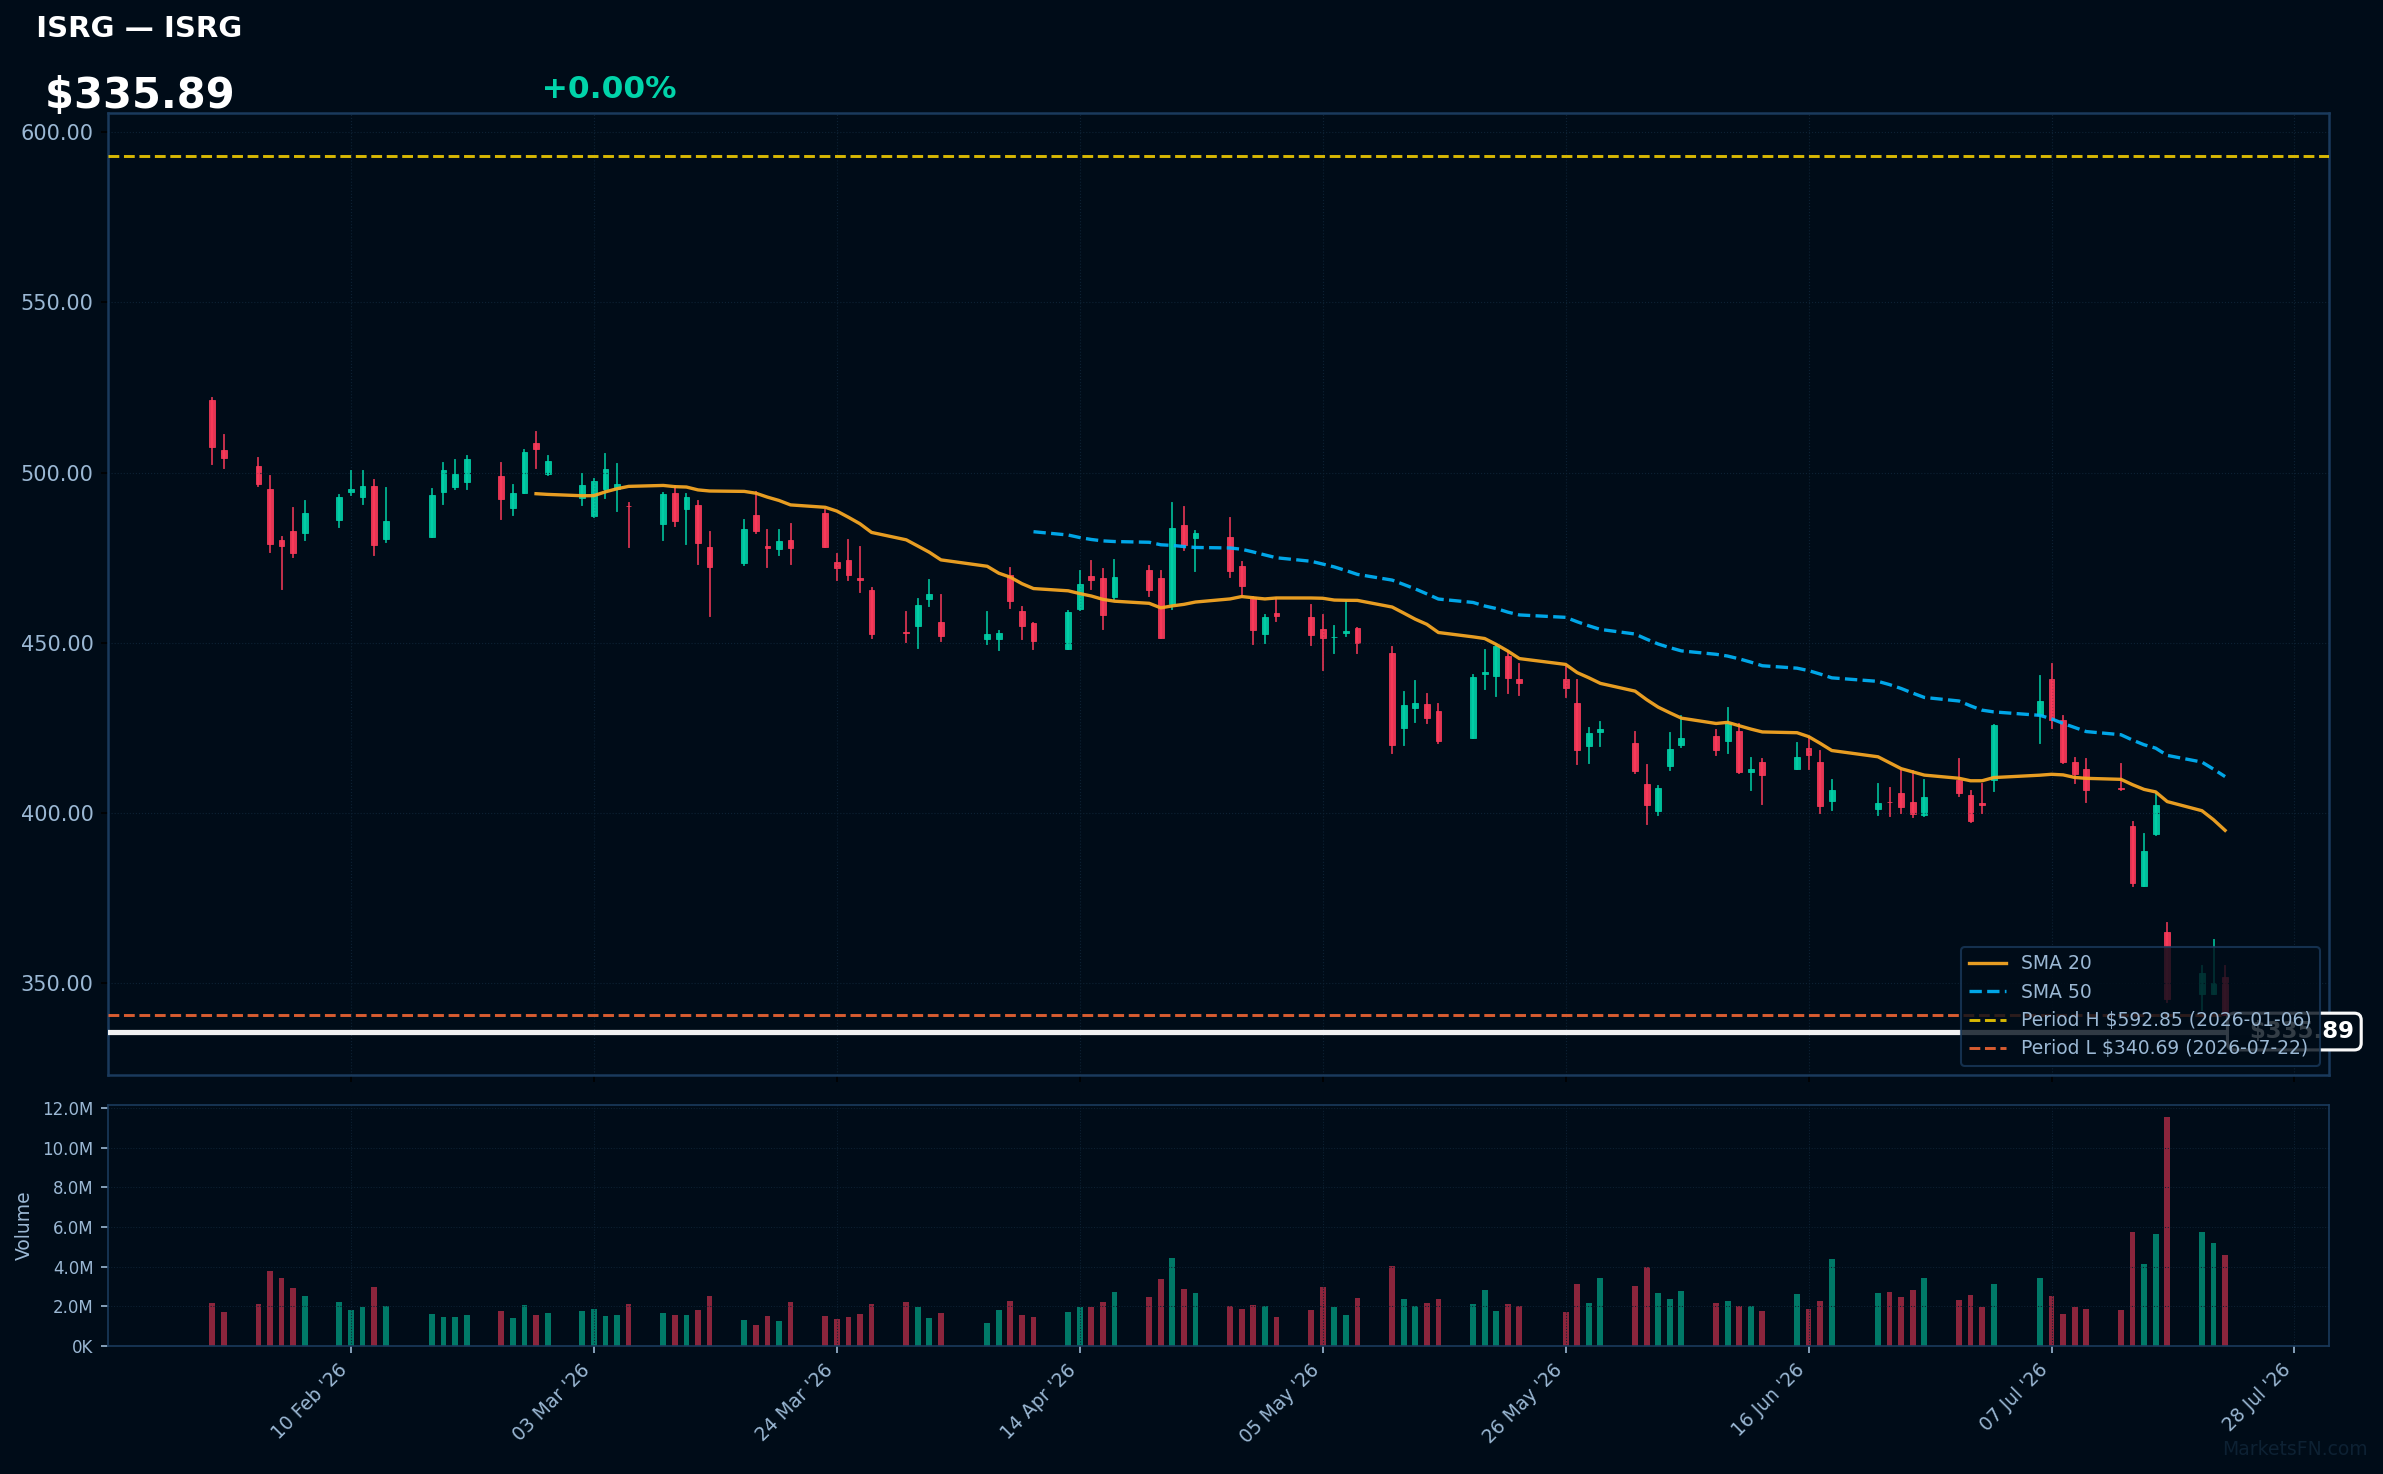
ISRG | Intuitive Surgical Inc | Healthcare | Price Last: $340.69 | % Realized: -39.38% | RSI: 29.8 | % above MA200: -29.7% | Trend: Below MA20, MA50, MA200
Intuitive Surgical Inc develops and manufactures robotic-assisted surgical systems, primarily the da Vinci Surgical System, used in minimally invasive surgeries. Investors should care because its technology is revolutionizing surgical procedures, driving growth through adoption and expanding procedure volumes.
ISRG's technical situation is bearish, with an RSI(14) of 29.8 indicating oversold conditions. The sustained downtrend is evident as price ($335.89) < MA20 < MA50 < MA200, and it's testing major support at its 2026 YTD low, down 39.4% YTD.
Related headlines
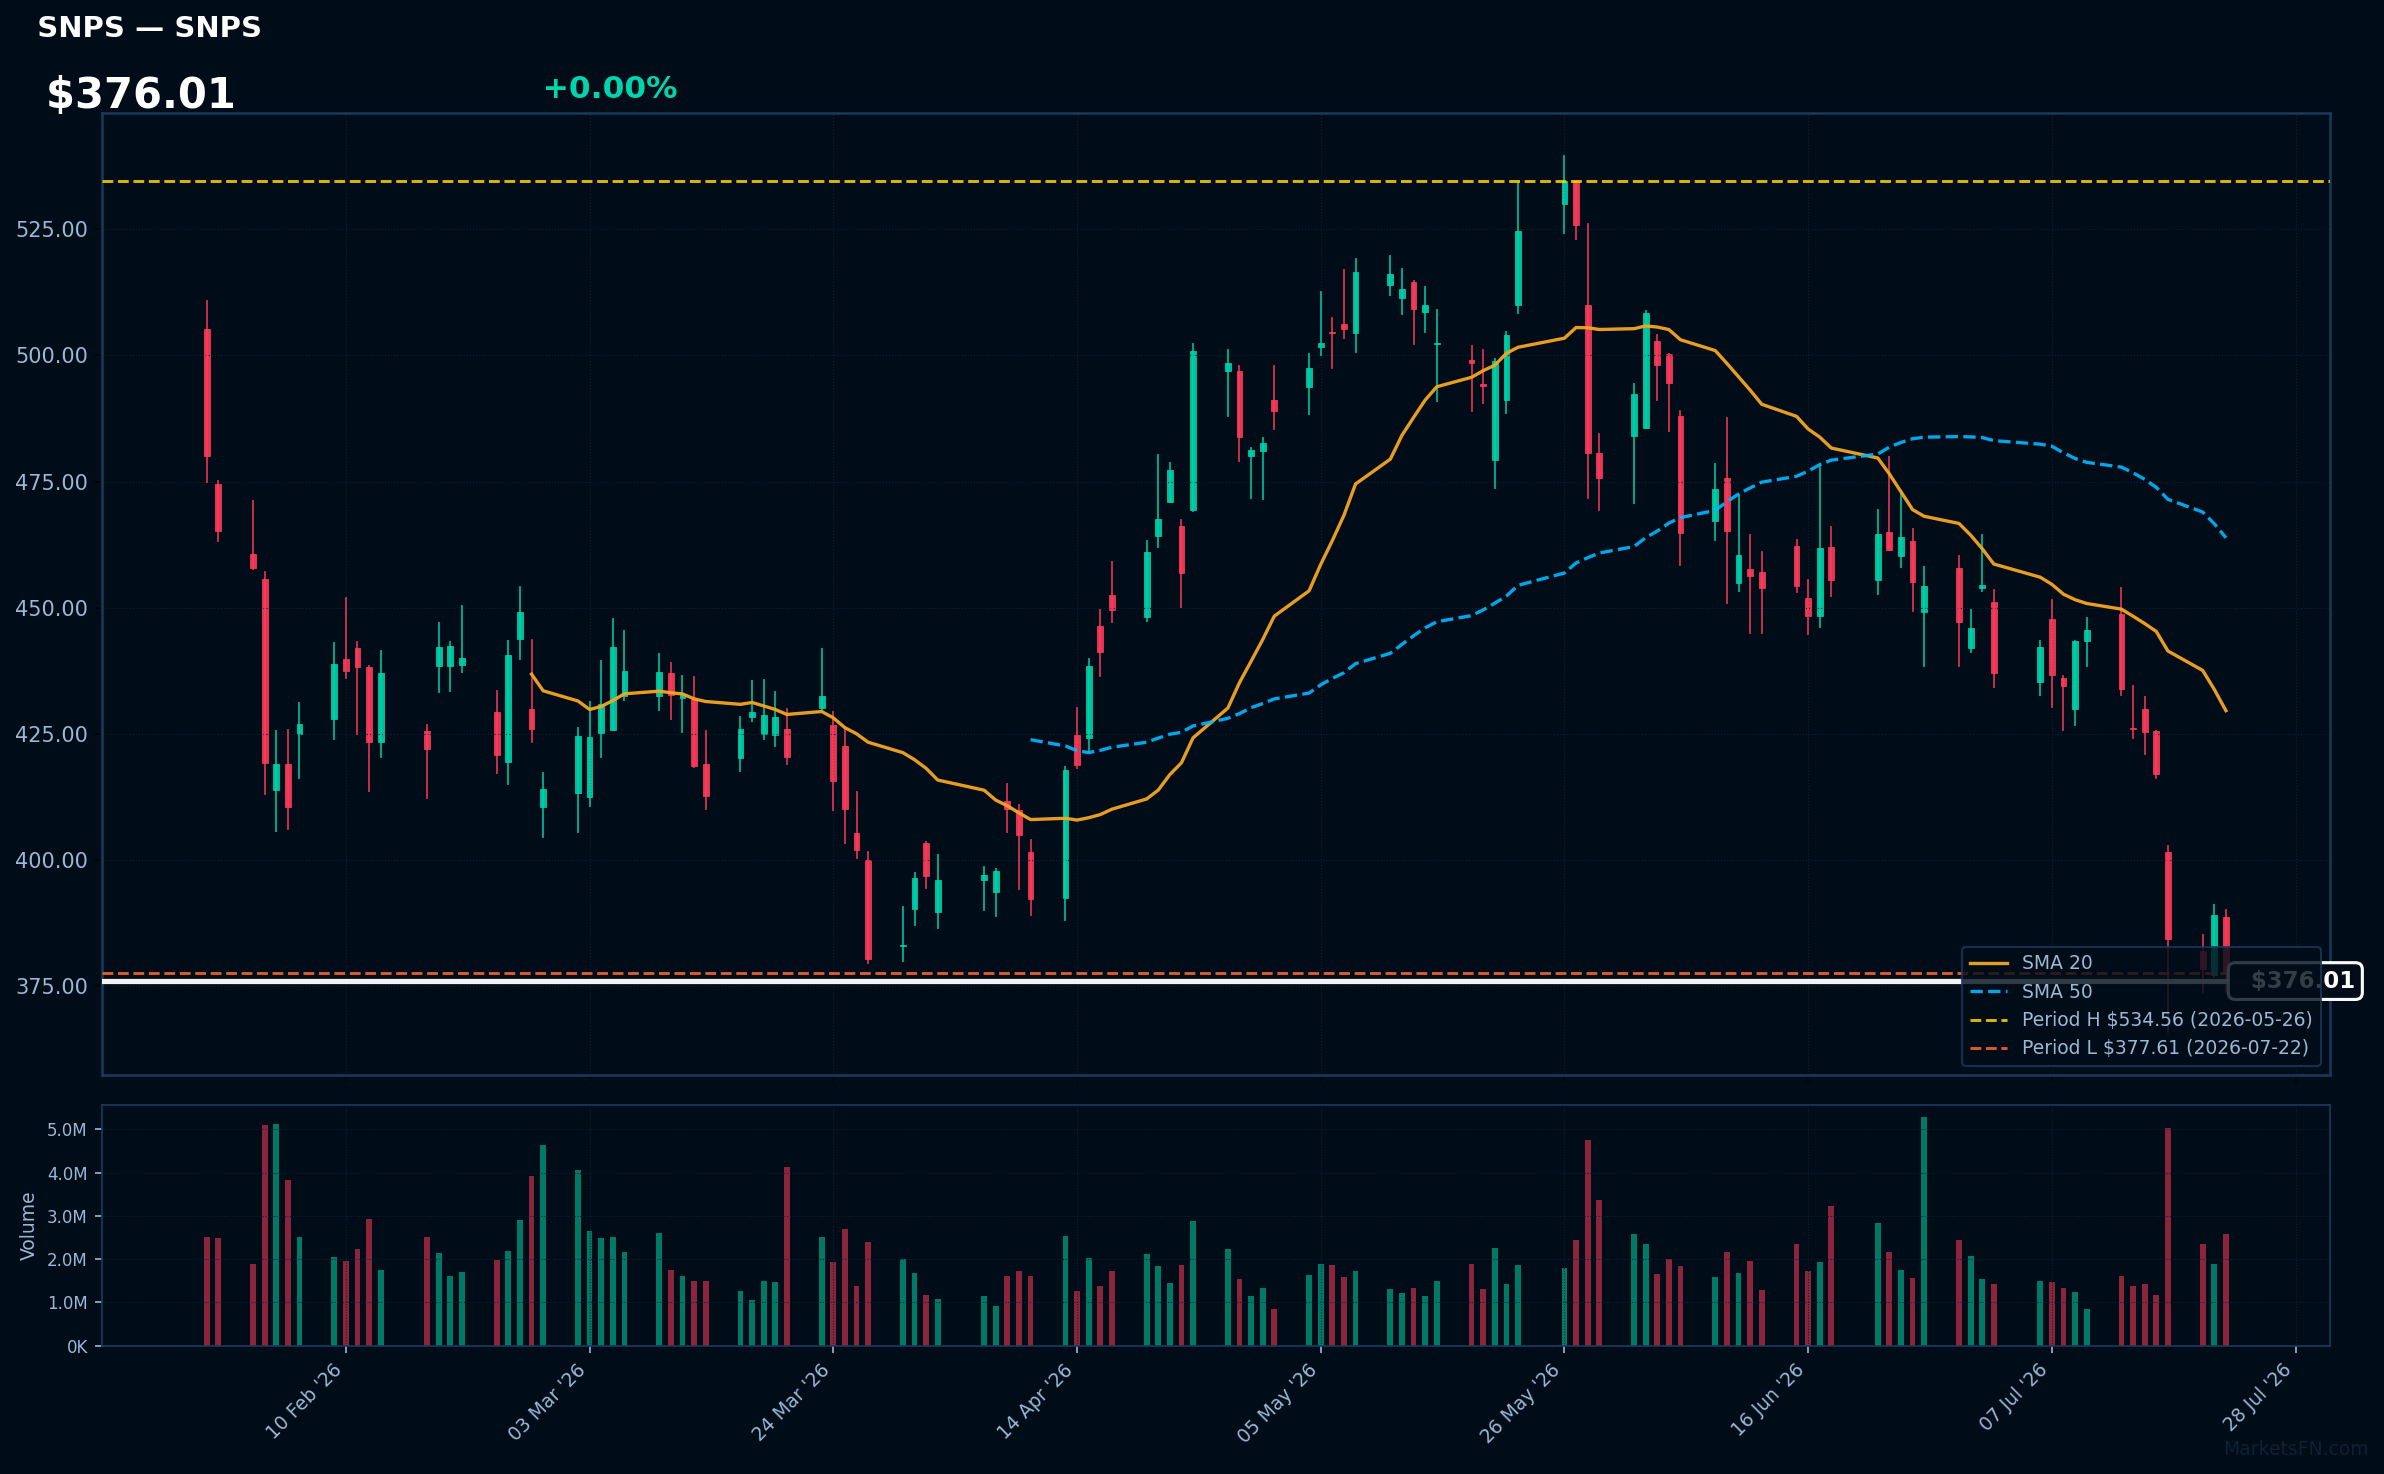
SNPS | Synopsys, Inc | Technology | Price Last: $377.61 | % Realized: -21.40% | RSI: 26.4 | % above MA200: -16.5% | Trend: Below MA20, MA50, MA200
Synopsys, Inc (SNPS) is a software company providing electronic design automation (EDA) tools and semiconductor intellectual property (IP) used in chip design and verification. Investors care due to its dominant position in the growing semiconductor industry.
SNPS is testing major support with its price 0.0% above 2026 YTD low. RSI(14) is 26.4, indicating oversold conditions. MA alignment shows mixed signals with the stock below MA20, MA50, and MA200, suggesting potential weakness.
Related headlines
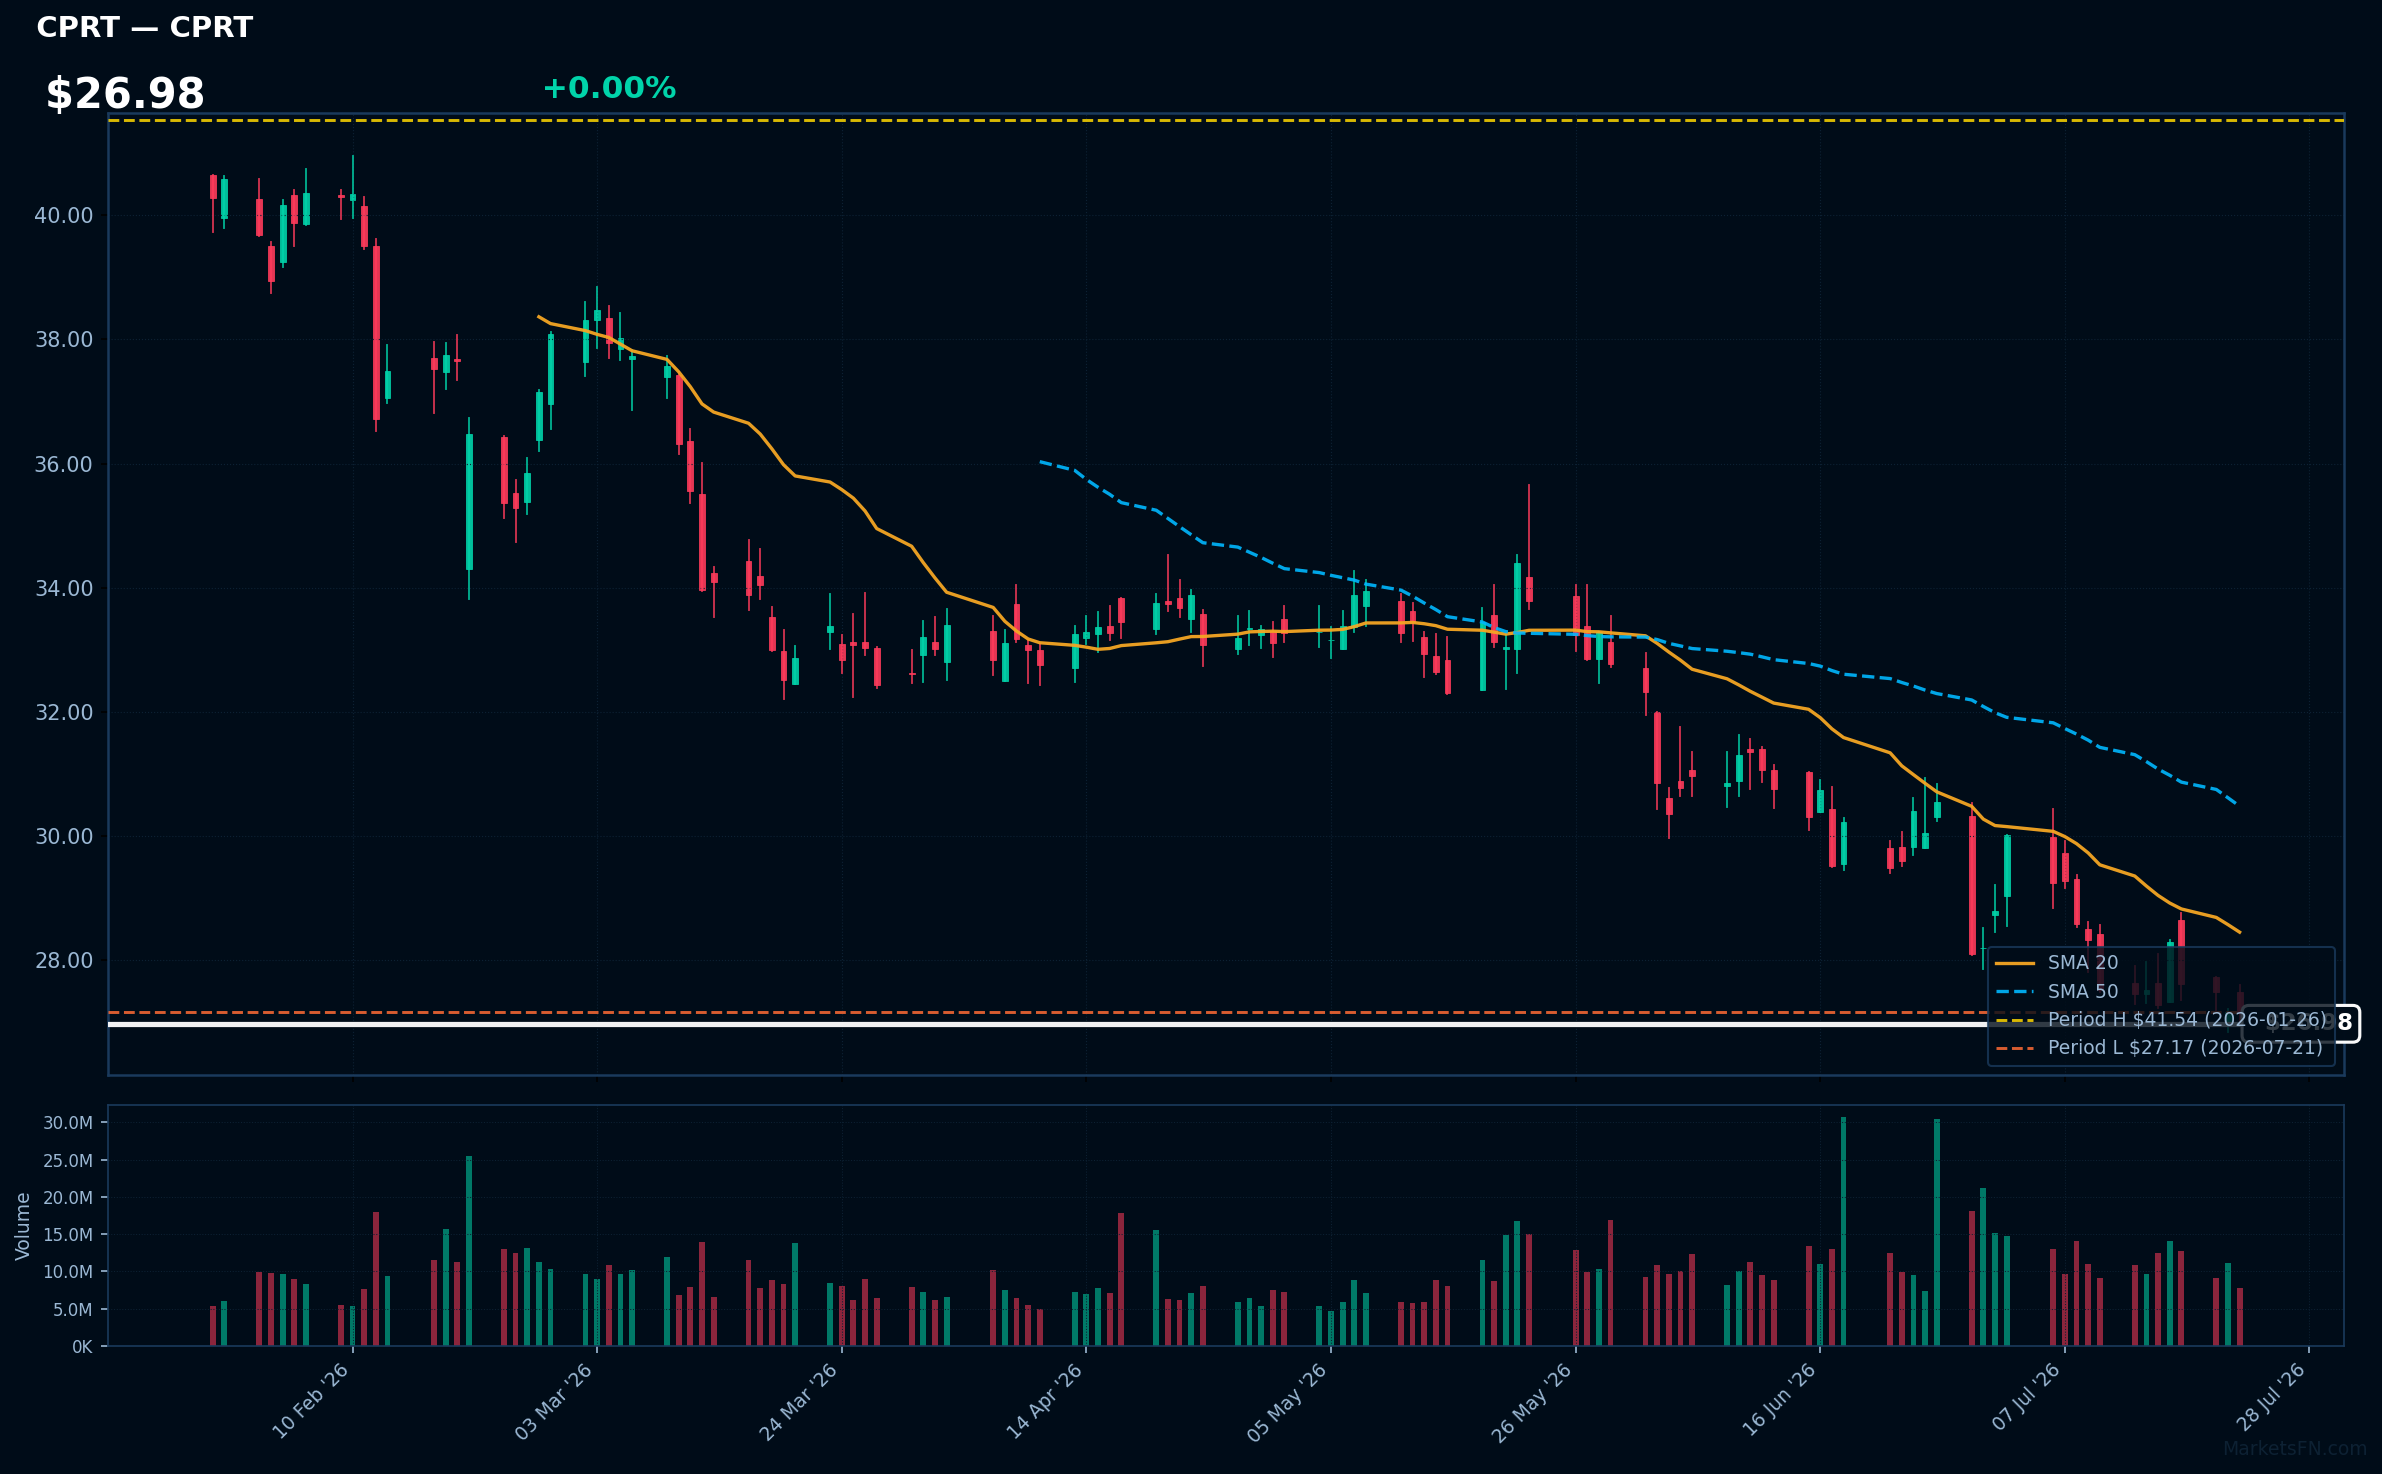
CPRT | Copart, Inc | Industrials | Price Last: $27.17 | % Realized: -28.06% | RSI: 35.3 | % above MA200: -25.2% | Trend: Below MA20, MA50, MA200
Copart, Inc (CPRT) operates an online vehicle auction platform and provides related services, allowing insurance companies and other sellers to sell damaged or used vehicles to buyers globally. Investors care due to its market dominance and growth potential in the vehicle remarketing industry.
Copart's technical situation indicates a sustained downtrend with price ($26.98) below MA20, MA50, and MA200. The RSI(14) is 35.3, near oversold territory, and the stock is testing major support at its 2026 YTD low, a potential warning sign.
Related headlines
Market Commentary
The S&P 500 stocks listed are currently trading near their year-to-date (YTD) extremes as of 2026. Stocks near their YTD highs include JPMorgan Chase & Co (JPM), Bank Of America Corp (BAC), and Philip Morris International Inc (PM), all at 0.0% from their highs. Conversely, International Business Machines Corp (IBM), McDonald's Corp (MCD), and Intuitive Surgical Inc (ISRG) are near their YTD lows, having risen by +0.0% above their lows.
The stocks near their YTD highs are primarily from the financial sector, indicating strong performance in this segment. The presence of Philip Morris International Inc suggests a stable consumer staples sector. In contrast, the stocks near their YTD lows represent a mix of technology (ISRG, SNPS) and consumer services (MCD), potentially indicating challenges or volatility in these areas.
Investors should monitor sector-specific trends and broader market conditions to understand the drivers behind these stock movements. Key factors to watch include financial sector stability, consumer behavior, and technological advancements. As these stocks are at their YTD extremes, any deviation from these levels could signal a shift in market sentiment or sector rotation.
Methodology: All 503 S&P 500 constituents screened. Close prices downloaded from 2026-01-01. Period high = highest close since Jan 1 2026; period low = lowest close since Jan 1 2026. Distance = (current price / period extreme − 1) × 100. Technical indicators computed on up to 1 year of daily OHLCV data.
Disclaimer: For informational purposes only. Not investment advice. Past performance is not indicative of future results.

