S&P 500 2026 YTD Highs & Lows Radar: JPMorgan Chase & (JPM), Tesla (TSLA) and more
MarketsFN Team

S&P 500 2026 YTD Highs & Lows Radar: JPMorgan Chase & (JPM), Tesla (TSLA) and more
Screening all 503 S&P 500 constituents for stocks nearest to their 2026 year-to-date high and their 2026 YTD low. Data as of July 24, 2026. % Realized = total return since Jan 1 2026.
Legend: RSI > 70 = overbought · RSI < 30 = oversold · Green % Realized = positive YTD return · Red = negative.
📈 Nearest to 2026 High
Sectors represented: Industrials (2), Financial (1), Healthcare (1), Real Estate (1)
| Ticker | Company | Sector | Price Last | % Realized | 2026 YTD High Date | RSI | % above MA200 | Trend |
|---|---|---|---|---|---|---|---|---|
| JPM | JPMorgan Chase & Co | Financial | $349.90 | +7.50% | 2026-07-23 | 64.2 | +12.6% | Above MA20, MA50, MA200 |
| MRK | Merck & Co Inc | Healthcare | $130.48 | +22.57% | 2026-07-23 | 61.3 | +18.1% | Above MA20, MA50, MA200 |
| UNP | Union Pacific Corp | Industrials | $304.33 | +31.23% | 2026-07-23 | 69.7 | +22.2% | Above MA20, MA50, MA200 |
| WELL | Welltower Inc | Real Estate | $247.05 | +32.15% | 2026-07-23 | 72.1 | +22.1% | Above MA20, MA50, MA200 |
| GD | General Dynamics Corp | Industrials | $381.79 | +11.18% | 2026-07-23 | 67.4 | +9.6% | Above MA20, MA50, MA200 |
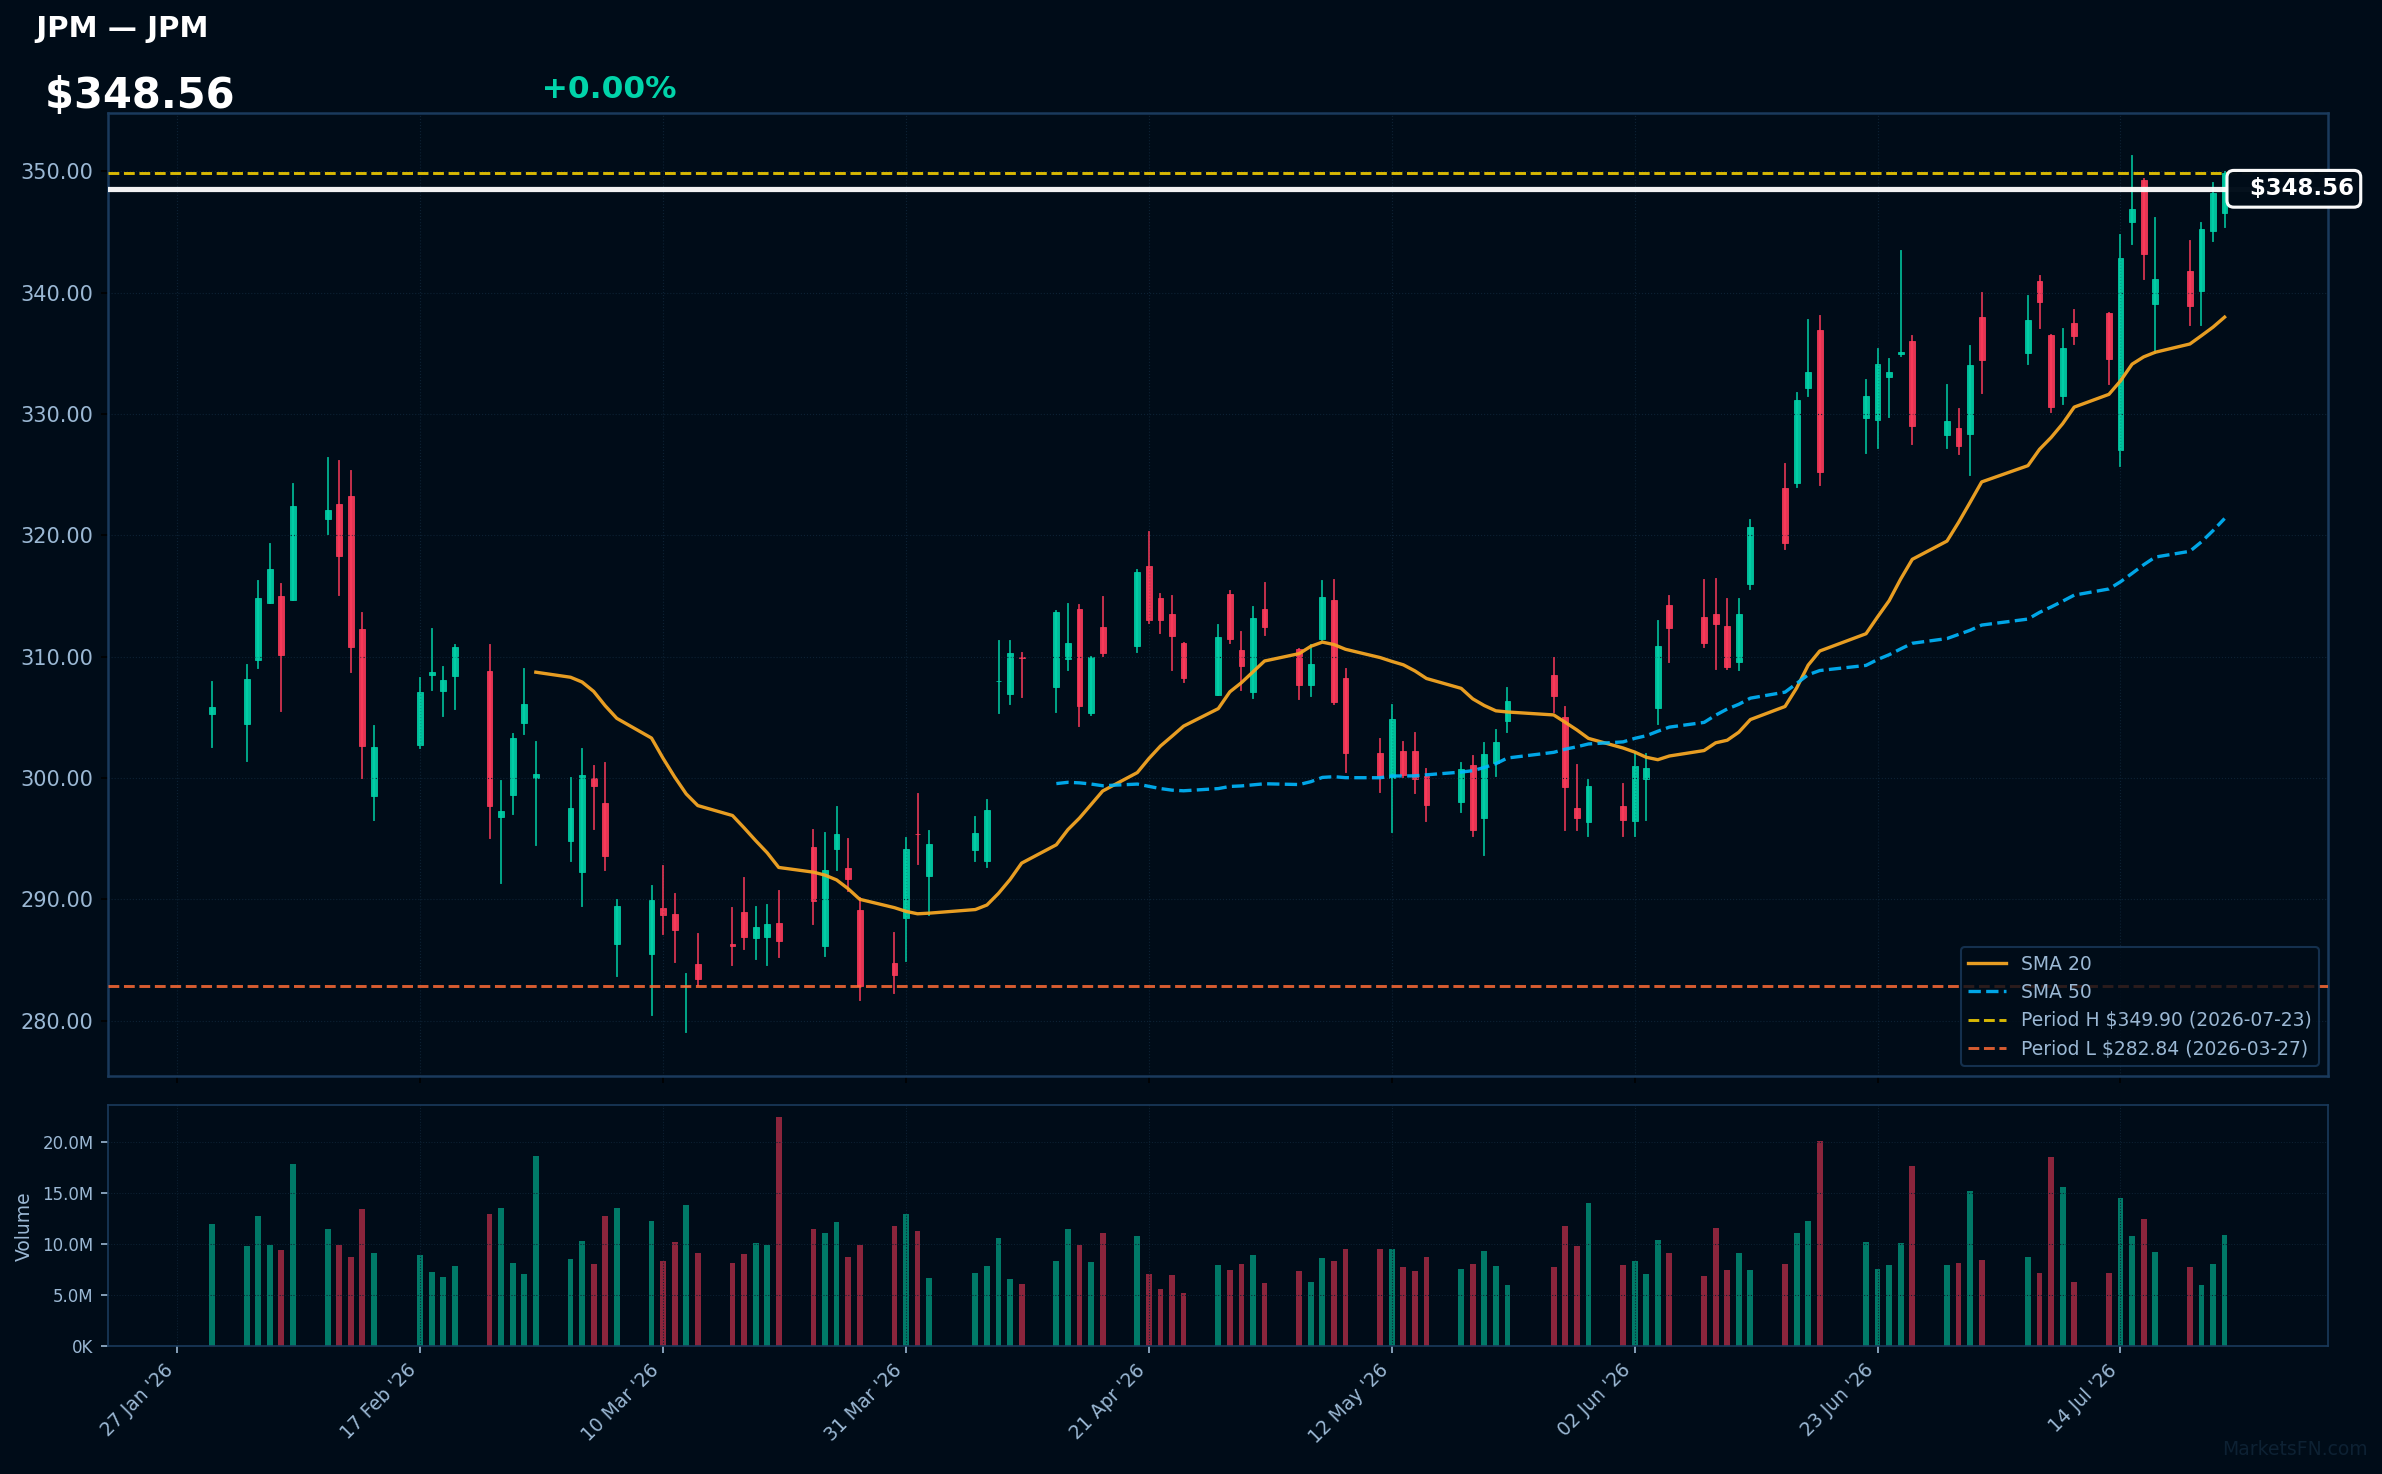
JPM | JPMorgan Chase & Co | Financial | Price Last: $349.90 | % Realized: +7.50% | RSI: 64.2 | % above MA200: +12.6% | Trend: Above MA20, MA50, MA200
JPMorgan Chase & Co is a global financial services firm providing consumer and investment banking, financial transactions processing, asset management, and more. Investors care due to its systemic importance and exposure to global economic trends.
JPMorgan Chase & Co is in a sustained uptrend with price at $348.56, RSI(14) at 64.2, and MA alignment: price > MA20 > MA50 > MA200. It's near its 2026 YTD high, 0.0% below, indicating potential breakout momentum.
Related headlines
- Infosys downgraded by JPMorgan, HSBC after earnings miss and weaker growth outlook
- JPMorgan Reiterates That Dimon Never Met Epstein in New Letter
- Four Takeaways From Our Report on the IRS Chief Who Spied on Colleagues at JPMorgan
- JPMorgan Sees AI-Powered Growth For Banks; Stock Pops Into Buy Zone After Earnings Growth
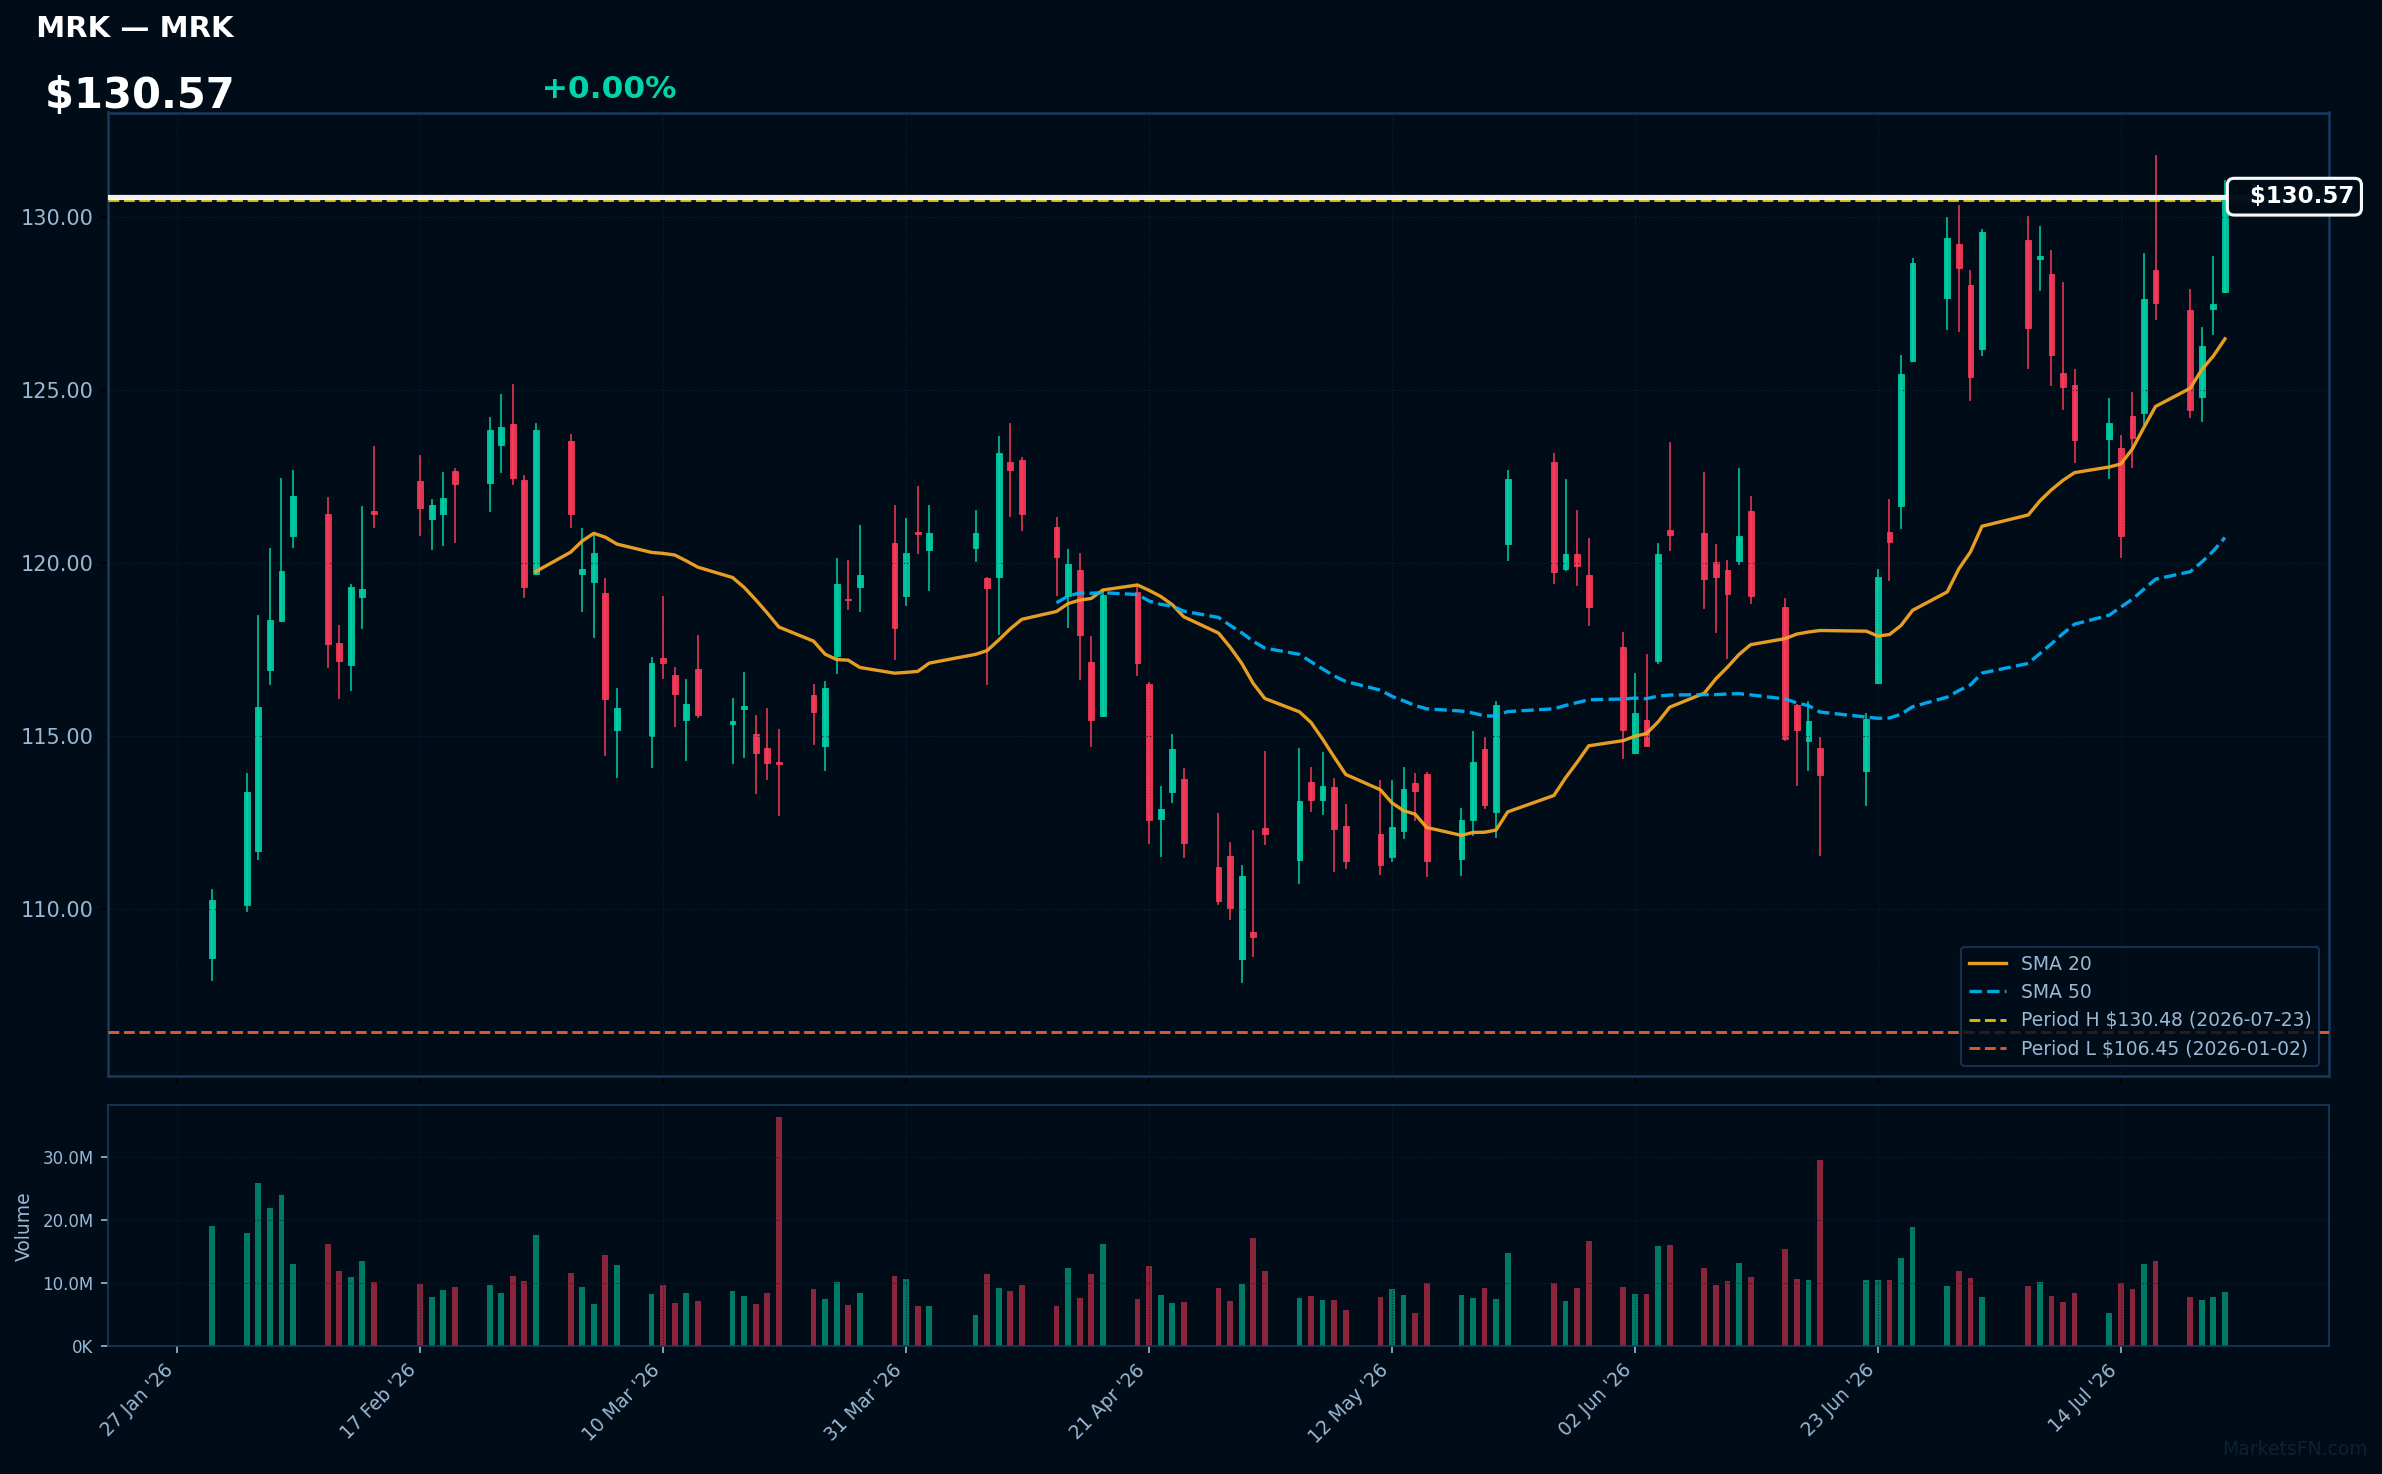
MRK | Merck & Co Inc | Healthcare | Price Last: $130.48 | % Realized: +22.57% | RSI: 61.3 | % above MA200: +18.1% | Trend: Above MA20, MA50, MA200
Merck & Co Inc is a pharmaceutical company that develops and markets human and animal health products, including vaccines and medicines for various diseases; investors should care about its pipeline and product sales growth.
MRK shows bullish MA alignment with price > MA20 > MA50 > MA200 and RSI(14) at 61.3, indicating sustained uptrend momentum; it's 0.0% below its 2026 YTD high, nearing a potential breakout.
Related headlines
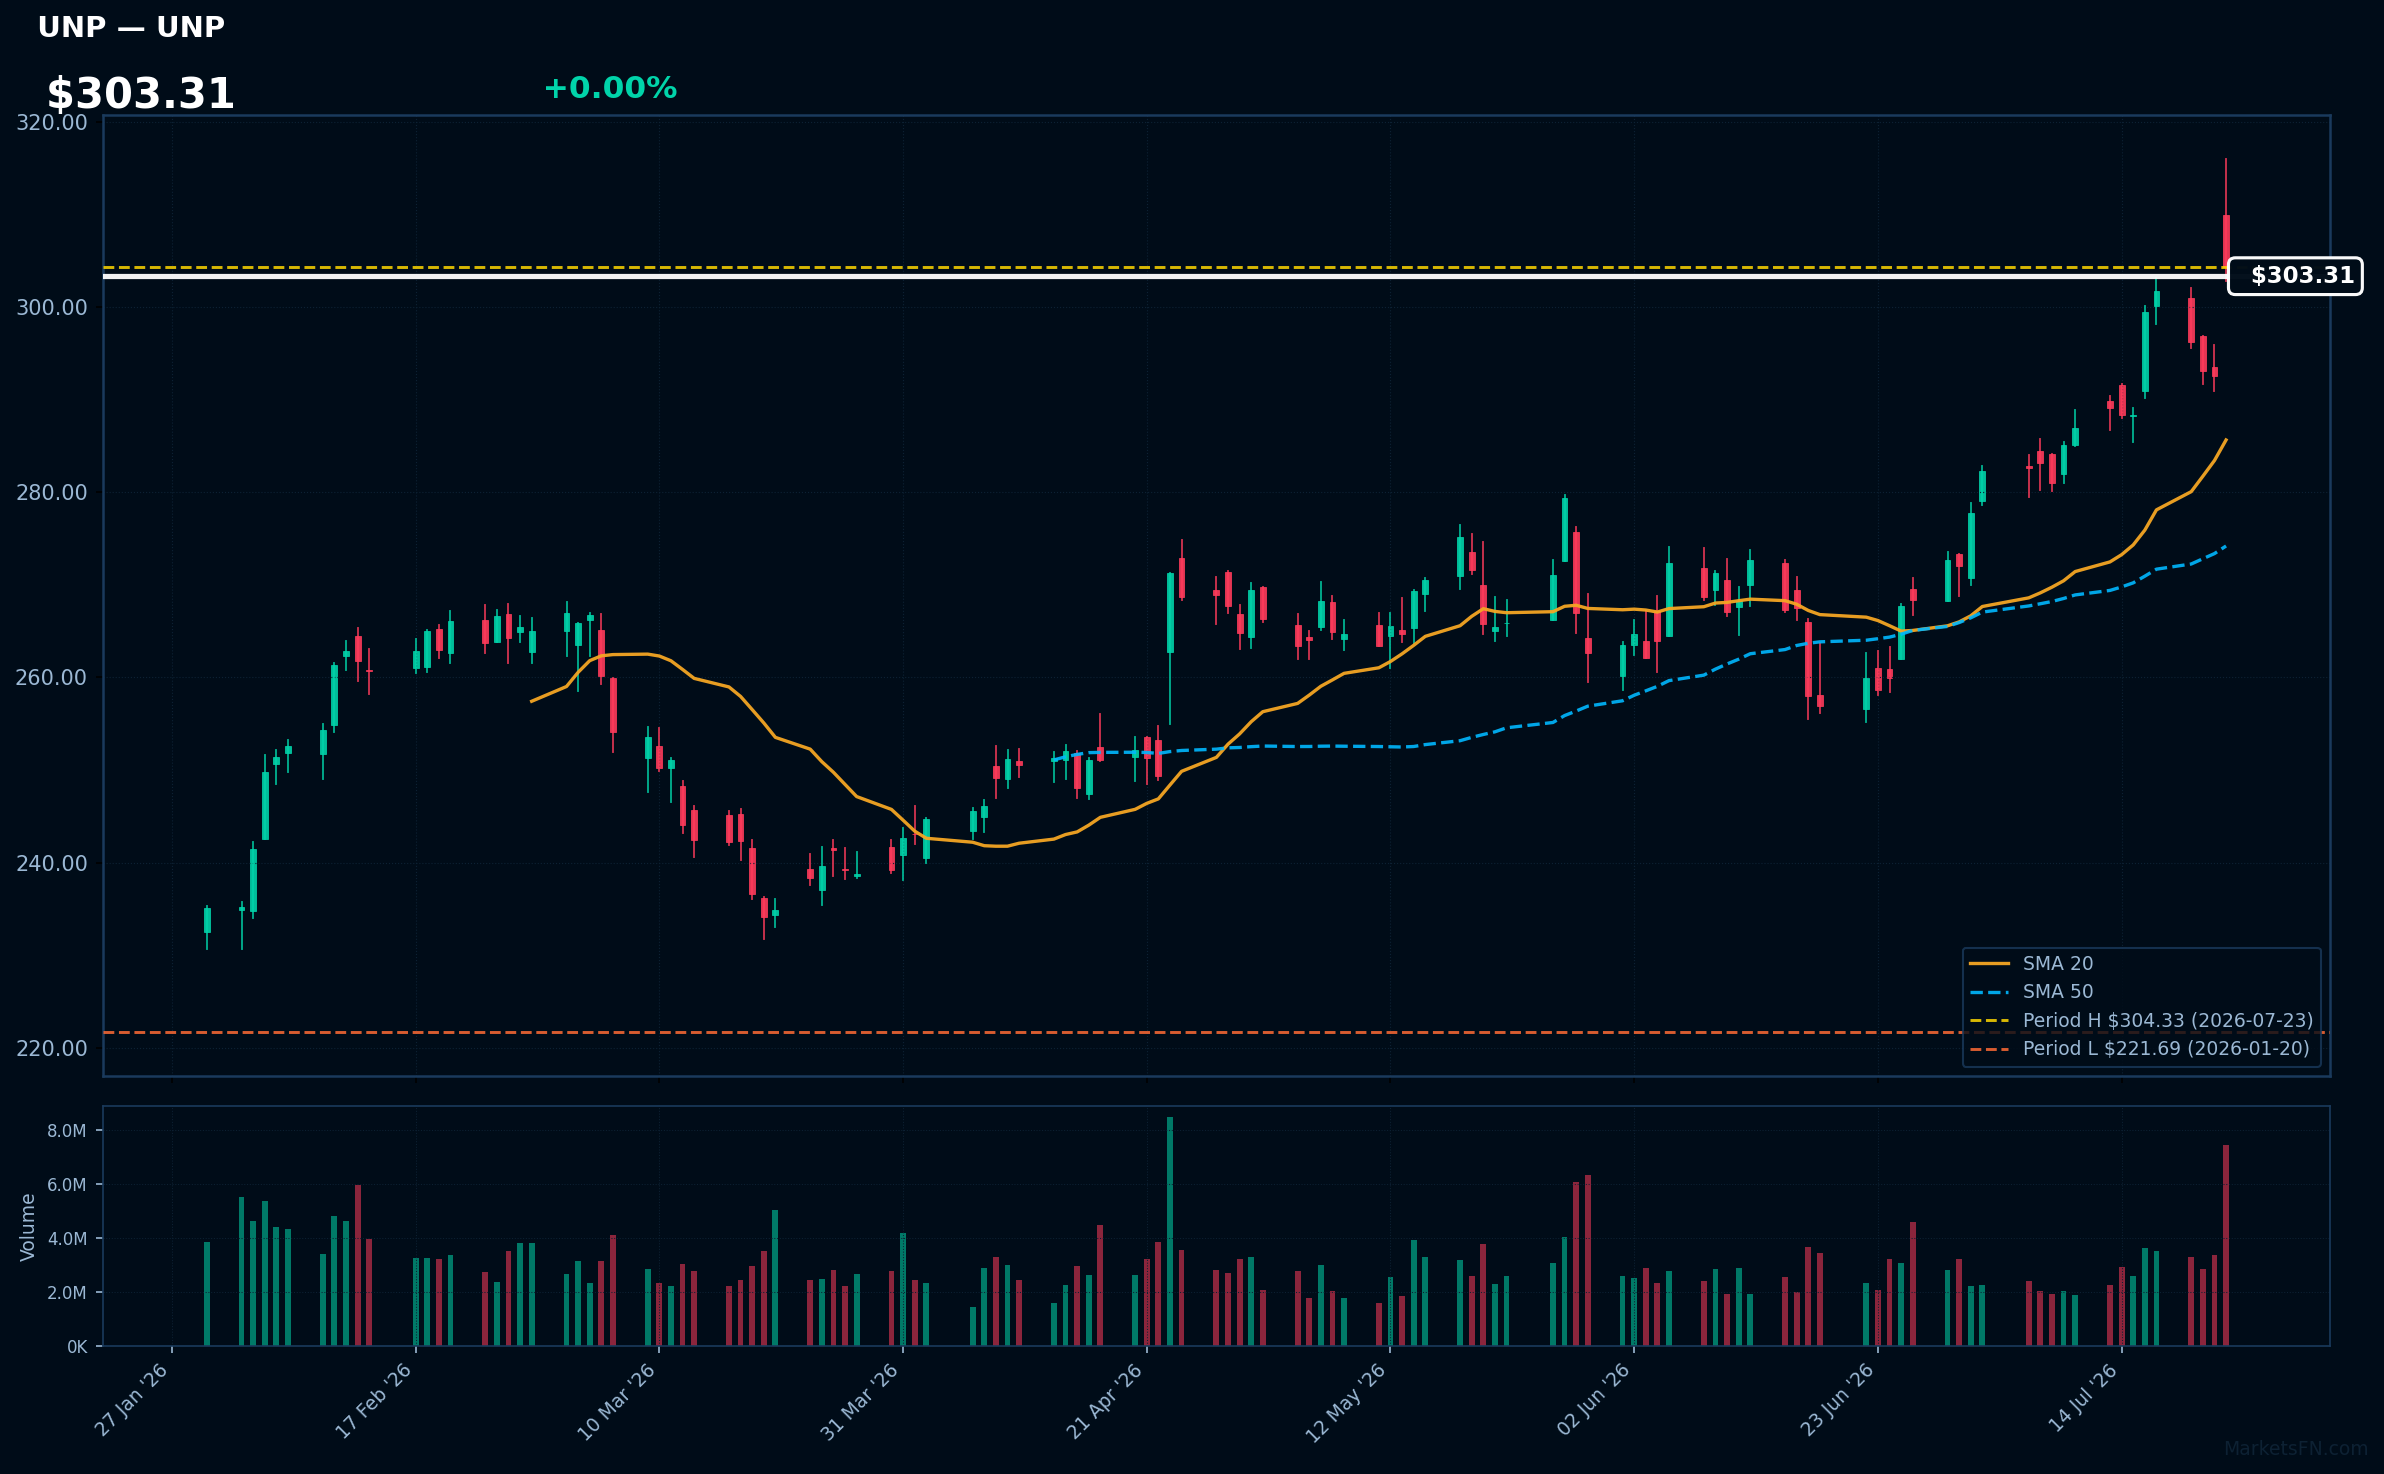
UNP | Union Pacific Corp | Industrials | Price Last: $304.33 | % Realized: +31.23% | RSI: 69.7 | % above MA200: +22.2% | Trend: Above MA20, MA50, MA200
Union Pacific Corp (UNP) operates North America's largest railroad network, transporting goods across 23 states. Investors should care because its rail network efficiency and capacity impact supply chain costs and economic growth, directly influencing revenue and profitability.
UNP's technicals indicate sustained uptrend with price at $303.31 above MA20, MA50, and MA200. RSI(14) is 69.7, nearing overbought territory. The stock is 0.0% below its 2026 YTD high, suggesting potential breakout momentum with 31.2% YTD return.
Related headlines
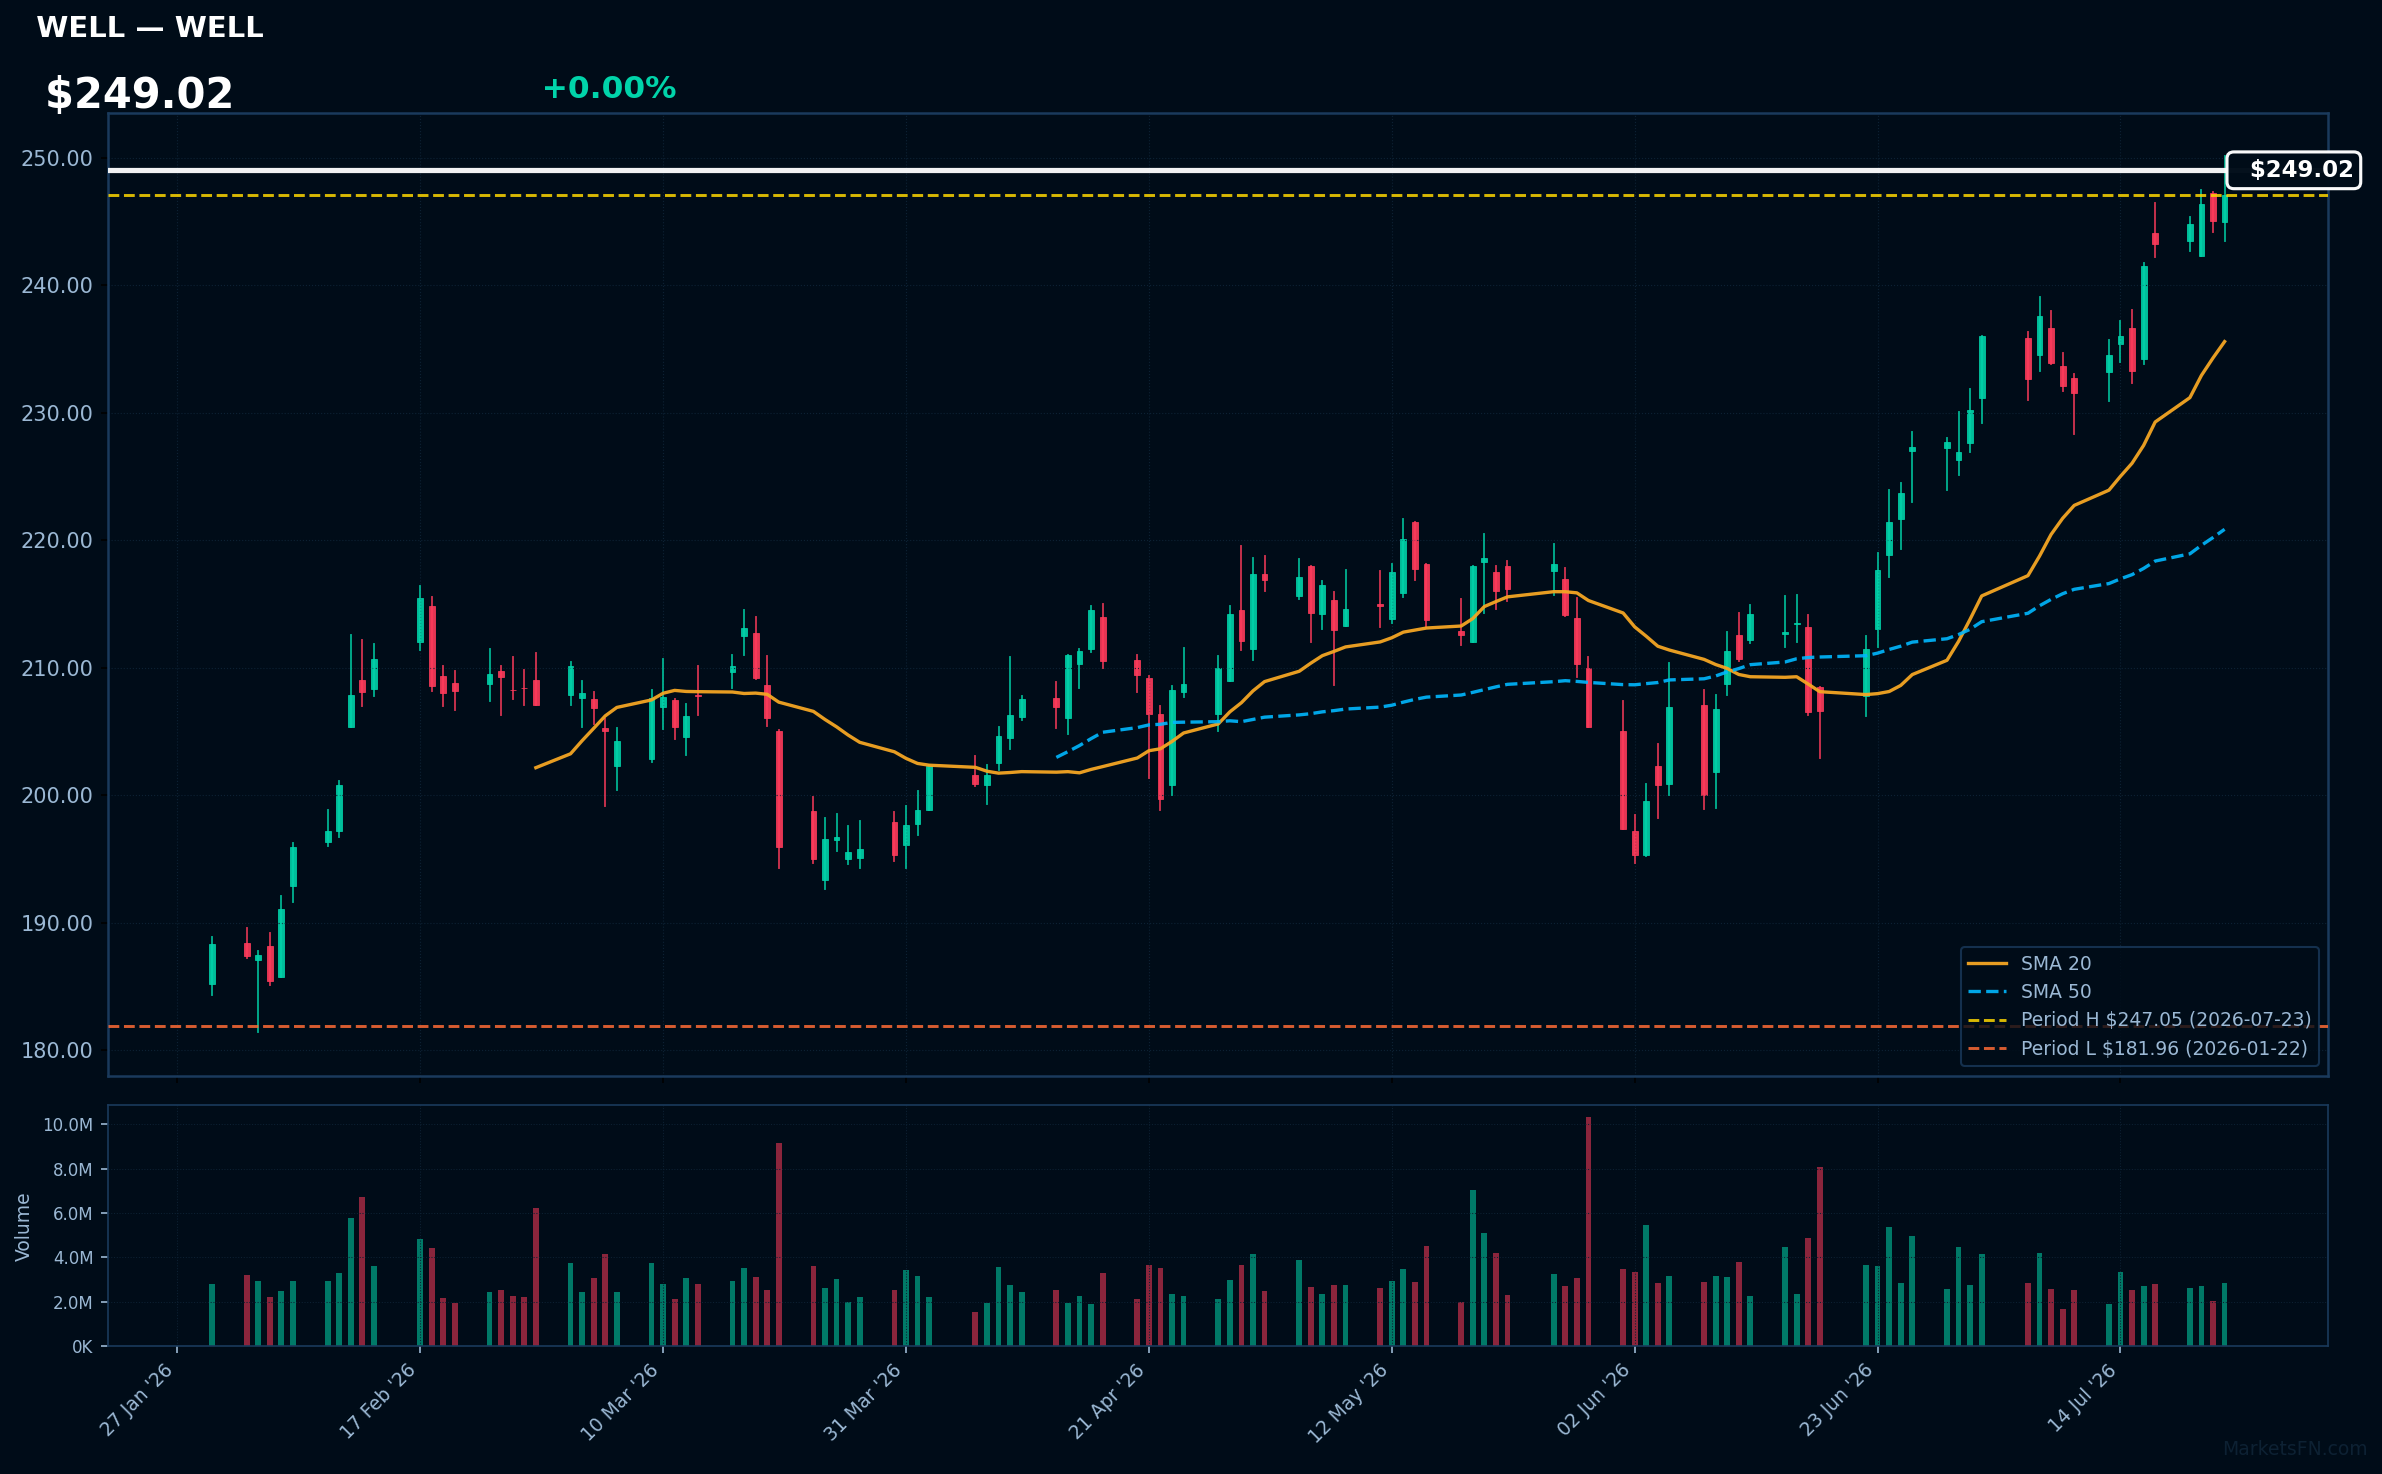
WELL | Welltower Inc | Real Estate | Price Last: $247.05 | % Realized: +32.15% | RSI: 72.1 | % above MA200: +22.1% | Trend: Above MA20, MA50, MA200
Welltower Inc (WELL) is a healthcare real estate investment trust. Investors should care because it provides a steady income stream through rental income from healthcare facilities. Its performance is tied to the demand for healthcare services and the overall real estate market.
WELL's RSI(14) is 72.1, indicating strong momentum as it is near overbought territory. The MA alignment (price > MA20 > MA50 > MA200) confirms a sustained uptrend. The stock is 0.0% below its 2026 YTD high, suggesting a potential breakout.
Related headlines
- Welltower CFO Timothy McHugh sets U.S. pay record at $167M
- Welltower Announces Date of Second Quarter 2026 Earnings Release, Conference Call and Webcast
- Welltower's Dividend Is Up 15%. Here's What Really Matters.
- Welltower Board of Directors Approves 15% Increase in Quarterly Dividend to $0.85 per Share
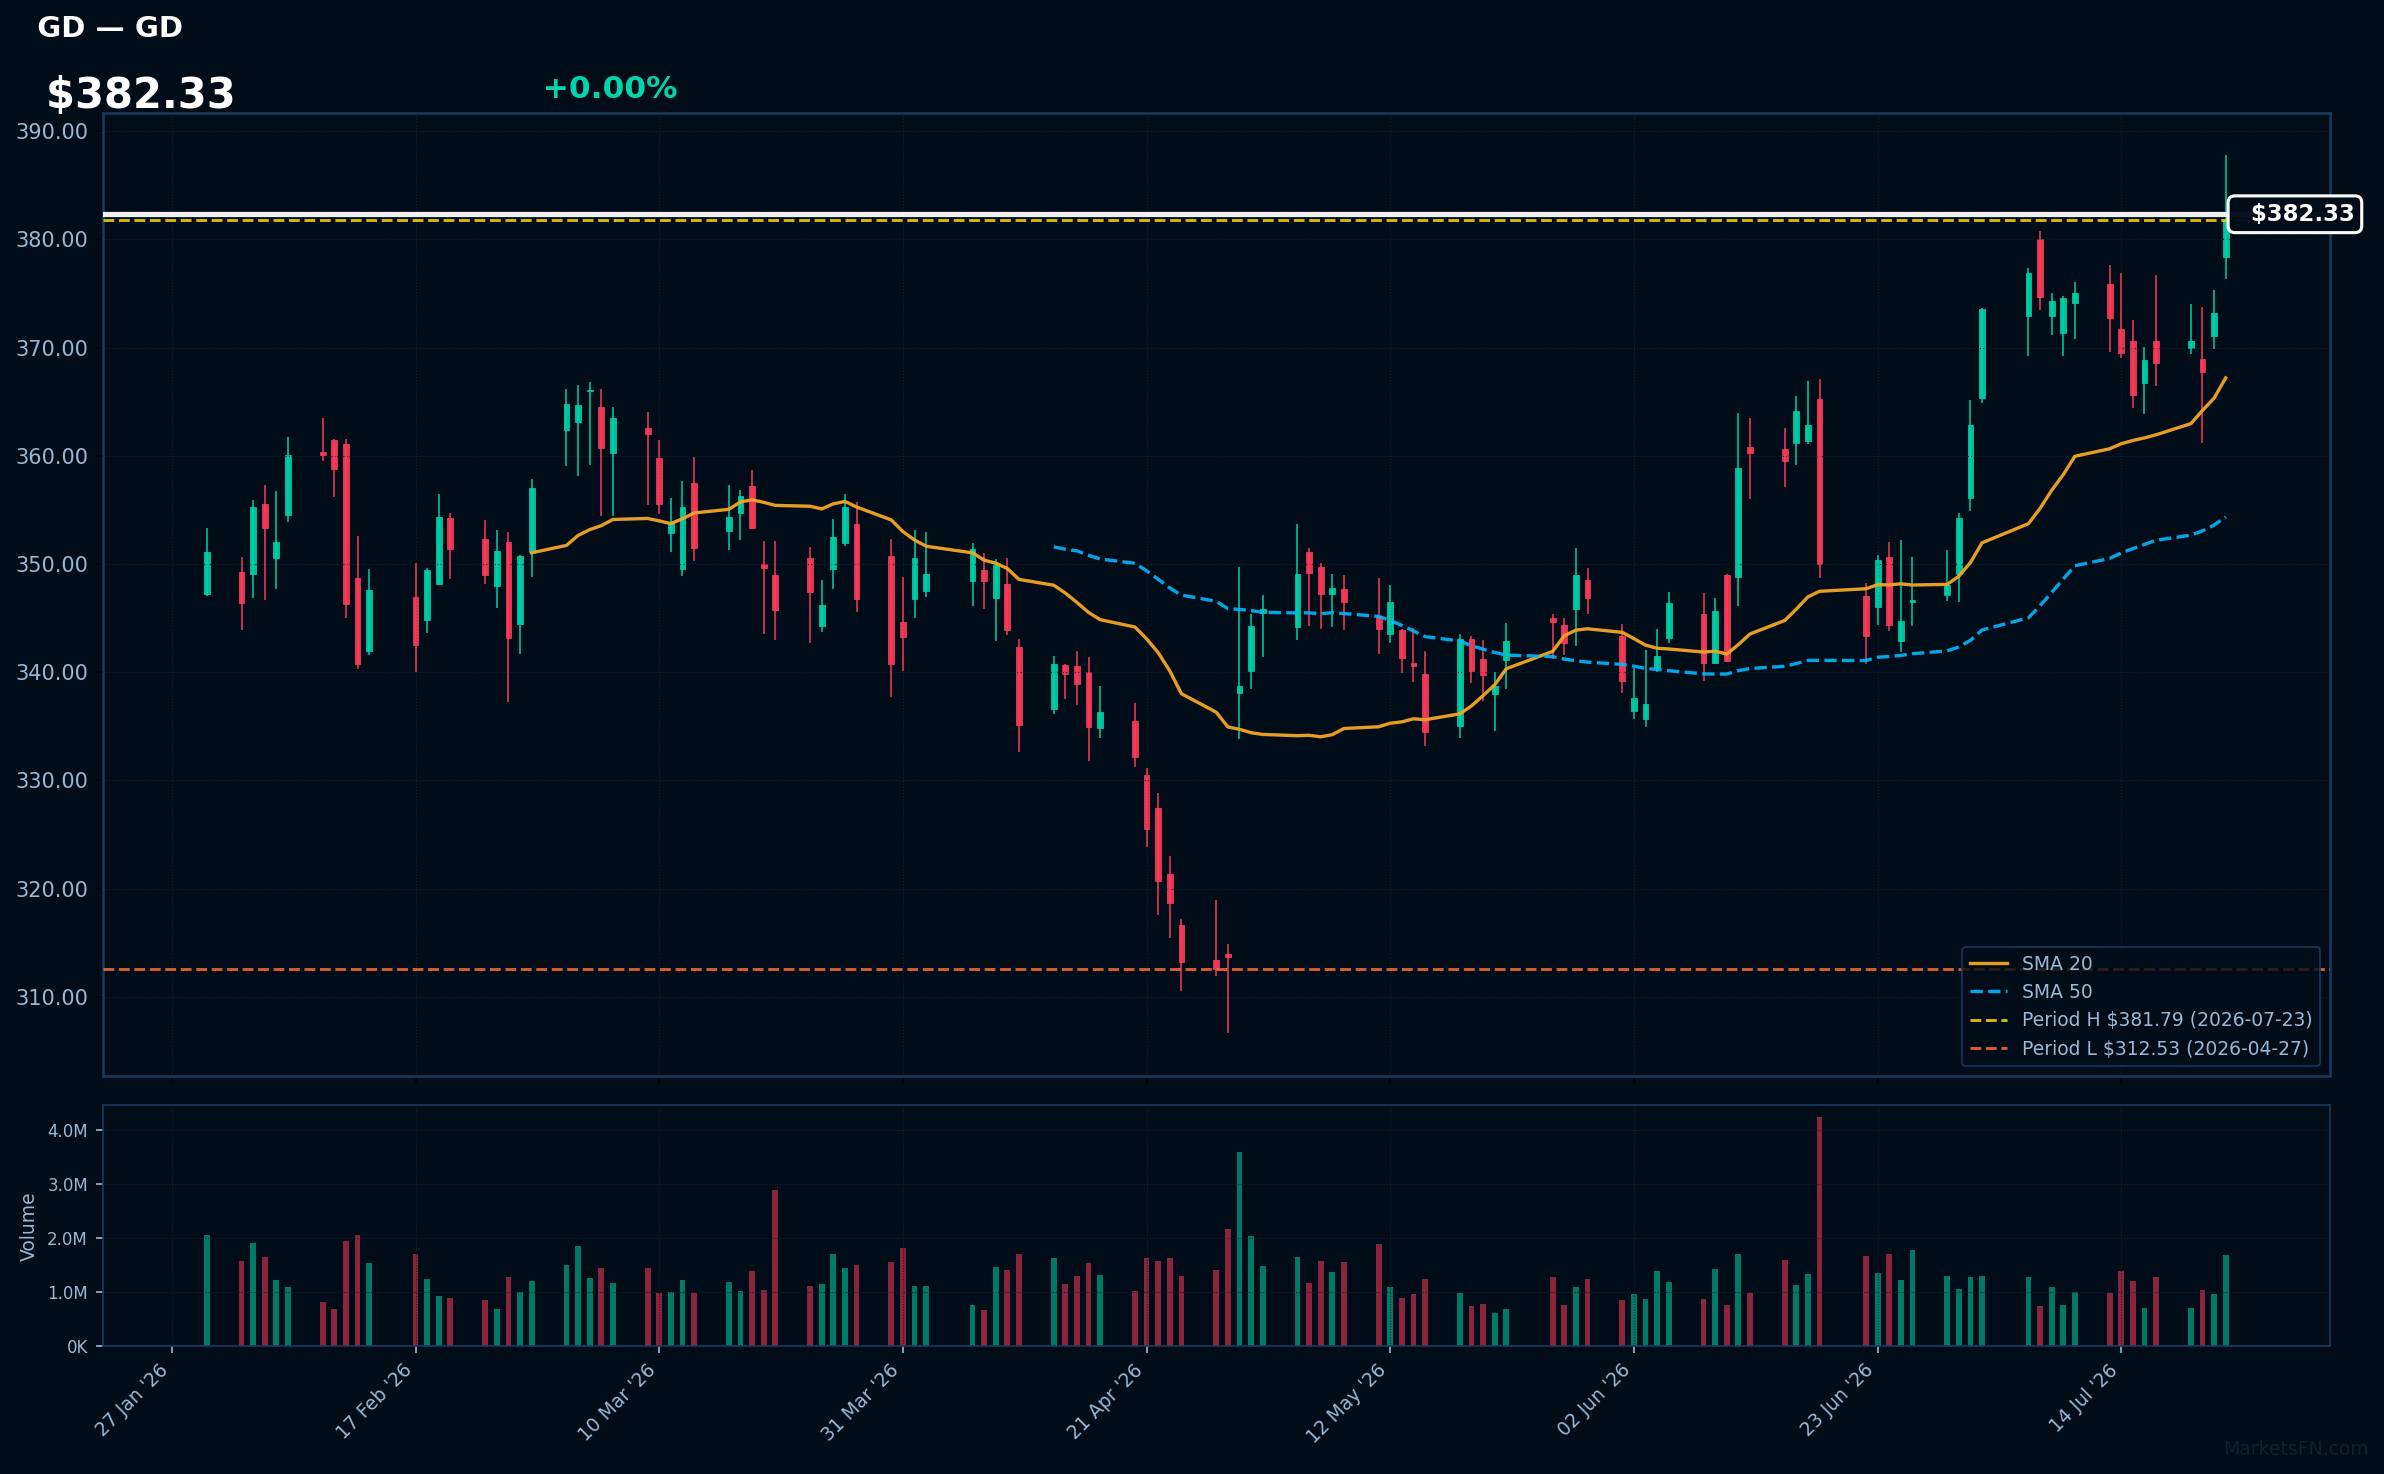
GD | General Dynamics Corp | Industrials | Price Last: $381.79 | % Realized: +11.18% | RSI: 67.4 | % above MA200: +9.6% | Trend: Above MA20, MA50, MA200
General Dynamics Corp is a defense company that produces aerospace, combat systems, information technology, and marine systems. Investors should care because its products and services are in demand by governments, driving revenue and profitability.
General Dynamics Corp is in a sustained uptrend with price > MA20 > MA50 > MA200. RSI(14) is 67.4, indicating strong momentum. The stock is 0.0% below its 2026 YTD high, suggesting a potential breakout.
Related headlines
- Trump Presses General Dynamics as $1.5 Trillion Defense Budget Advances
- Trump Urges Faster Submarine Production, Singles Out General Dynamics at Summit
- General Dynamics to Webcast 2026 Second-Quarter Financial Results Conference Call
- General Dynamics upgraded to Buy as submarine boom fuels growth outlook
📉 Nearest to 2026 Low
Sectors represented: Consumer Cyclical (2), Consumer Defensive (2), Technology (1)
| Ticker | Company | Sector | Price Last | % Realized | 2026 YTD Low Date | RSI | % above MA200 | Trend |
|---|---|---|---|---|---|---|---|---|
| TSLA | Tesla Inc | Consumer Cyclical | $319.69 | -27.02% | 2026-07-23 | 29.9 | -22.9% | Below MA20, MA50, MA200 |
| WMT | Walmart Inc | Consumer Defensive | $108.40 | -3.87% | 2026-07-23 | 34.5 | -7.9% | Below MA20, MA50, MA200 |
| ORCL | Oracle Corp | Technology | $120.04 | -38.66% | 2026-07-23 | 31.1 | -36.0% | Below MA20, MA50, MA200 |
| MCD | McDonald's Corp | Consumer Cyclical | $262.80 | -13.34% | 2026-07-23 | 40.5 | -12.7% | Below MA20, MA50, MA200 |
| PEP | PepsiCo Inc | Consumer Defensive | $134.95 | -5.12% | 2026-07-23 | 40.1 | -9.9% | Below MA20, MA50, MA200 |
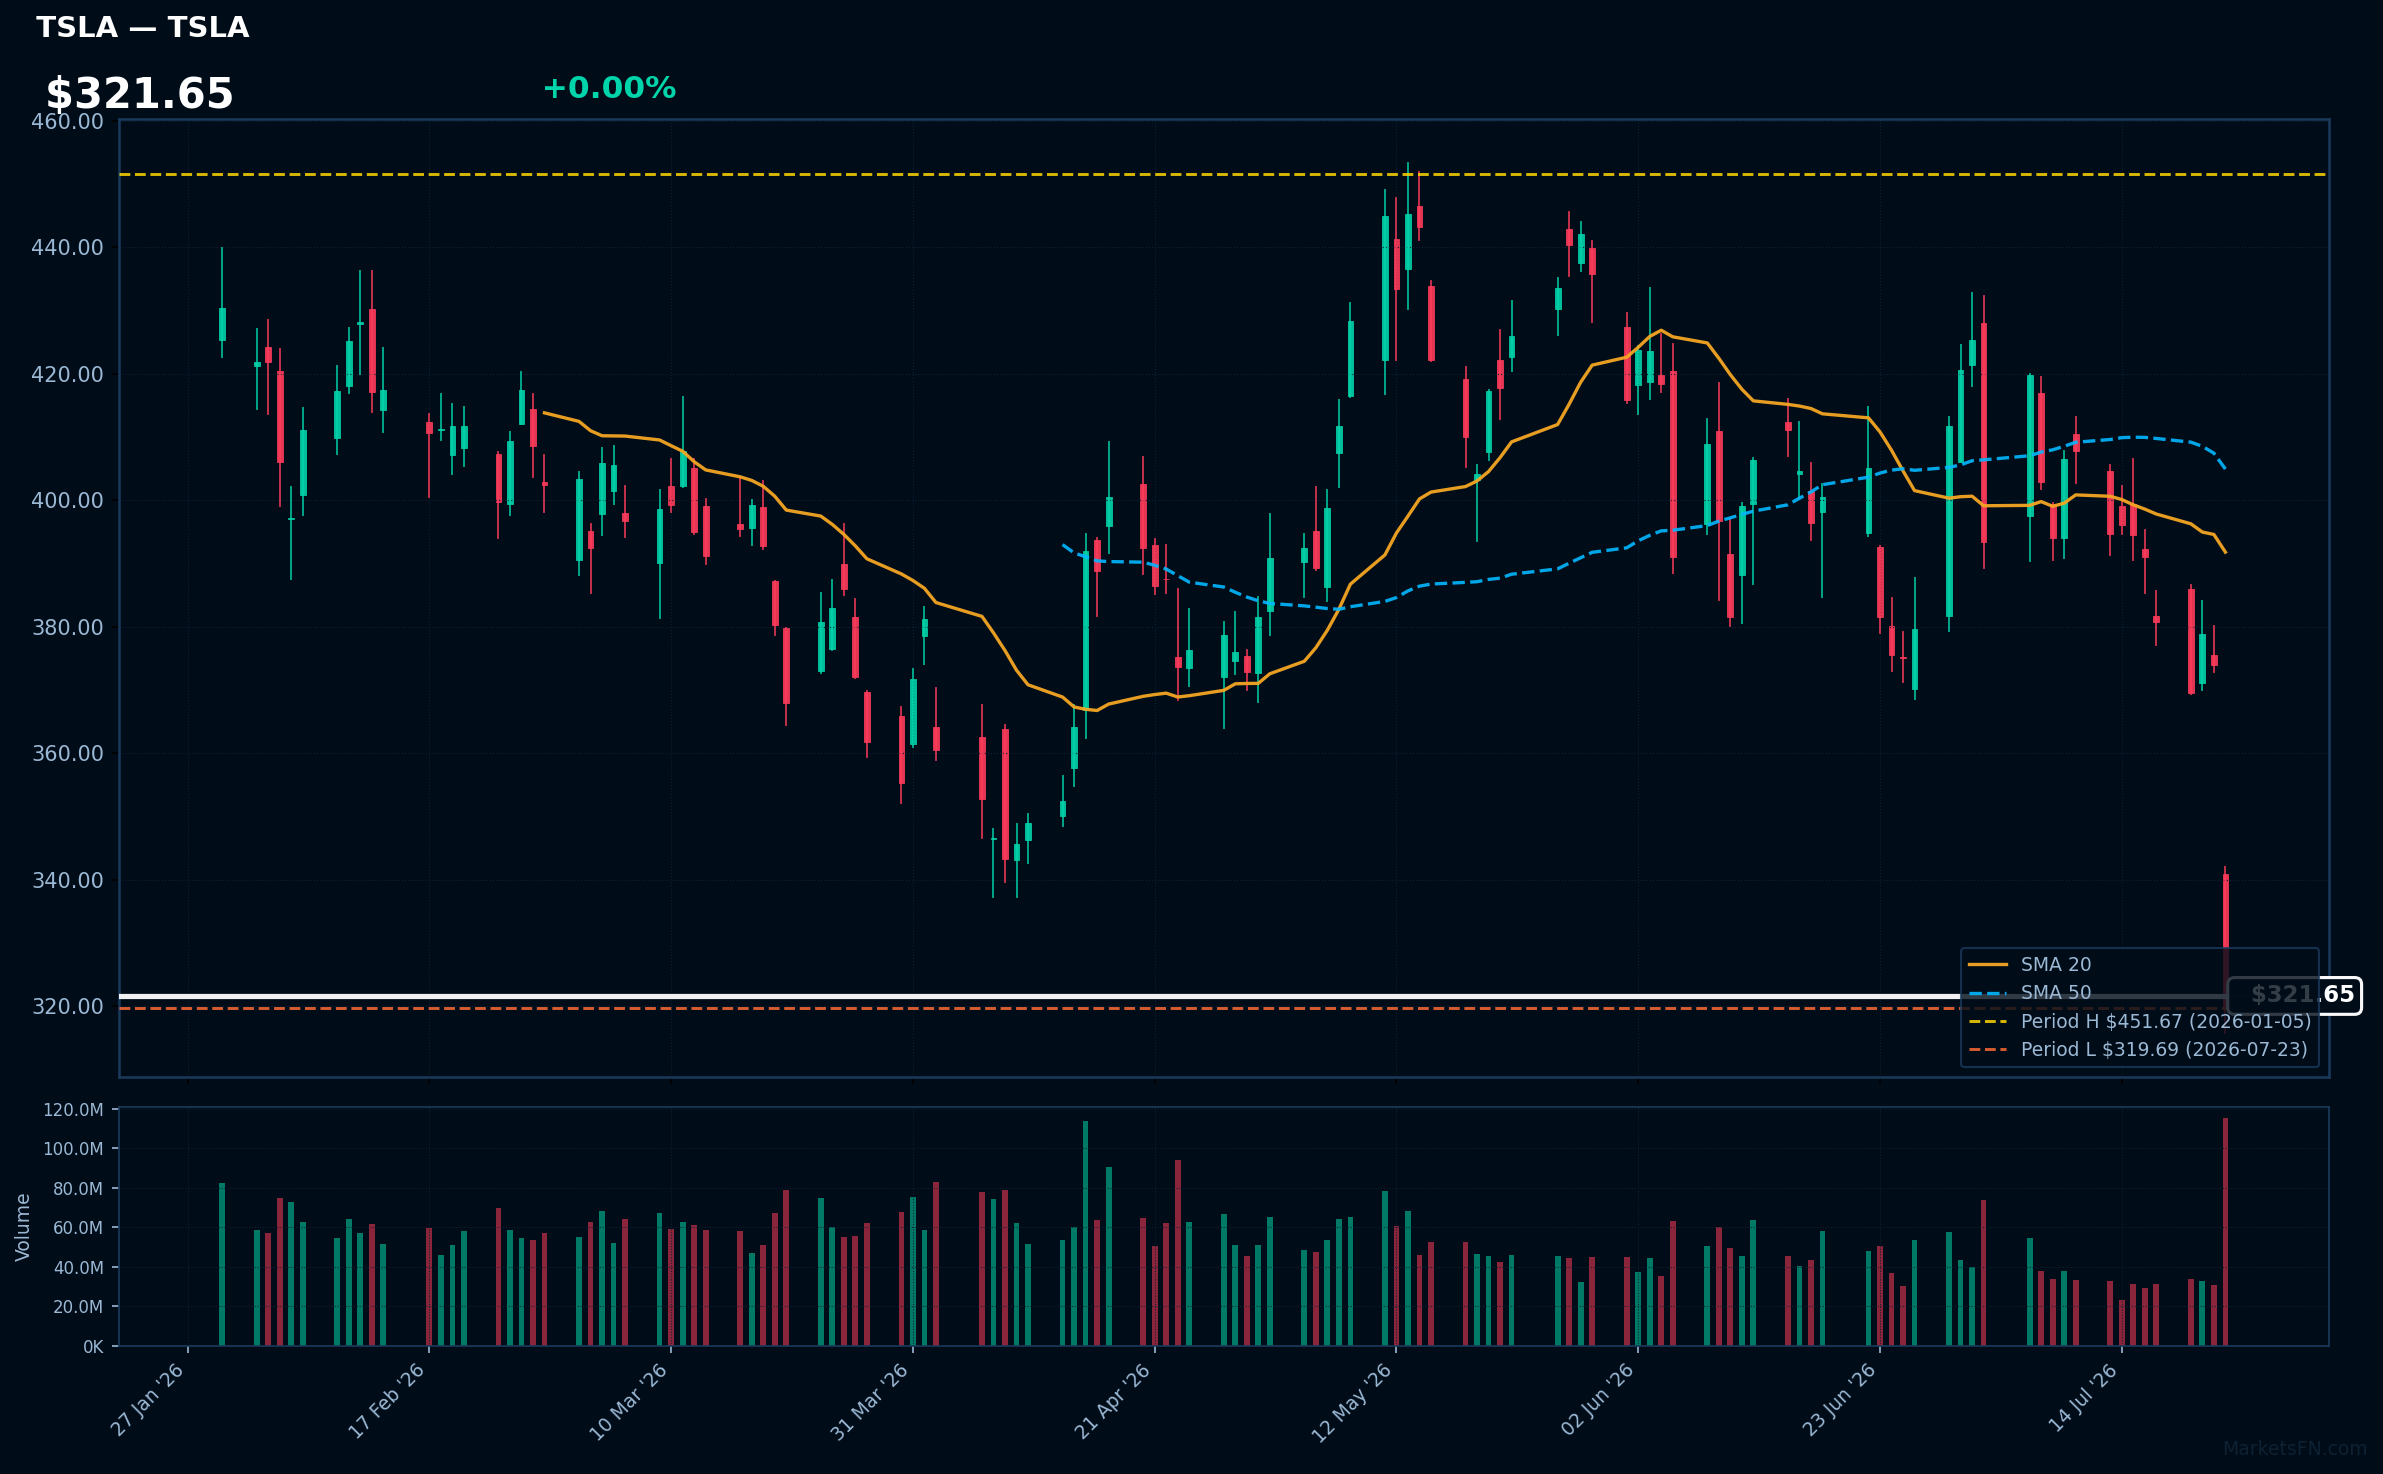
TSLA | Tesla Inc | Consumer Cyclical | Price Last: $319.69 | % Realized: -27.02% | RSI: 29.9 | % above MA200: -22.9% | Trend: Below MA20, MA50, MA200
Tesla Inc is an electric vehicle manufacturer and clean energy company. Investors should care because it's a leader in the EV market and a pioneer in autonomous driving technology, influencing the future of transportation and energy.
Tesla's technical situation is bearish, with RSI(14) at 29.9 indicating oversold conditions, and a sustained downtrend as price ($321.65) remains below MA20, MA50, and MA200, testing major support at its 2026 YTD low.
Related headlines
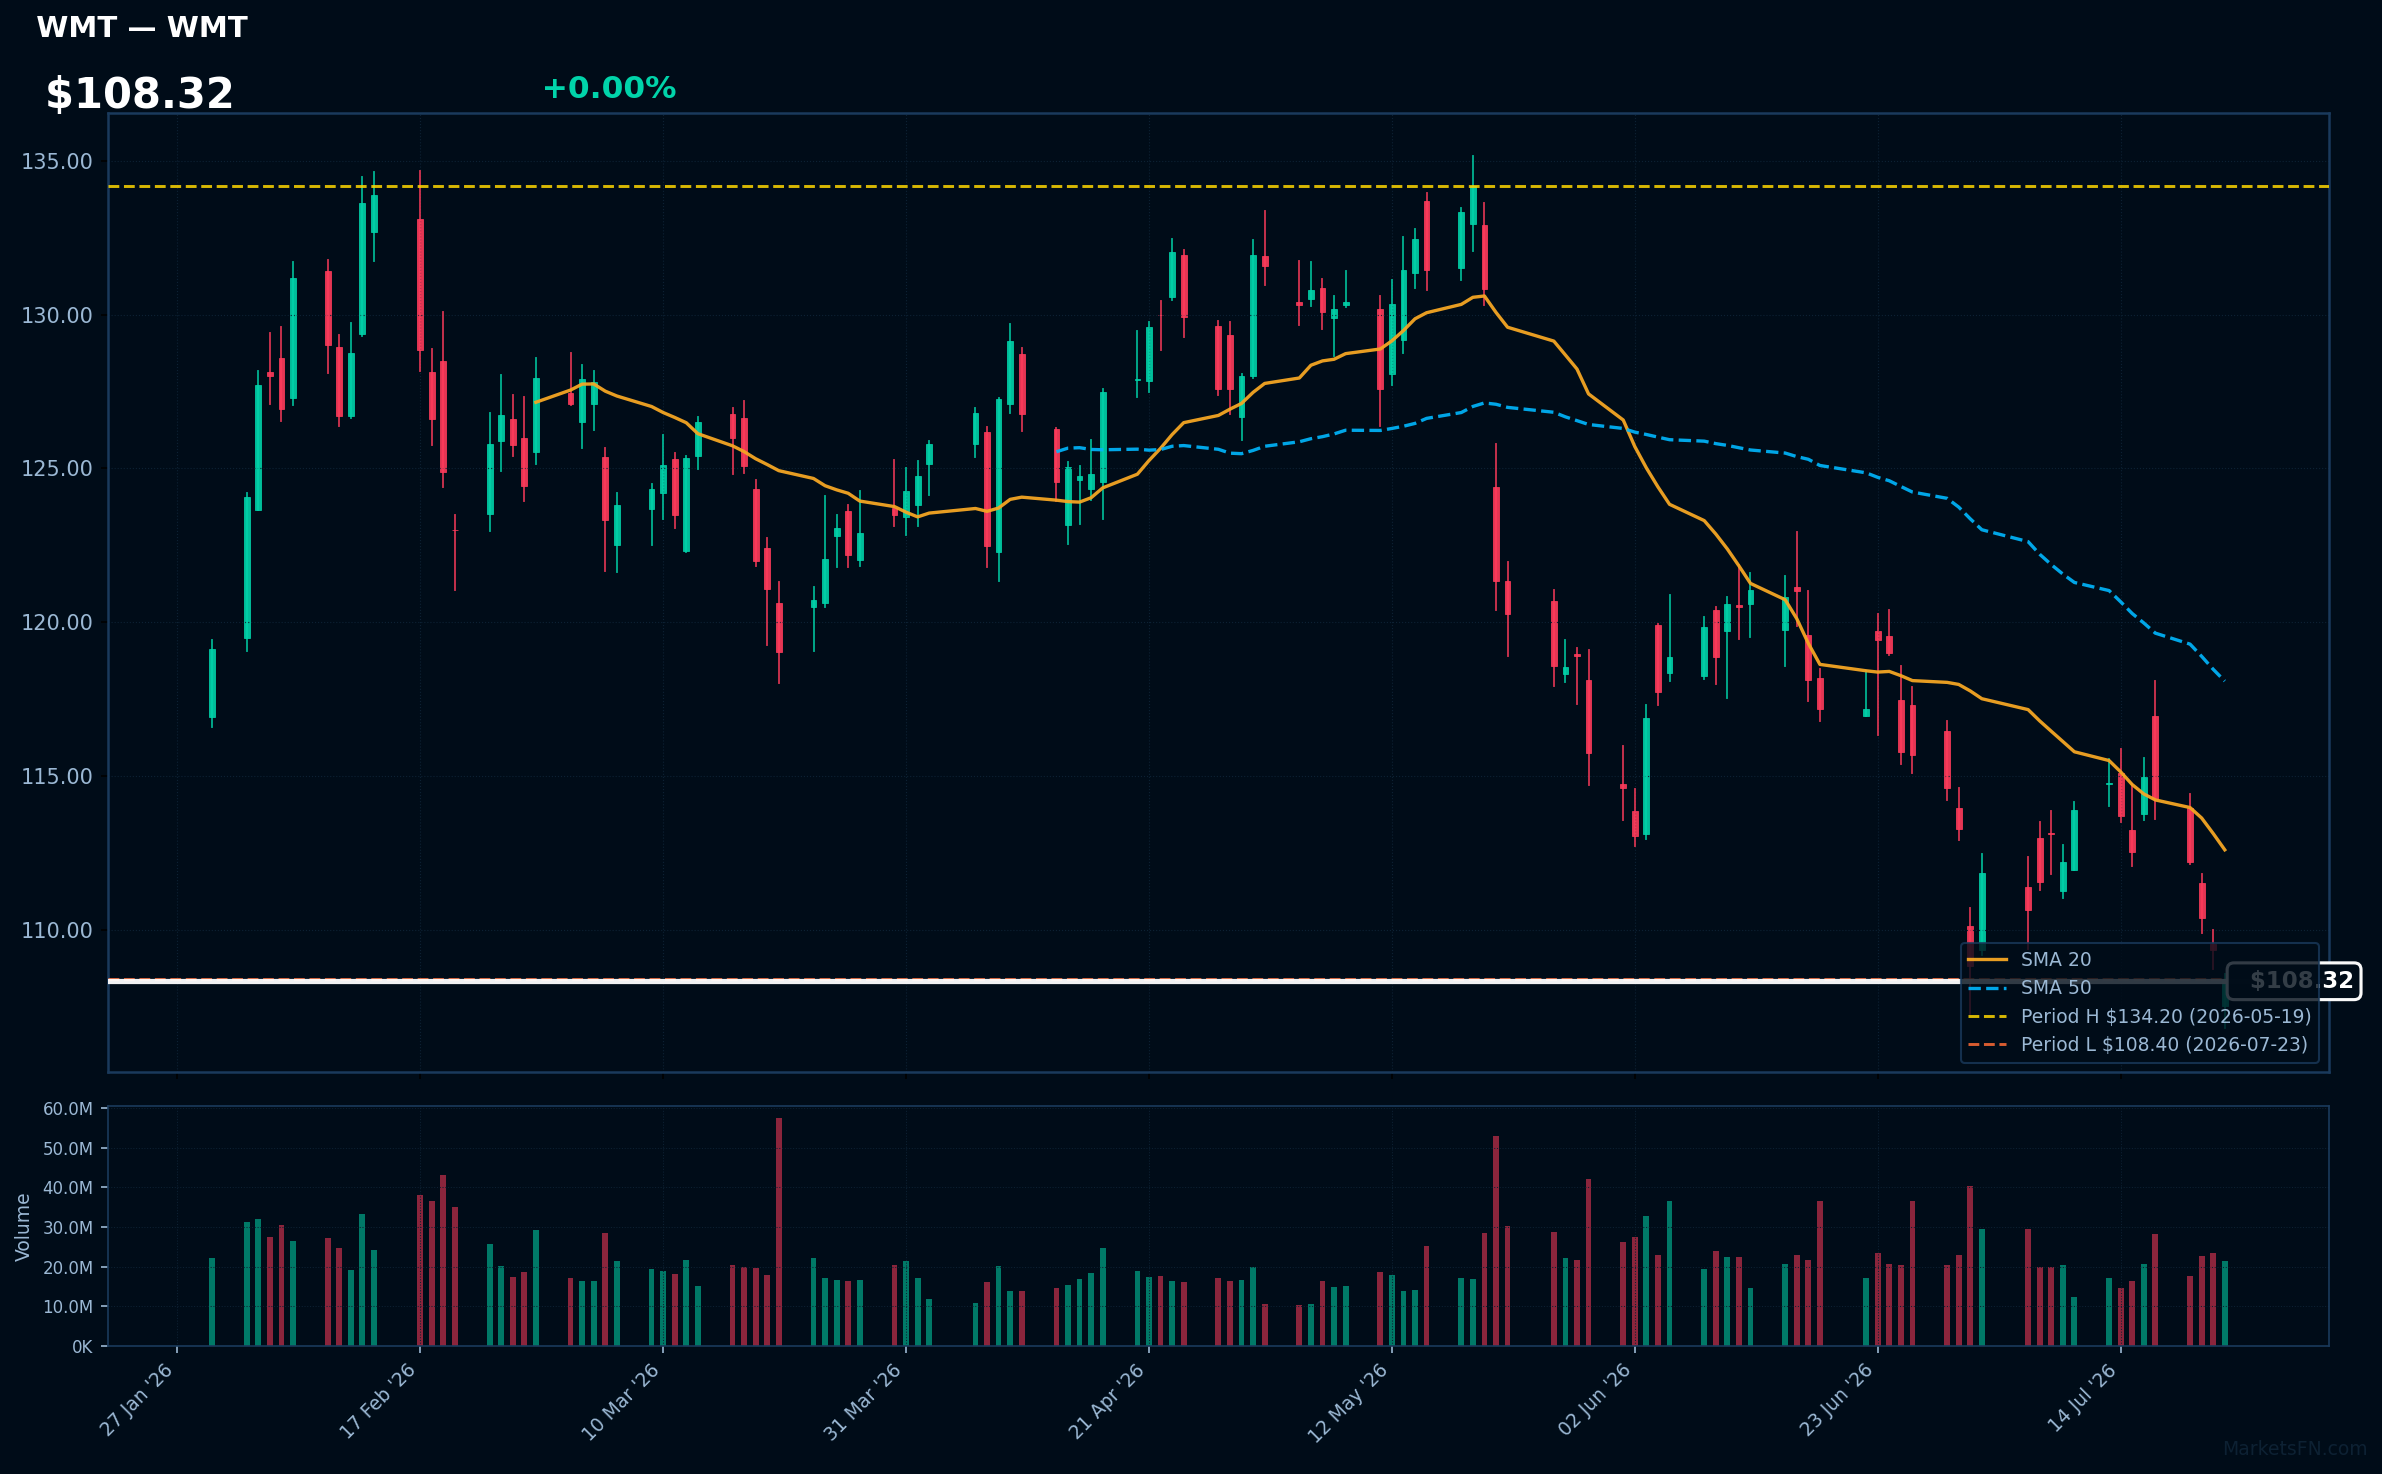
WMT | Walmart Inc | Consumer Defensive | Price Last: $108.40 | % Realized: -3.87% | RSI: 34.5 | % above MA200: -7.9% | Trend: Below MA20, MA50, MA200
Walmart Inc operates retail stores and e-commerce platforms, offering a wide range of products including groceries, general merchandise, and health services. Investors care about its performance as it reflects consumer spending habits and competitive dynamics in the retail industry.
Walmart is testing major support at its 2026 YTD low with an RSI(14) of 34.5, indicating oversold conditions. The bearish MA alignment (price < MA20 < MA50 < MA200) suggests a sustained downtrend, potentially warning of further downside.
Related headlines
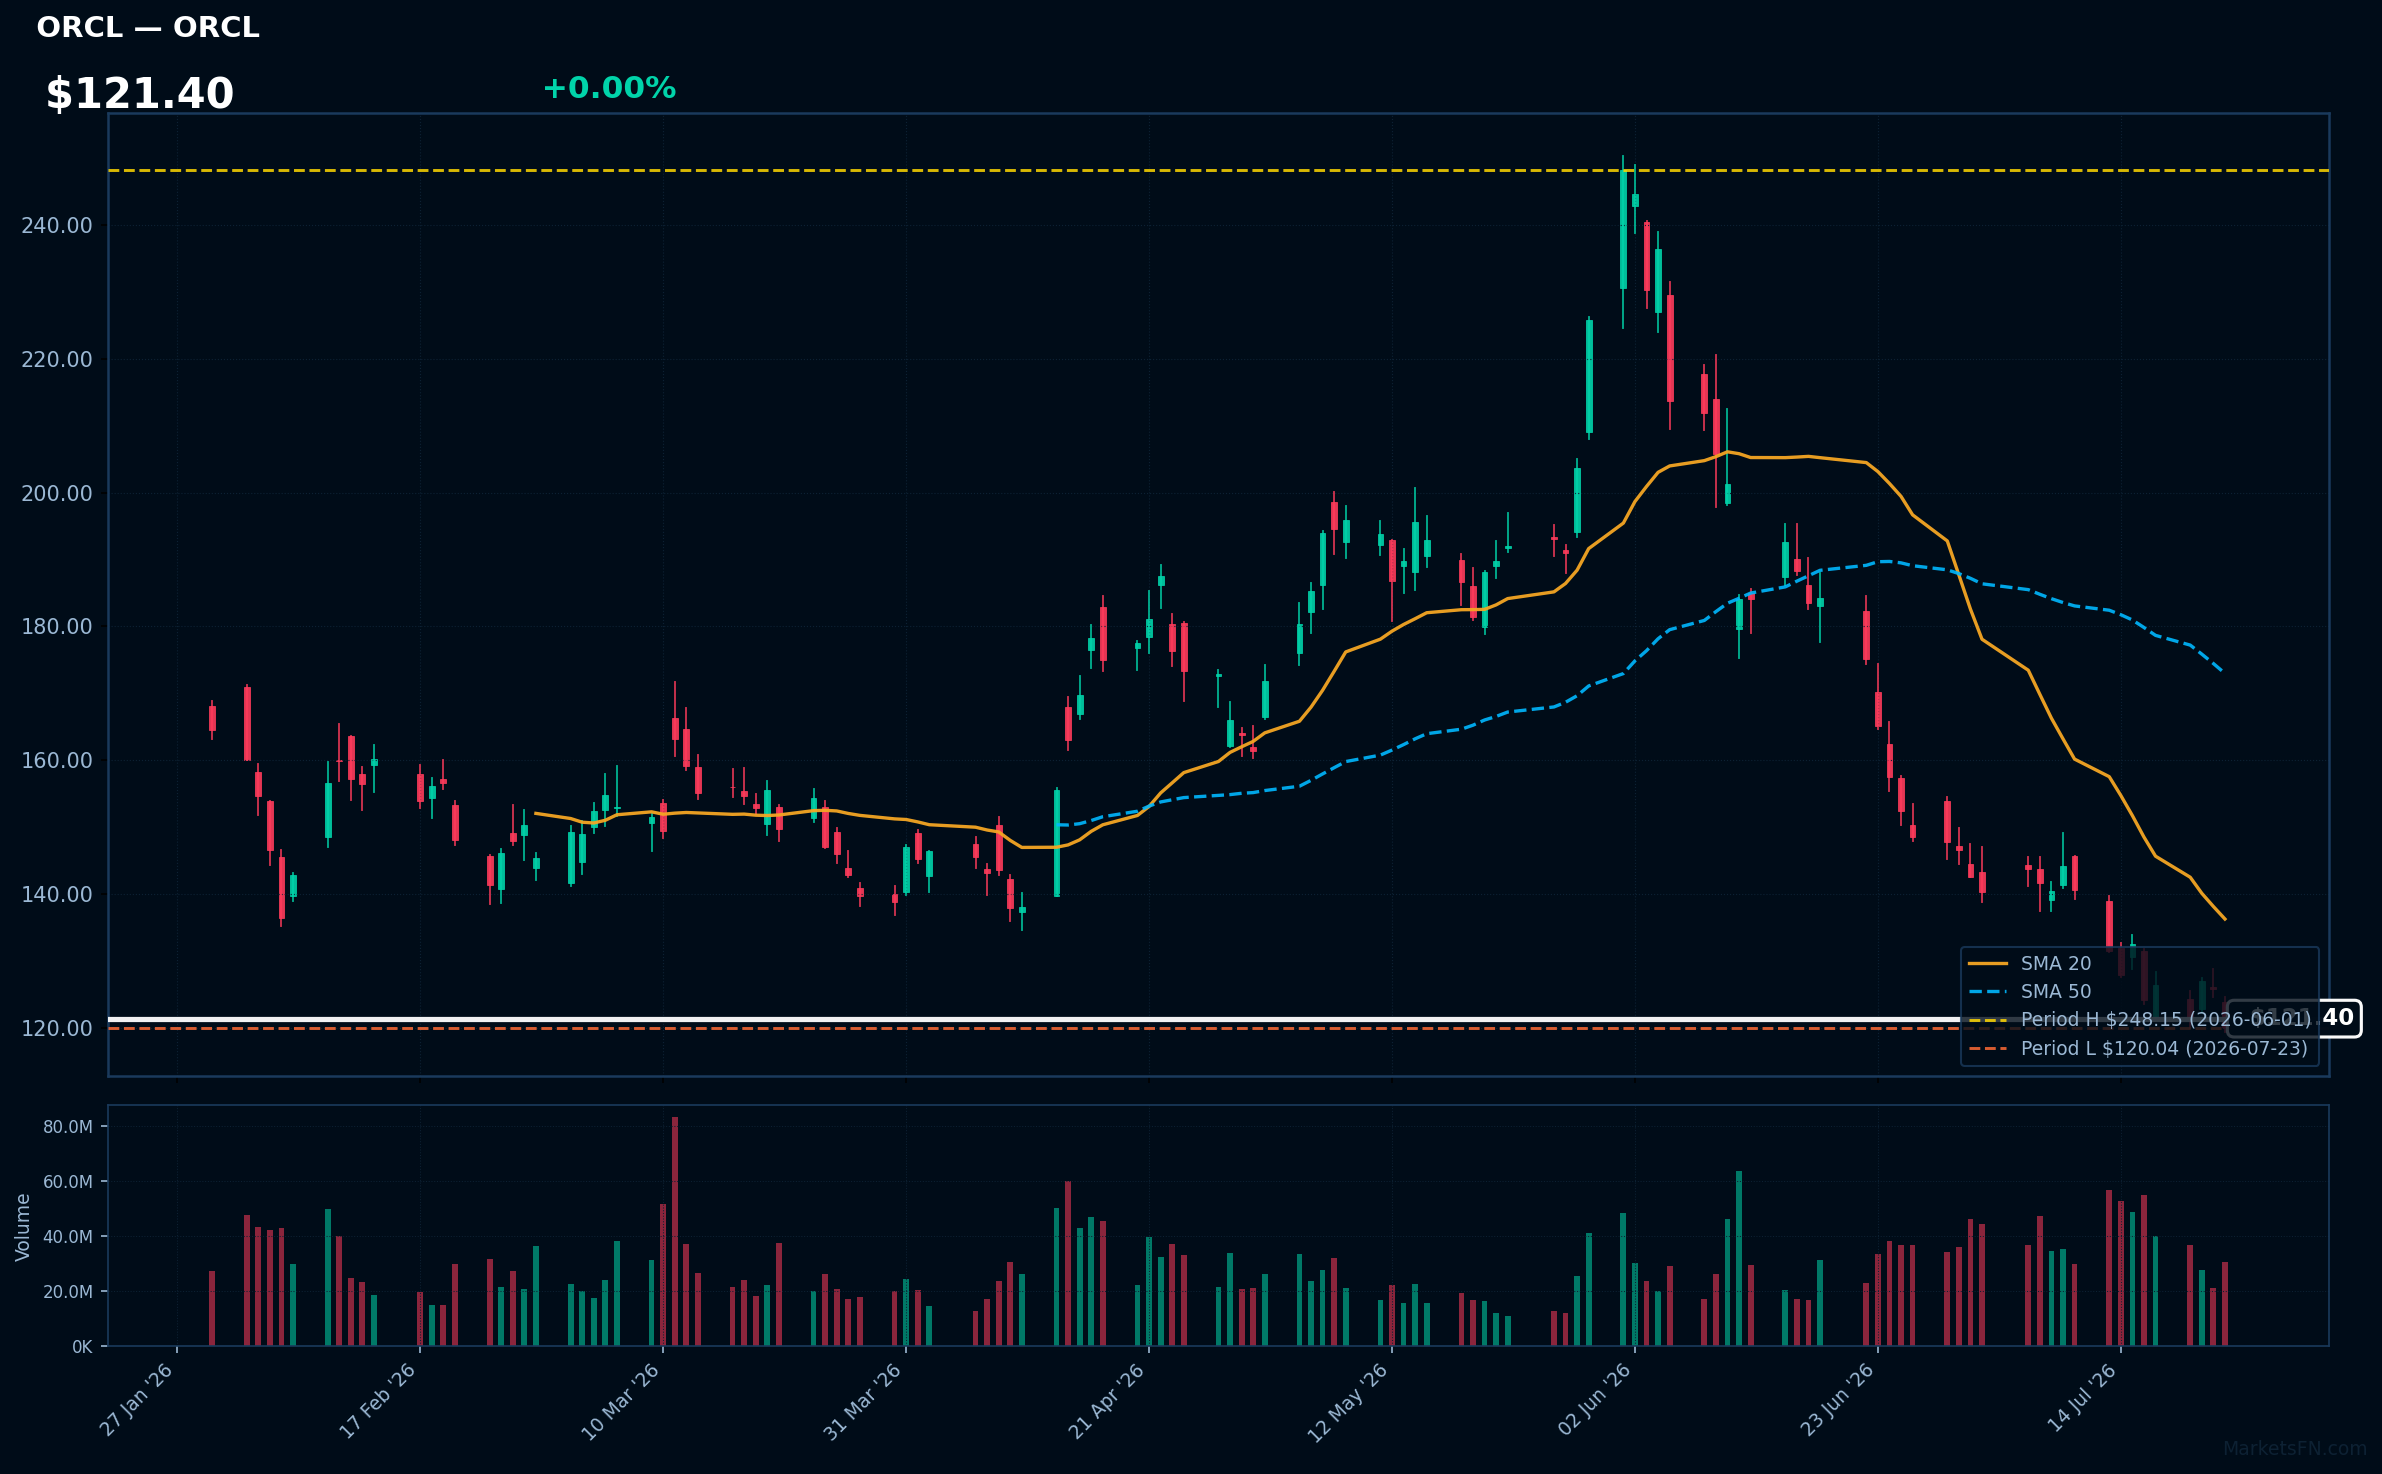
ORCL | Oracle Corp | Technology | Price Last: $120.04 | % Realized: -38.66% | RSI: 31.1 | % above MA200: -36.0% | Trend: Below MA20, MA50, MA200
Oracle Corp is a cloud computing and enterprise software company, providing database management, ERP, and CX solutions. Investors care about its transition to cloud services and competitiveness in the enterprise software market.
Oracle Corp's technical situation is bearish, with RSI(14) at 31.1, indicating oversold conditions, and a sustained downtrend as price ($121.40) remains below MA20, MA50, and MA200, testing major support at its 2026 YTD low.
Related headlines
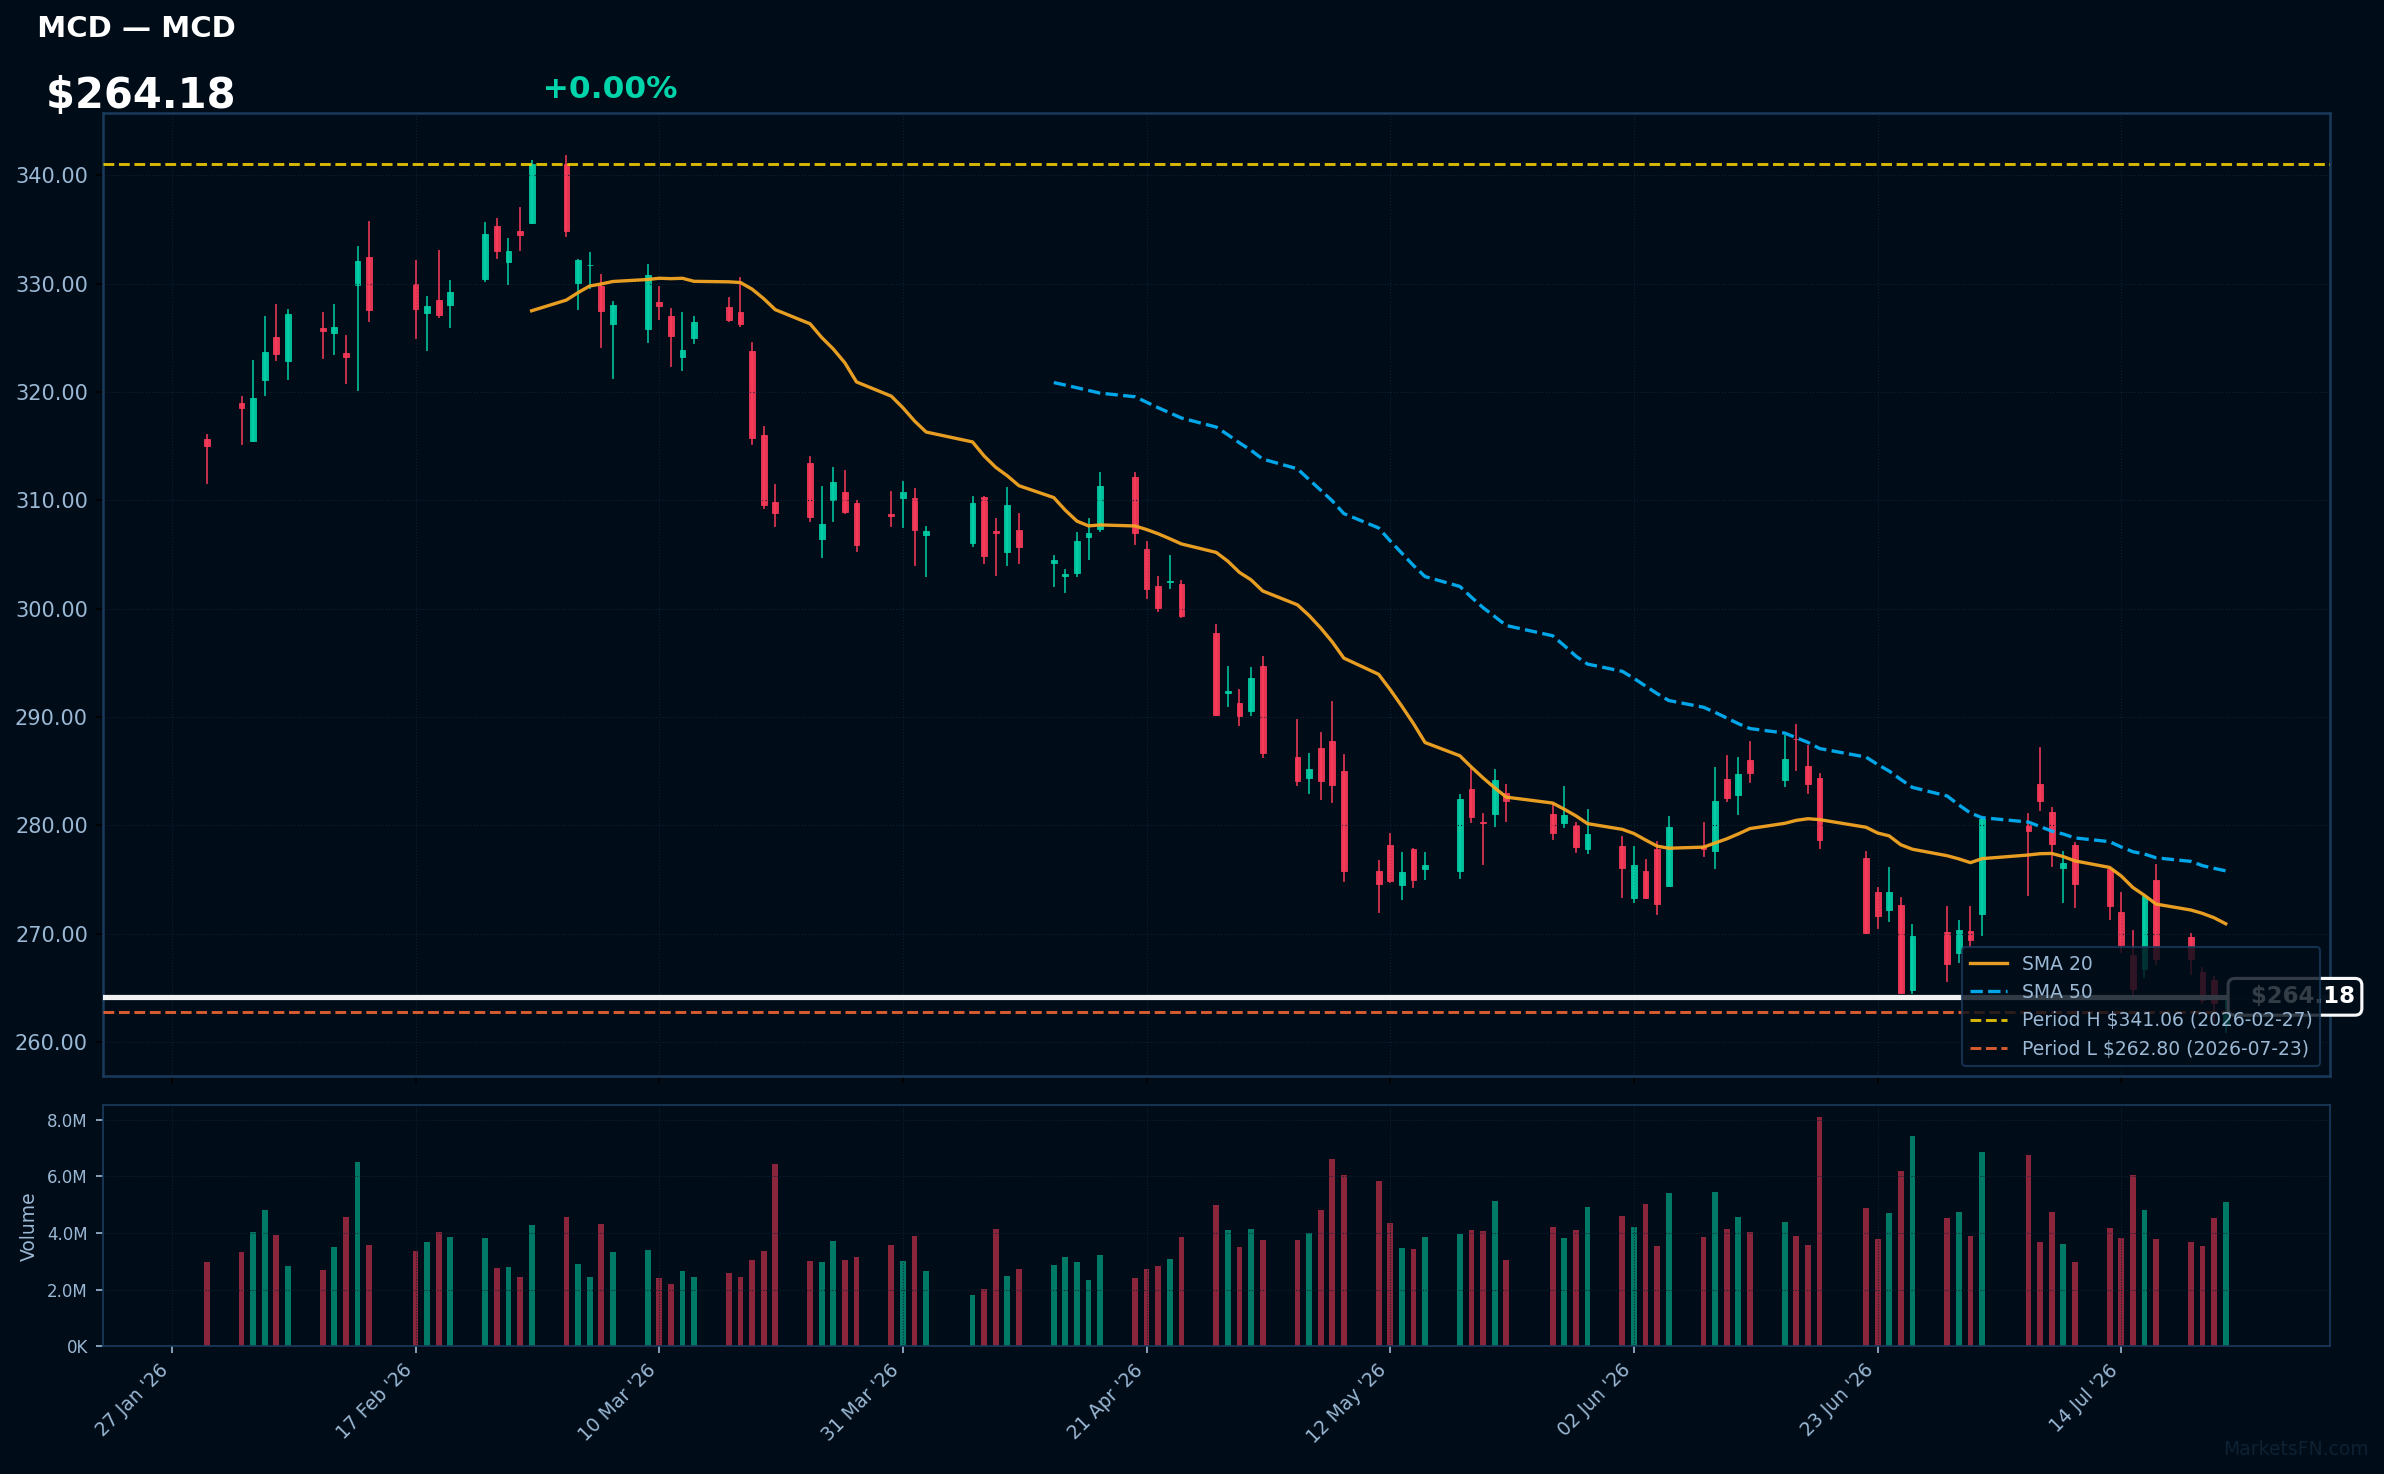
MCD | McDonald's Corp | Consumer Cyclical | Price Last: $262.80 | % Realized: -13.34% | RSI: 40.5 | % above MA200: -12.7% | Trend: Below MA20, MA50, MA200
McDonald's Corp operates a global fast-food chain, serving burgers, fries, and beverages. Investors care about its brand strength, operational efficiency, and market penetration, as these factors drive revenue growth and profitability.
McDonald's Corp is in a sustained downtrend with price ($264.18) below MA20, MA50, and MA200. The RSI(14) is 40.5, nearing oversold territory, and the stock is testing its 2026 YTD low, a potential warning sign.
Related headlines
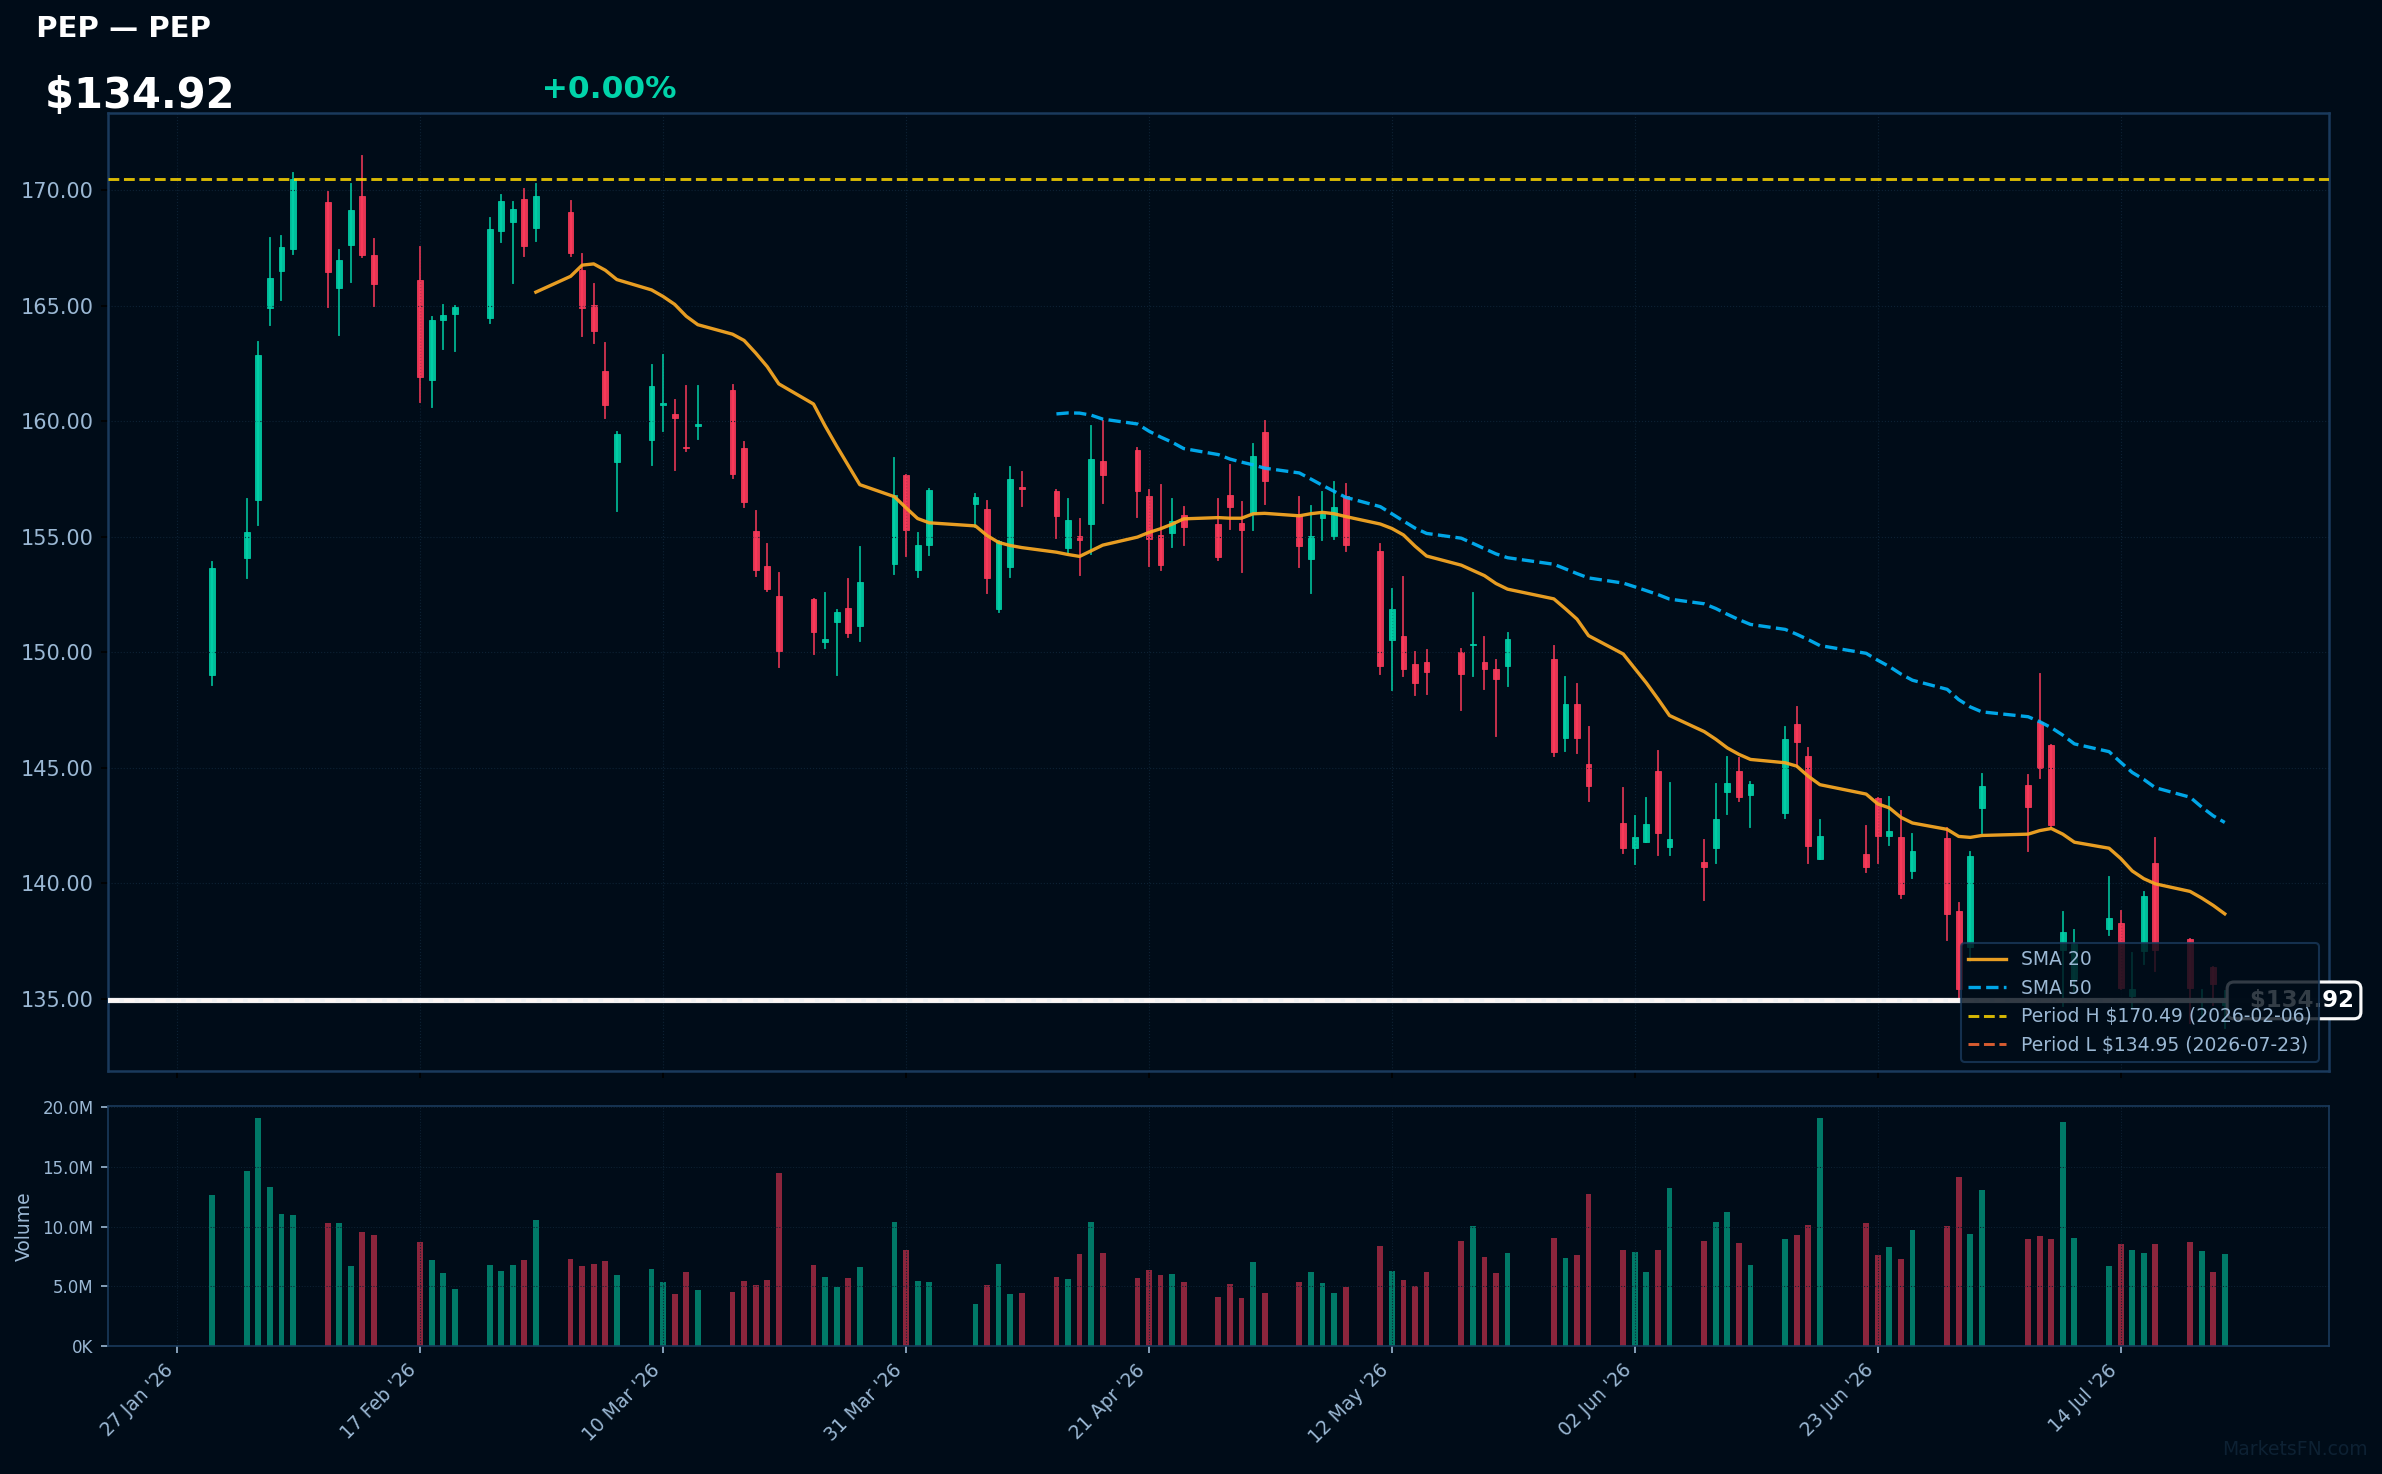
PEP | PepsiCo Inc | Consumer Defensive | Price Last: $134.95 | % Realized: -5.12% | RSI: 40.1 | % above MA200: -9.9% | Trend: Below MA20, MA50, MA200
PepsiCo Inc is a multinational food and beverage corporation that generates revenue through the sale of popular brands such as Pepsi, Lay's, and Gatorade, making it a significant player in the consumer staples sector, with investors drawn to its stable cash flows and dividend yield.
PepsiCo's current technical situation is bearish, with an RSI(14) of 40.1 indicating neutral-to-bearish momentum, and a sustained downtrend confirmed by bearish MA alignment: price ($134.92) < MA20 < MA50 < MA200, testing major support at its 2026 YTD low.
Related headlines
Market Commentary
The S&P 500 stocks listed are currently trading near their year-to-date (YTD) extremes for 2026. Specifically, JPMorgan Chase & Co, Merck & Co Inc, Union Pacific Corp, Welltower Inc, and General Dynamics Corp are at their YTD highs, while Tesla Inc, Walmart Inc, Oracle Corp, McDonald's Corp, and PepsiCo Inc are at their YTD lows.
The stocks at YTD highs represent diverse sectors such as finance (JPM), healthcare (MRK), industrials (GD, UNP), and real estate (WELL), indicating broad-based strength. Conversely, the stocks at YTD lows span technology (TSLA), consumer staples (WMT, PEP, MCD), and technology (ORCL), suggesting challenges in these areas. This divergence may reflect shifting investor sentiment and sector rotation.
Investors should monitor market conditions and sector trends to understand the drivers behind these extreme price levels. Key factors to watch include economic indicators, earnings reports, and any changes in monetary policy, as these can influence the trajectory of these stocks and the broader market.
Methodology: All 503 S&P 500 constituents screened. Close prices downloaded from 2026-01-01. Period high = highest close since Jan 1 2026; period low = lowest close since Jan 1 2026. Distance = (current price / period extreme − 1) × 100. Technical indicators computed on up to 1 year of daily OHLCV data.
Disclaimer: For informational purposes only. Not investment advice. Past performance is not indicative of future results.

