S&P 500 2026 YTD Highs & Lows Radar: Merck & (MRK), Monster Beverage (MNST) and more
MarketsFN Team

S&P 500 2026 YTD Highs & Lows Radar: Merck & (MRK), Monster Beverage (MNST) and more
Screening all 503 S&P 500 constituents for stocks nearest to their 2026 year-to-date high and their 2026 YTD low. Data as of August 18, 2026. % Realized = total return since Jan 1 2026.
Legend: RSI > 70 = overbought · RSI < 30 = oversold · Green % Realized = positive YTD return · Red = negative.
📈 Nearest to 2026 High
Sectors represented: Financial (4), Healthcare (1)
| Ticker | Company | Sector | Price Last | % Realized | 2026 YTD High Date | RSI | % above MA200 | Trend |
|---|---|---|---|---|---|---|---|---|
| MRK | Merck & Co Inc | Healthcare | $135.84 | +27.61% | 2026-08-14 | 71.5 | +19.1% | Above MA20, MA50, MA200 |
| SCHW | Charles Schwab Corp | Financial | $111.09 | +9.37% | 2026-08-14 | 76.6 | +15.3% | Above MA20, MA50, MA200 |
| PNC | PNC Financial Services Group Inc | Financial | $256.97 | +21.52% | 2026-08-14 | 60.5 | +16.6% | Above MA20, MA50, MA200 |
| USB | U.S. Bancorp | Financial | $65.42 | +21.31% | 2026-08-14 | 63.1 | +17.6% | Above MA20, MA50, MA200 |
| PYPL | PayPal Holdings Inc | Financial | $61.66 | +6.05% | 2026-08-14 | 70.1 | +19.5% | Above MA20, MA50, MA200 |
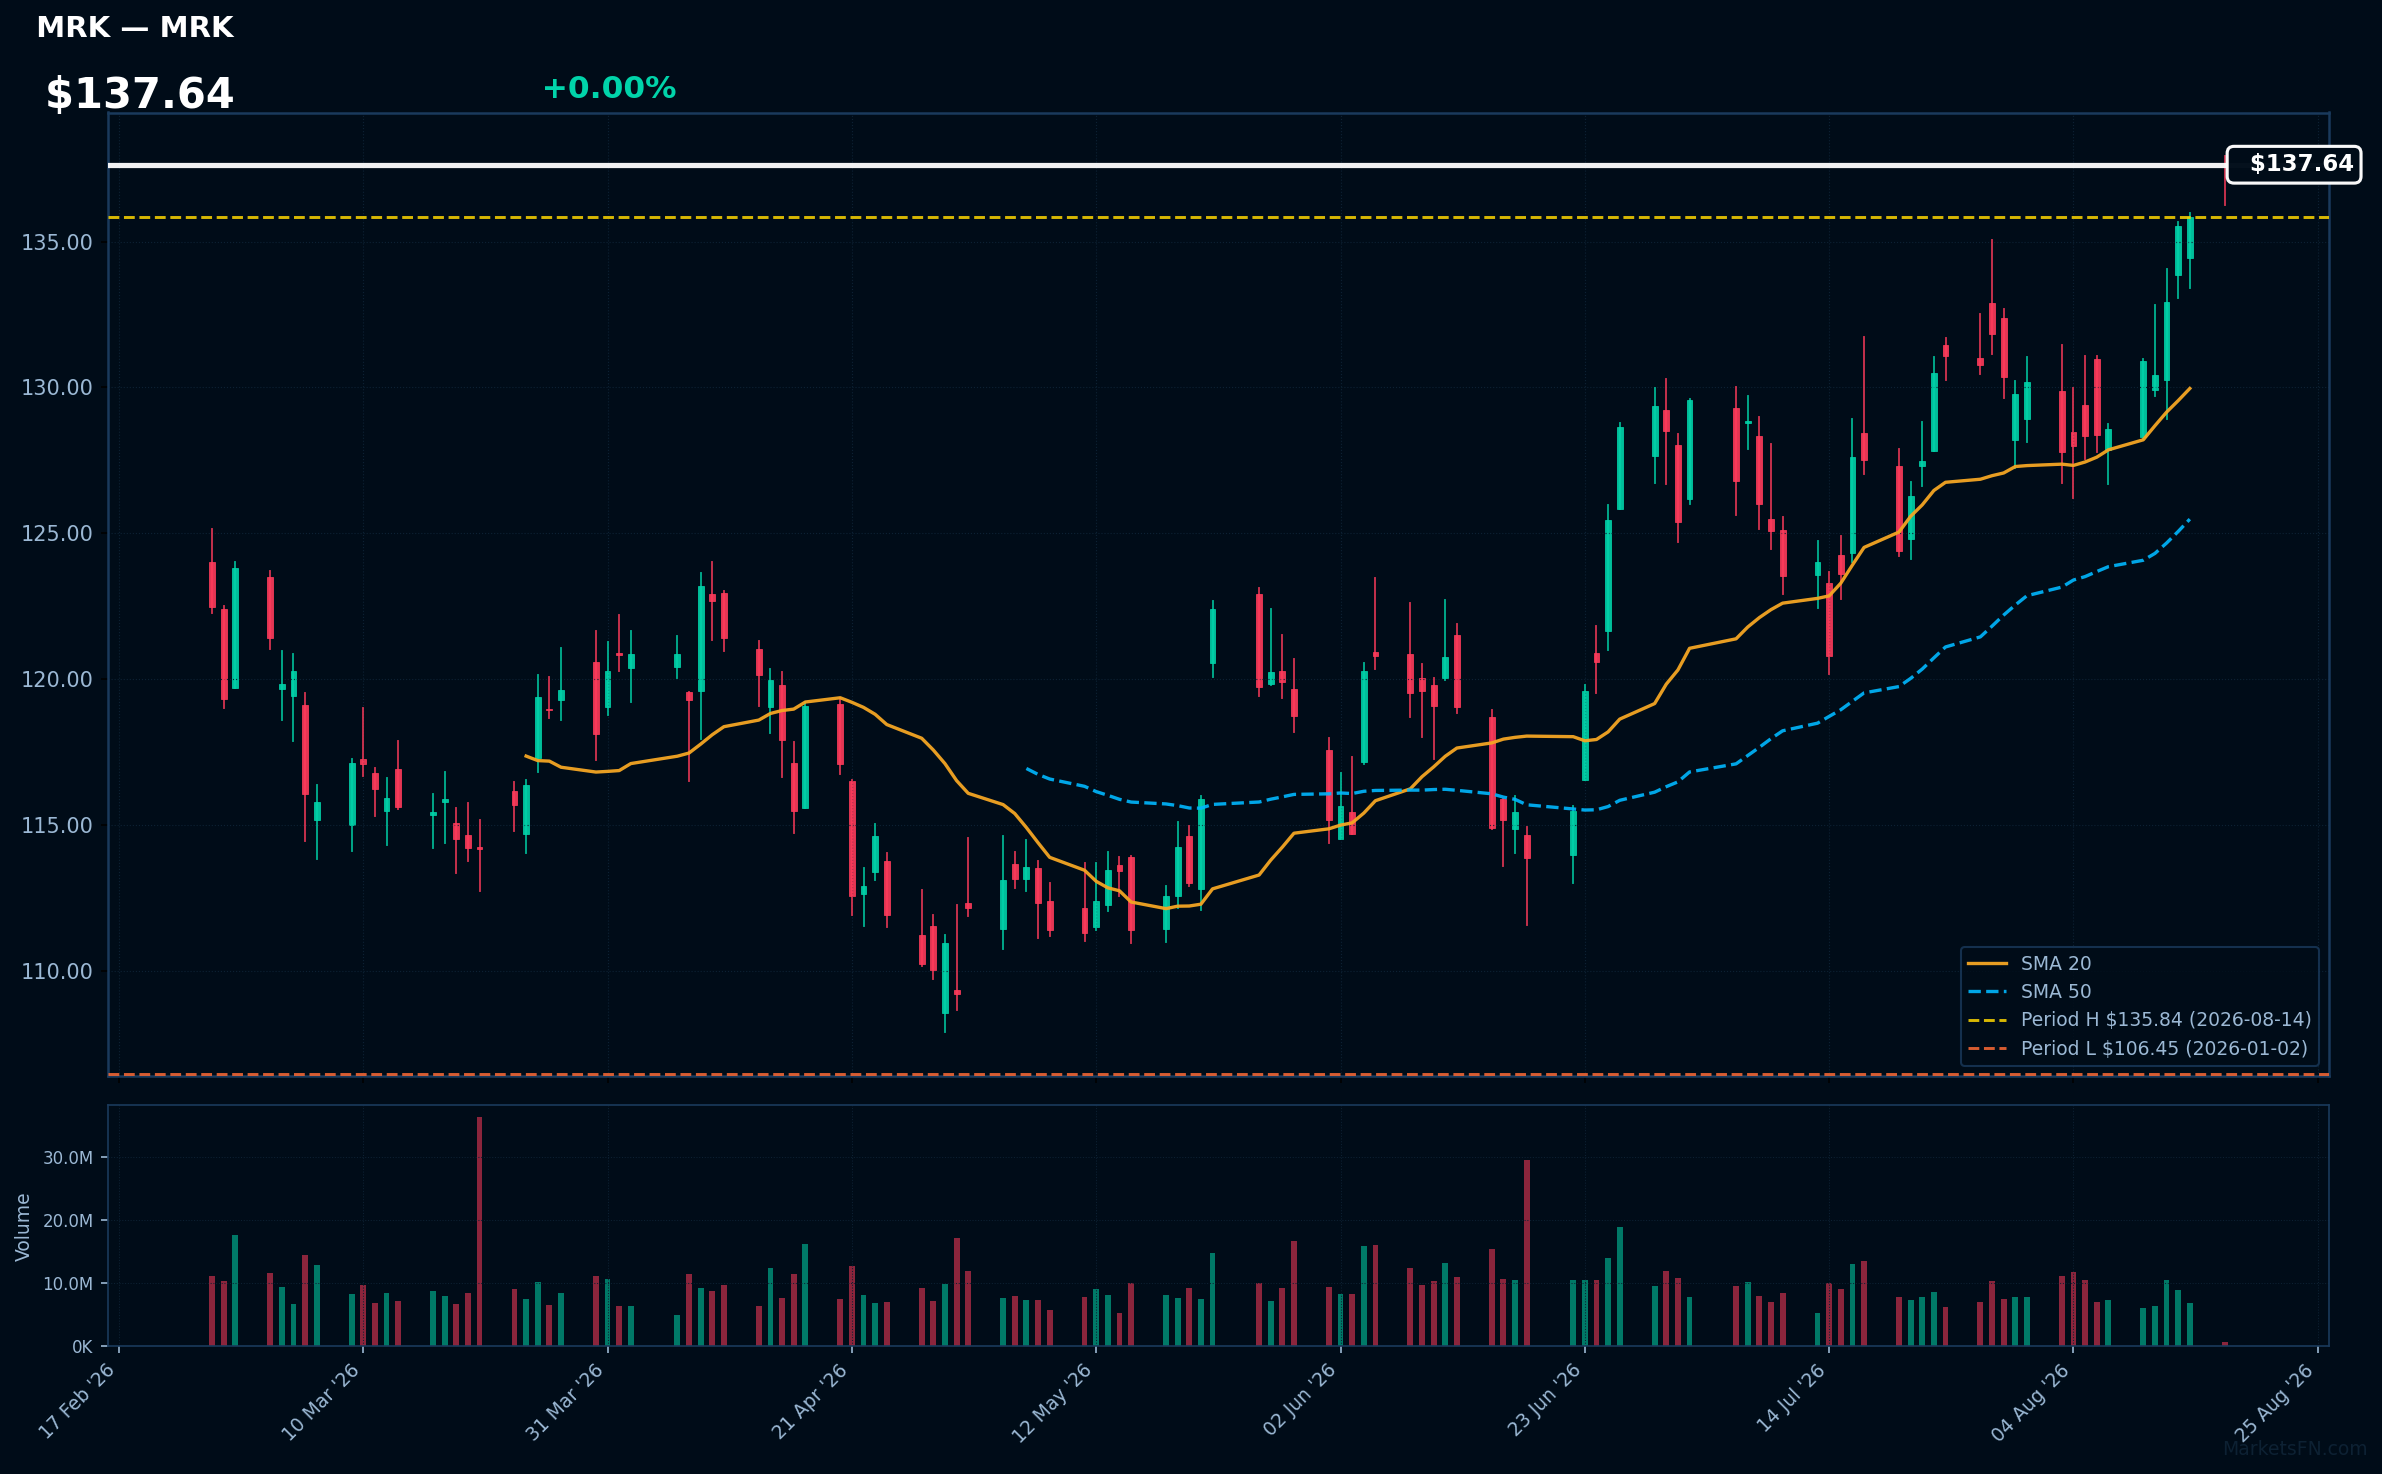
MRK | Merck & Co Inc | Healthcare | Price Last: $135.84 | % Realized: +27.61% | RSI: 71.5 | % above MA200: +19.1% | Trend: Above MA20, MA50, MA200
Merck & Co Inc develops innovative pharmaceuticals and vaccines, focusing on areas like oncology, infectious diseases, and immunology. Investors should care due to its strong pipeline and market position, which can drive future growth and profitability.
The current technical situation shows bullish momentum with an RSI(14) of 71.5 and a bullish MA alignment: price > MA20 > MA50 > MA200. The stock is also 0.0% below its 2026 YTD high.
Related headlines
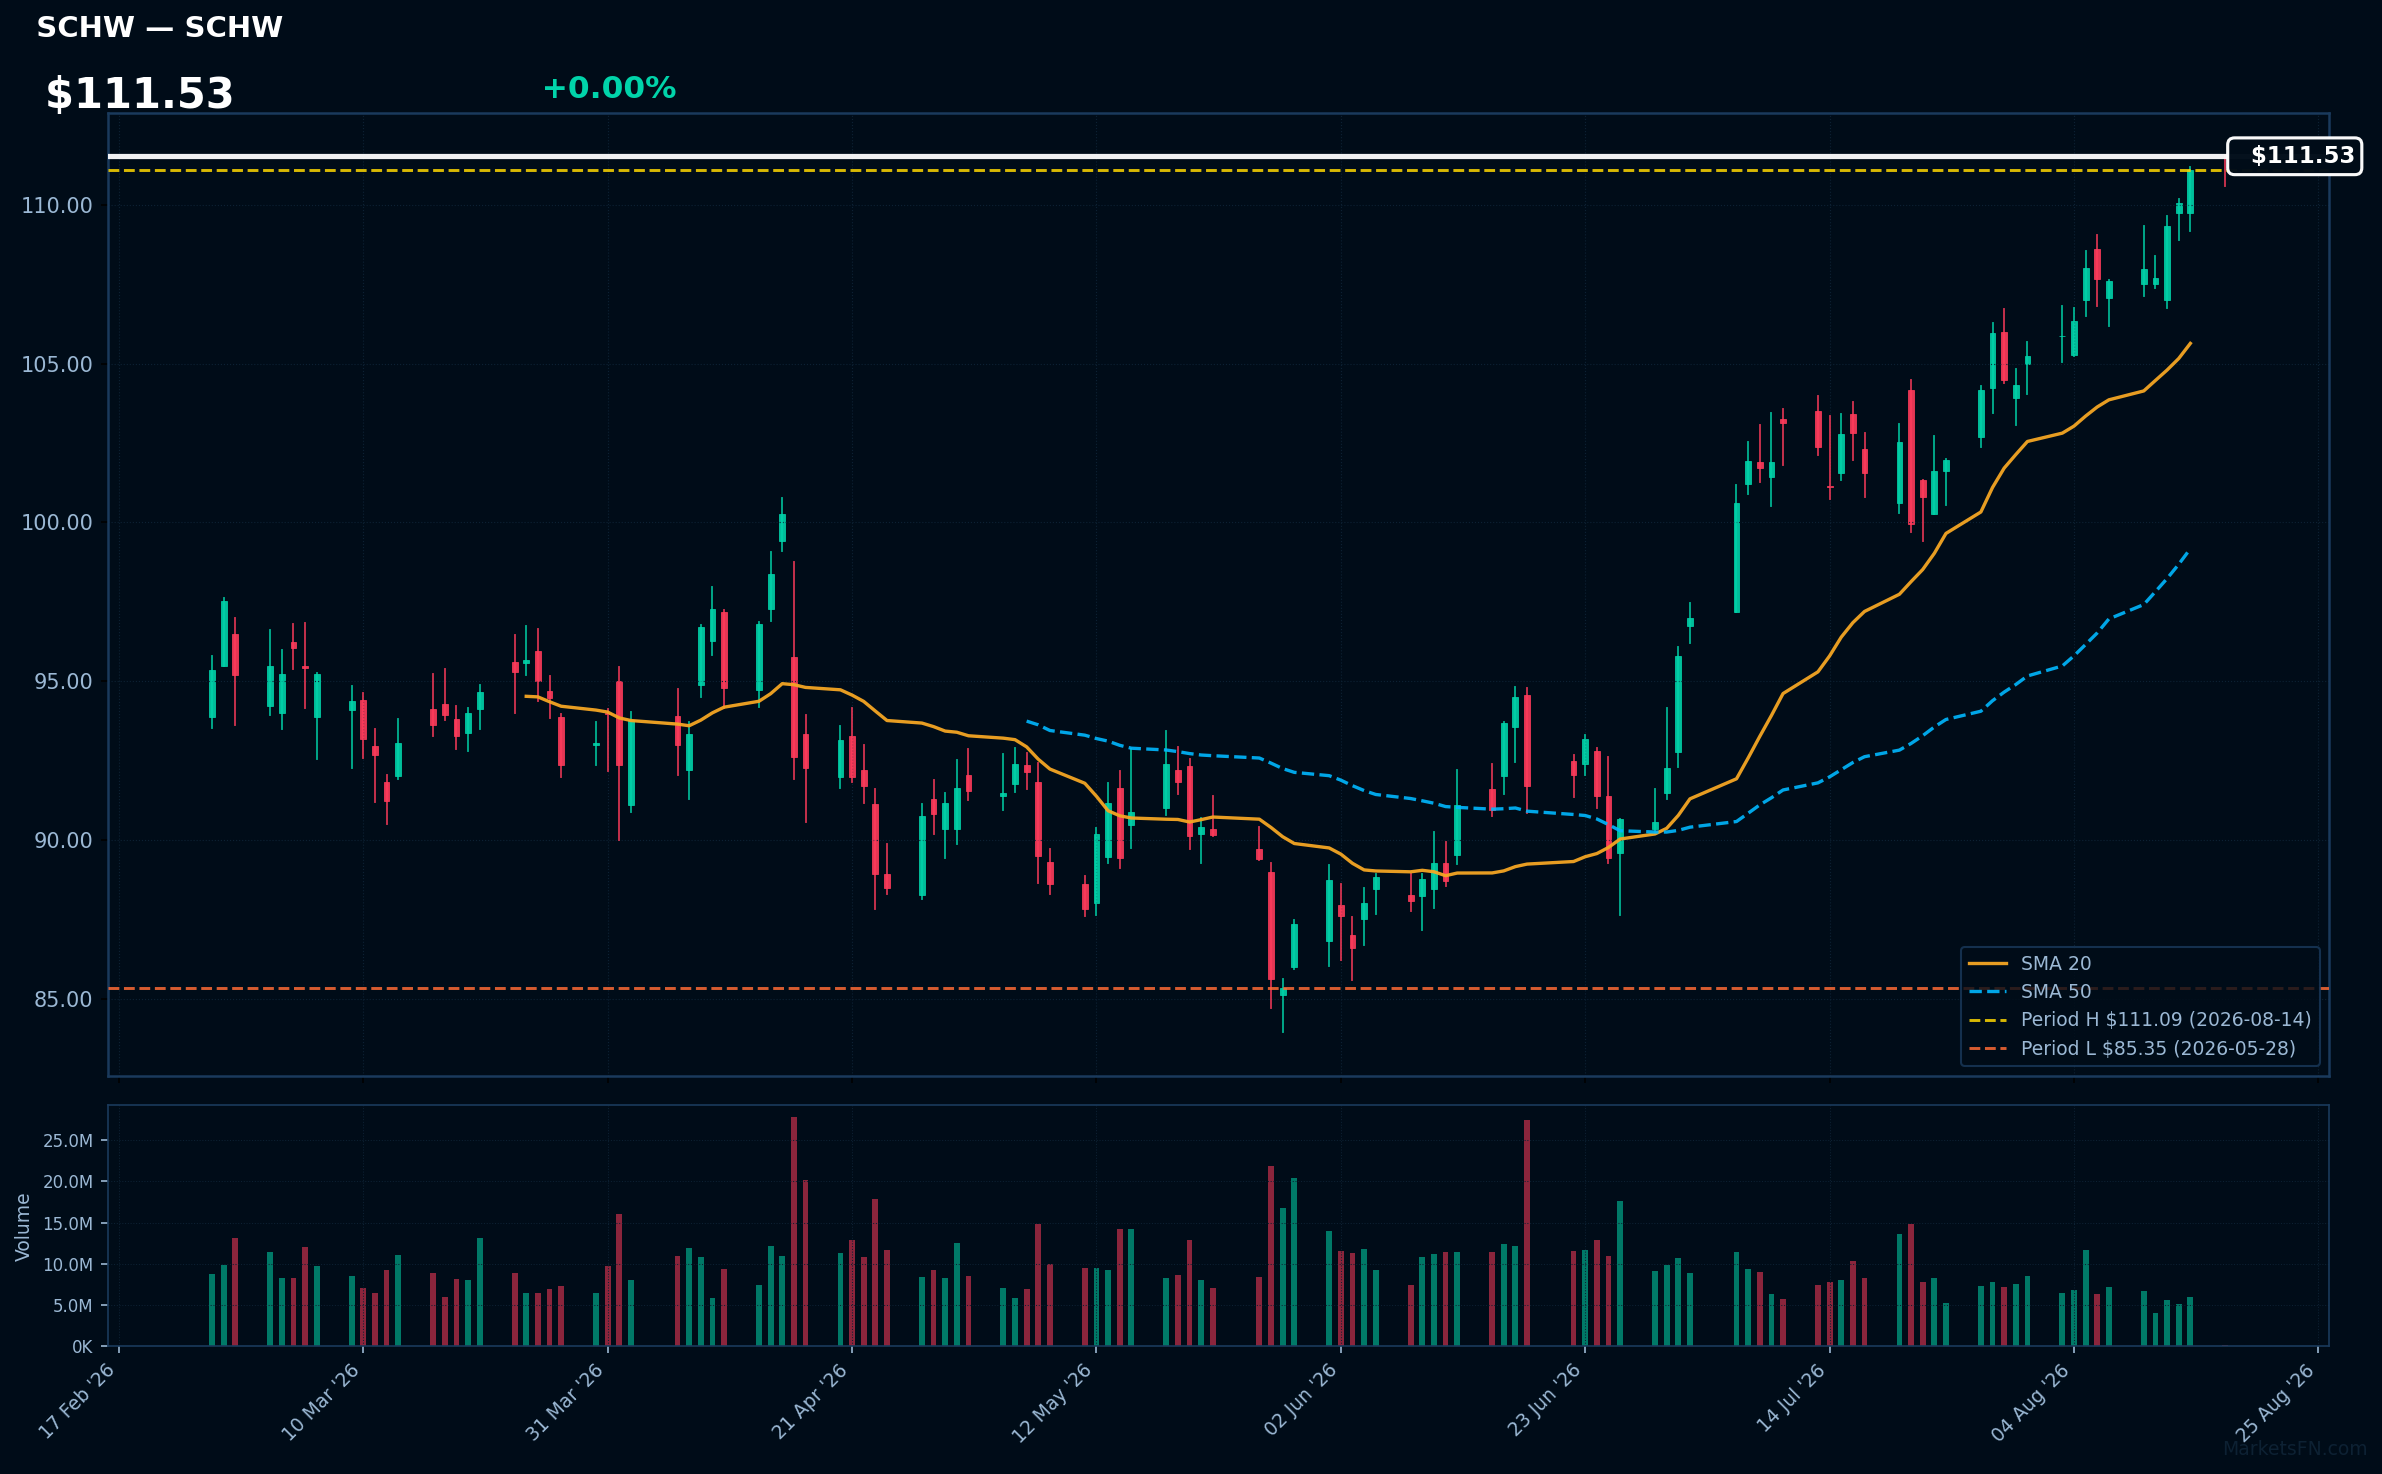
SCHW | Charles Schwab Corp | Financial | Price Last: $111.09 | % Realized: +9.37% | RSI: 76.6 | % above MA200: +15.3% | Trend: Above MA20, MA50, MA200
Charles Schwab Corp provides a range of financial services including brokerage, banking, and investment management. Investors should care due to its strong market position and innovative technology, which enhance client engagement and drive growth in a competitive landscape.
The current technical situation indicates bullish momentum, with an RSI(14) of 76.6 and a bullish MA alignment: price > MA20 > MA50 > MA200, suggesting a sustained uptrend.
Related headlines
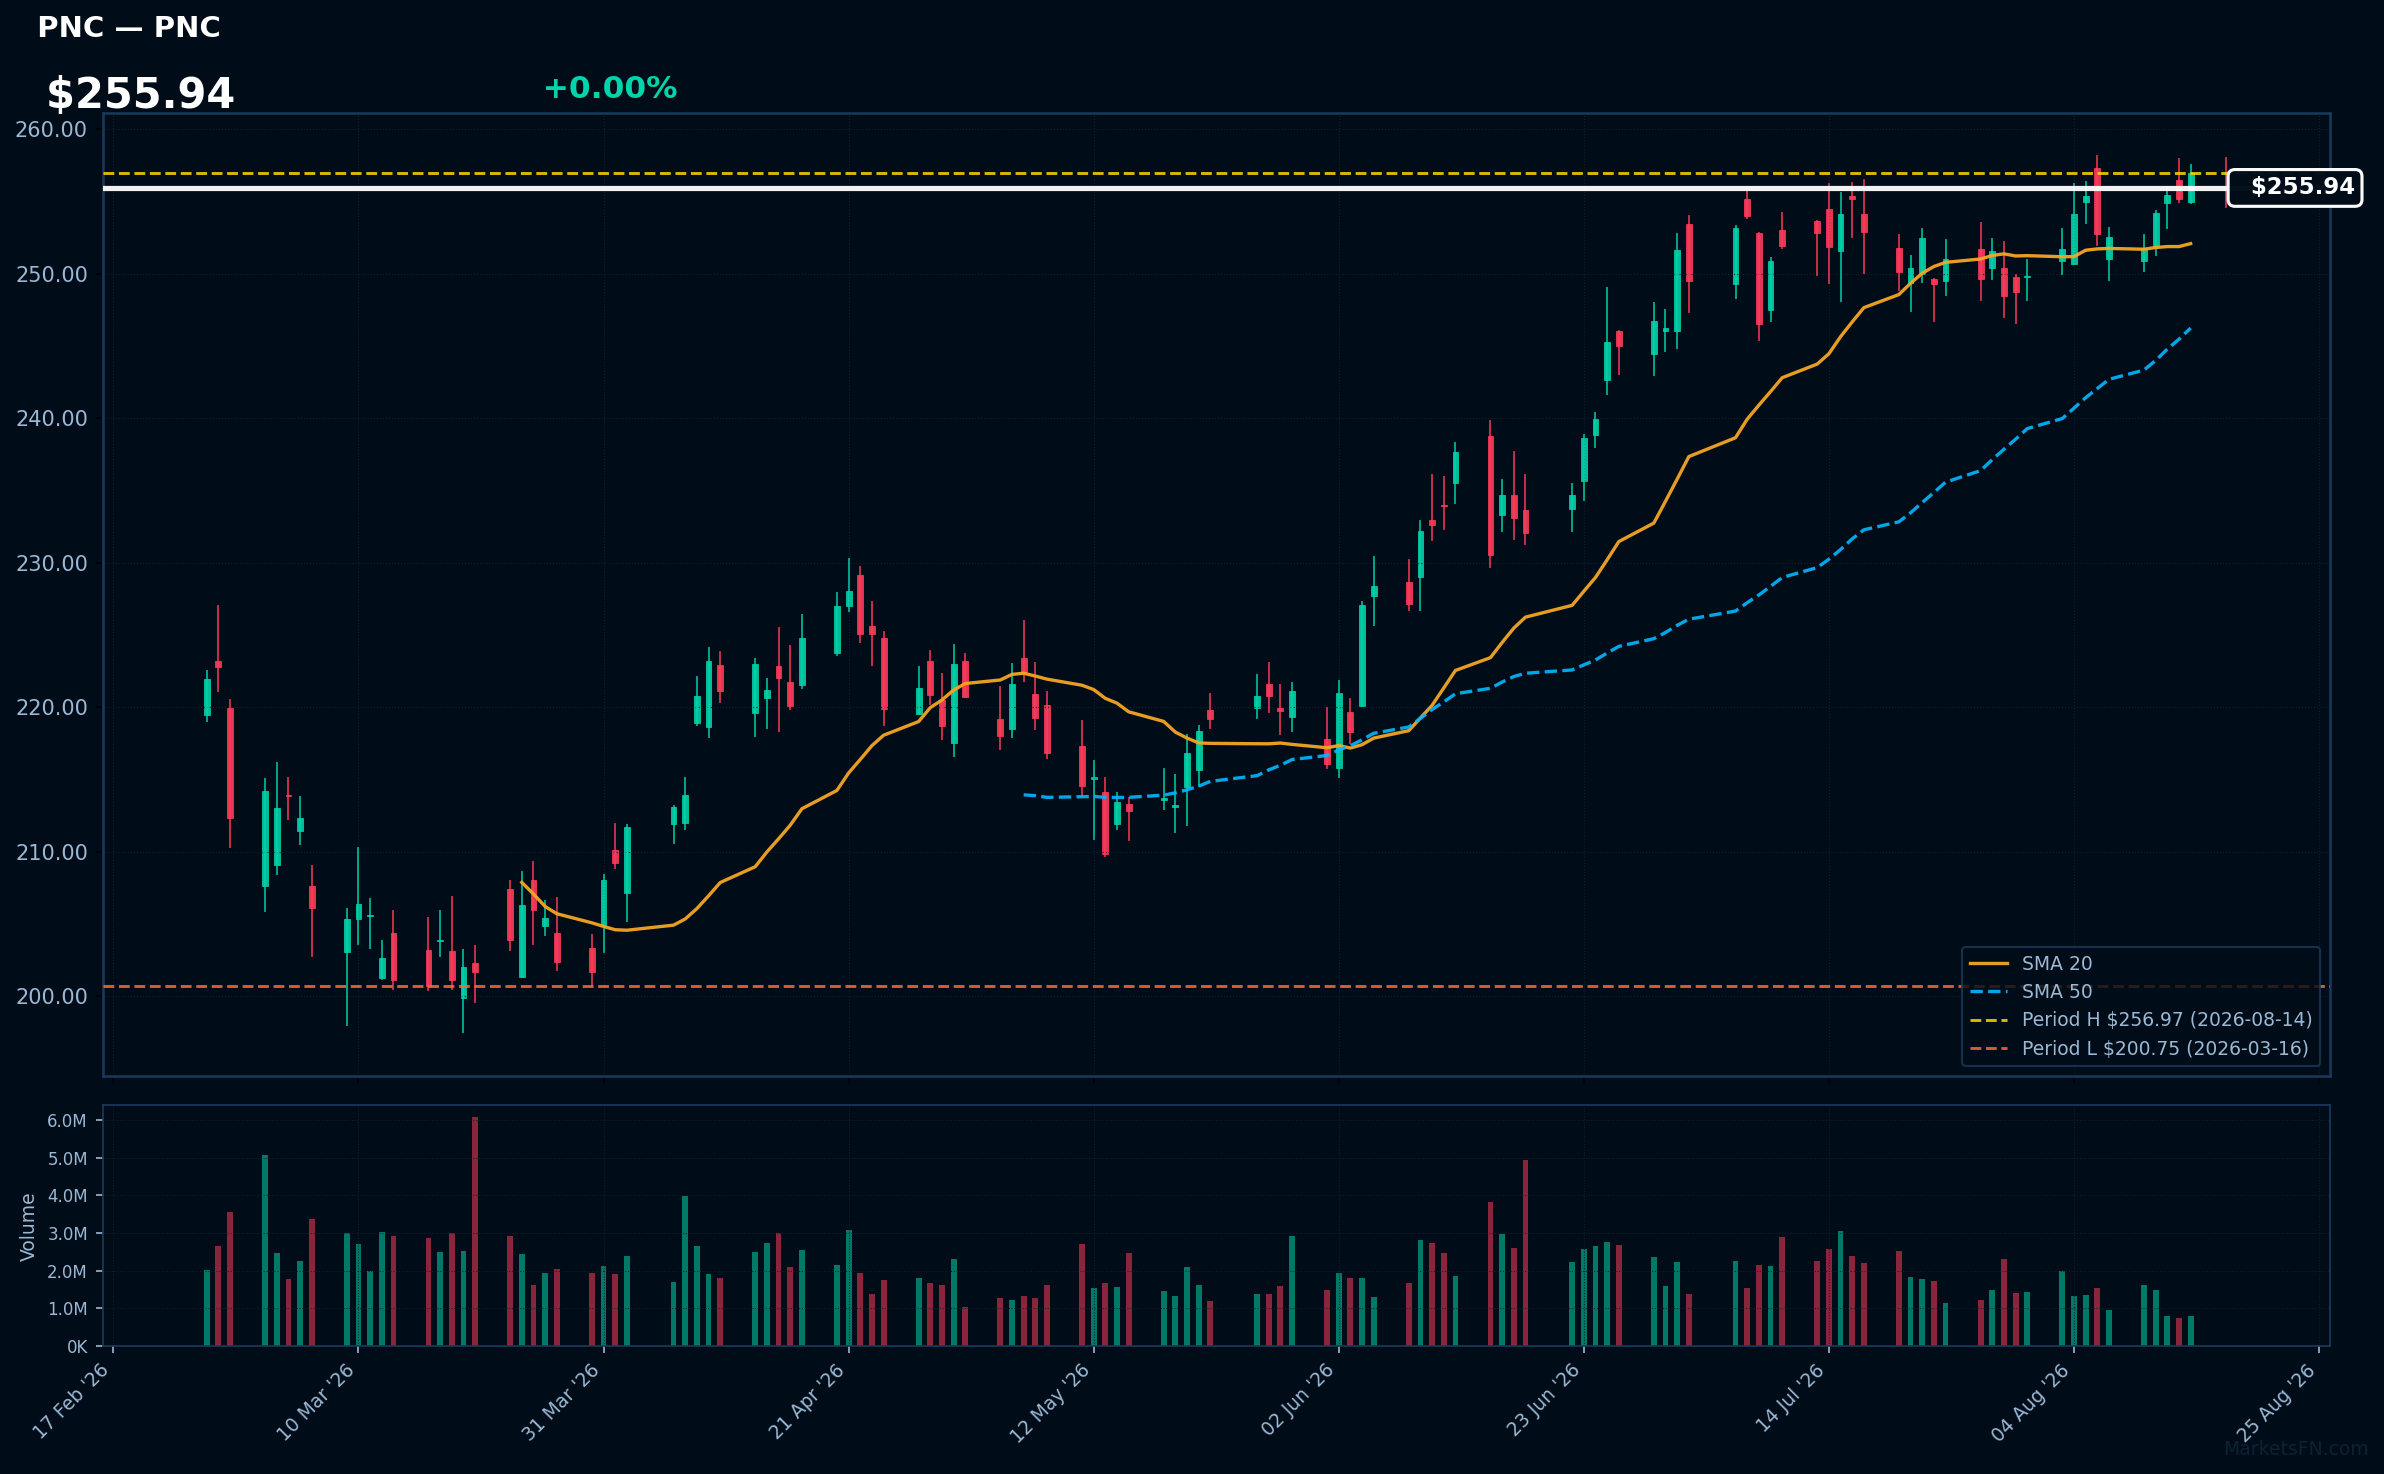
PNC | PNC Financial Services Group Inc | Financial | Price Last: $256.97 | % Realized: +21.52% | RSI: 60.5 | % above MA200: +16.6% | Trend: Above MA20, MA50, MA200
PNC Financial Services Group Inc provides diversified financial services, including retail banking, corporate banking, and investment services. Investors should care due to its strong market position and consistent performance, which can drive growth and shareholder value.
The current technical situation shows bullish momentum with an RSI(14) of 60.5 and a bullish MA alignment: price > MA20 > MA50 > MA200. The stock is 0.0% below its 2026 YTD high, indicating a potential breakout.
Related headlines
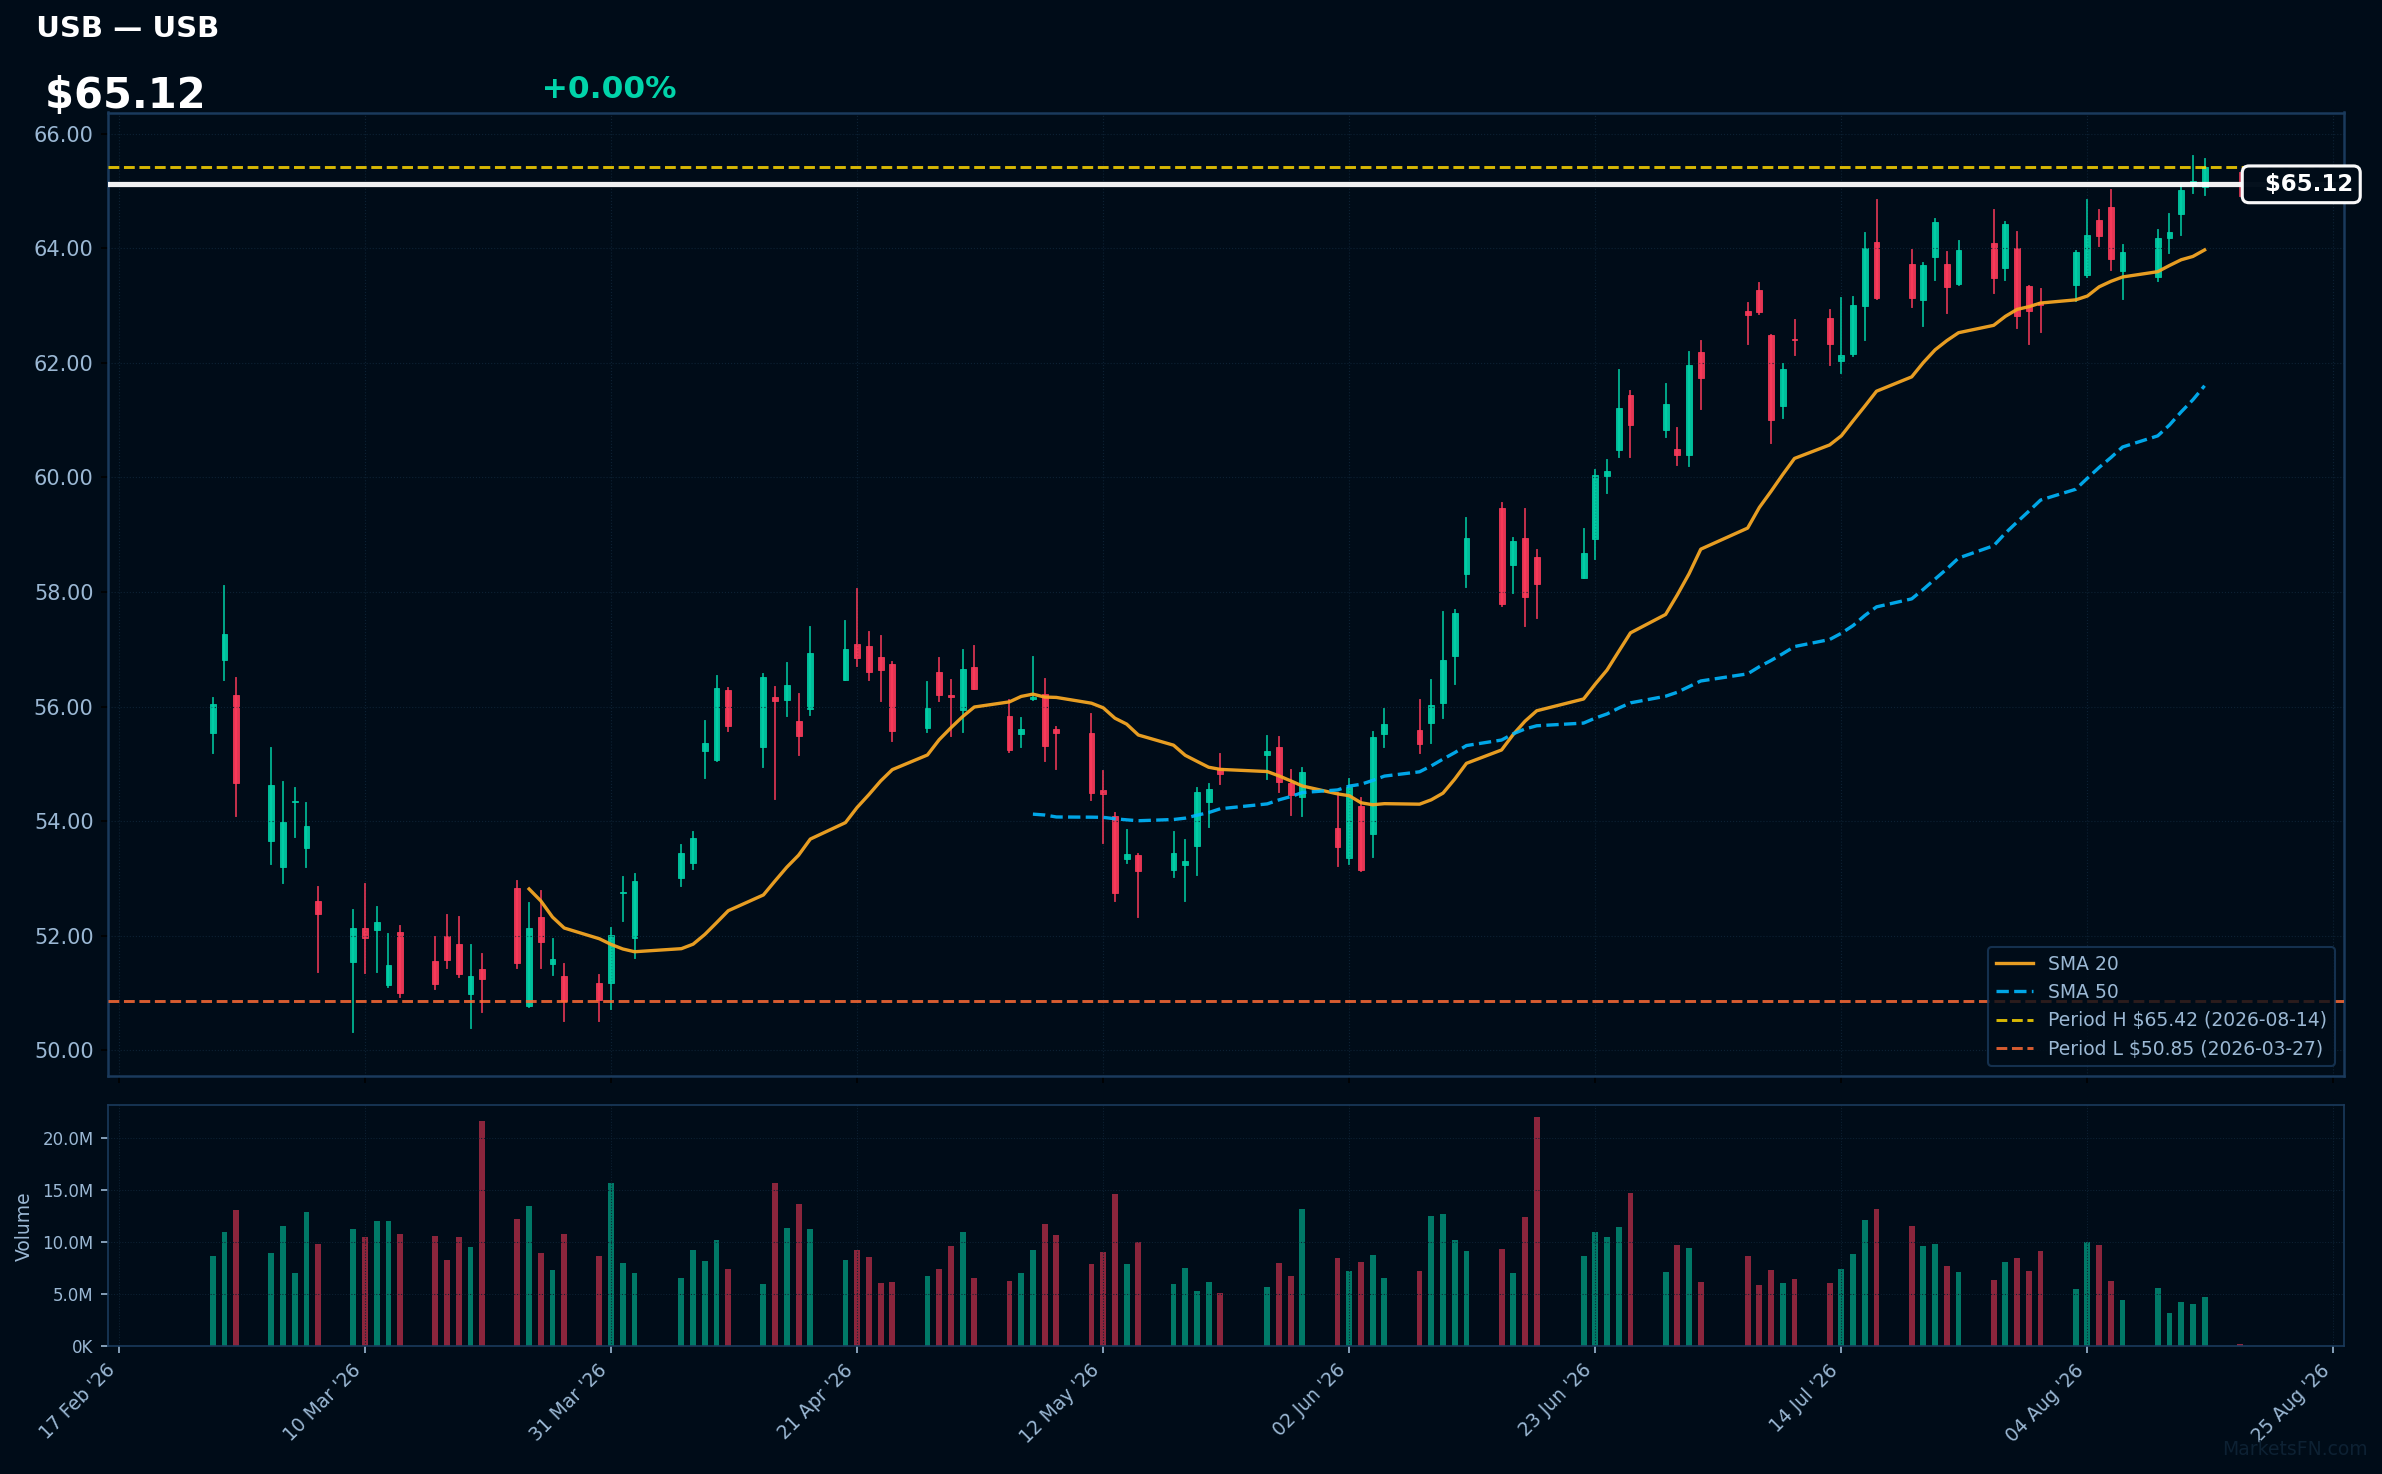
USB | U.S. Bancorp | Financial | Price Last: $65.42 | % Realized: +21.31% | RSI: 63.1 | % above MA200: +17.6% | Trend: Above MA20, MA50, MA200
U.S. Bancorp (USB) is a financial services holding company that provides a range of banking, investment, mortgage, trust, and payment services. Investors should care due to its strong market position and consistent performance in a competitive banking landscape.
The current technical situation shows bullish momentum with an RSI(14) of 63.1 and a bullish MA alignment: price > MA20 > MA50 > MA200. The stock is also 0.0% below its 2026 YTD high, indicating a potential breakout.
Related headlines
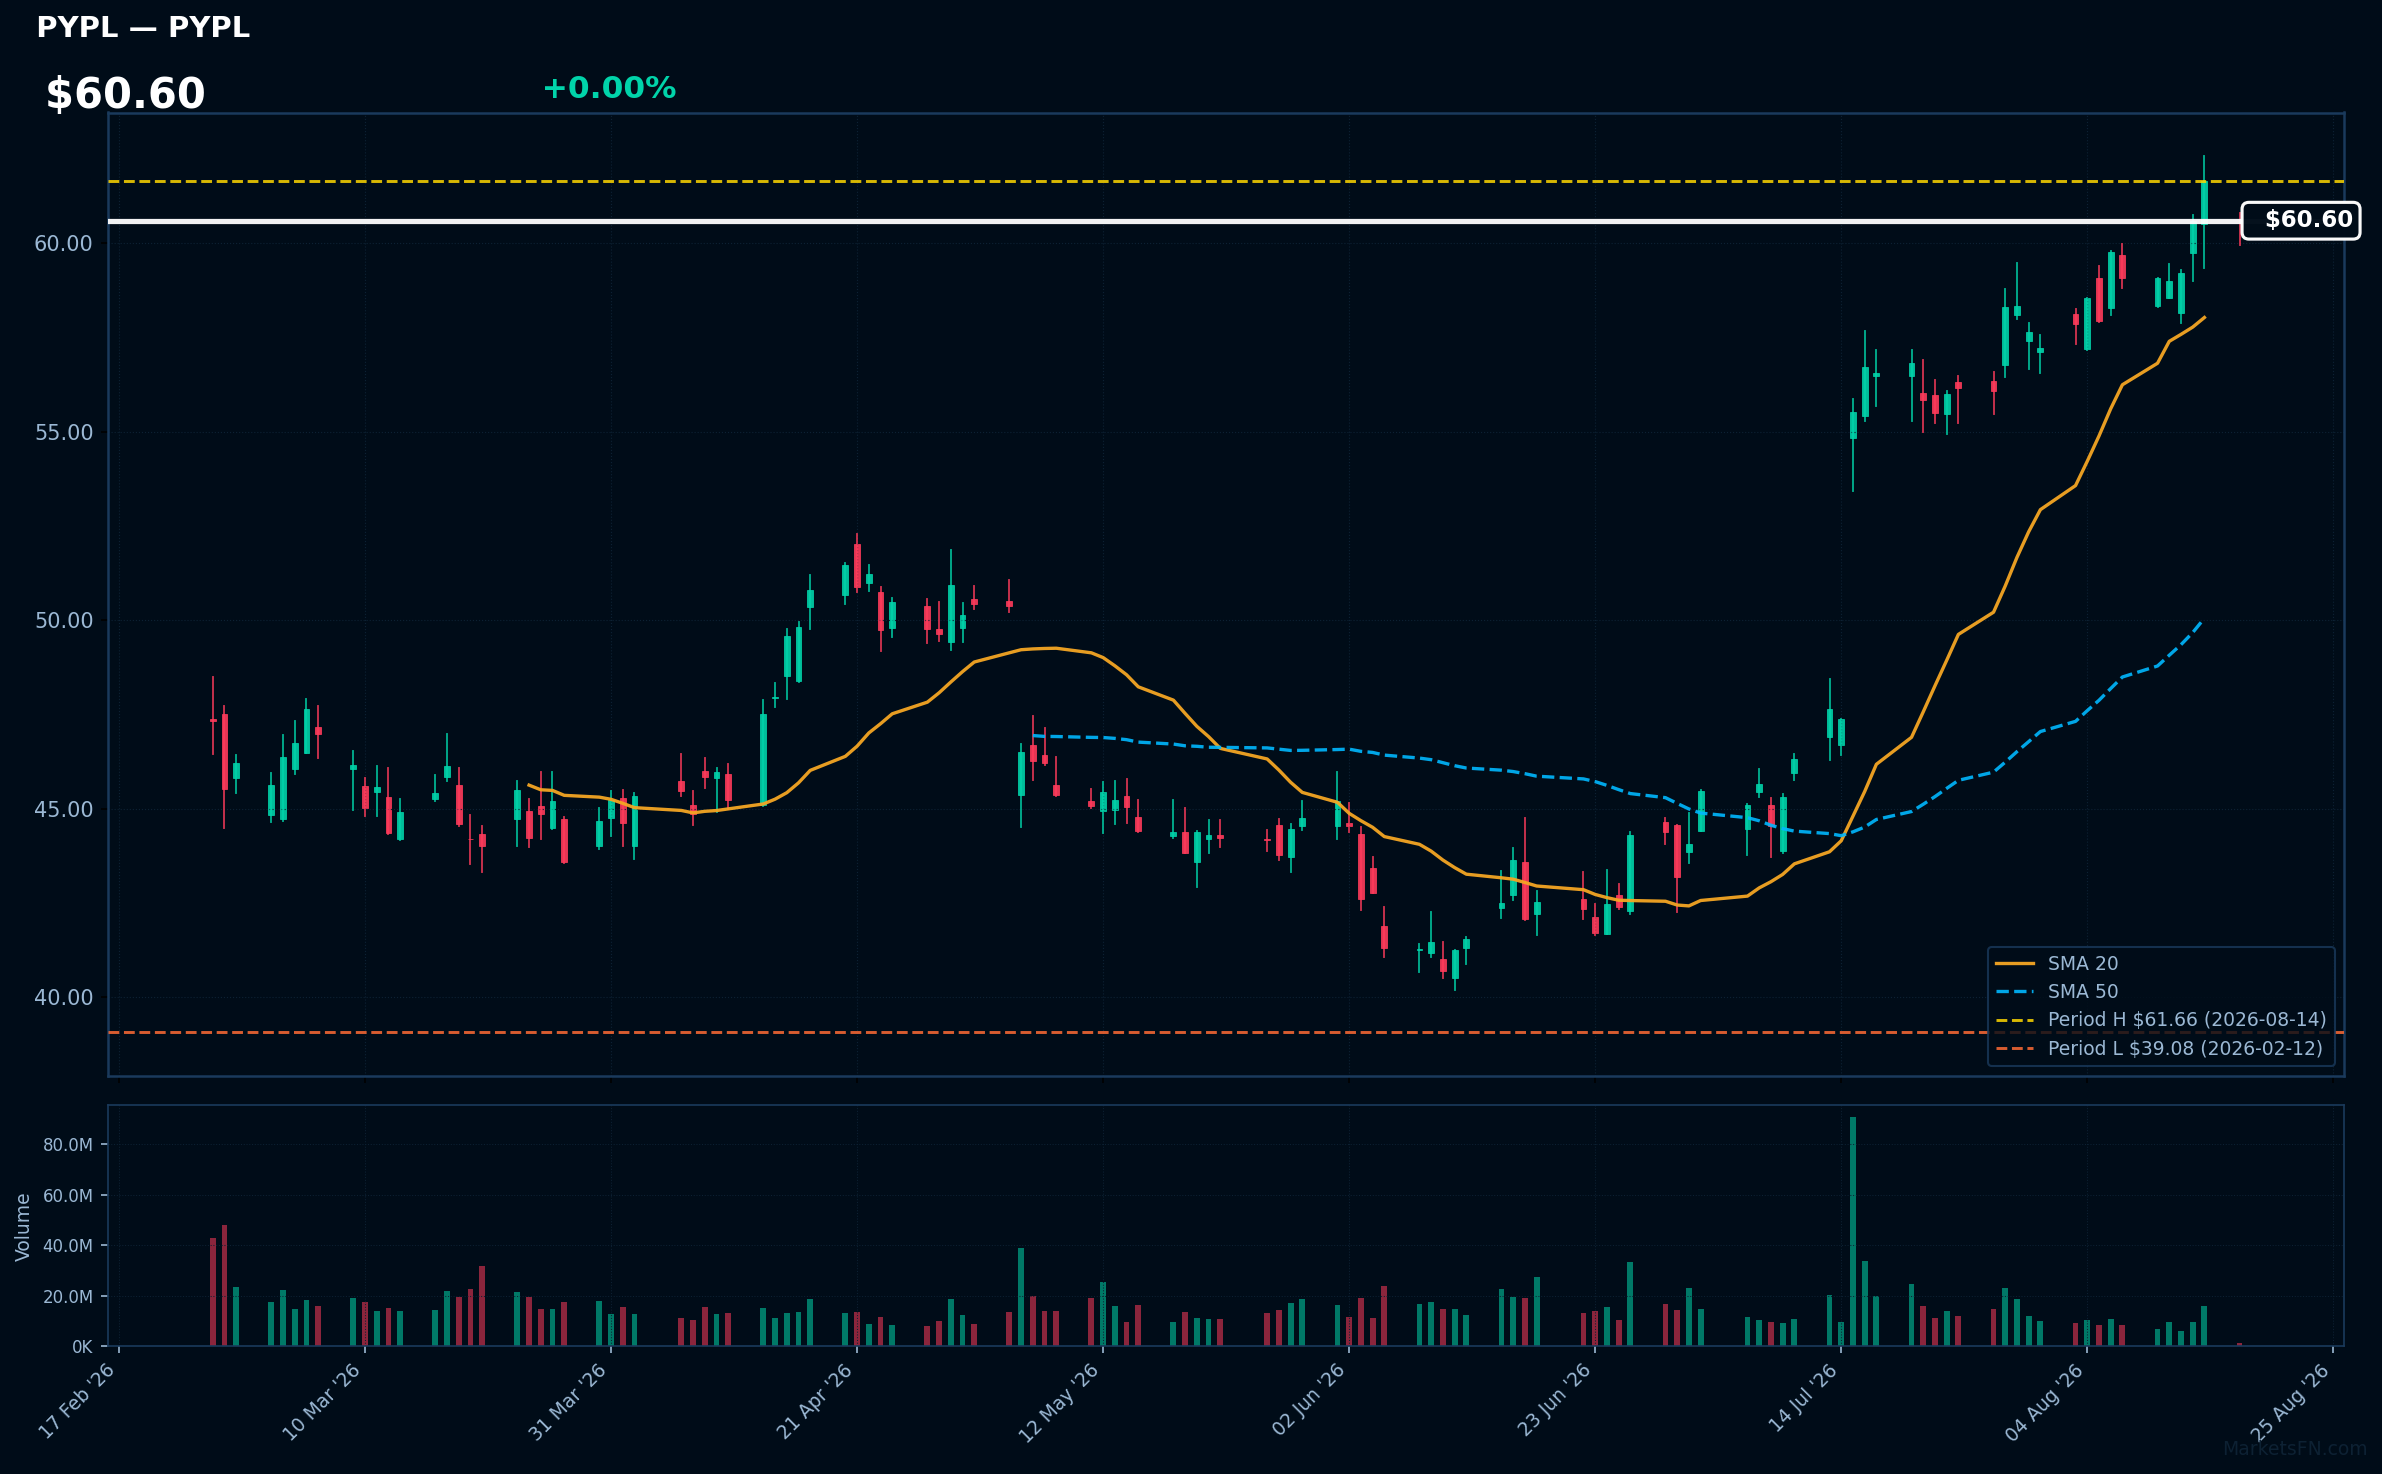
PYPL | PayPal Holdings Inc | Financial | Price Last: $61.66 | % Realized: +6.05% | RSI: 70.1 | % above MA200: +19.5% | Trend: Above MA20, MA50, MA200
PayPal Holdings Inc provides digital payment solutions, enabling consumers and merchants to make transactions online. Investors should care due to its significant market presence and ongoing innovations in fintech, which can drive growth and enhance user engagement.
The current technical situation shows mixed signals with an RSI(14) of 70.1, indicating potential overbought conditions, while the price is above MA20/MA50/MA200. The stock is 0.0% below its 2026 YTD high, suggesting a potential breakout level.
Related headlines
📉 Nearest to 2026 Low
Sectors represented: Consumer Cyclical (2), Consumer Defensive (1), Communication Services (1), Industrials (1)
| Ticker | Company | Sector | Price Last | % Realized | 2026 YTD Low Date | RSI | % above MA200 | Trend |
|---|---|---|---|---|---|---|---|---|
| MNST | Monster Beverage Corp | Consumer Defensive | $45.52 | -40.23% | 2026-08-17 | 13.7 | -43.4% | Below MA20, MA50, MA200 |
| ROL | Rollins, Inc | Consumer Cyclical | $36.20 | -38.65% | 2026-08-14 | 25.5 | -32.7% | Below MA20, MA50, MA200 |
| EA | Electronic Arts, Inc | Communication Services | $209.70 | +0.38% | 2026-07-17 | — | — | — |
| NKE | Nike, Inc | Consumer Cyclical | $40.73 | -35.64% | 2026-08-12 | 36.7 | -23.3% | Below MA20, MA50, MA200 |
| LII | Lennox International Inc | Industrials | $422.01 | -15.41% | 2026-07-31 | 30.0 | -16.4% | Below MA20, MA50, MA200 |
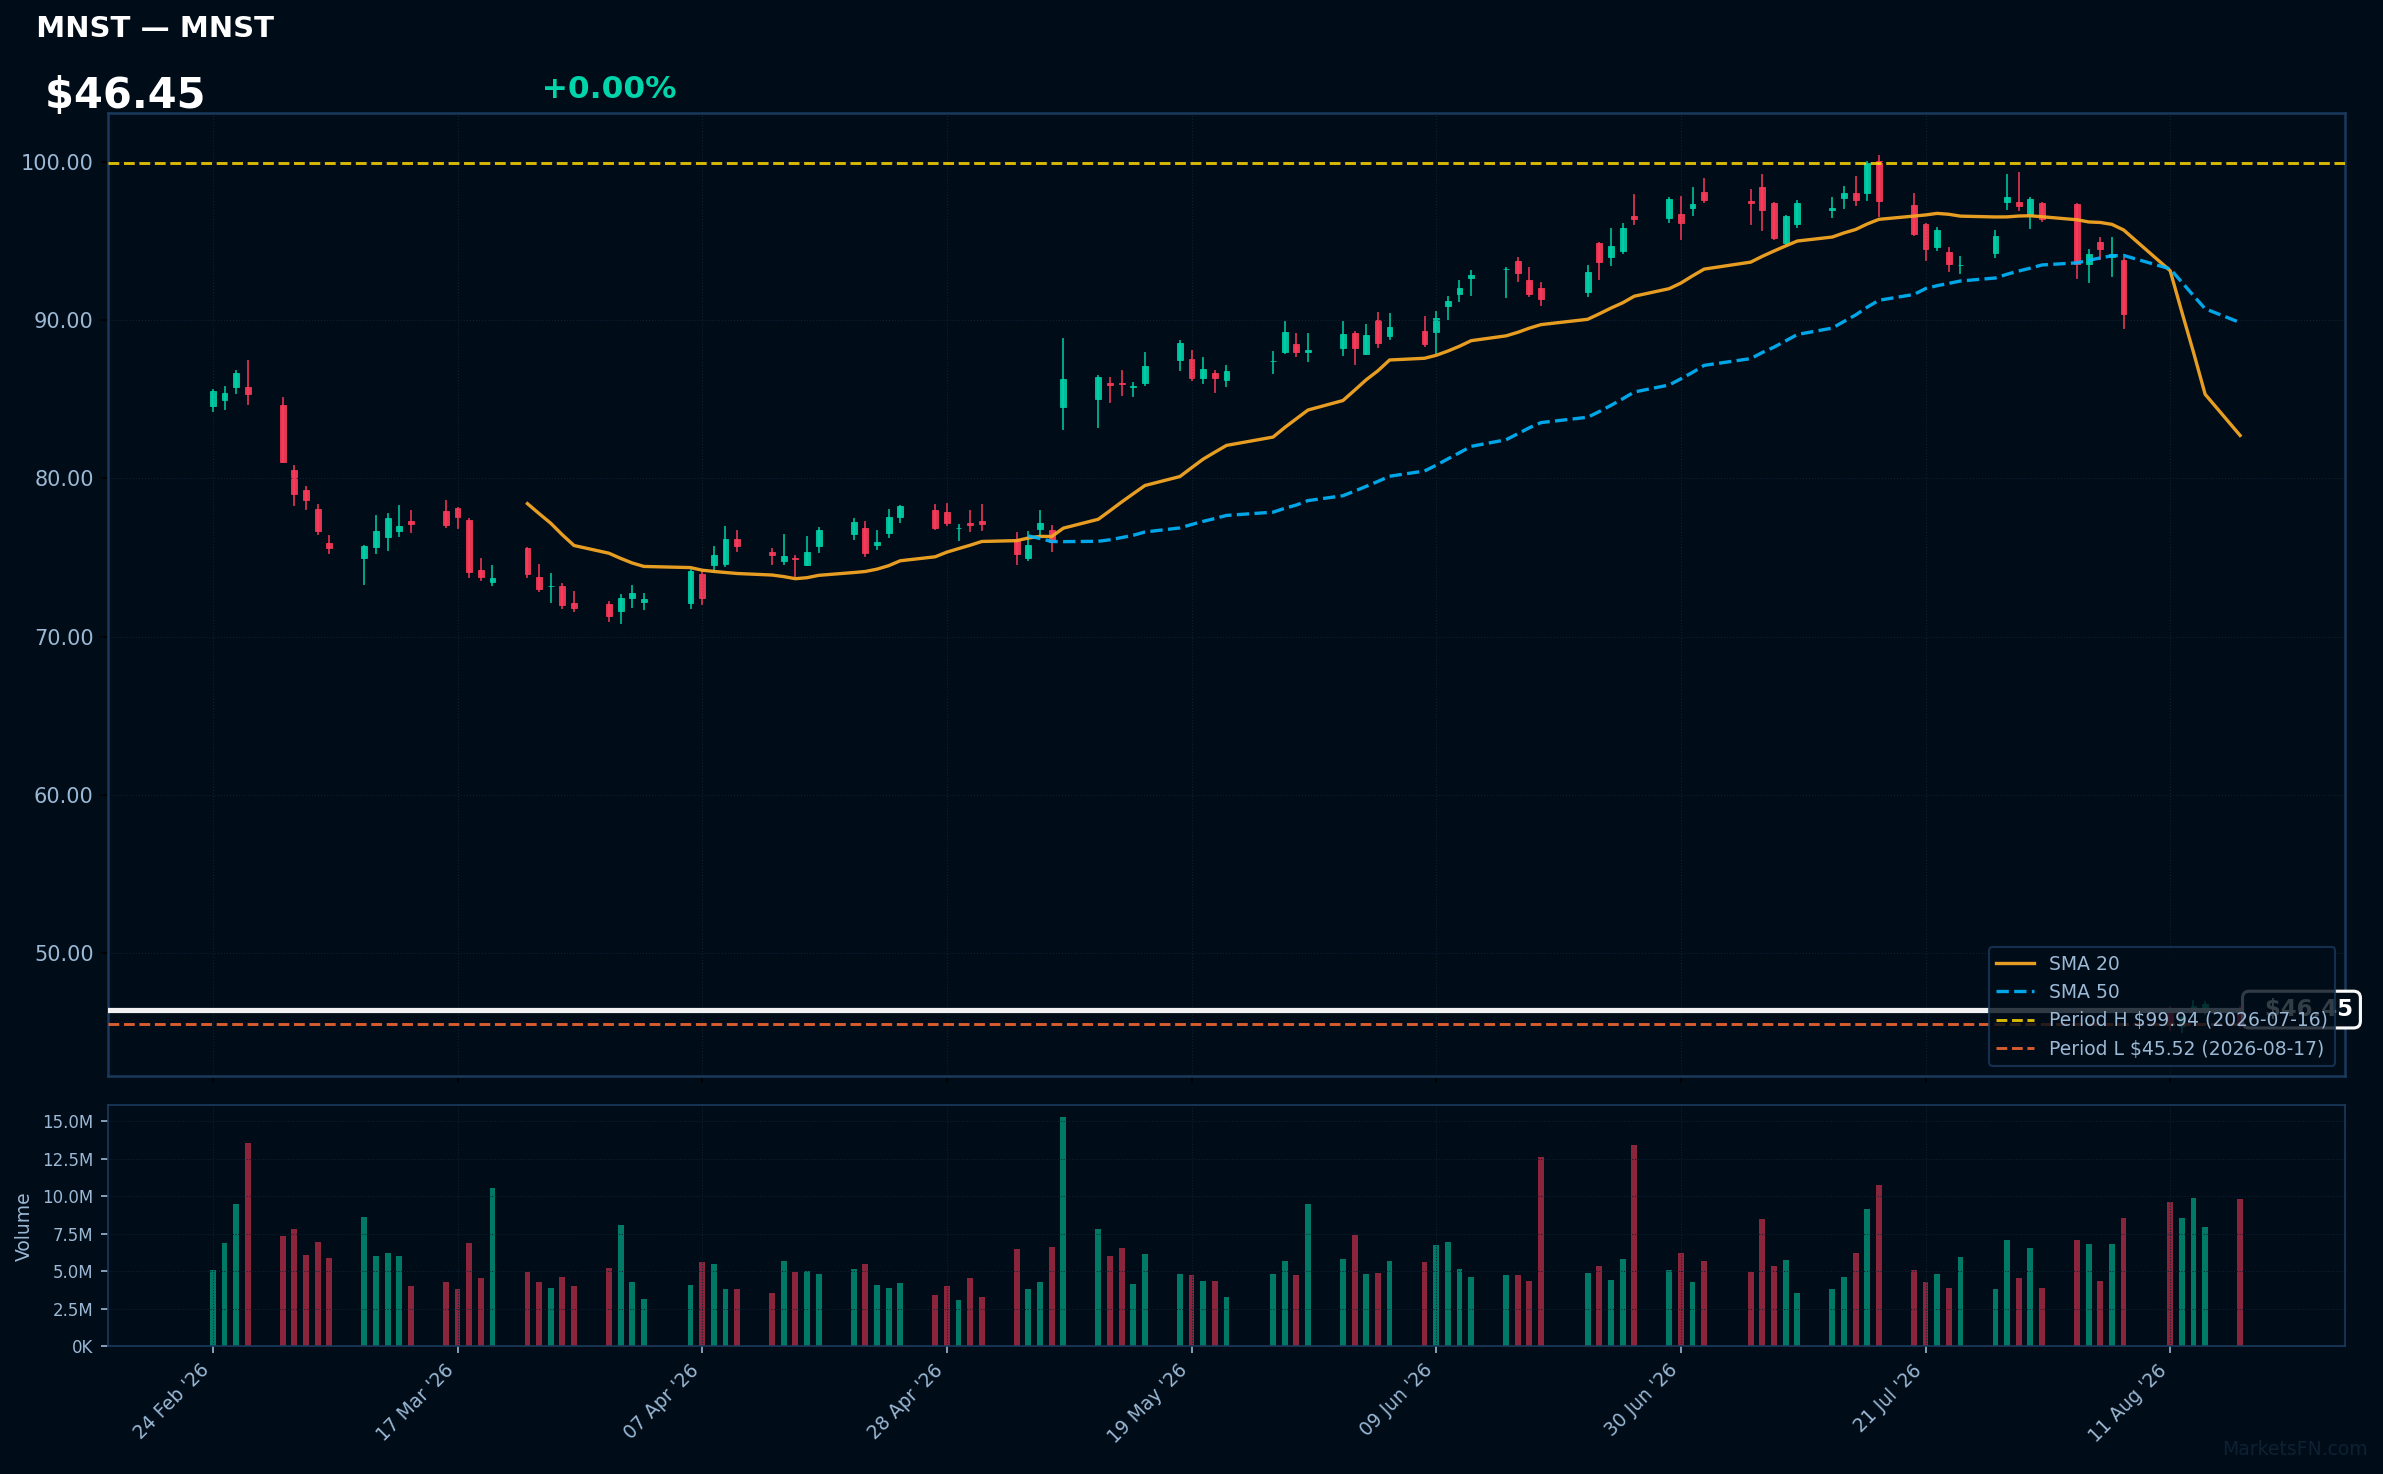
MNST | Monster Beverage Corp | Consumer Defensive | Price Last: $45.52 | % Realized: -40.23% | RSI: 13.7 | % above MA200: -43.4% | Trend: Below MA20, MA50, MA200
Monster Beverage Corp (MNST) specializes in energy drinks, offering a diverse range of products that cater to active lifestyles. Investors should care due to its significant market presence and potential for growth in the expanding energy drink sector.
The current technical situation shows a warning sign, with an RSI(14) of 13.7 and mixed signals as the stock is below MA20/MA50/MA200. It is also testing major support, being only 0.0% above its 2026 YTD low.
Related headlines
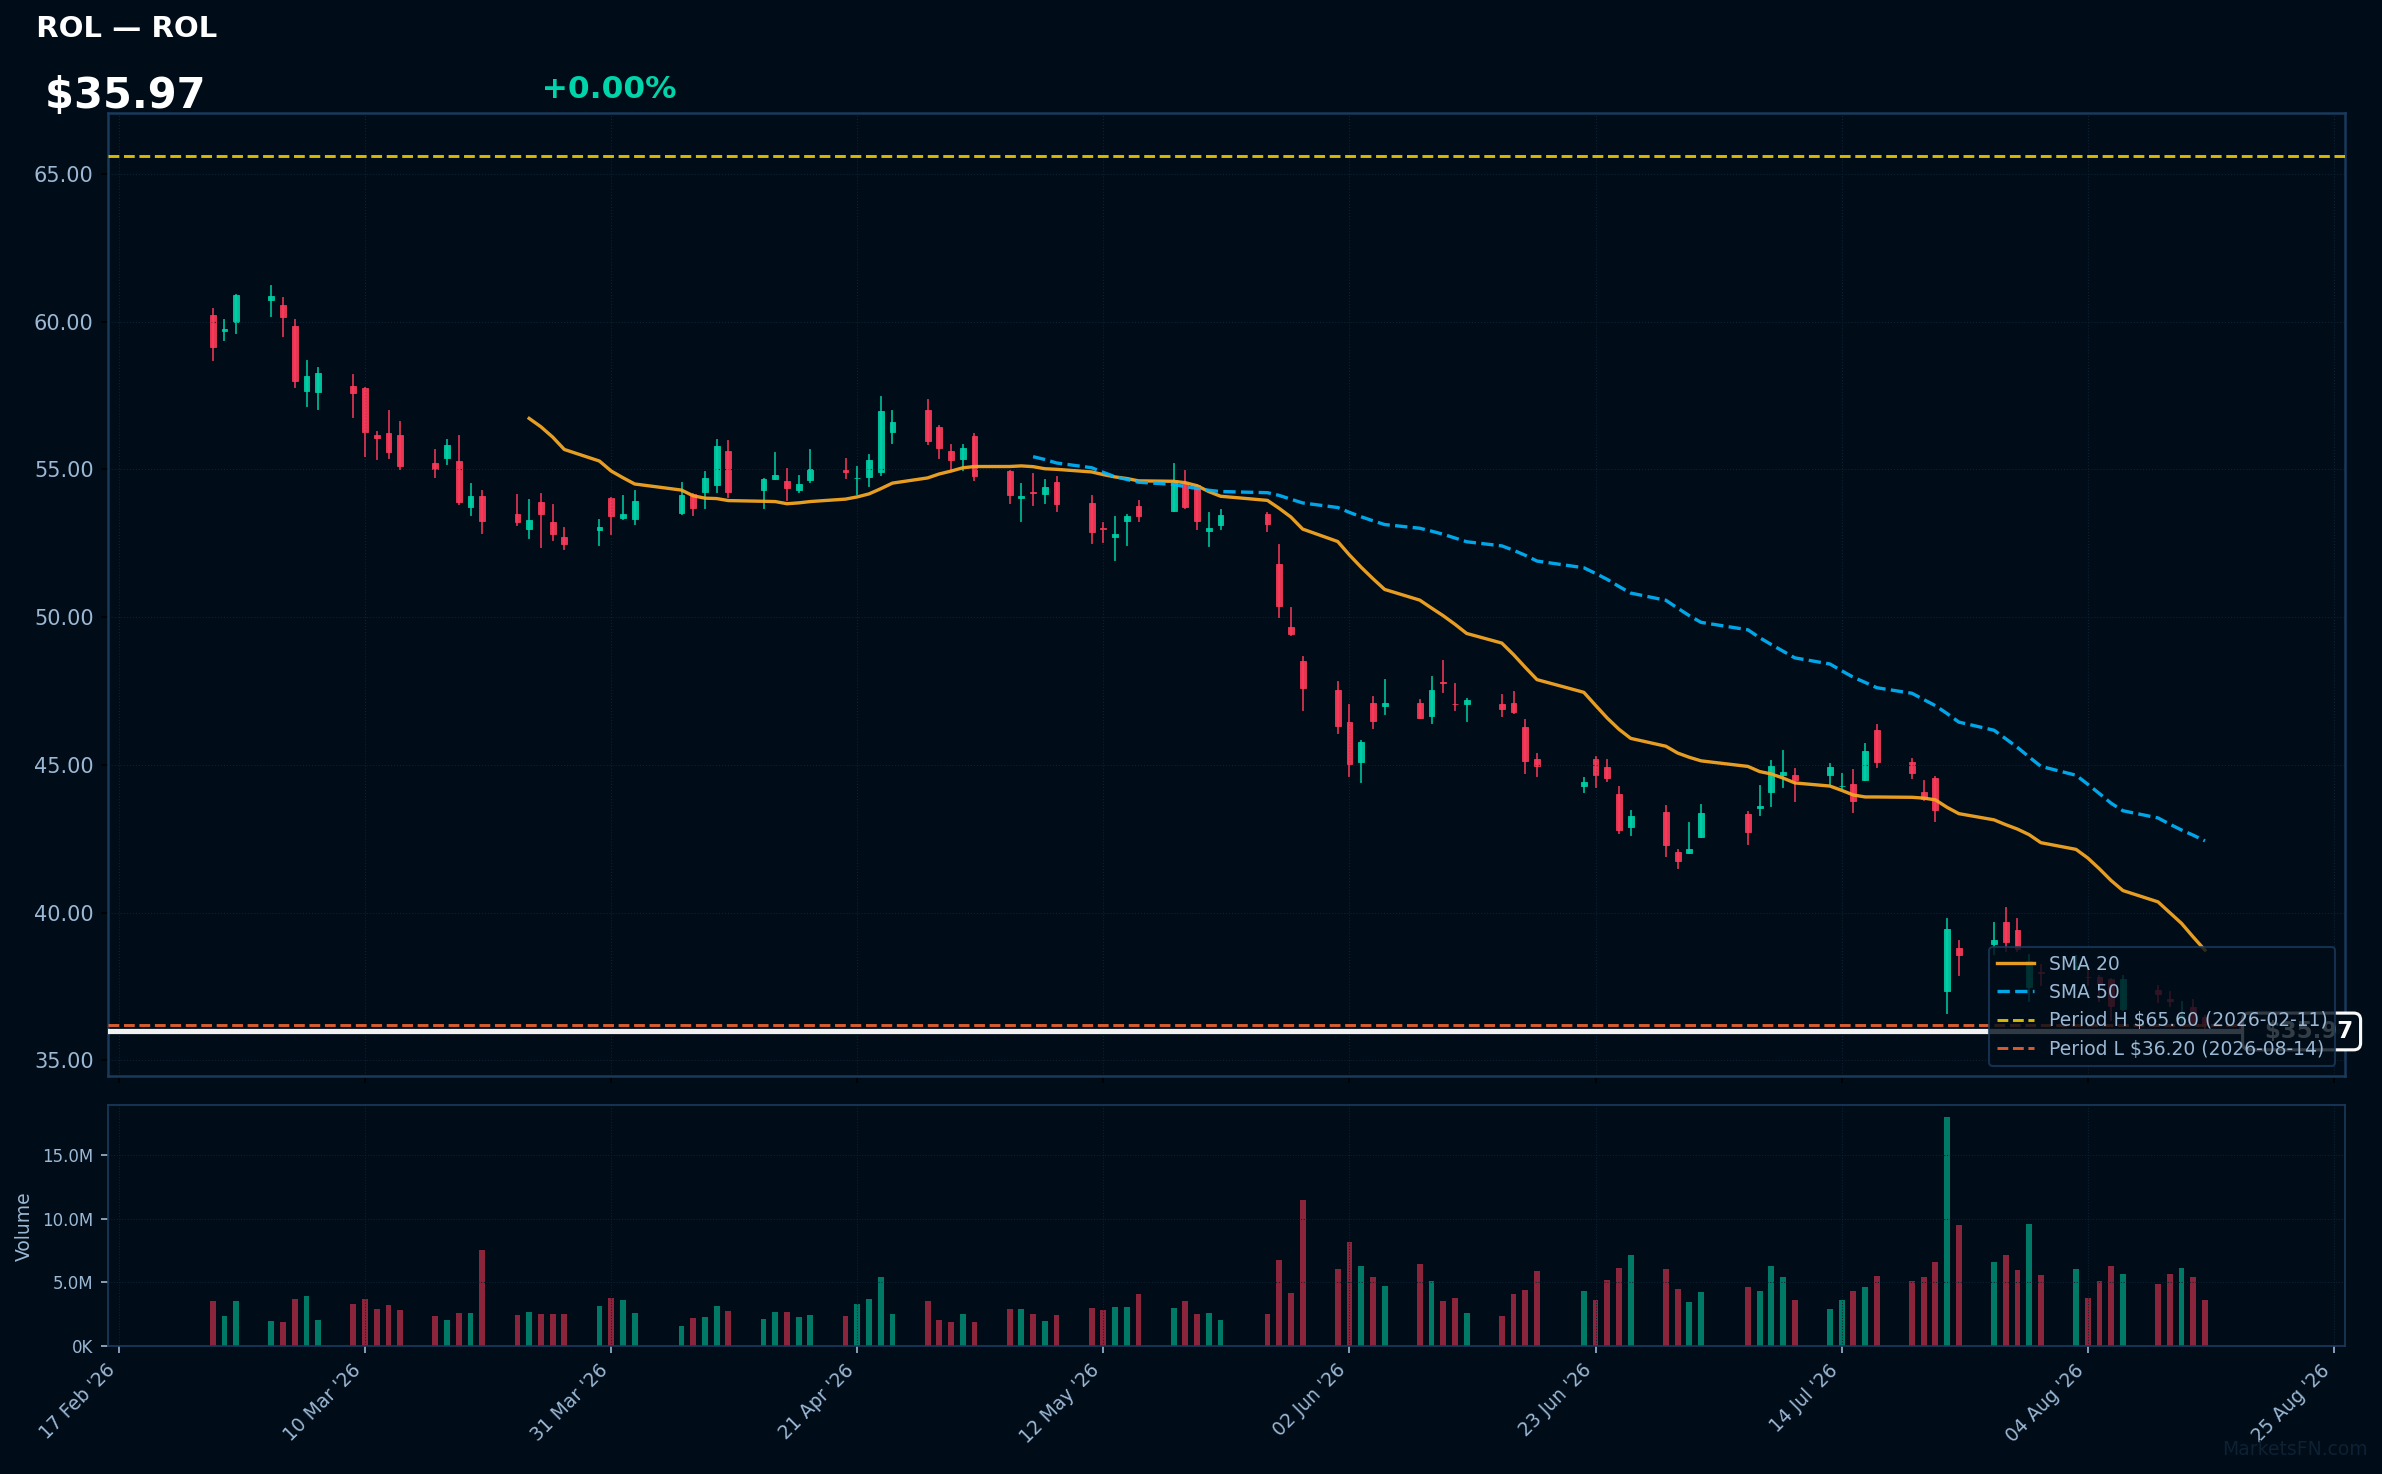
ROL | Rollins, Inc | Consumer Cyclical | Price Last: $36.20 | % Realized: -38.65% | RSI: 25.5 | % above MA200: -32.7% | Trend: Below MA20, MA50, MA200
Rollins, Inc. provides pest control services through its subsidiaries, focusing on residential and commercial markets. Investors should care due to its essential service nature, which can provide stability in economic downturns and growth opportunities in expanding markets.
The current technical situation signals a warning sign with an RSI(14) of 25.5, indicating oversold conditions, and a bearish MA alignment: price < MA20 < MA50 < MA200, reflecting a sustained downtrend.
Related headlines
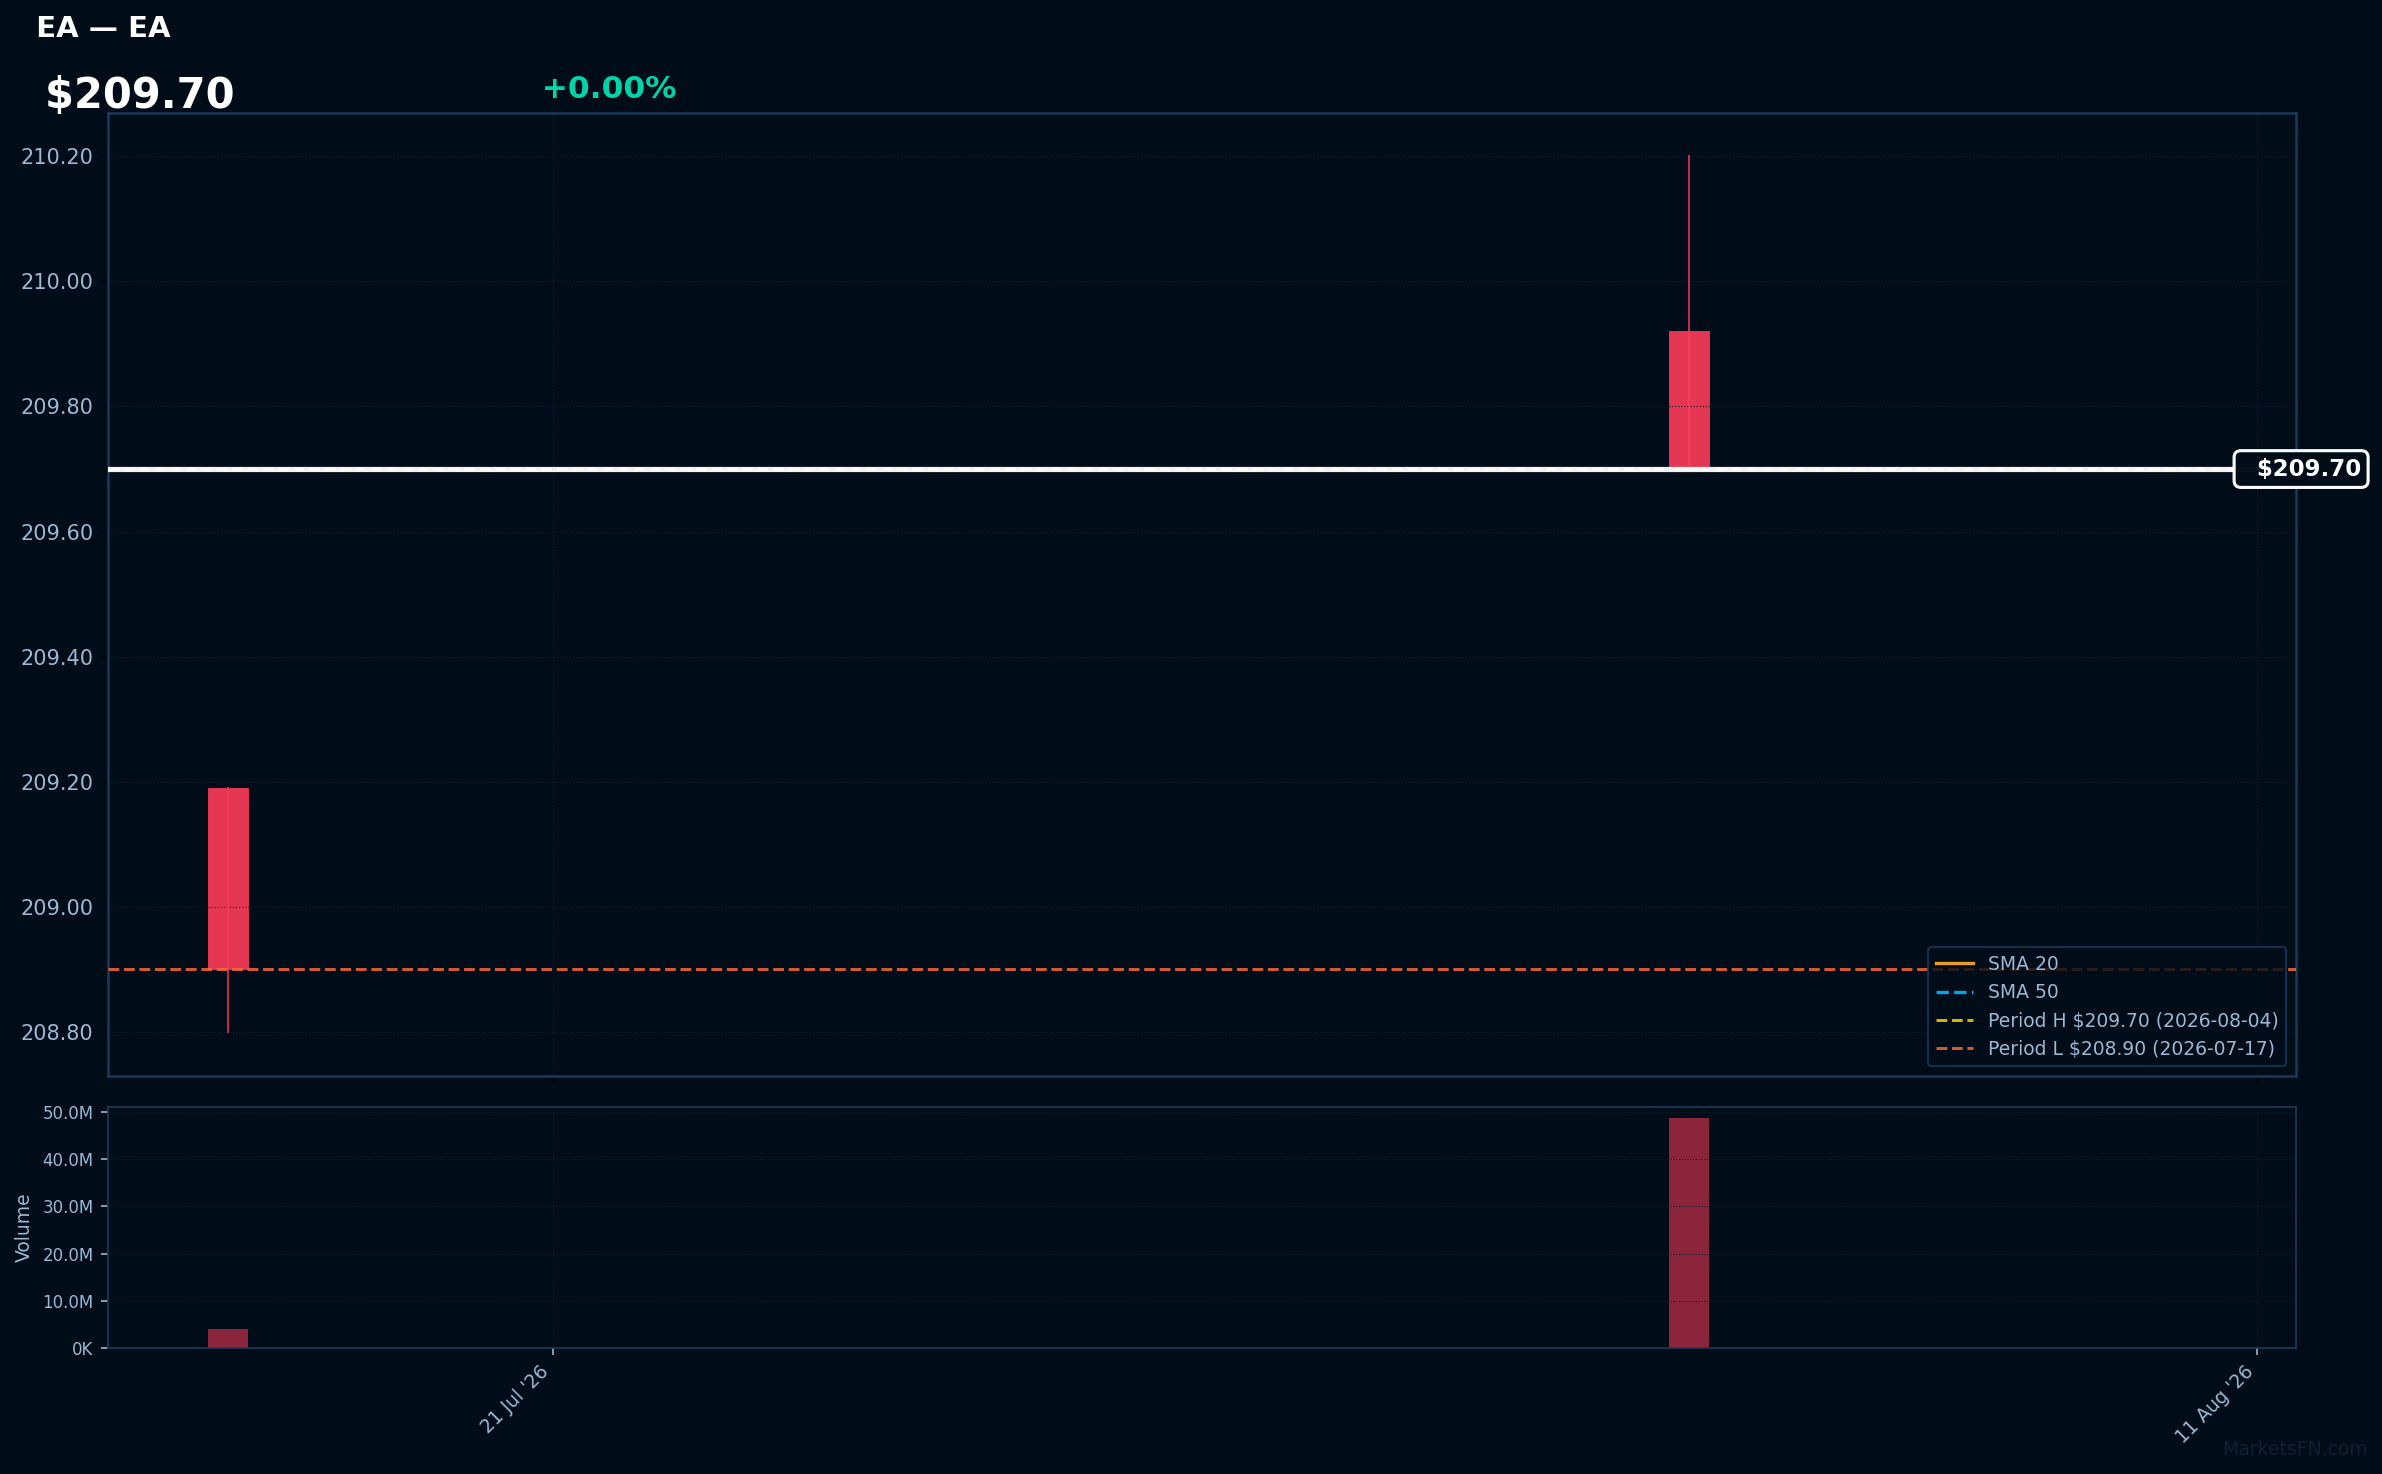
EA | Electronic Arts, Inc | Communication Services | Price Last: $209.70 | % Realized: +0.38% | RSI: — | % above MA200: — | Trend: —
Electronic Arts, Inc. develops and publishes interactive software and video games, including popular franchises like FIFA and Madden NFL. Investors should care due to its strong market position and potential for growth in the gaming industry, particularly with ongoing trends in digital gaming and esports.
The stock is 0.0% below its 2026 YTD high, indicating a potential breakout level. However, RSI(14) data is N/A and MA alignment is incomplete, limiting the assessment of momentum or fundamental strength.
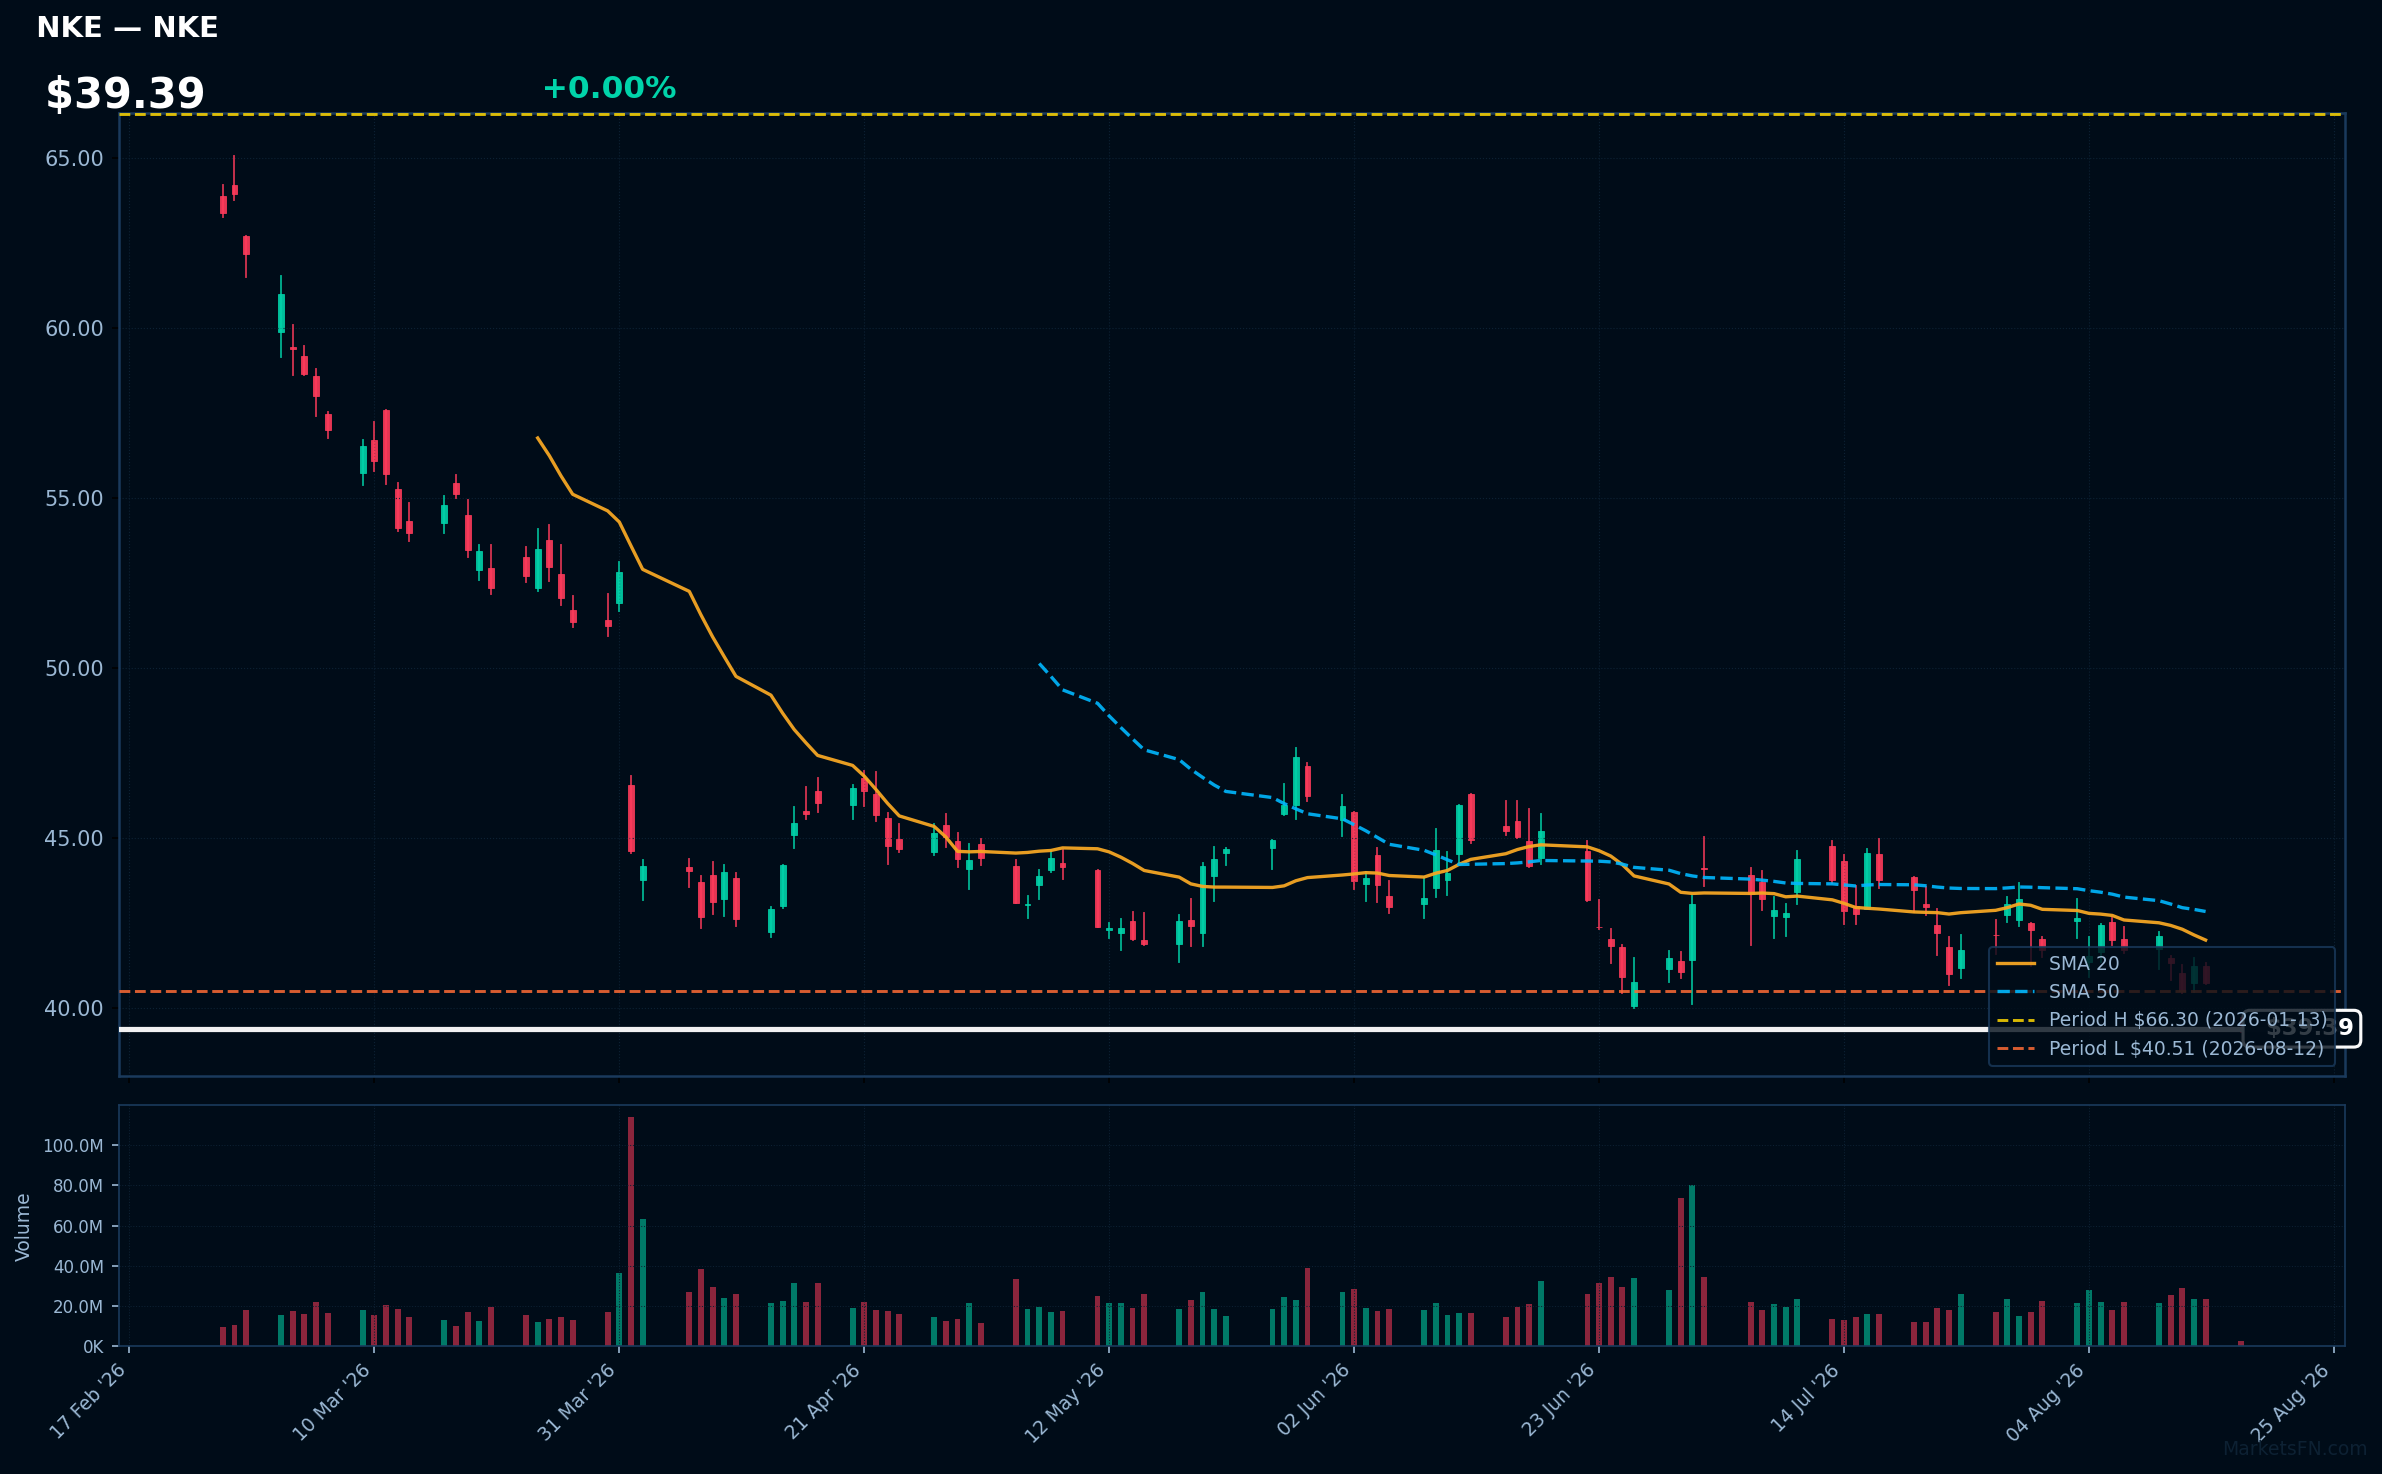
NKE | Nike, Inc | Consumer Cyclical | Price Last: $40.73 | % Realized: -35.64% | RSI: 36.7 | % above MA200: -23.3% | Trend: Below MA20, MA50, MA200
Nike, Inc. designs, develops, and markets athletic footwear, apparel, and equipment. Investors should care due to its strong brand presence and innovation in sportswear, which can drive consumer demand and revenue growth.
The current technical situation indicates a bearish trend with an RSI of 36.7 and a MA alignment of price < MA20 < MA50 < MA200, signaling potential further declines.
Related headlines
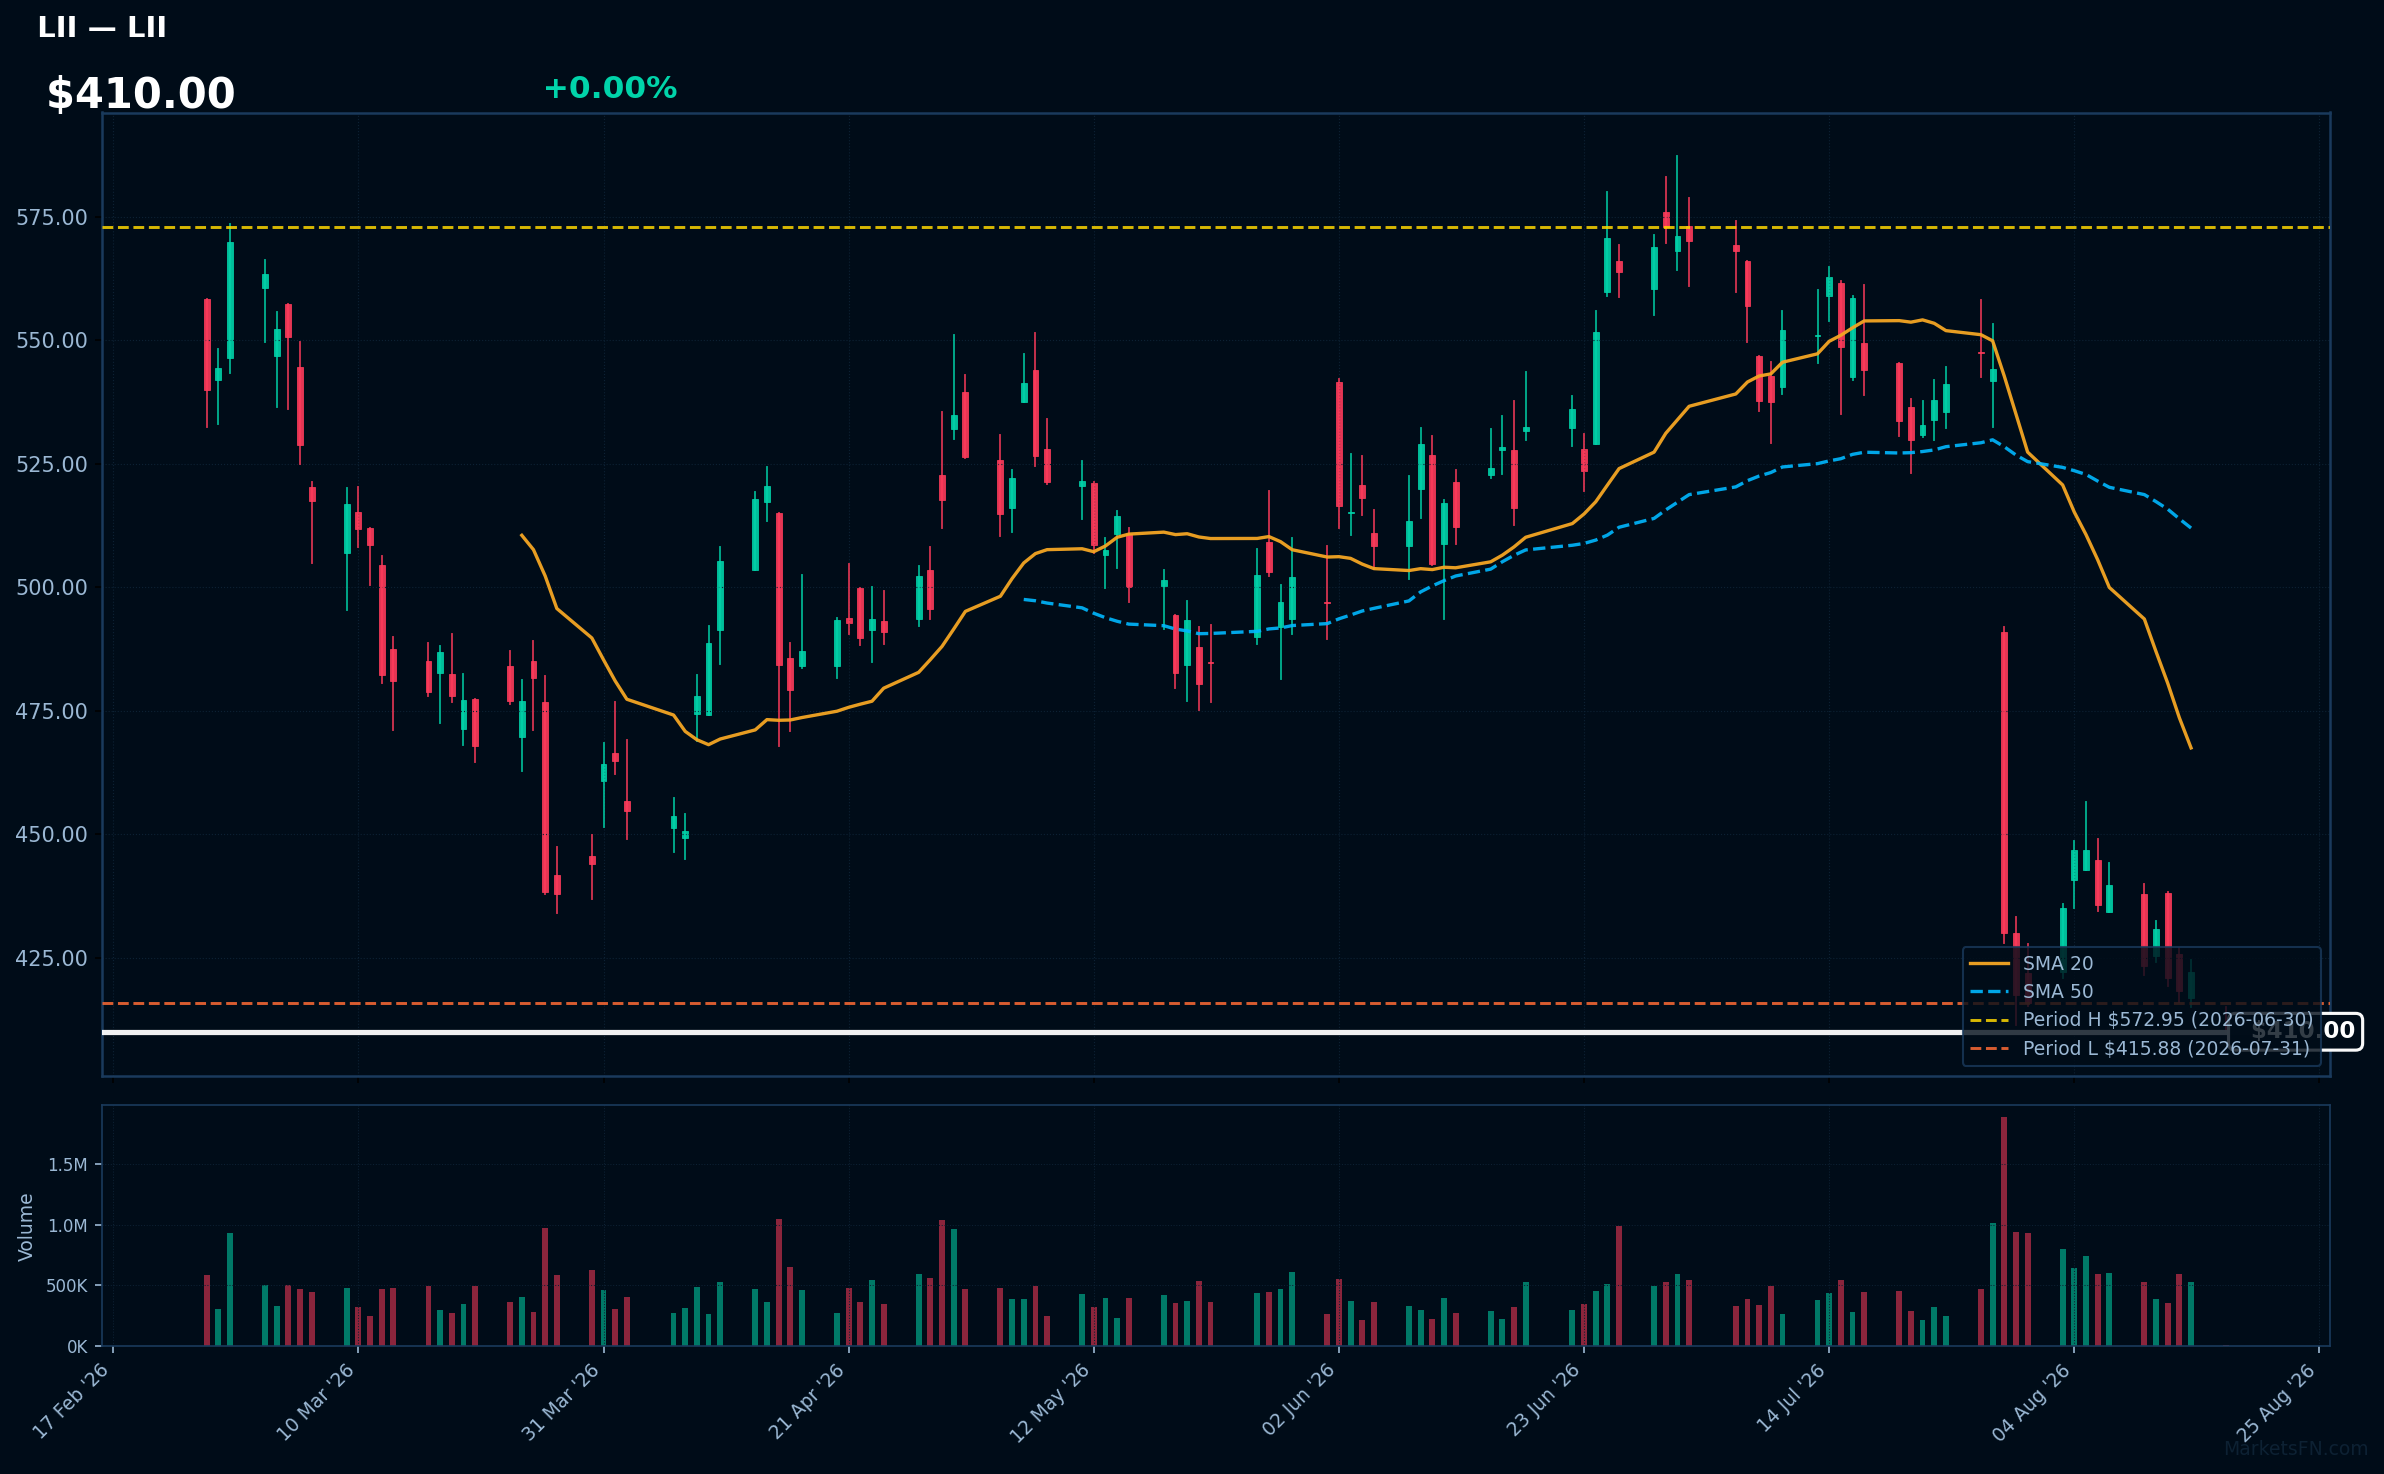
LII | Lennox International Inc | Industrials | Price Last: $422.01 | % Realized: -15.41% | RSI: 30.0 | % above MA200: -16.4% | Trend: Below MA20, MA50, MA200
Lennox International Inc designs and manufactures heating, ventilation, air conditioning, and refrigeration systems. Investors should care due to its significant role in energy-efficient climate control solutions, which are increasingly vital in a world focused on sustainability and reducing carbon footprints.
The current technical situation shows mixed signals with an RSI(14) of 30.0, indicating potential oversold conditions. The stock is below MA20/MA50/MA200 and is only 1.5% above its 2026 YTD low, testing major support.
Related headlines
Market Commentary
The proximity of certain S&P 500 stocks to their 2026 year-to-date extremes indicates significant market volatility and investor sentiment. Stocks like Merck & Co Inc (MRK), Charles Schwab Corp (SCHW), PNC Financial Services Group Inc (PNC), U.S. Bancorp (USB), and PayPal Holdings Inc (PYPL) are all at 0.0% from their highs, suggesting strong bullish momentum. Conversely, stocks such as Monster Beverage Corp (MNST) and Rollins, Inc (ROL) are only slightly above their lows, reflecting bearish pressure and potential challenges in their respective sectors.
The current market conditions are influenced by various sector themes, including financial services and technology, which are represented by the high-performing stocks. The stability of financial institutions like PNC and USB may indicate investor confidence in the sector, while the technology sector's volatility, as seen with PayPal, suggests ongoing adjustments to changing consumer behaviors and regulatory environments. The low-performing stocks, particularly in consumer discretionary, may be facing headwinds from shifting market dynamics and economic uncertainties.
Investors should closely monitor upcoming earnings reports and economic indicators that could impact these stocks. Additionally, trends in interest rates and inflation will be crucial in determining the sustainability of the current market conditions. Keeping an eye on sector-specific news and broader economic developments will be essential for making informed investment decisions moving forward.
Methodology: All 503 S&P 500 constituents screened. Close prices downloaded from 2026-01-01. Period high = highest close since Jan 1 2026; period low = lowest close since Jan 1 2026. Distance = (current price / period extreme − 1) × 100. Technical indicators computed on up to 1 year of daily OHLCV data.
Disclaimer: For informational purposes only. Not investment advice. Past performance is not indicative of future results.

