S&P 500 2026 YTD Highs & Lows Radar: Unitedhealth (UNH), International Business Machines (IBM) and more
MarketsFN Team

S&P 500 2026 YTD Highs & Lows Radar: Unitedhealth (UNH), International Business Machines (IBM) and more
Screening all 503 S&P 500 constituents for stocks nearest to their 2026 year-to-date high and their 2026 YTD low. Data as of July 22, 2026. % Realized = total return since Jan 1 2026.
Legend: RSI > 70 = overbought · RSI < 30 = oversold · Green % Realized = positive YTD return · Red = negative.
📈 Nearest to 2026 High
Sectors represented: Healthcare (2), Real Estate (1), Financial (1), Energy (1)
| Ticker | Company | Sector | Price Last | % Realized | 2026 YTD High Date | RSI | % above MA200 | Trend |
|---|---|---|---|---|---|---|---|---|
| UNH | Unitedhealth Group Inc | Healthcare | $436.35 | +29.71% | 2026-07-21 | 61.5 | +27.3% | Above MA20, MA50, MA200 |
| WELL | Welltower Inc | Real Estate | $246.37 | +31.79% | 2026-07-21 | 70.5 | +22.2% | Above MA20, MA50, MA200 |
| CVS | CVS Health Corp | Healthcare | $110.60 | +38.03% | 2026-07-21 | 71.2 | +32.4% | Above MA20, MA50, MA200 |
| TRV | Travelers Companies Inc | Financial | $369.63 | +29.61% | 2026-07-21 | 75.2 | +24.6% | Above MA20, MA50, MA200 |
| MPC | Marathon Petroleum Corp | Energy | $319.76 | +93.63% | 2026-07-21 | 81.0 | +47.0% | Above MA20, MA50, MA200 |
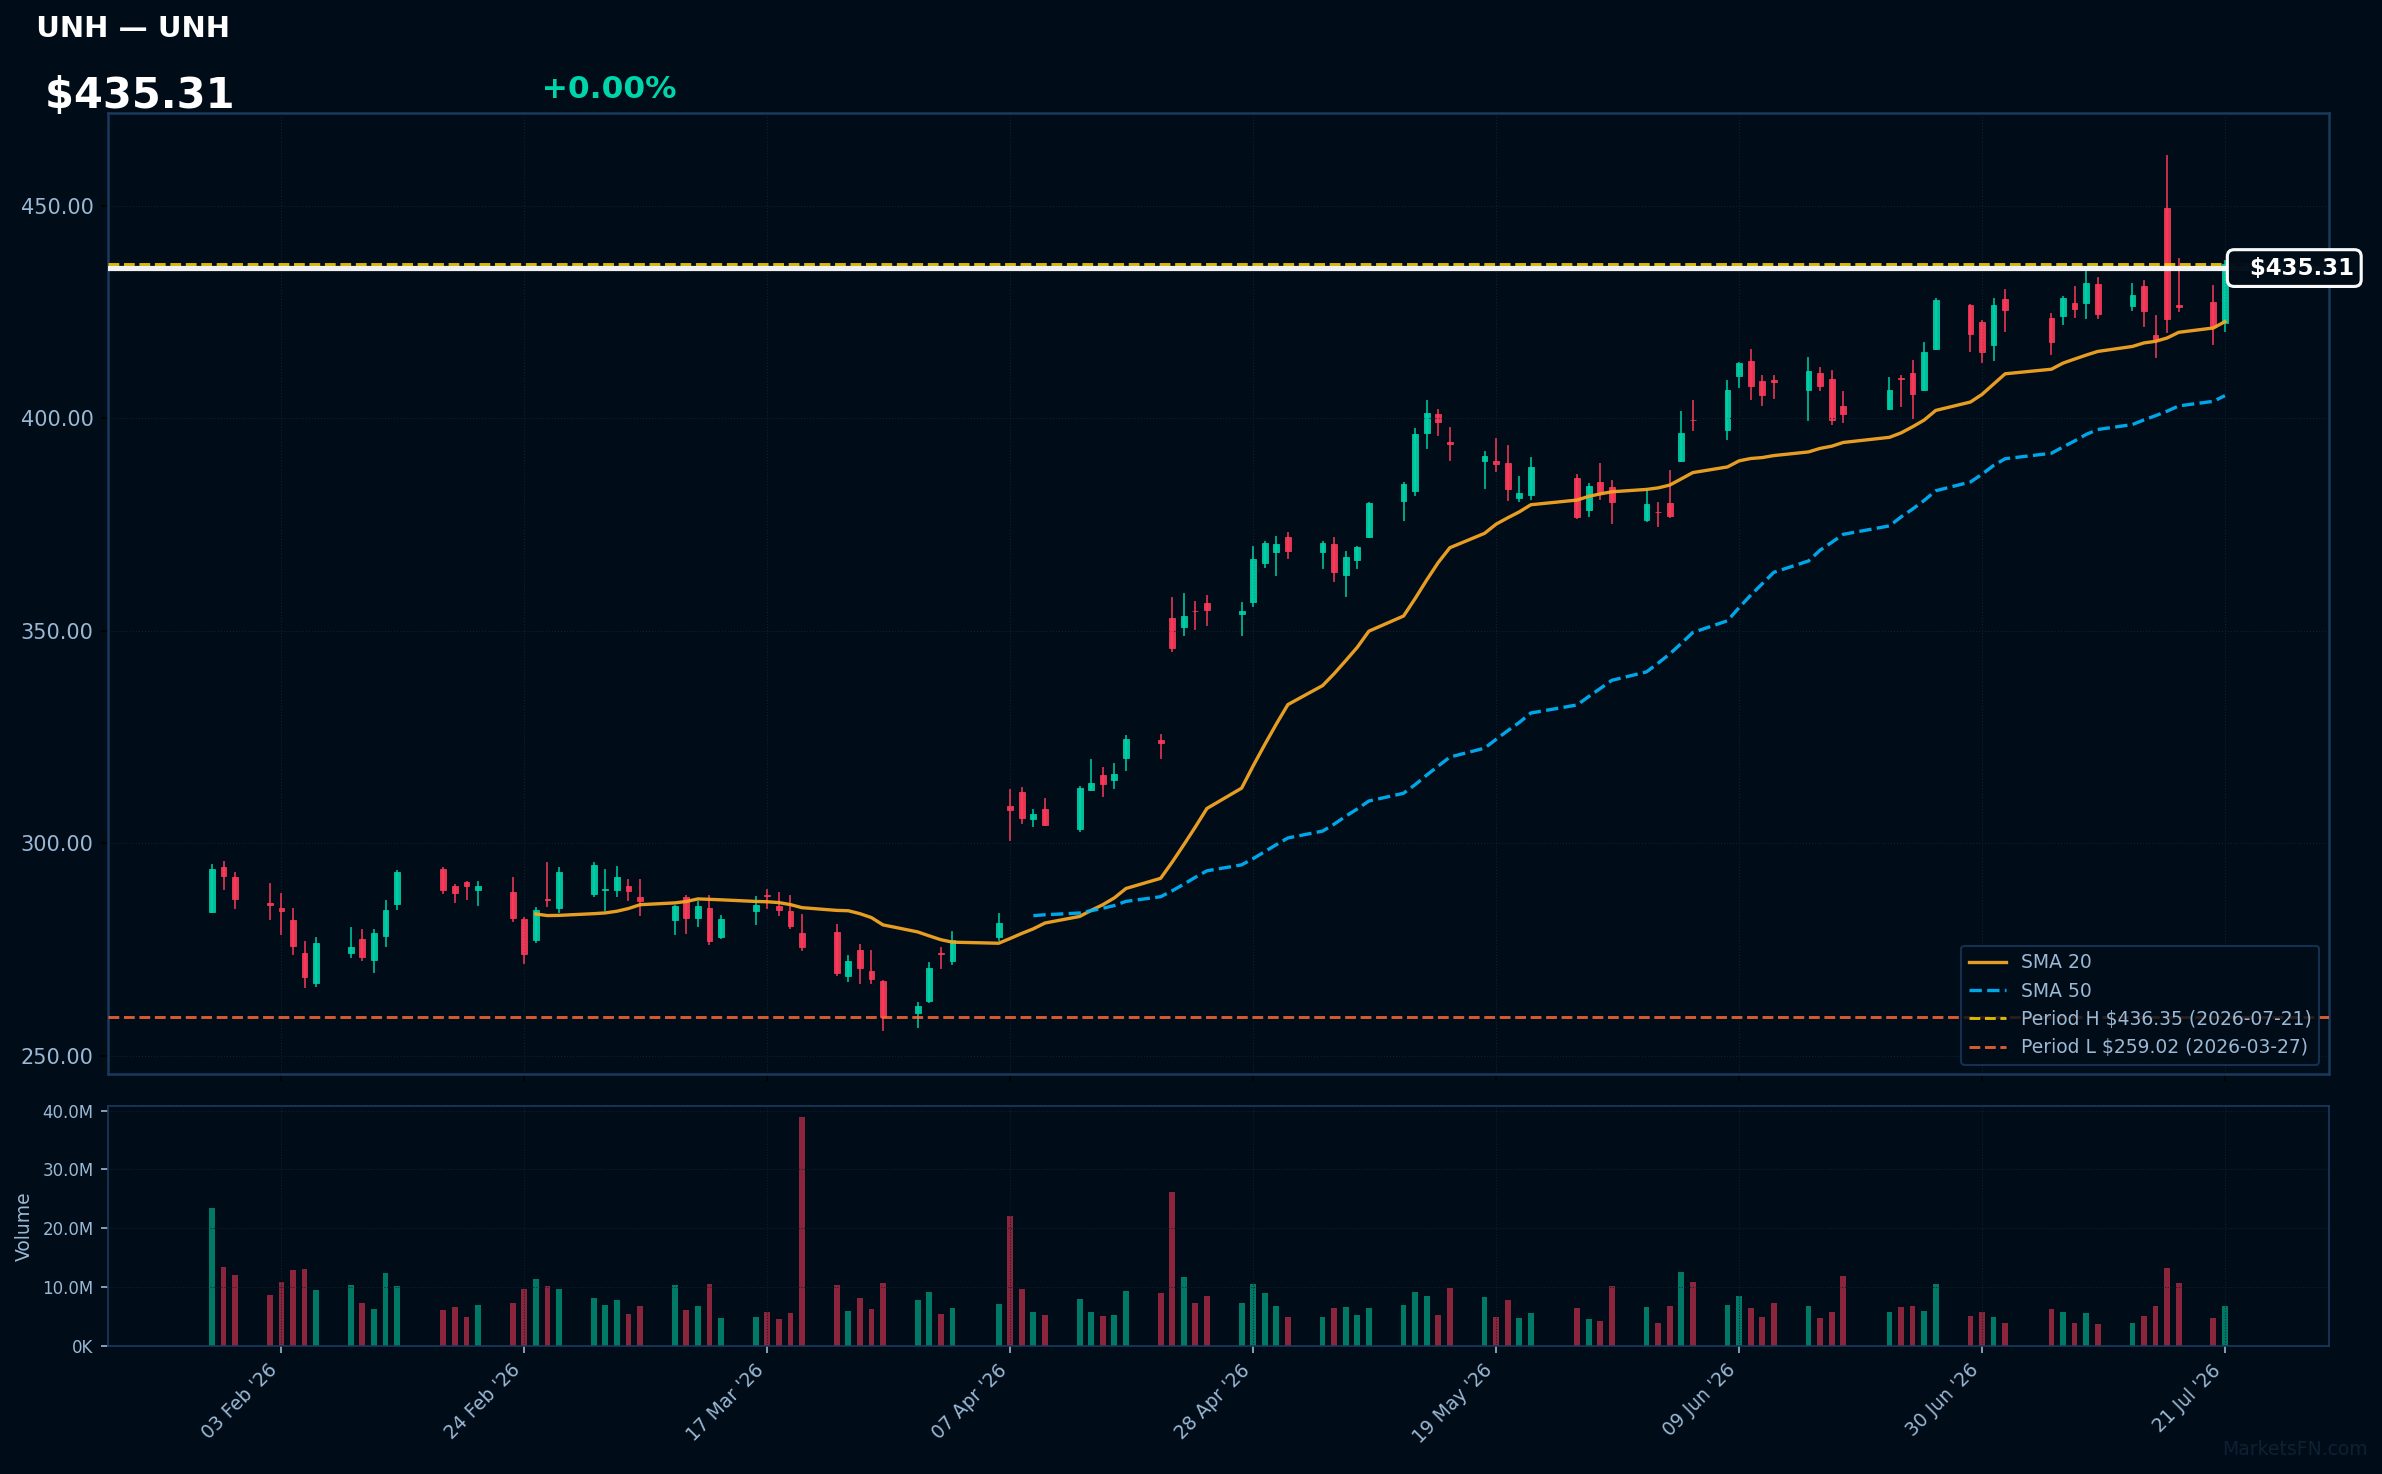
UNH | Unitedhealth Group Inc | Healthcare | Price Last: $436.35 | % Realized: +29.71% | RSI: 61.5 | % above MA200: +27.3% | Trend: Above MA20, MA50, MA200
Unitedhealth Group Inc operates health insurance and healthcare services businesses, with a diversified revenue stream across individual and group health insurance, Medicare, and healthcare delivery. Investors should care about its dominant market position and potential for steady growth.
Unitedhealth Group Inc is in a sustained uptrend with price > MA20 > MA50 > MA200, RSI(14) at 61.5, and is 0.0% below its 2026 YTD high, indicating strong momentum with no immediate signs of reversal.
Related headlines
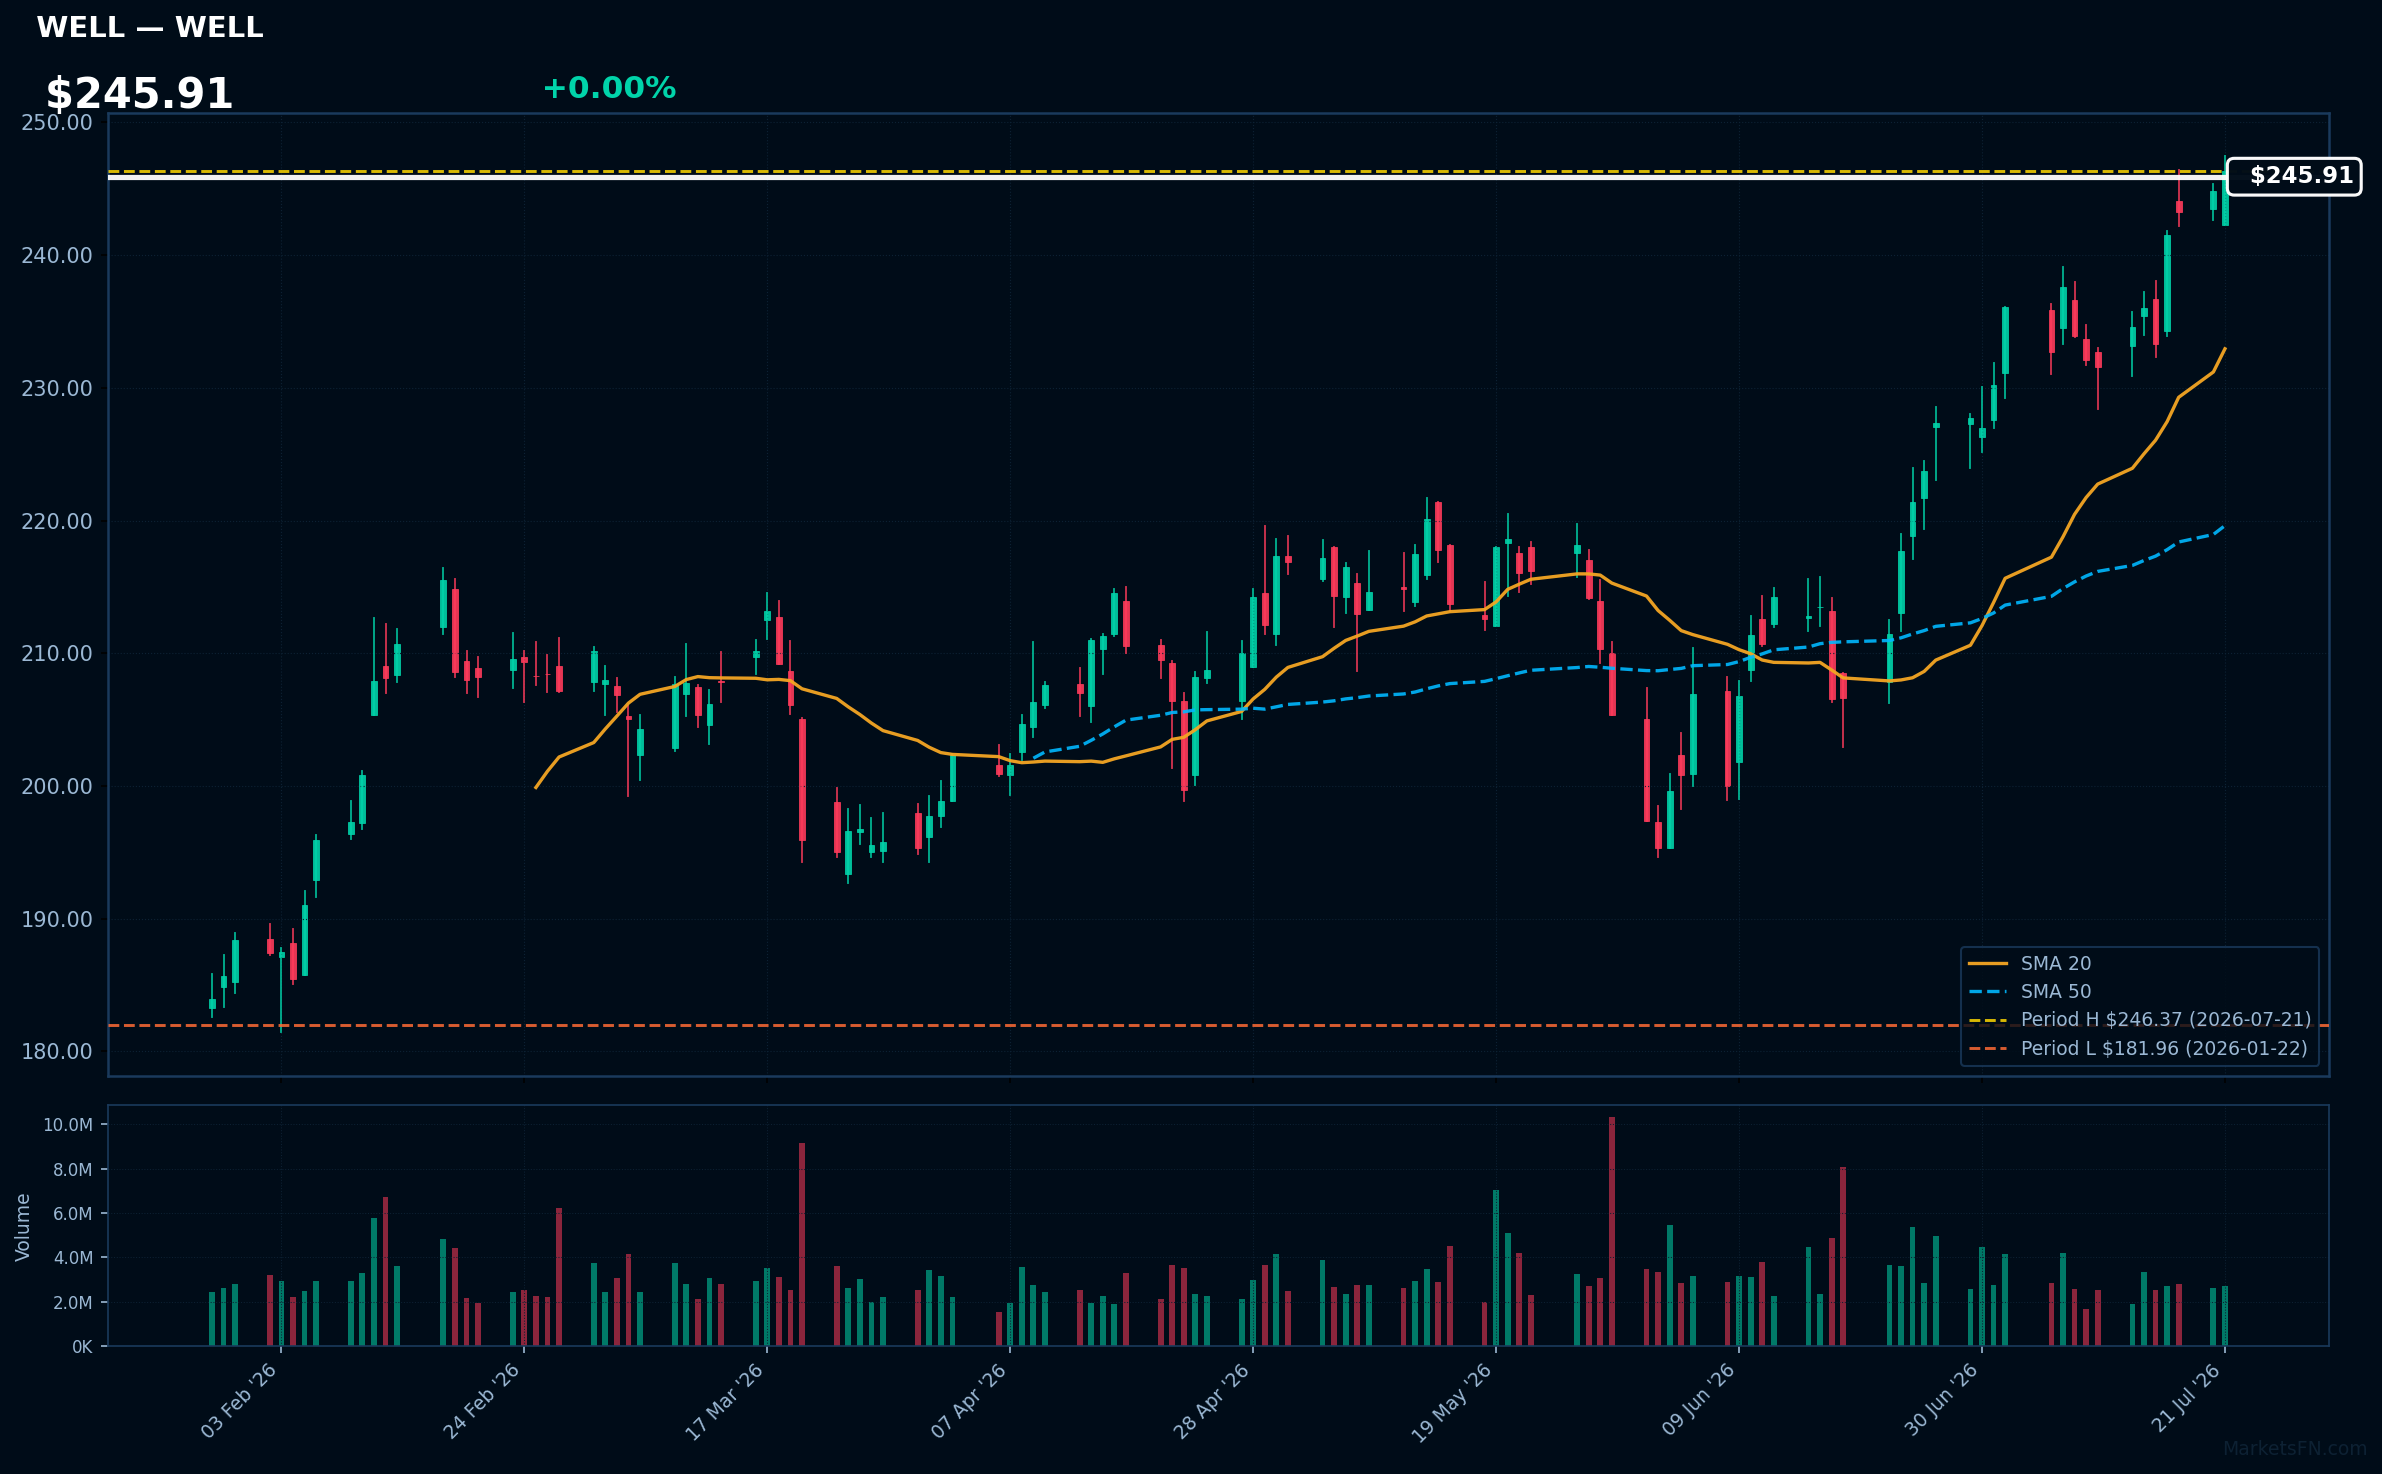
WELL | Welltower Inc | Real Estate | Price Last: $246.37 | % Realized: +31.79% | RSI: 70.5 | % above MA200: +22.2% | Trend: Above MA20, MA50, MA200
Welltower Inc (WELL) is a healthcare real estate investment trust that invests in seniors housing and medical office buildings. Investors should care because its portfolio is tied to the growing demand for healthcare services, driven by an aging population.
WELL's RSI(14) is 70.5, indicating strong momentum as it's above 70. The MA alignment is bullish with price > MA20 > MA50 > MA200, and it's 0.0% below its 2026 YTD high, suggesting a potential breakout.
Related headlines
- Welltower CFO Timothy McHugh sets U.S. pay record at $167M
- Welltower Announces Date of Second Quarter 2026 Earnings Release, Conference Call and Webcast
- Welltower's Dividend Is Up 15%. Here's What Really Matters.
- Welltower Board of Directors Approves 15% Increase in Quarterly Dividend to $0.85 per Share
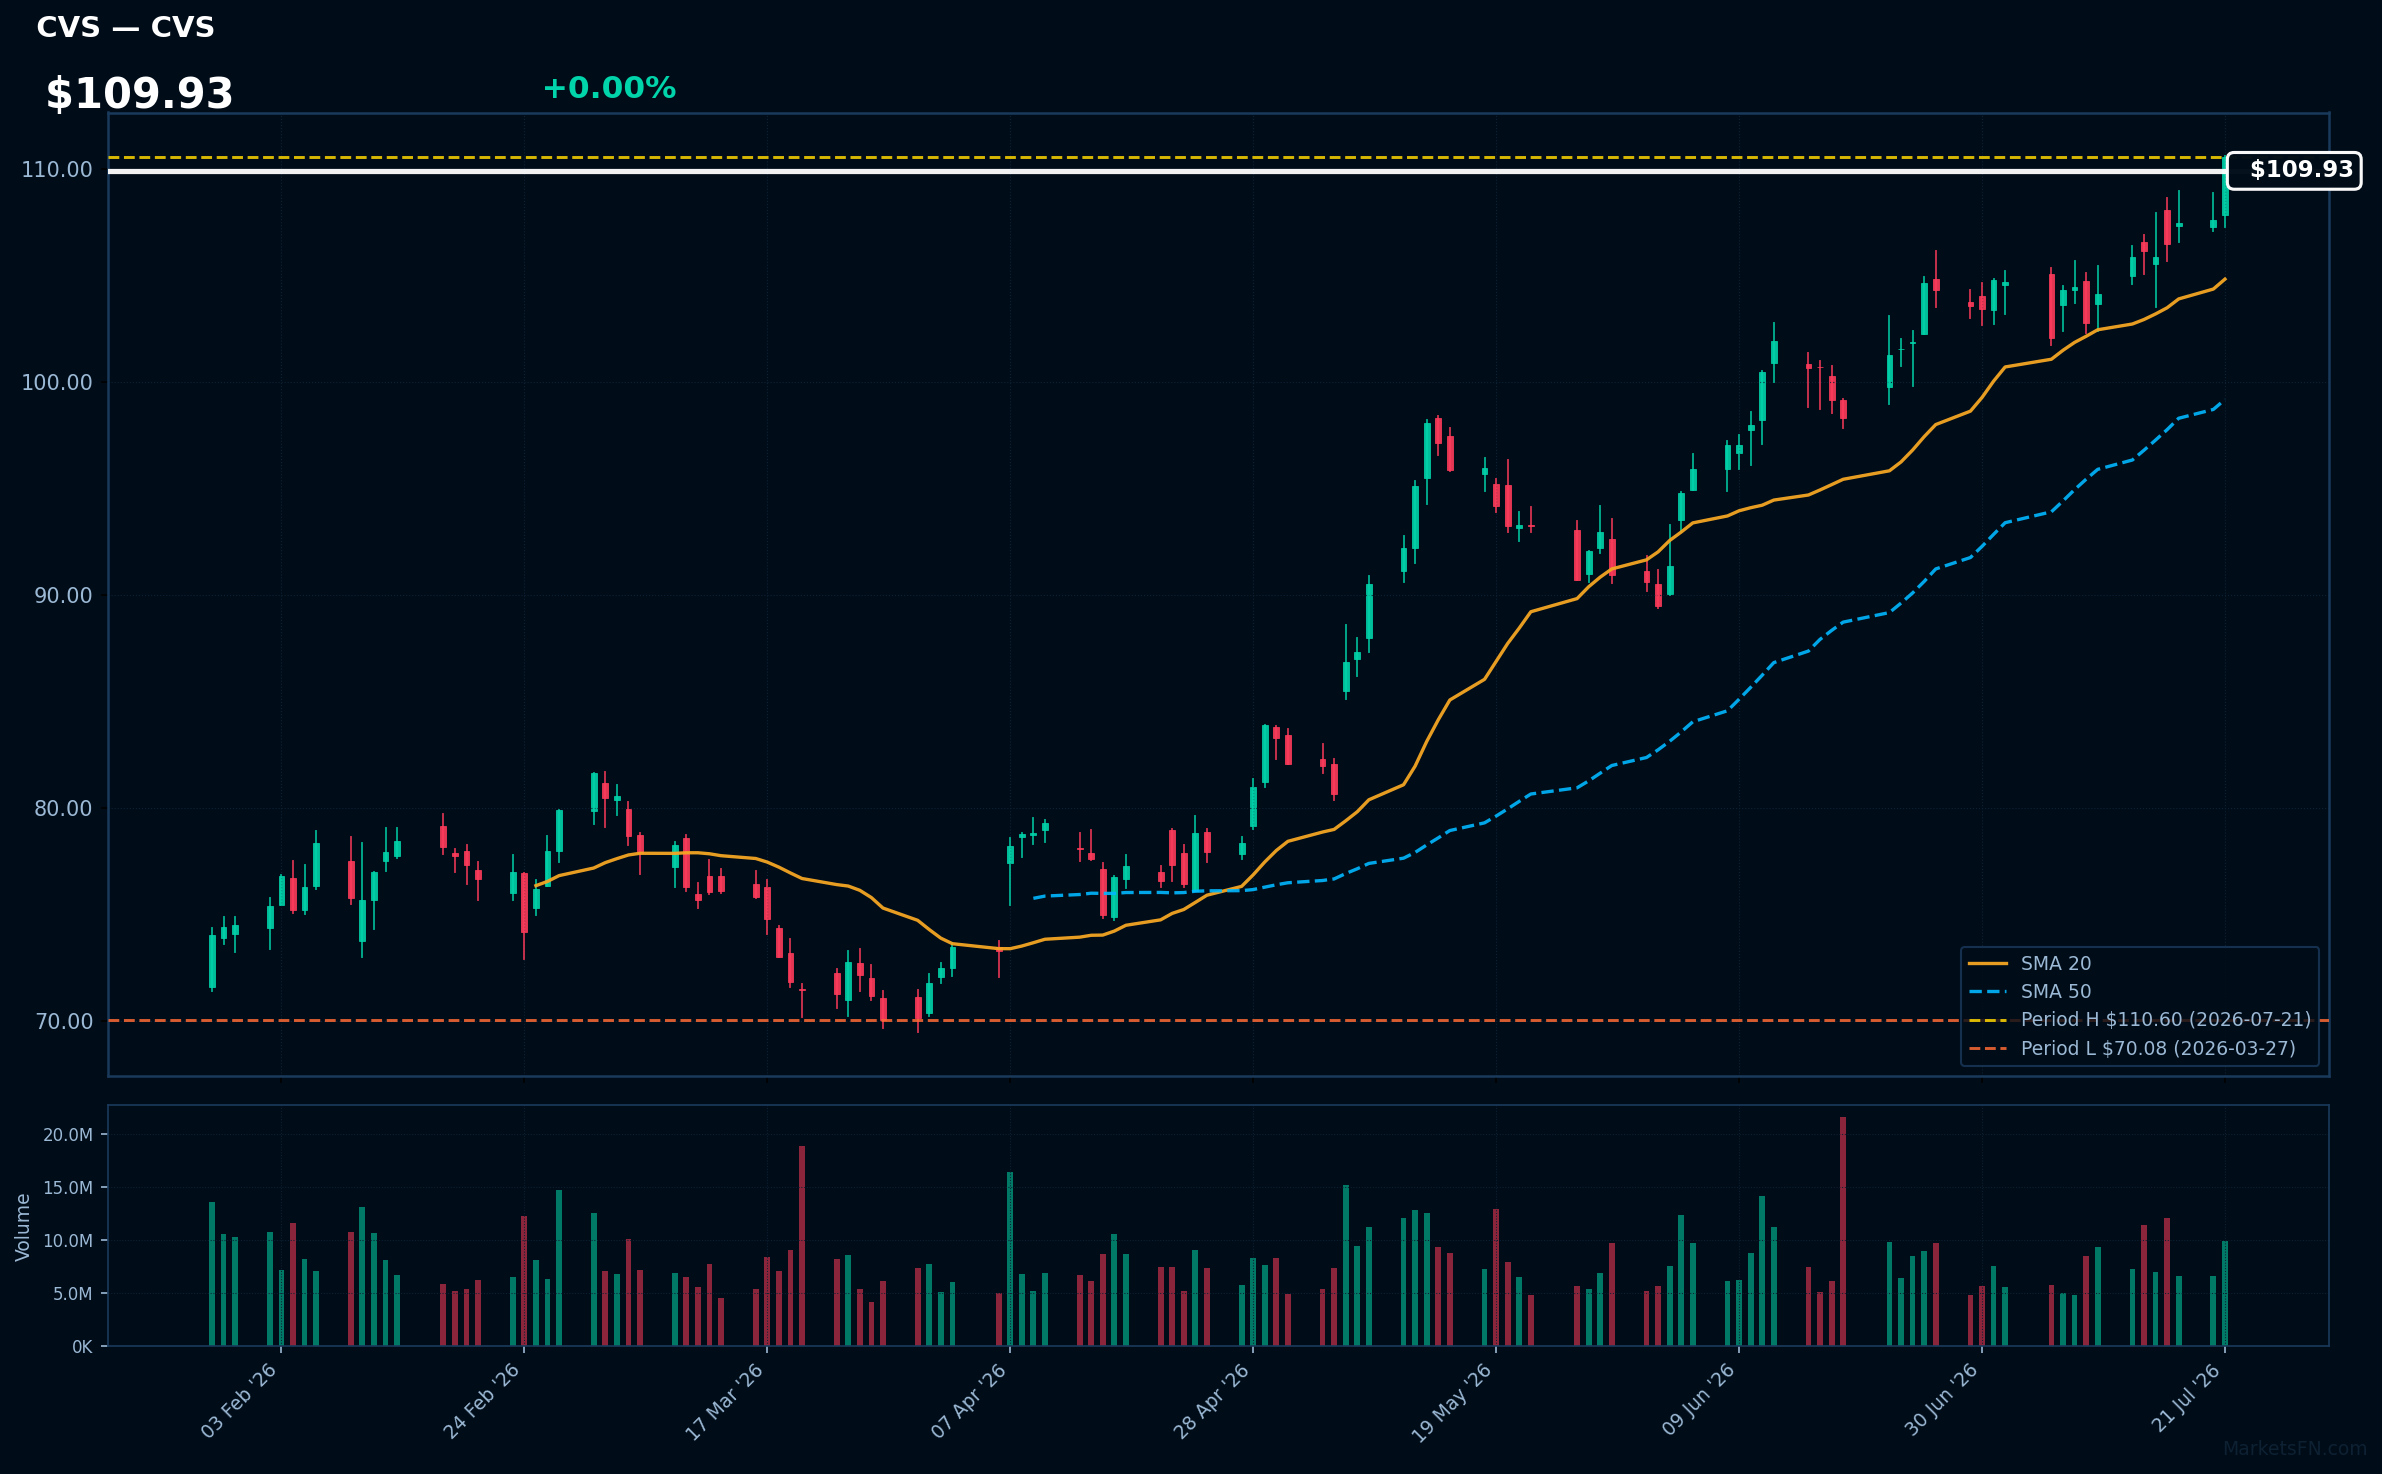
CVS | CVS Health Corp | Healthcare | Price Last: $110.60 | % Realized: +38.03% | RSI: 71.2 | % above MA200: +32.4% | Trend: Above MA20, MA50, MA200
CVS Health Corp operates a large pharmacy chain and health insurance business, making it a significant player in healthcare services and insurance; investors should care because its performance can indicate broader healthcare sector trends and insurance market dynamics.
CVS is in a sustained uptrend with price > MA20 > MA50 > MA200, RSI(14) at 71.2, and is 0.0% below its 2026 YTD high, indicating strong momentum; the high RSI value may be a warning sign of overbought conditions.
Related headlines
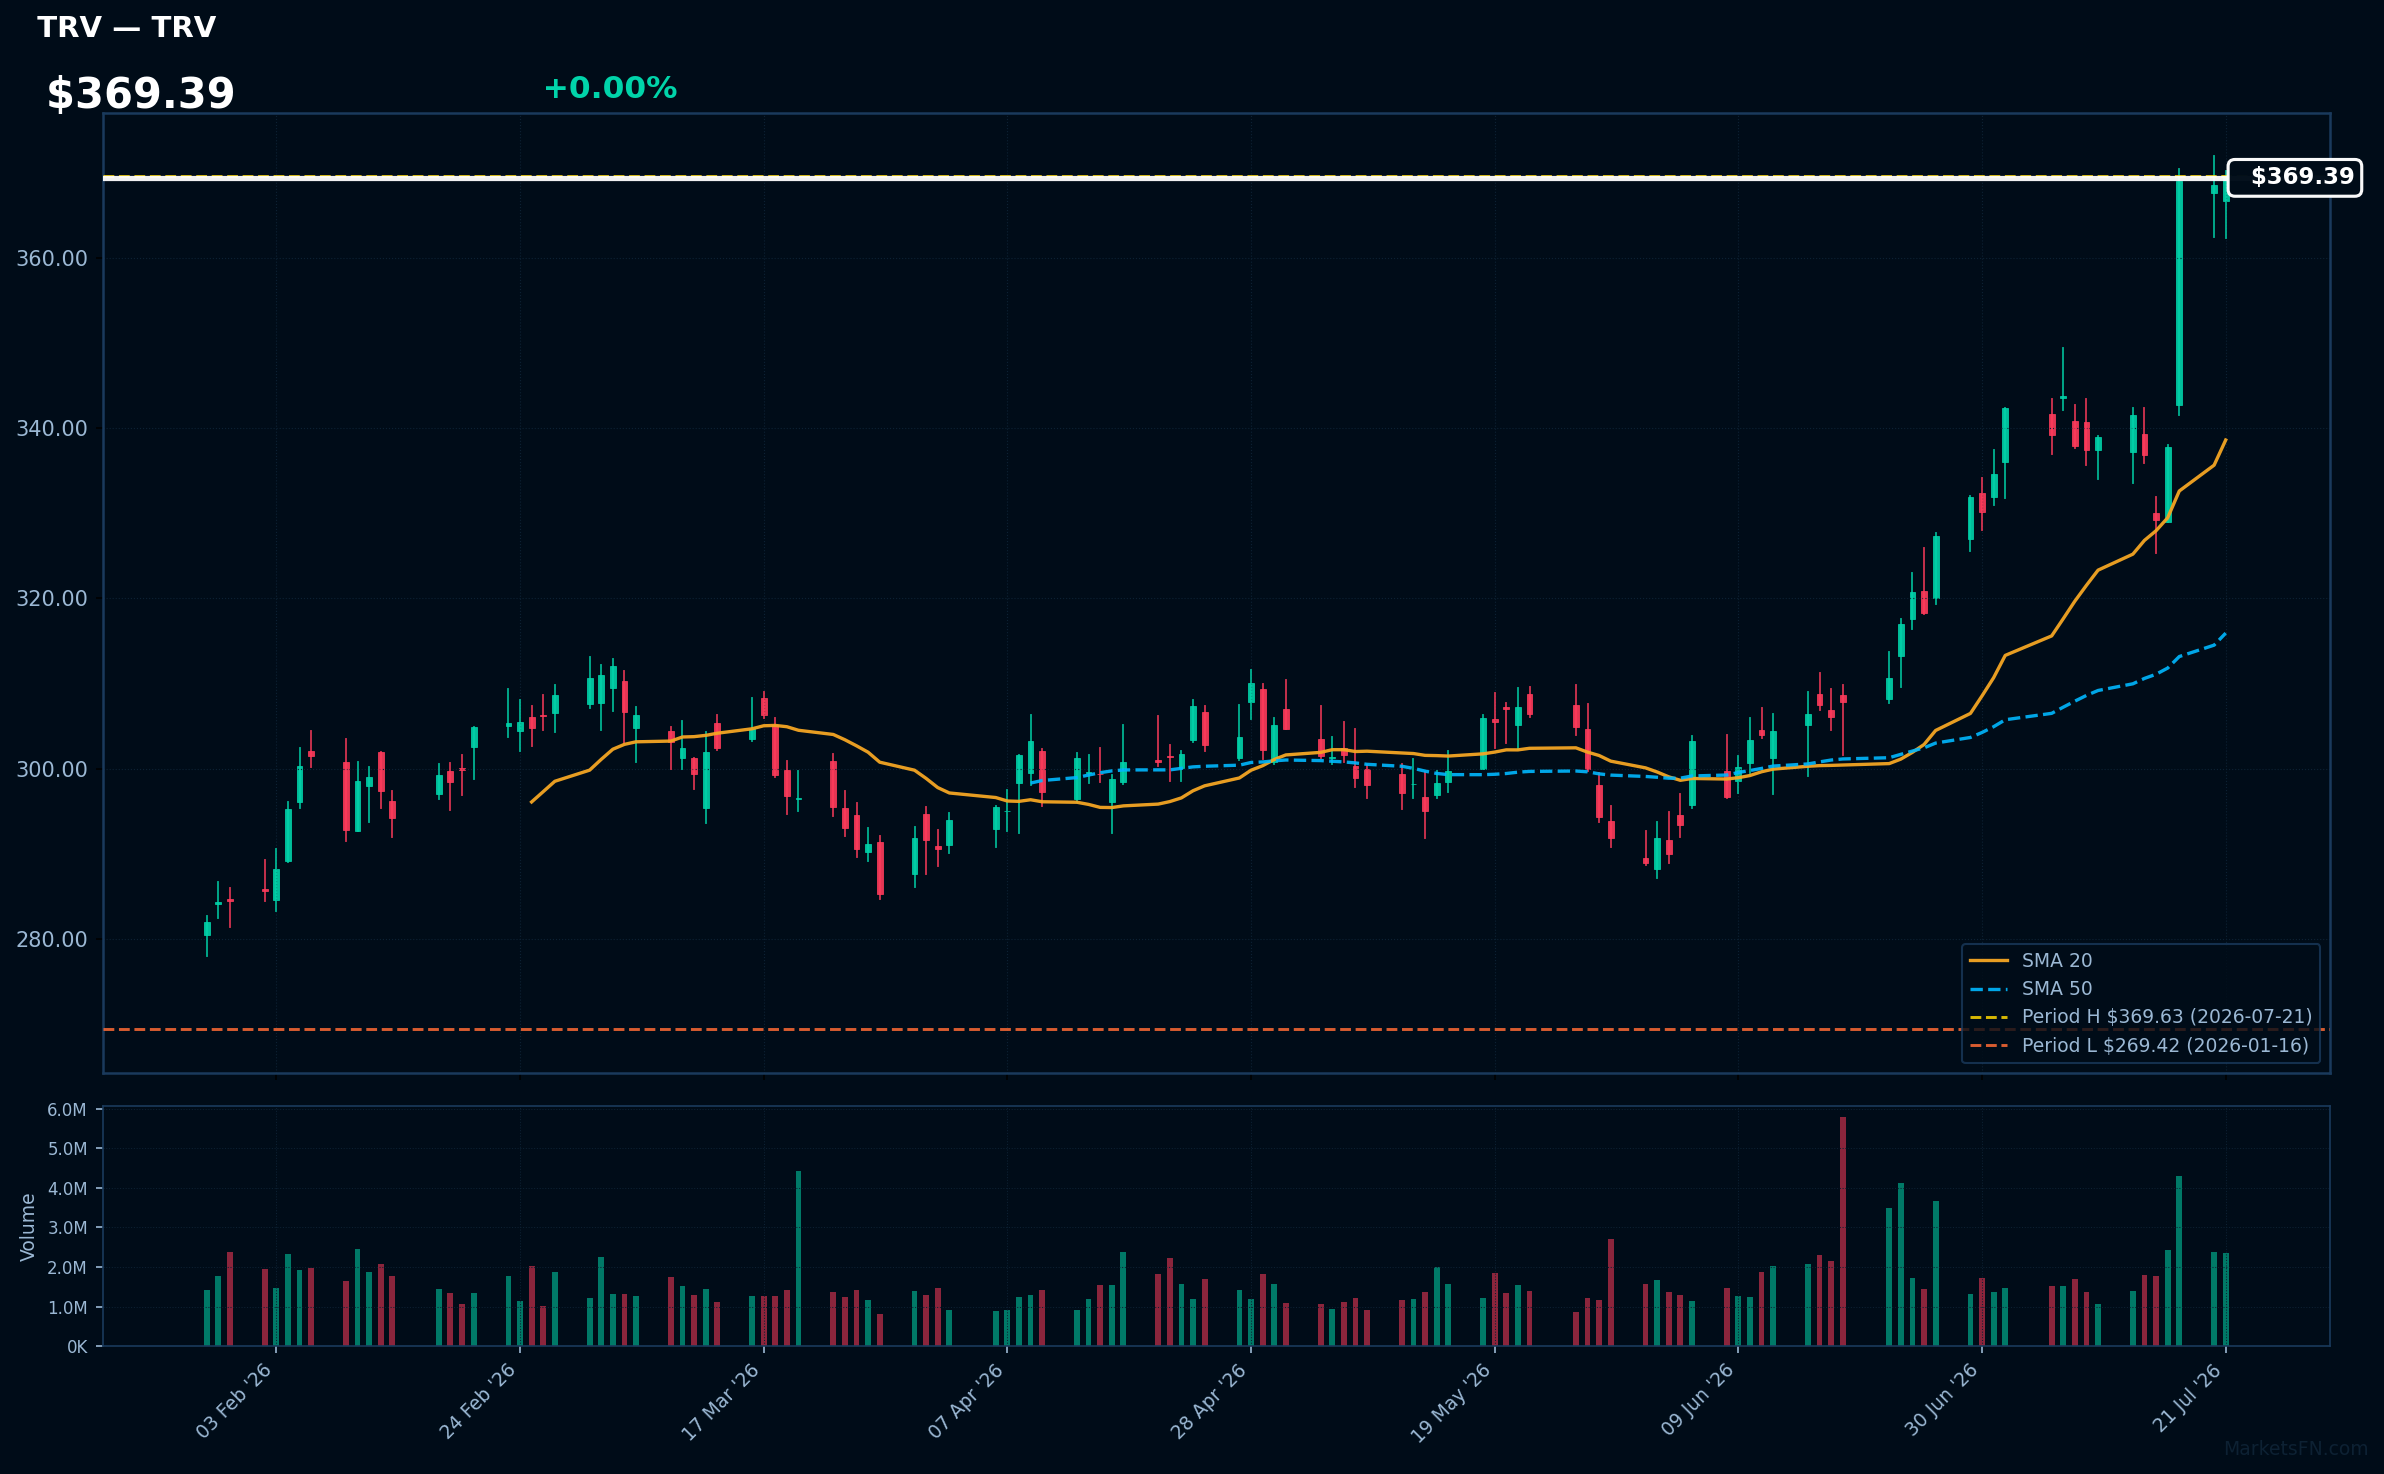
TRV | Travelers Companies Inc | Financial | Price Last: $369.63 | % Realized: +29.61% | RSI: 75.2 | % above MA200: +24.6% | Trend: Above MA20, MA50, MA200
Travelers Companies Inc (TRV) is a property casualty insurer providing various insurance products. Investors should care because its performance reflects the overall insurance market's health and its ability to manage risk, impacting its stock performance.
TRV's RSI(14) is 75.2, indicating strong momentum. The MA alignment (price > MA20 > MA50 > MA200) suggests a sustained uptrend. With the stock 0.0% below its 2026 YTD high, it nears a potential breakout level, reinforcing the bullish technical situation.
Related headlines
- Why Did ATAI, PANW, TRV Stocks Surge To 52-Week Highs Last Week?
- The Travelers Companies Inc (TRV) Q2 2026 Earnings Call Highlights: Robust Growth and Strategic ...
- Travelers Cos. Inc. stock outperforms competitors on strong trading day
- Travelers shares rise after Q2 earnings crush estimates on lower catastrophe losses
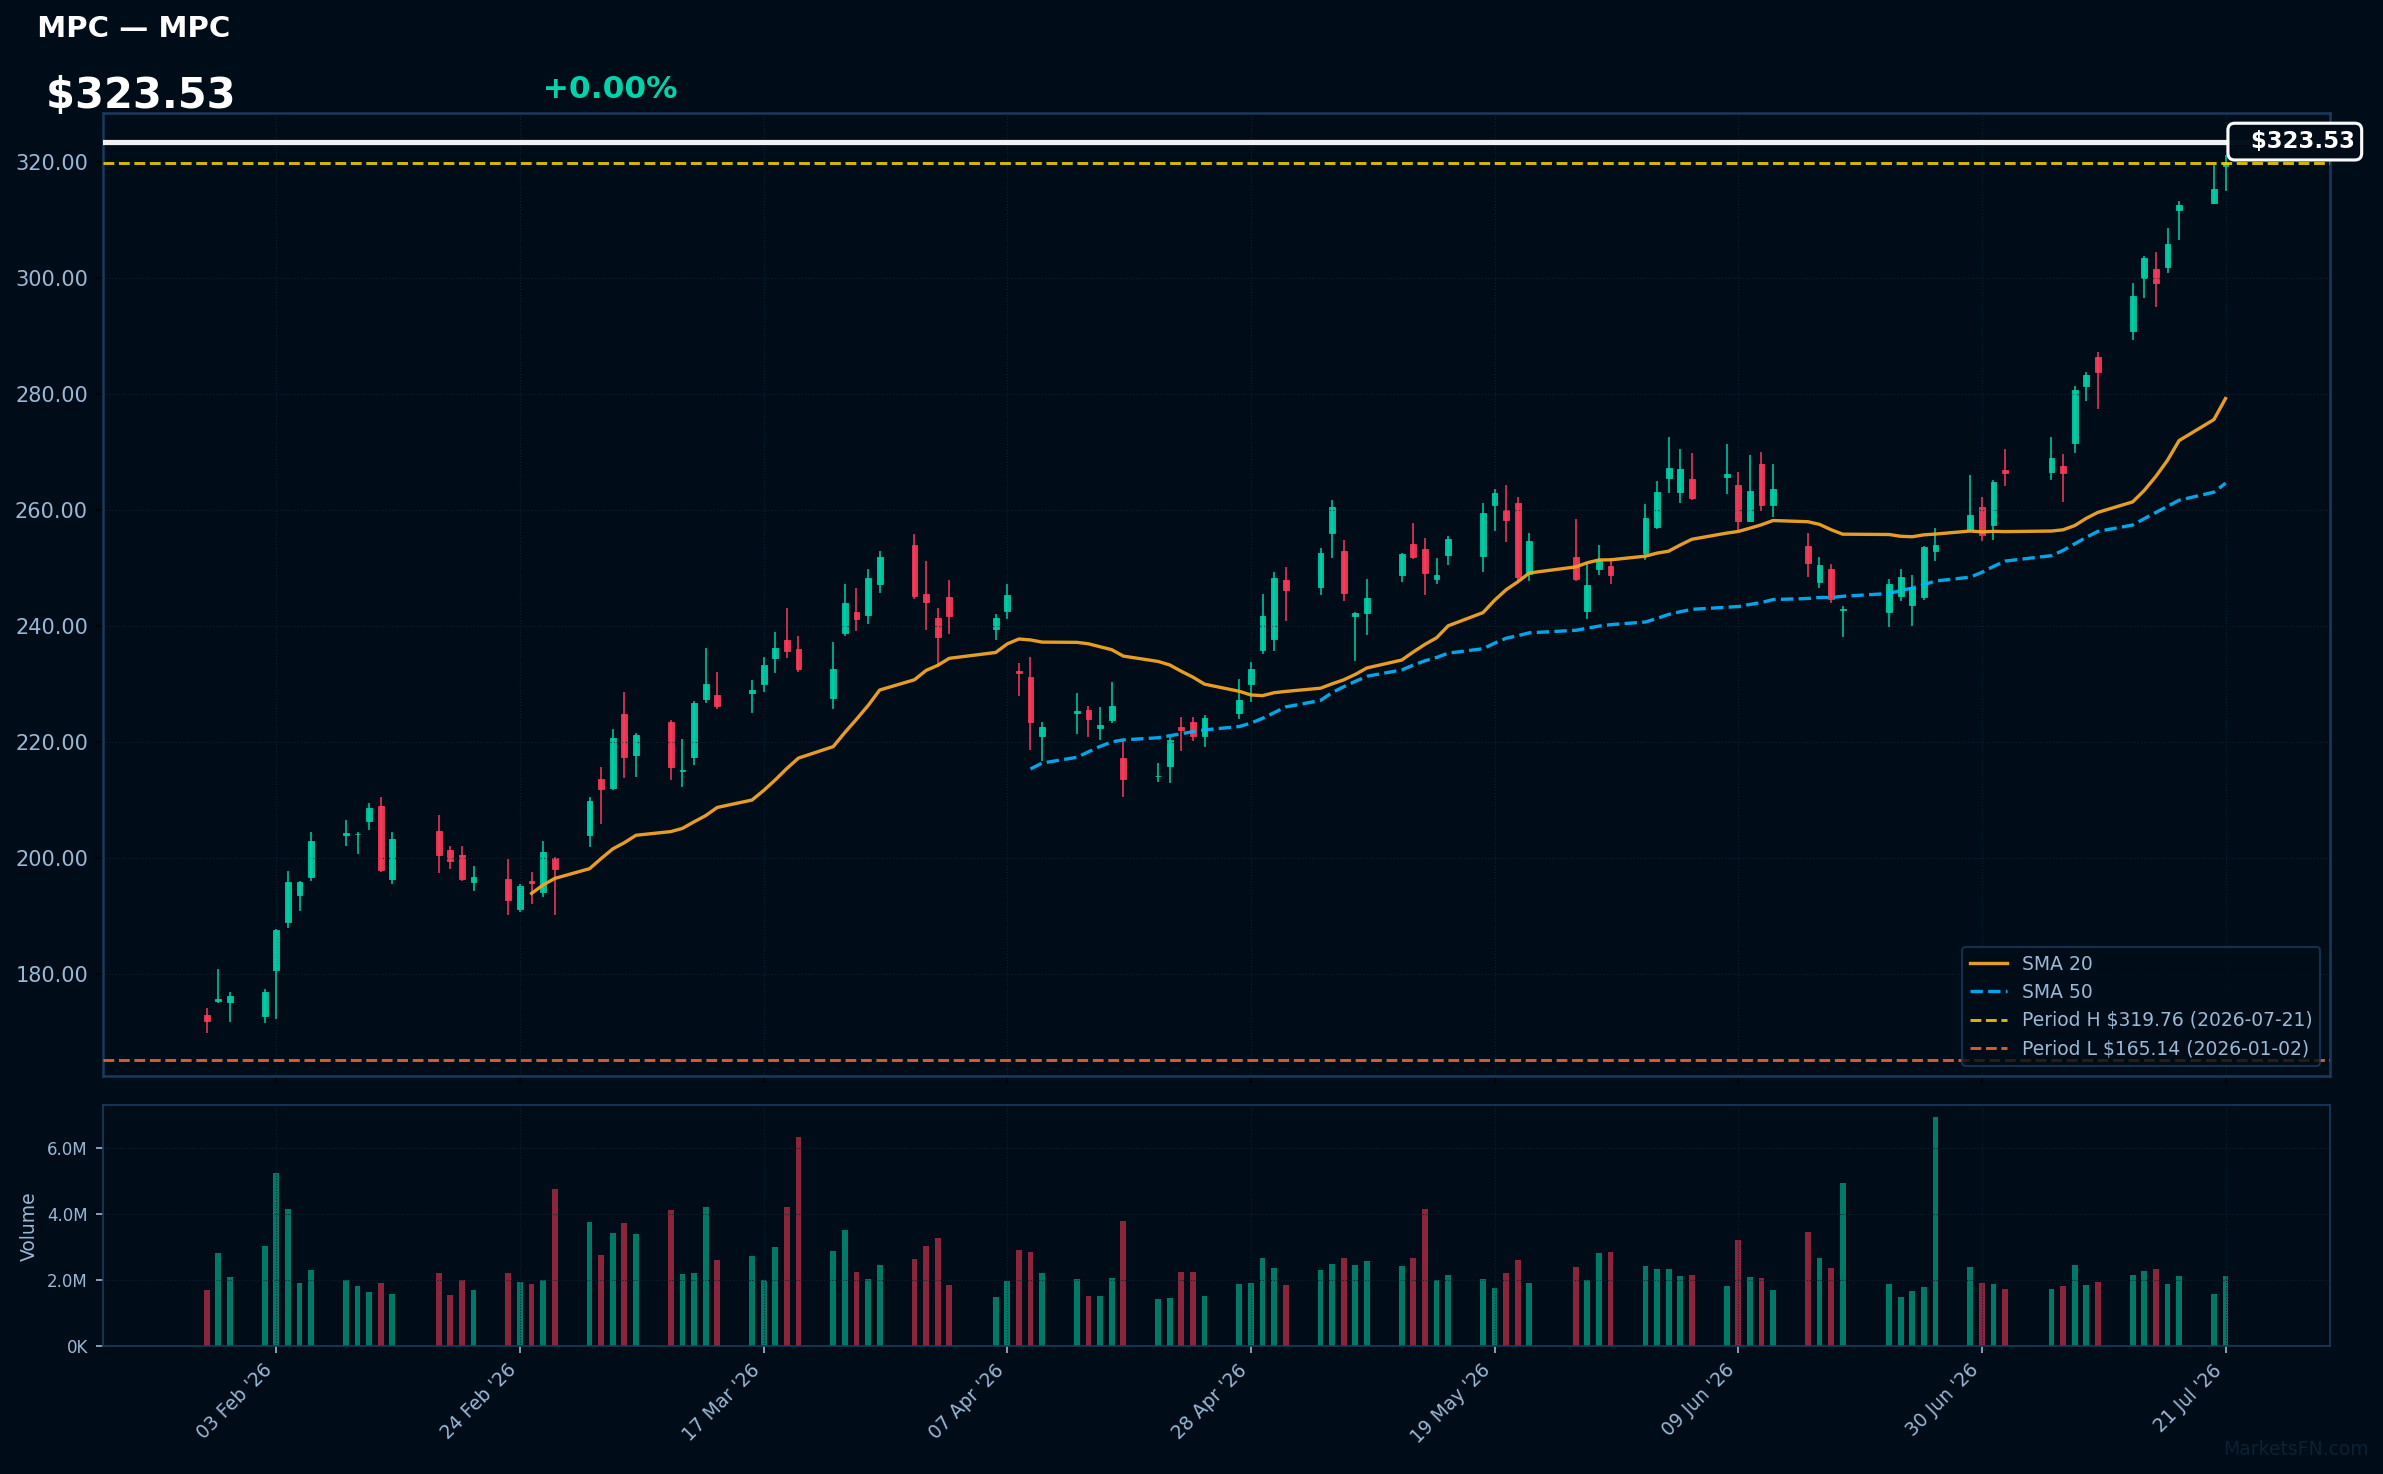
MPC | Marathon Petroleum Corp | Energy | Price Last: $319.76 | % Realized: +93.63% | RSI: 81.0 | % above MA200: +47.0% | Trend: Above MA20, MA50, MA200
Marathon Petroleum Corp is an energy company that refines, markets, and transports petroleum products. Investors should care because its performance is tied to energy demand and refining margins, impacting its profitability and stock performance.
MPC's RSI(14) is 81.0, indicating strong momentum with price > MA20 > MA50 > MA200, a sustained uptrend. It's 0.0% below its 2026 YTD high, nearing a potential breakout.
Related headlines
- BP, Marathon, 7-Eleven, Walmart sued for allegedly using AI to boost California gas prices
- Marathon Petroleum Corp. to Report Second-Quarter Financial Results on August 4, 2026
- Marathon Petroleum Corp. names Brian Worthington vice president, Investor Relations; Kristina Kazarian to become vice president, Finance and Treasurer
- MPC- A US Refiner Benefitting from Tighter Jet Fuel Market
📉 Nearest to 2026 Low
Sectors represented: Consumer Cyclical (2), Technology (1), Consumer Defensive (1), Industrials (1)
| Ticker | Company | Sector | Price Last | % Realized | 2026 YTD Low Date | RSI | % above MA200 | Trend |
|---|---|---|---|---|---|---|---|---|
| IBM | International Business Machines Corp | Technology | $210.50 | -27.79% | 2026-07-21 | 31.1 | -22.9% | Below MA20, MA50, MA200 |
| MCD | McDonald's Corp | Consumer Cyclical | $263.91 | -12.98% | 2026-07-21 | 40.5 | -12.5% | Below MA20, MA50, MA200 |
| PEP | PepsiCo Inc | Consumer Defensive | $135.00 | -5.08% | 2026-07-21 | 40.4 | -9.9% | Below MA20, MA50, MA200 |
| LOW | Lowe's Cos., Inc | Consumer Cyclical | $203.51 | -17.57% | 2026-07-21 | 38.1 | -15.3% | Below MA20, MA50, MA200 |
| LHX | L3Harris Technologies Inc | Industrials | $277.71 | -8.79% | 2026-07-21 | 42.1 | -12.2% | Below MA20, MA50, MA200 |
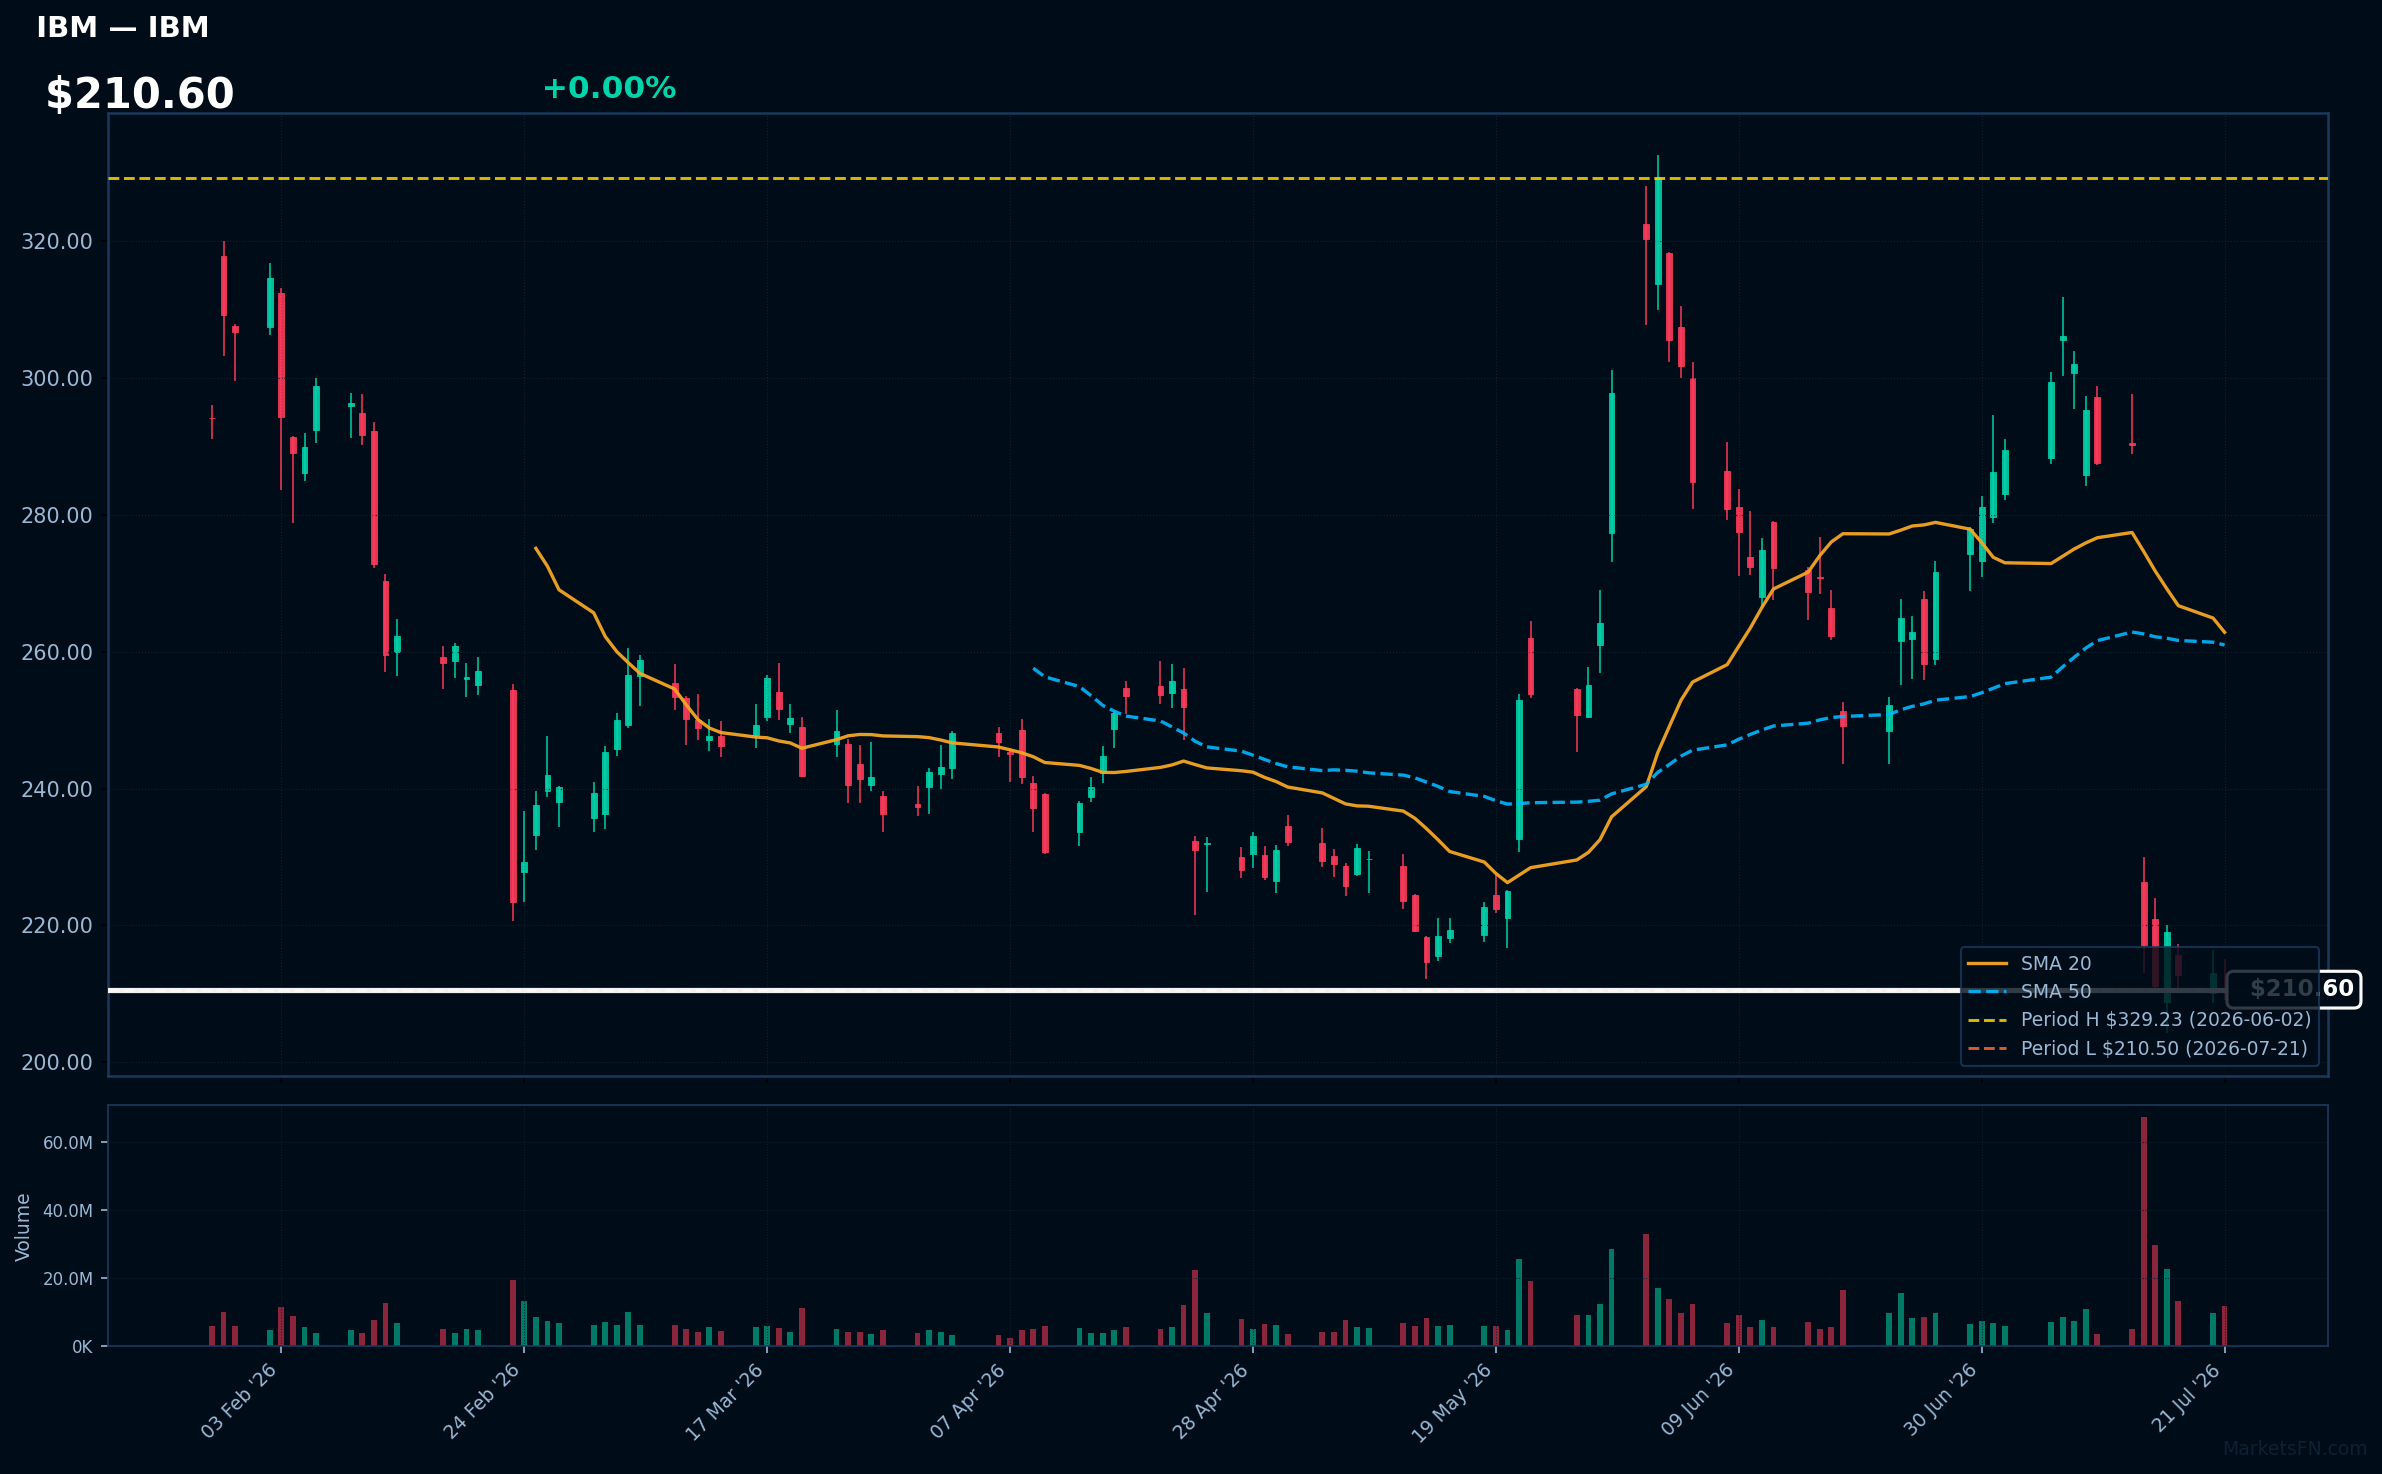
IBM | International Business Machines Corp | Technology | Price Last: $210.50 | % Realized: -27.79% | RSI: 31.1 | % above MA200: -22.9% | Trend: Below MA20, MA50, MA200
International Business Machines Corp (IBM) is a technology company that provides hardware, software, and services, including cloud computing, AI, and IT consulting. Investors care about its transition to high-growth areas like hybrid cloud and AI.
IBM's technical situation is bearish, with an RSI(14) of 31.1, indicating oversold conditions, and a sustained downtrend as price ($210.60) remains below MA20, MA50, and MA200, with the stock testing major support at its 2026 YTD low.
Related headlines
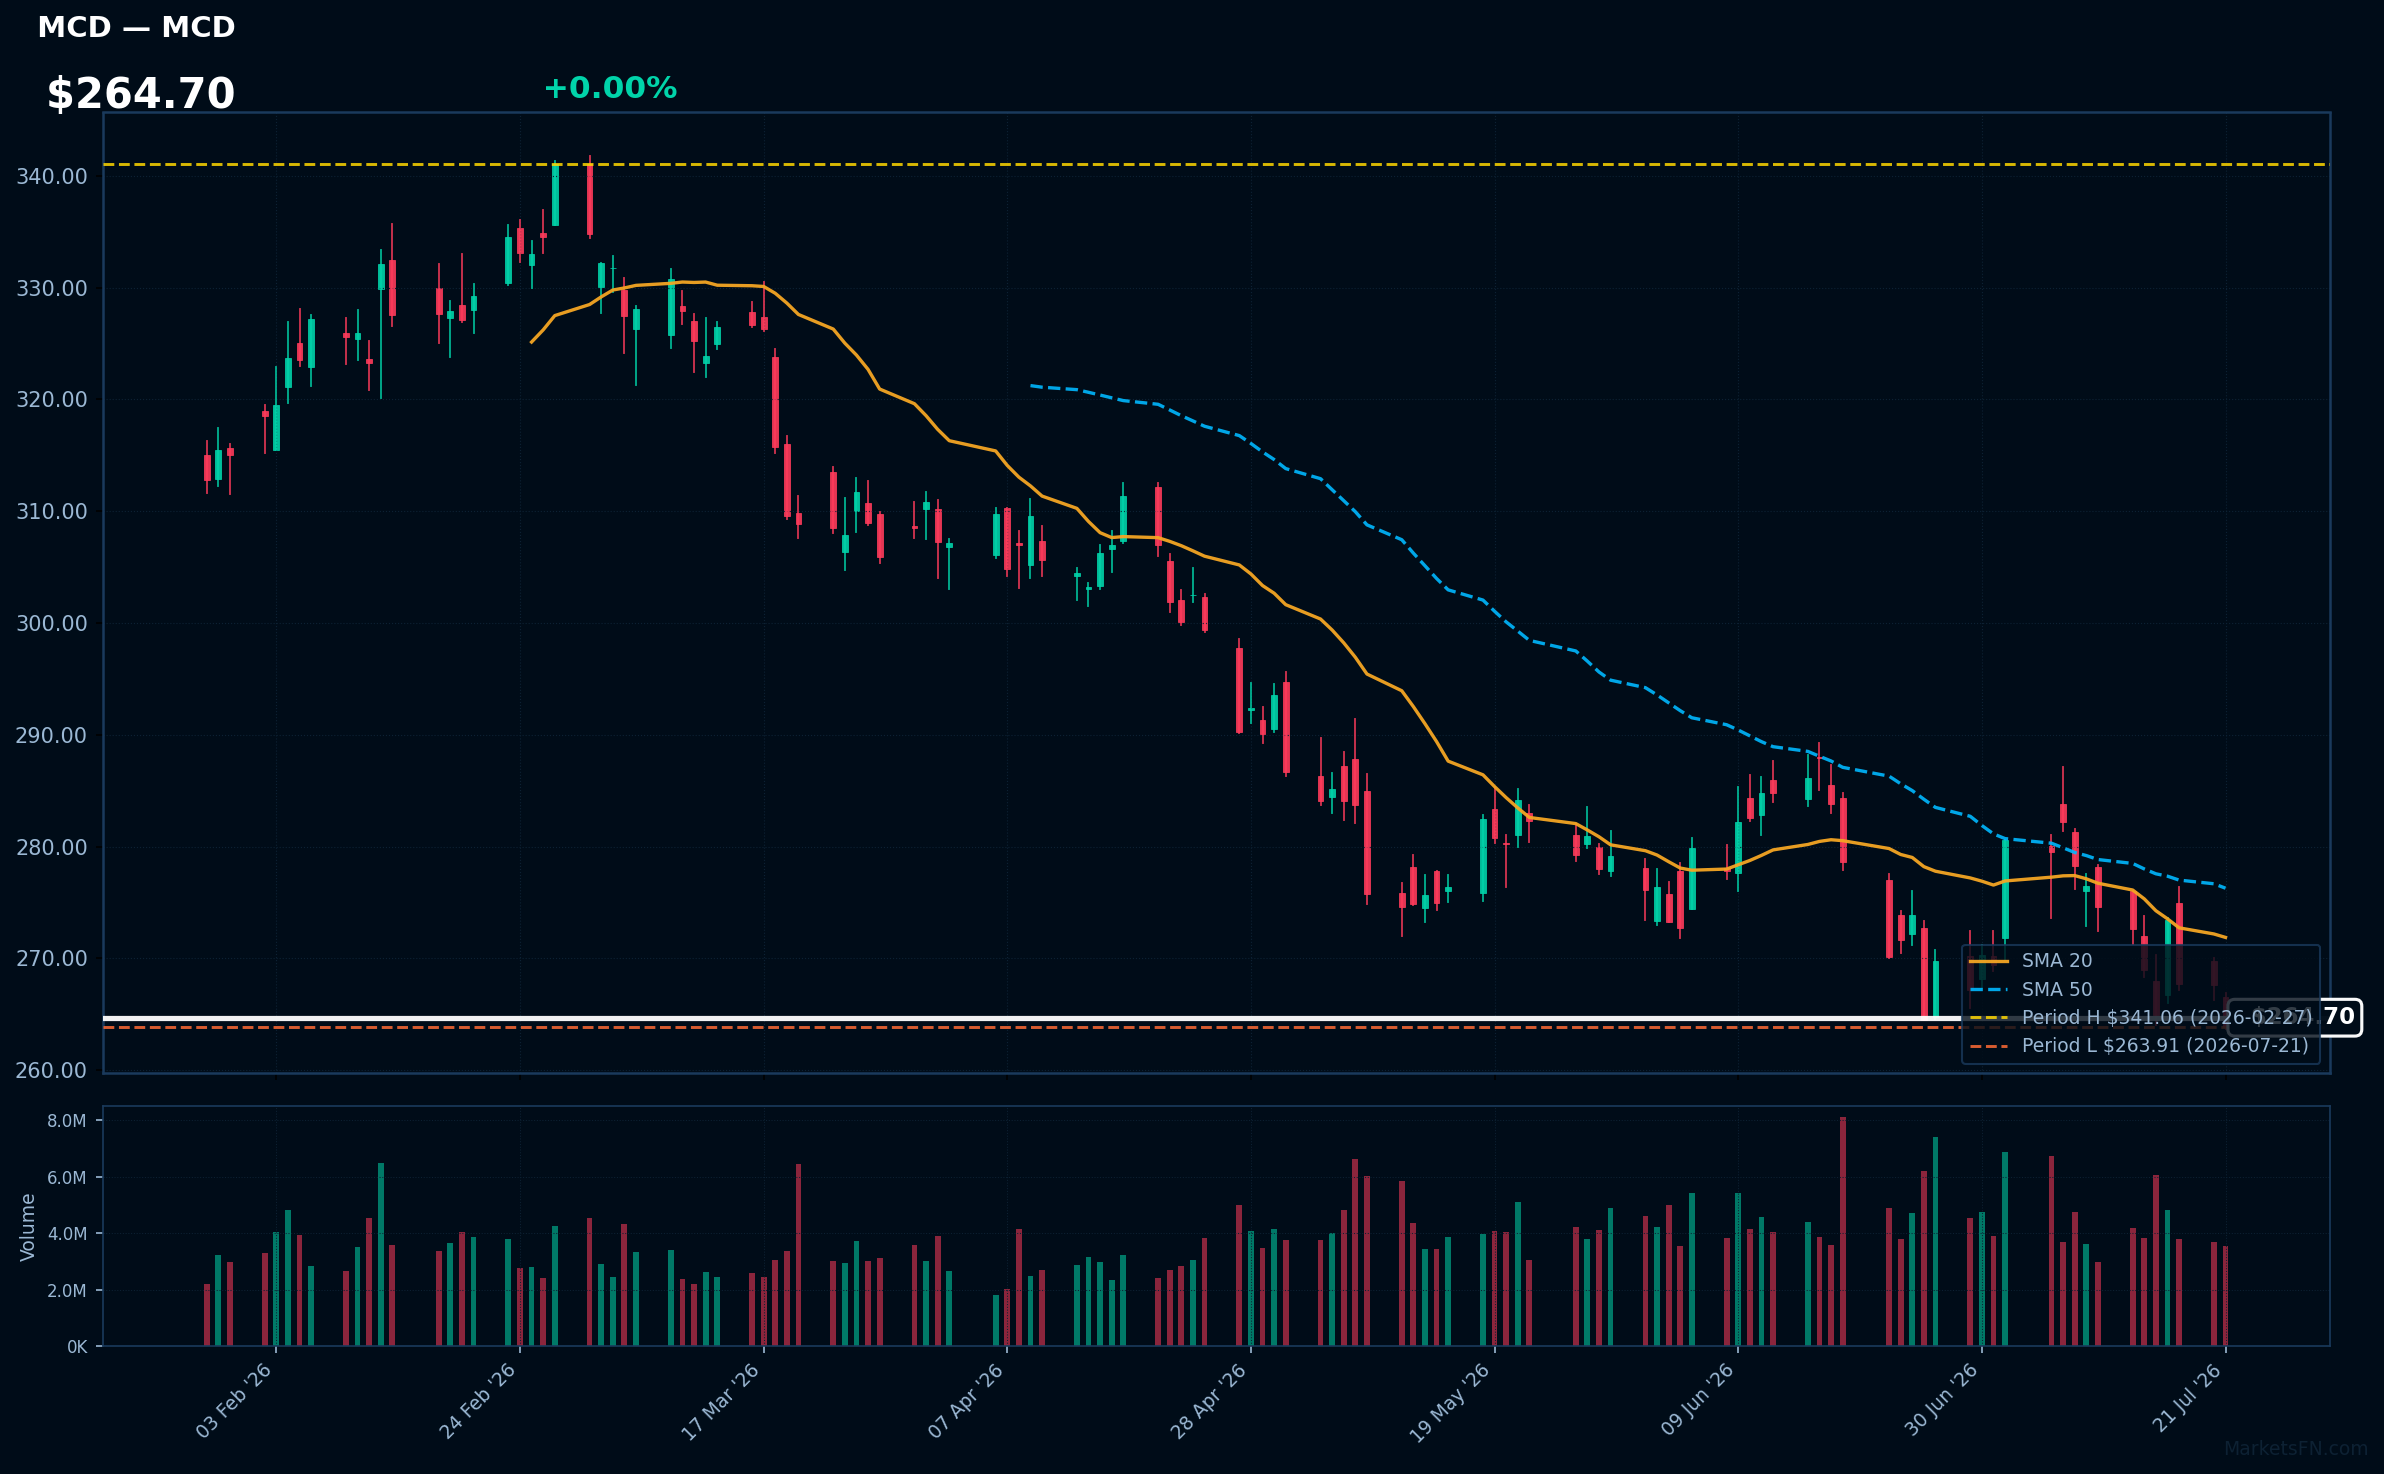
MCD | McDonald's Corp | Consumer Cyclical | Price Last: $263.91 | % Realized: -12.98% | RSI: 40.5 | % above MA200: -12.5% | Trend: Below MA20, MA50, MA200
McDonald's Corp operates quick-service restaurants, serving burgers, fries, and beverages globally. Investors should care about its brand strength, global footprint, and operational efficiency, as these factors influence revenue growth and profitability.
McDonald's Corp is in a sustained downtrend with price ($264.70) below MA20, MA50, and MA200. The RSI(14) is 40.5, nearing oversold territory. Testing its 2026 YTD low, the stock has lost 13.0% YTD, indicating potential further downside risk.
Related headlines
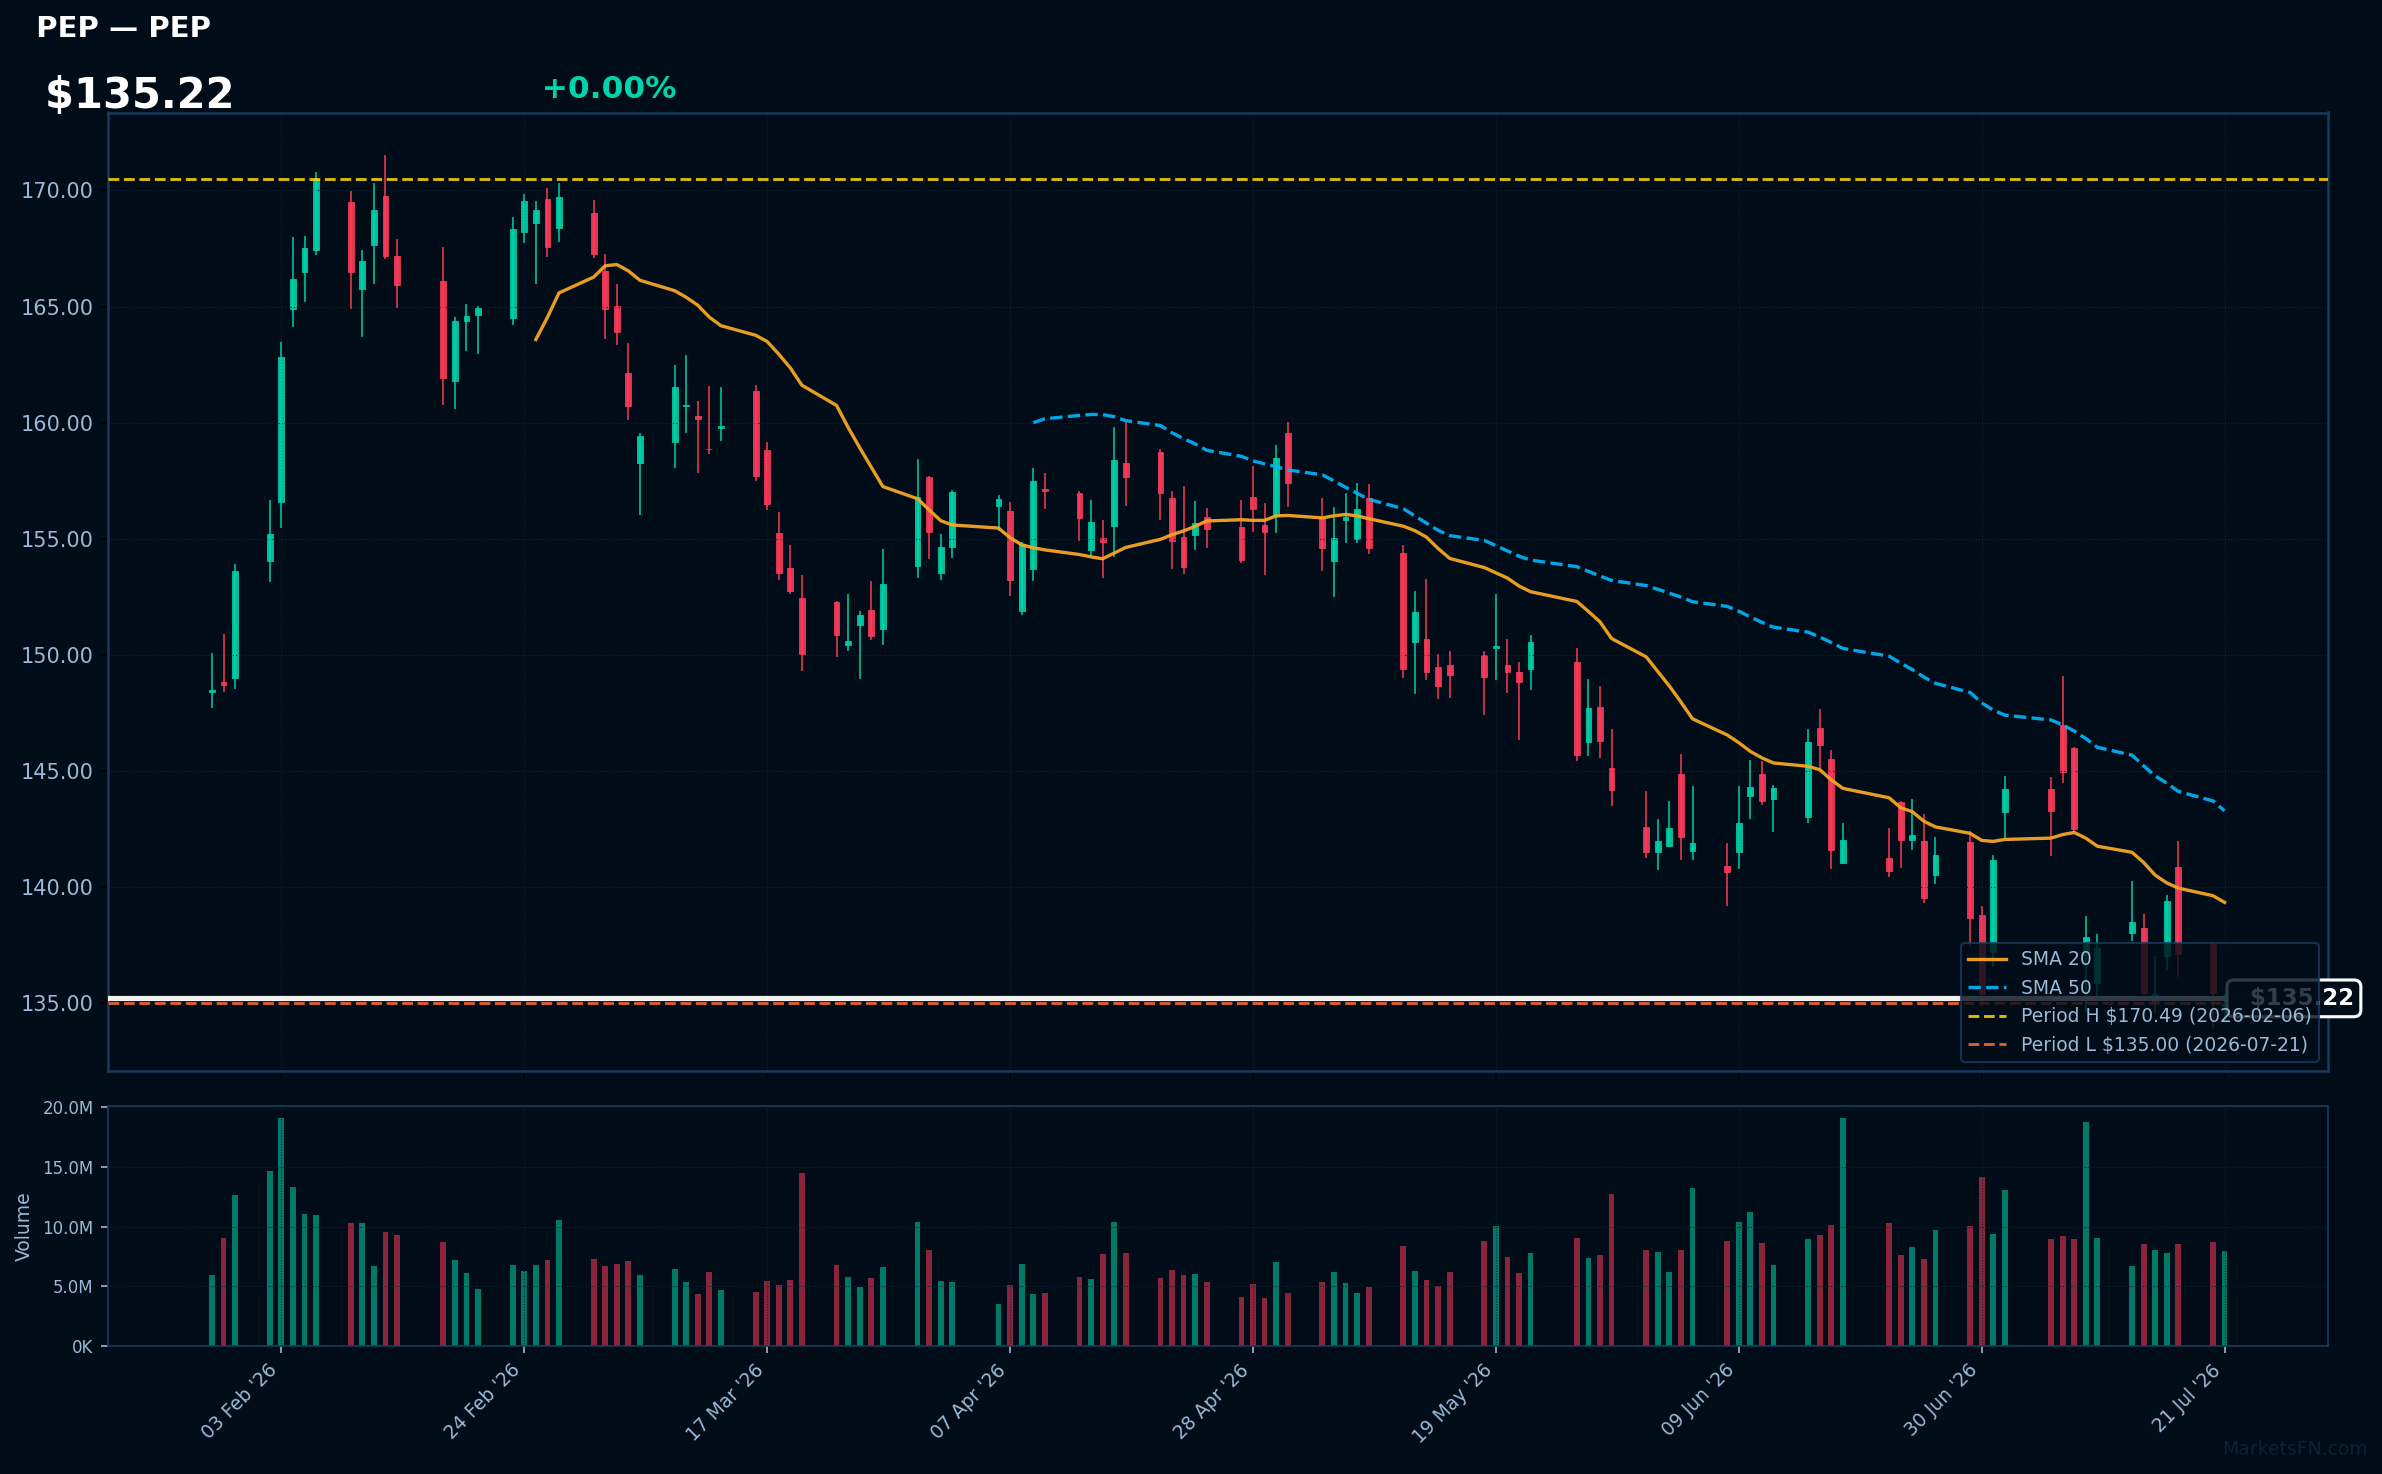
PEP | PepsiCo Inc | Consumer Defensive | Price Last: $135.00 | % Realized: -5.08% | RSI: 40.4 | % above MA200: -9.9% | Trend: Below MA20, MA50, MA200
PepsiCo Inc is a multinational food and beverage corporation that generates revenue through the sale of popular brands such as Pepsi, Lay's, and Gatorade, making it a significant player in the consumer staples sector, with investors caring about its steady cash flows and dividend yield.
PepsiCo's current technical situation is bearish, with an RSI(14) of 40.4 indicating weakening momentum, and a sustained downtrend as price ($135.22) remains below MA20, MA50, and MA200, with the stock testing major support at its 2026 YTD low.
Related headlines
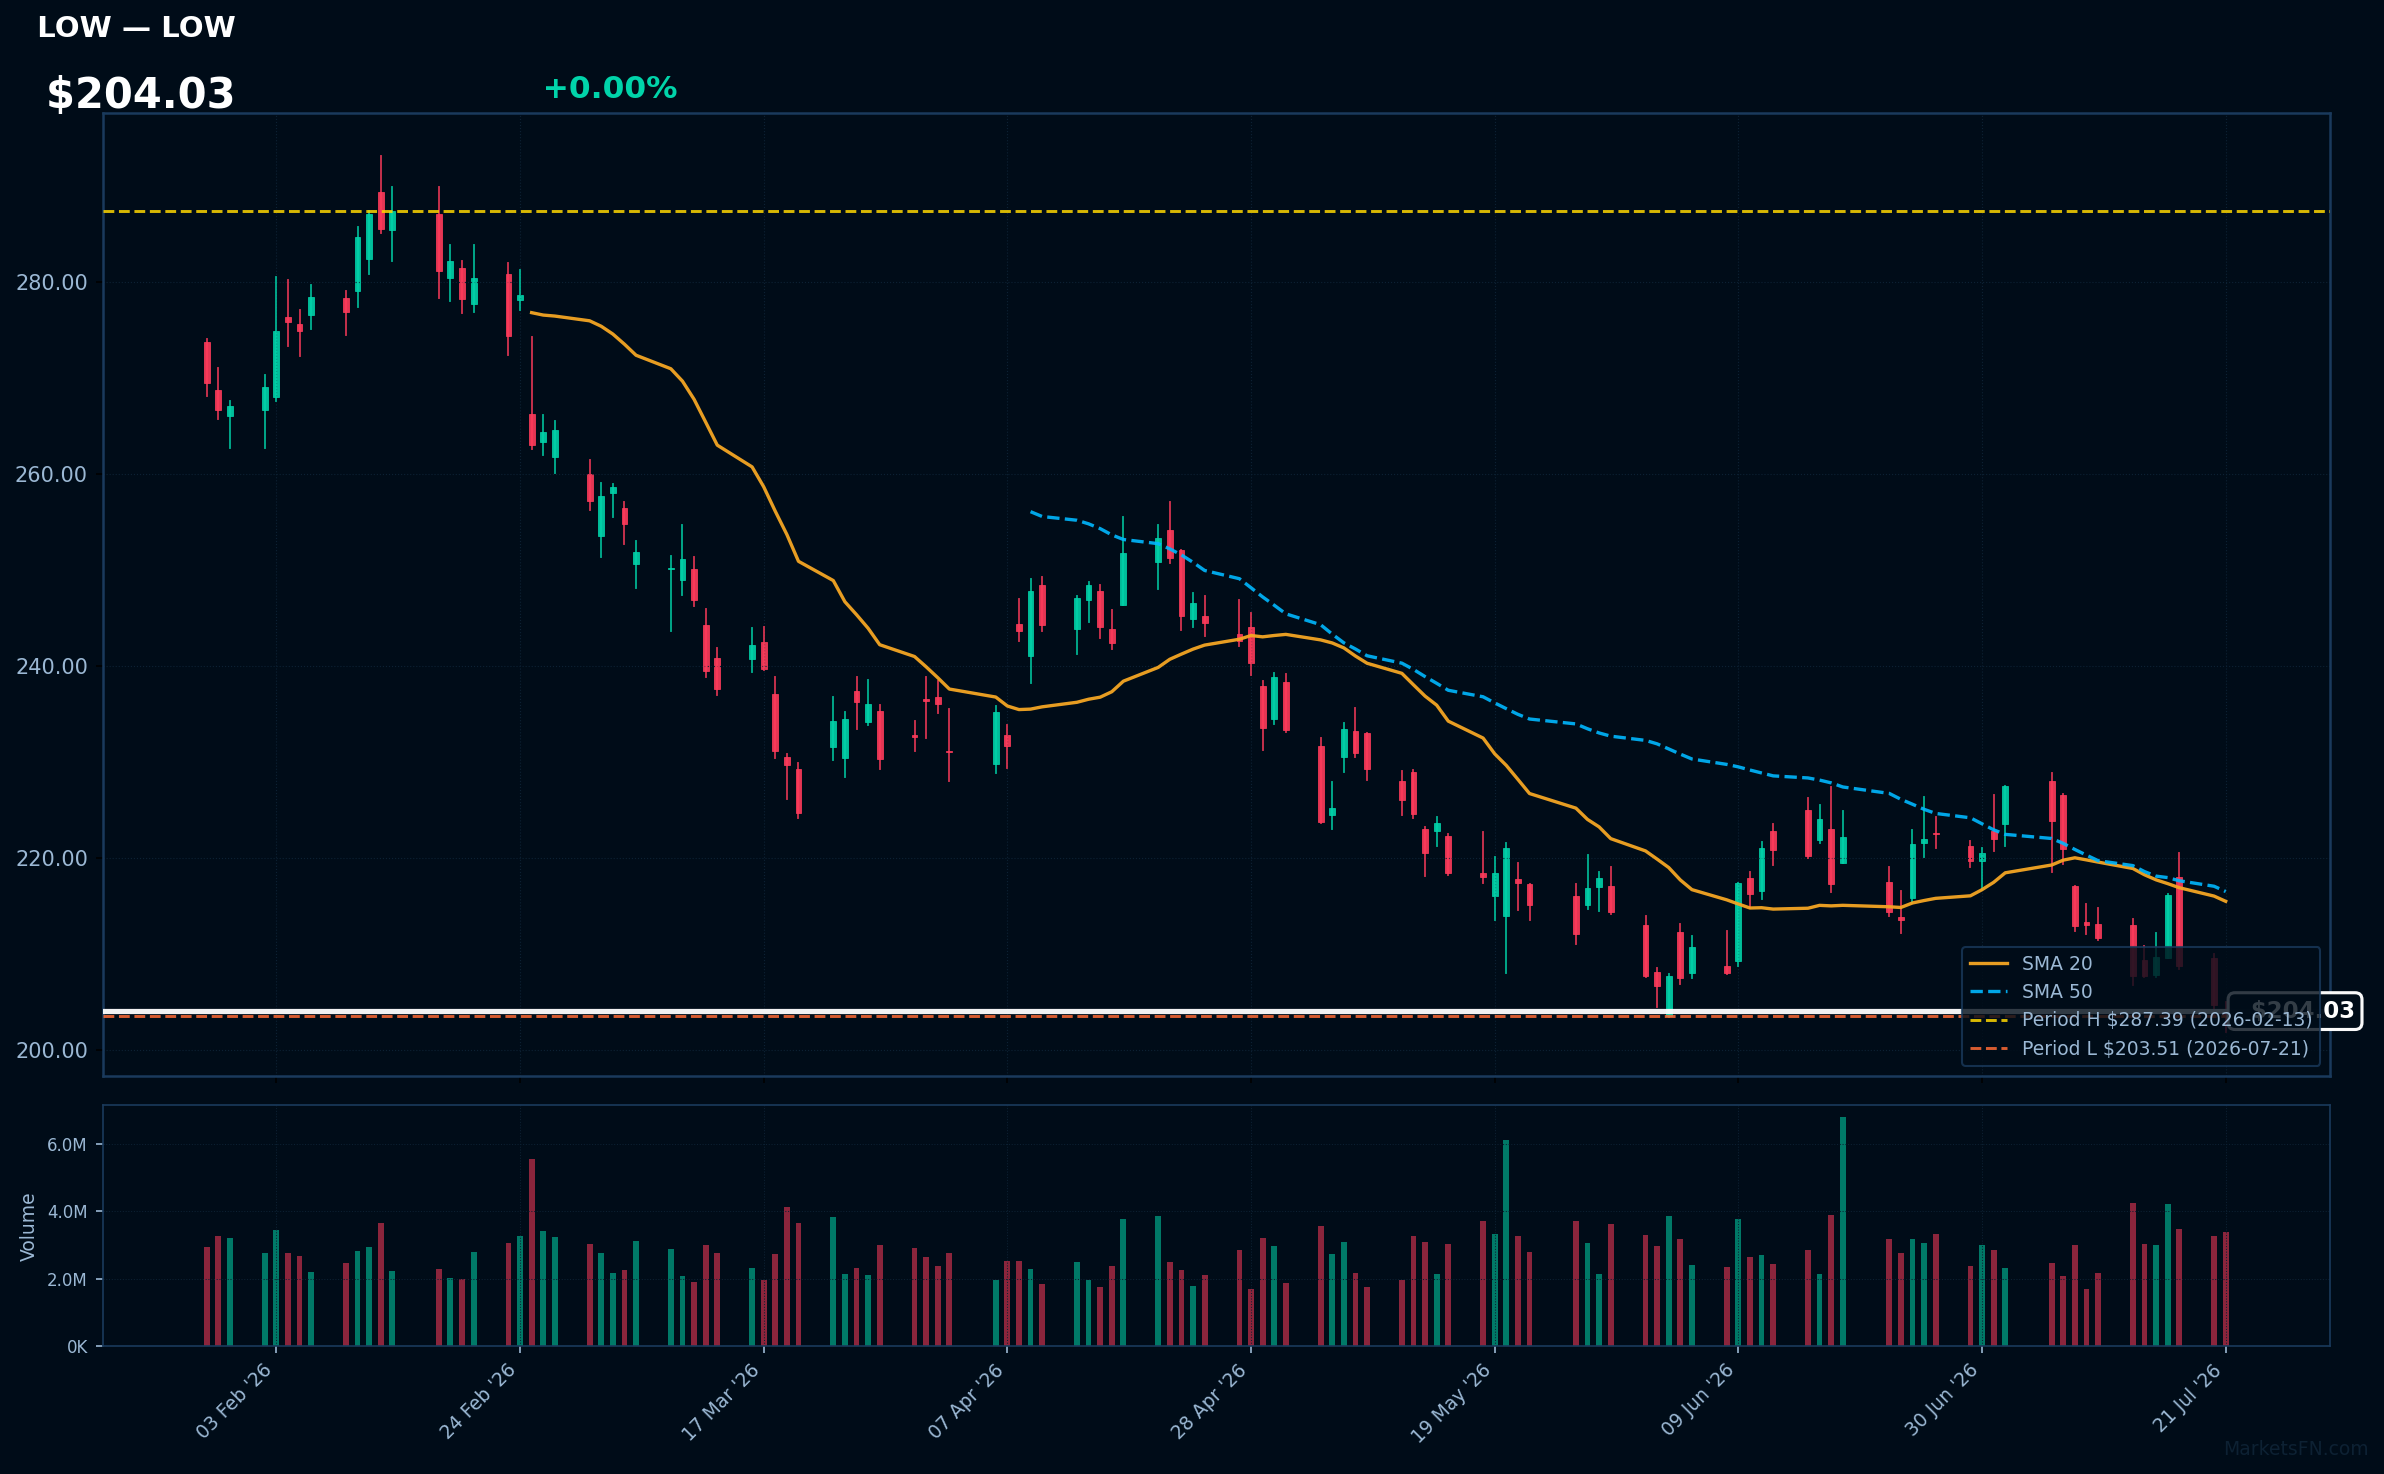
LOW | Lowe's Cos., Inc | Consumer Cyclical | Price Last: $203.51 | % Realized: -17.57% | RSI: 38.1 | % above MA200: -15.3% | Trend: Below MA20, MA50, MA200
Lowe's Cos., Inc is a home improvement retailer operating over 1,700 stores across North America, offering products for construction, renovation, and maintenance. Investors care about its performance as it reflects housing market trends and consumer spending habits.
Lowe's is testing major support with its price 0.0% above its 2026 YTD low. The RSI(14) is 38.1, and MA alignment is bearish (price < MA20 < MA50 < MA200), indicating a sustained downtrend and potential further decline, as the stock has already lost 17.6% YTD.
Related headlines
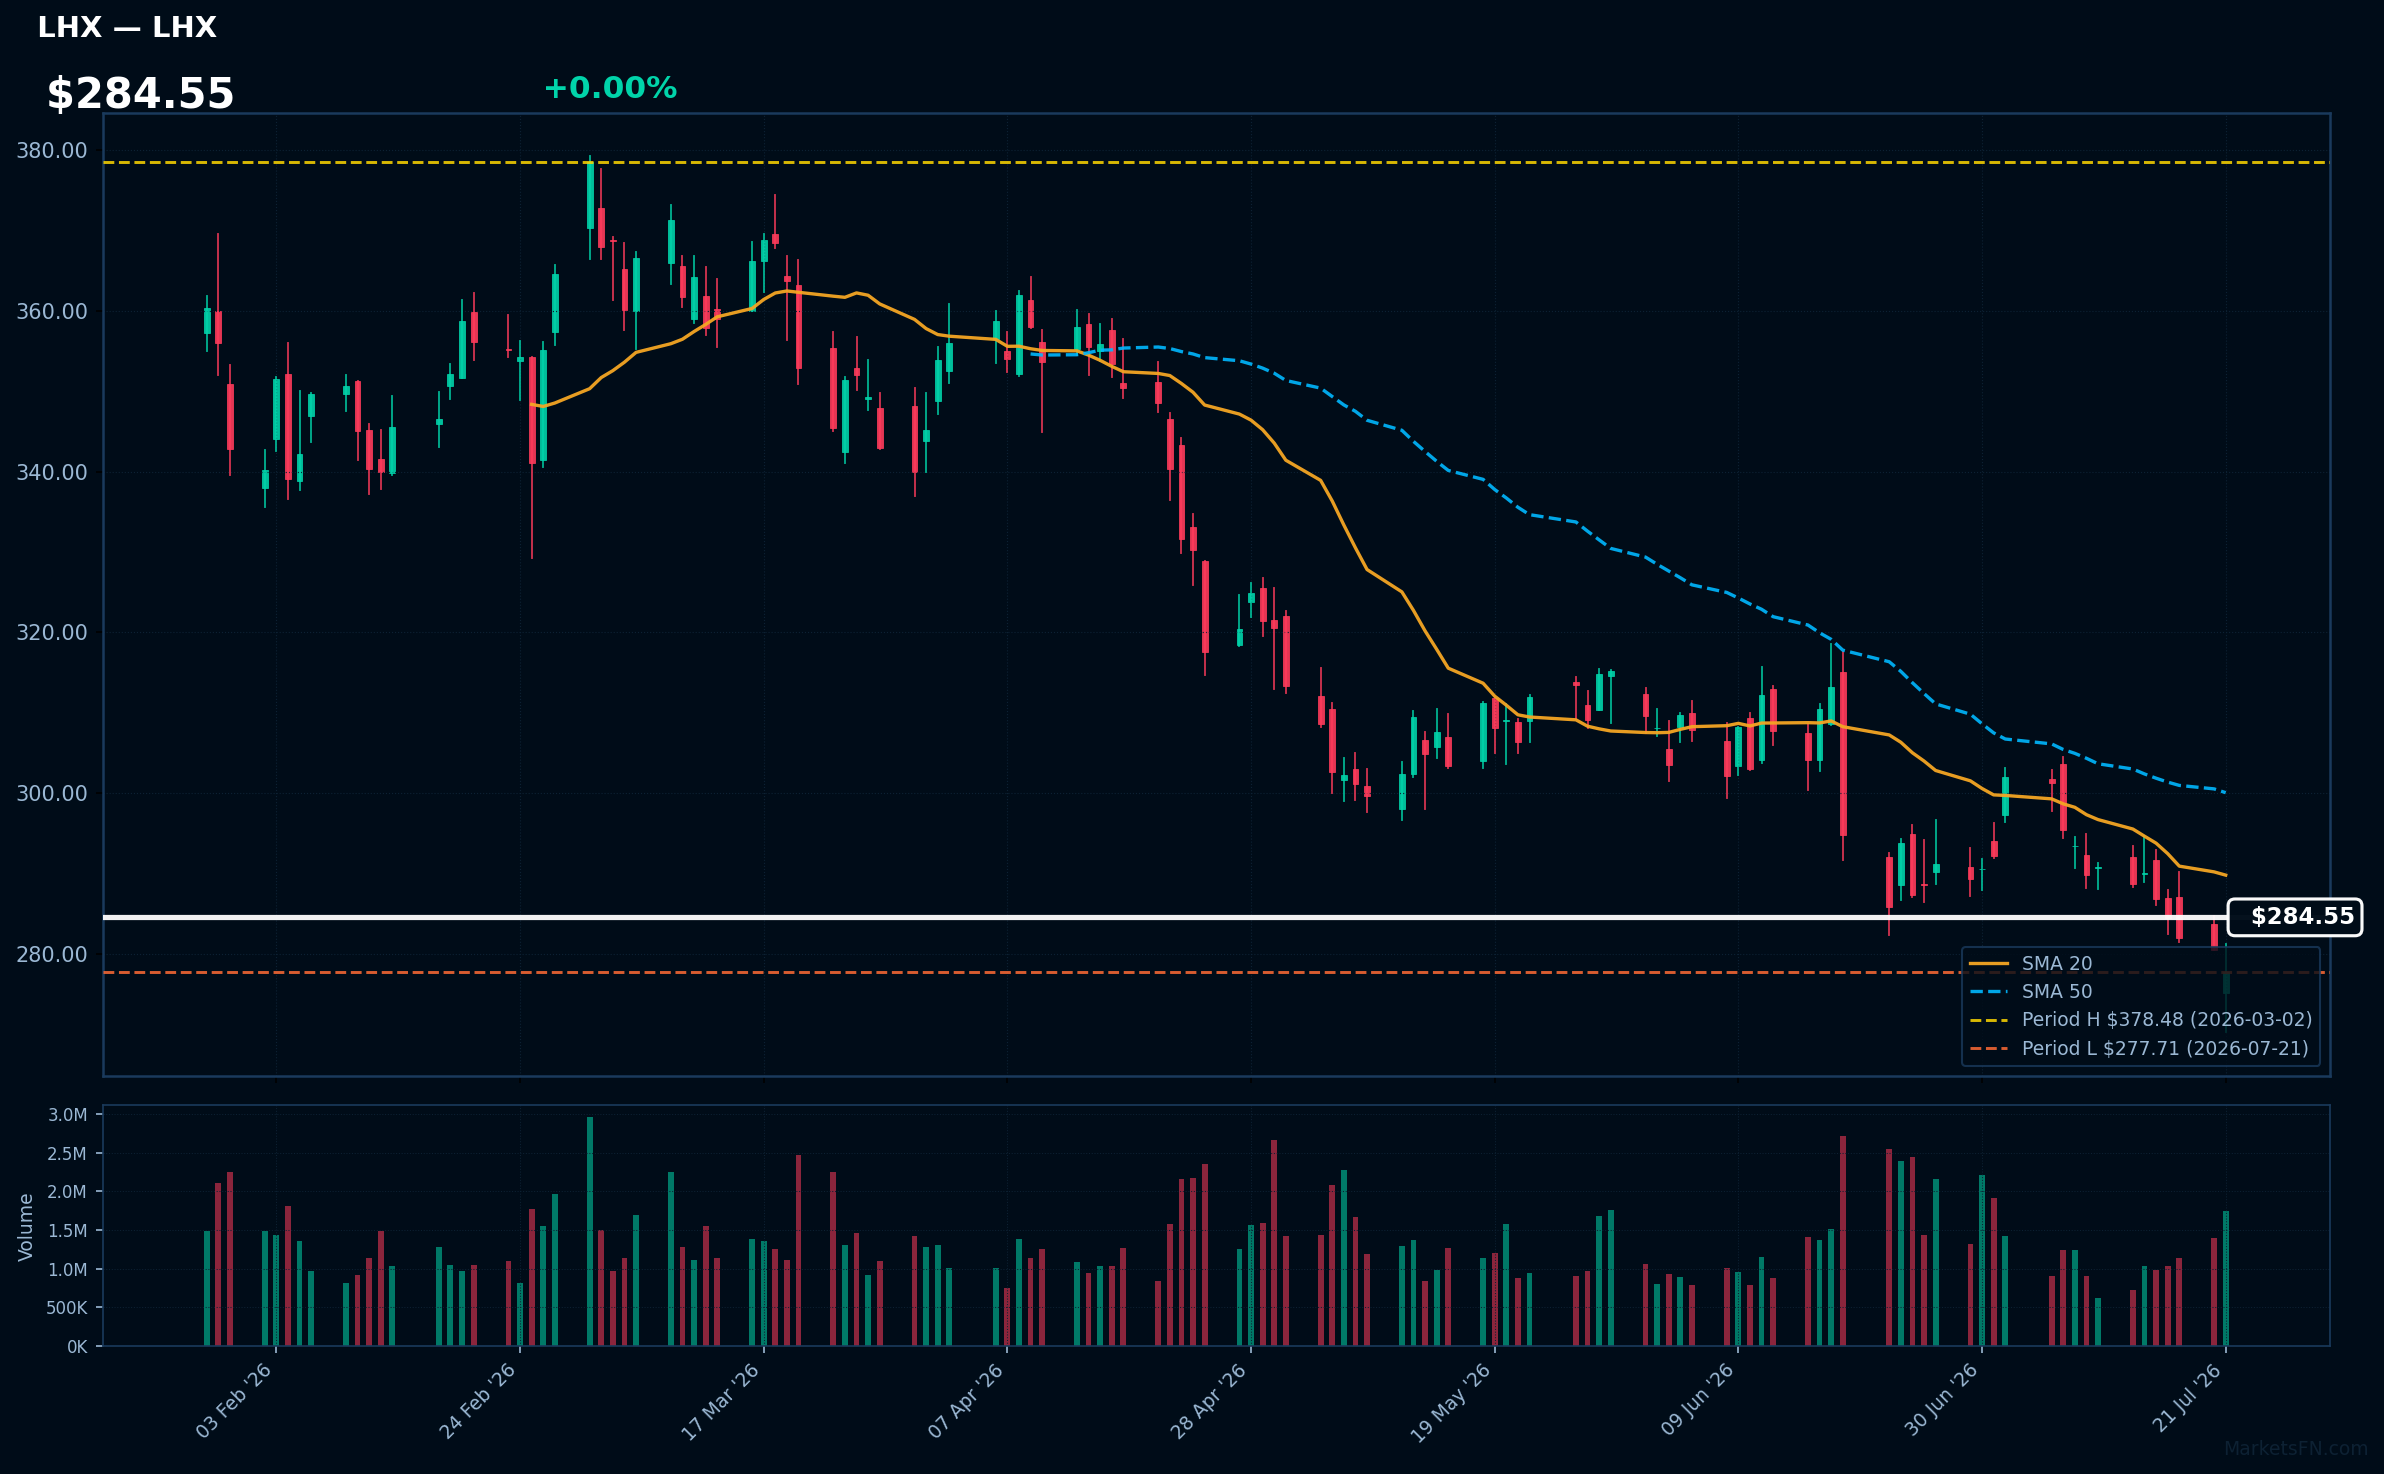
LHX | L3Harris Technologies Inc | Industrials | Price Last: $277.71 | % Realized: -8.79% | RSI: 42.1 | % above MA200: -12.2% | Trend: Below MA20, MA50, MA200
L3Harris Technologies Inc is a defense technology company providing advanced defense and commercial technologies across air, land, sea, space, and cyber domains. Investors should care due to its significant role in the defense industry and potential for growth driven by government spending.
L3Harris is in a sustained downtrend with price ($284.55) below MA20, MA50, and MA200. The RSI(14) is 42.1, nearing oversold territory. Testing its 2026 YTD low, the stock has returned -8.8% YTD, indicating potential further downside risk.
Related headlines
- LHX Stock Looks To Snap Losses: L3Harris Wins Space Force Deal For Missile Tracking Satellites
- US Space Force Selects L3Harris to Provide Advanced Tracking Satellites for America's Missile Defense
- US Army Awards L3Harris NGC2 Manpack Radio Delivery Orders
- L3Harris Sets Date for Second Quarter 2026 Earnings Release
Market Commentary
The S&P 500 stocks listed are currently trading near their year-to-date (YTD) extremes for 2026, with some at their highs and others at their lows. Specifically, UNH, WELL, CVS, TRV, and MPC are at their 2026 YTD highs, while IBM, MCD, PEP, LOW, and LHX are at their 2026 YTD lows.
The stocks near their 2026 YTD highs are primarily from the healthcare and energy sectors, indicating potential strength in these areas. Conversely, the stocks at their 2026 YTD lows span various sectors, including technology (IBM, LHX), consumer staples (PEP, MCD), and retail (LOW). This divergence may suggest differing market conditions or investor sentiments across these sectors.
Investors should monitor these stocks for any deviation from their current extremes, as a breakout or reversal could signal a shift in market trends. Additionally, keeping an eye on sector-specific news and broader market conditions will be crucial in understanding the underlying drivers behind these stock movements and making informed investment decisions.
Methodology: All 503 S&P 500 constituents screened. Close prices downloaded from 2026-01-01. Period high = highest close since Jan 1 2026; period low = lowest close since Jan 1 2026. Distance = (current price / period extreme − 1) × 100. Technical indicators computed on up to 1 year of daily OHLCV data.
Disclaimer: For informational purposes only. Not investment advice. Past performance is not indicative of future results.

