S&P 500 2026 YTD Highs & Lows Radar: Visa (V), Tesla (TSLA) and more
MarketsFN Team

S&P 500 2026 YTD Highs & Lows Radar: Visa (V), Tesla (TSLA) and more
Screening all 503 S&P 500 constituents for stocks nearest to their 2026 year-to-date high and their 2026 YTD low. Data as of July 30, 2026. % Realized = total return since Jan 1 2026.
Legend: RSI > 70 = overbought · RSI < 30 = oversold · Green % Realized = positive YTD return · Red = negative.
📈 Nearest to 2026 High
Sectors represented: Consumer Defensive (2), Financial (1), Healthcare (1), Technology (1)
| Ticker | Company | Sector | Price Last | % Realized | 2026 YTD High Date | RSI | % above MA200 | Trend |
|---|---|---|---|---|---|---|---|---|
| V | Visa Inc | Financial | $368.73 | +6.42% | 2026-07-29 | 61.8 | +11.7% | Above MA20, MA50, MA200 |
| ABBV | Abbvie Inc | Healthcare | $263.30 | +14.82% | 2026-07-29 | 59.5 | +17.2% | Above MA20, MA50, MA200 |
| KO | Coca-Cola Co | Consumer Defensive | $89.08 | +28.88% | 2026-07-29 | 63.7 | +17.2% | Above MA20, MA50, MA200 |
| ADP | Automatic Data Processing Inc | Technology | $273.37 | +8.10% | 2026-07-29 | 65.0 | +15.8% | Above MA20, MA50, MA200 |
| MO | Altria Group Inc | Consumer Defensive | $74.92 | +30.73% | 2026-07-29 | 39.9 | +14.3% | Above MA20, MA50, MA200 |
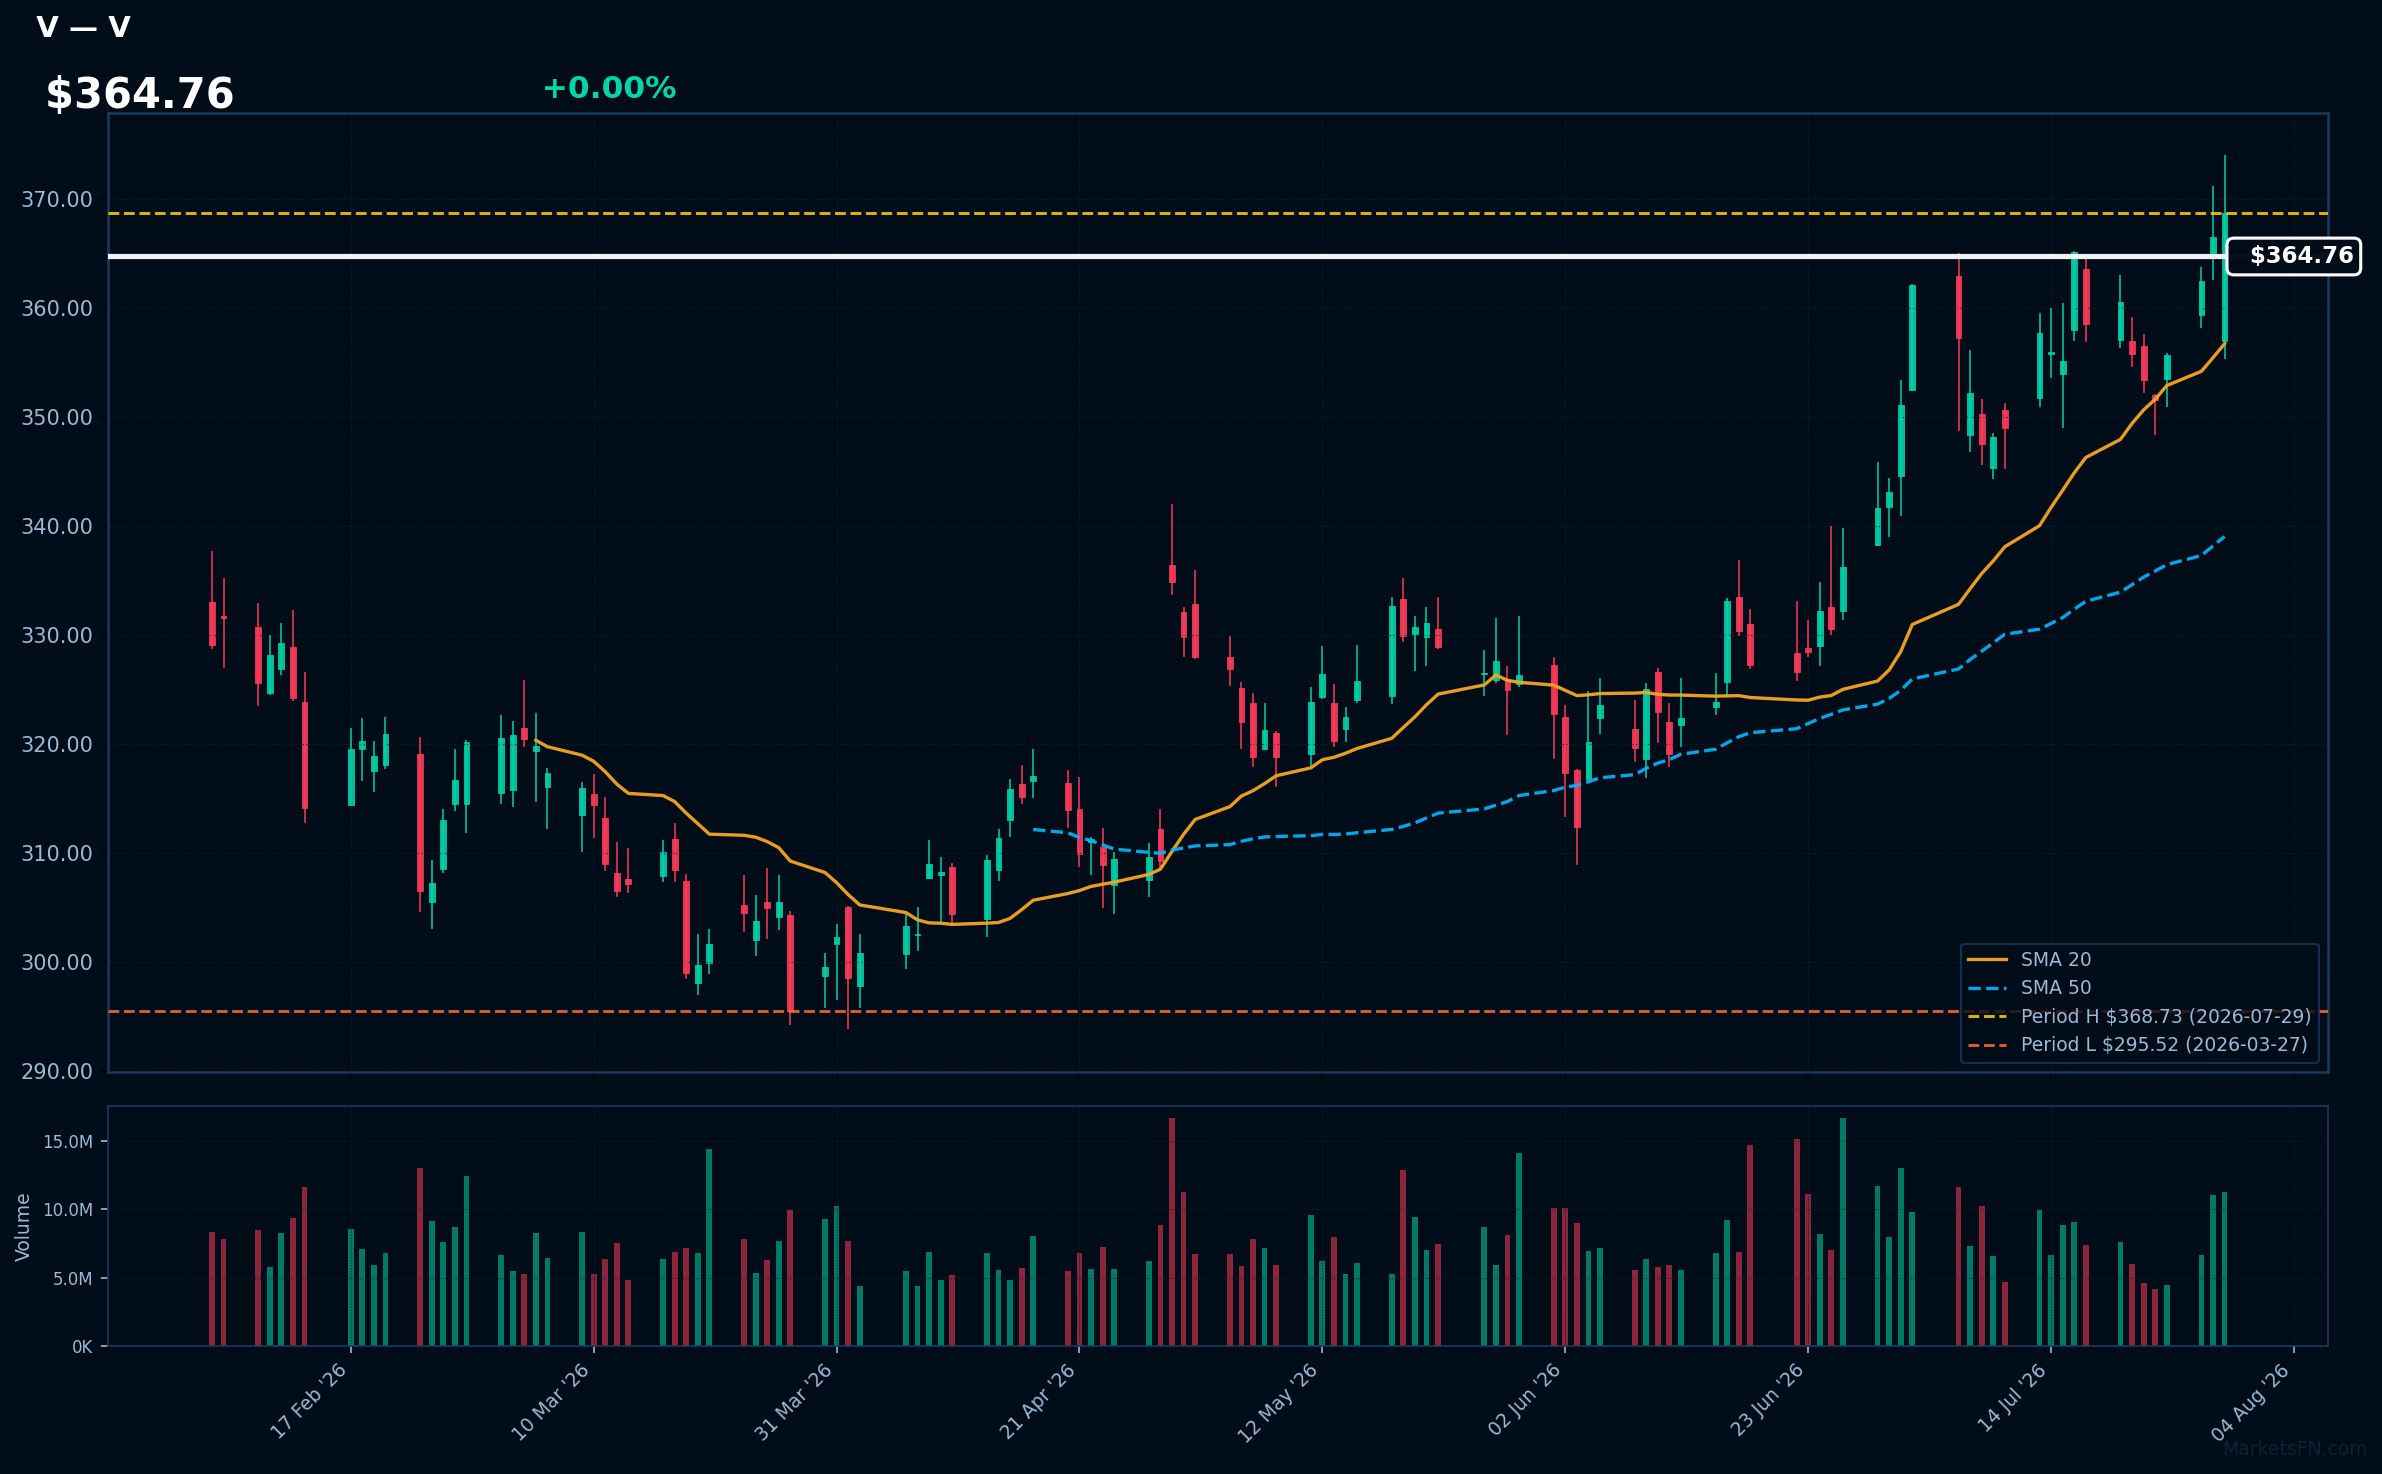
V | Visa Inc | Financial | Price Last: $368.73 | % Realized: +6.42% | RSI: 61.8 | % above MA200: +11.7% | Trend: Above MA20, MA50, MA200
Visa Inc operates a global electronic payments network, facilitating transactions between consumers, merchants, and financial institutions. Investors should care about its dominant market position and growth prospects driven by increasing digital payment adoption.
Visa Inc's current technical situation indicates sustained uptrend with price at $364.76, RSI(14) at 61.76 is not available but 61.8 is, MA alignment is bullish (price > MA20 > MA50 > MA200), and is 0.0% below its 2026 YTD high, suggesting potential breakout momentum.
Related headlines
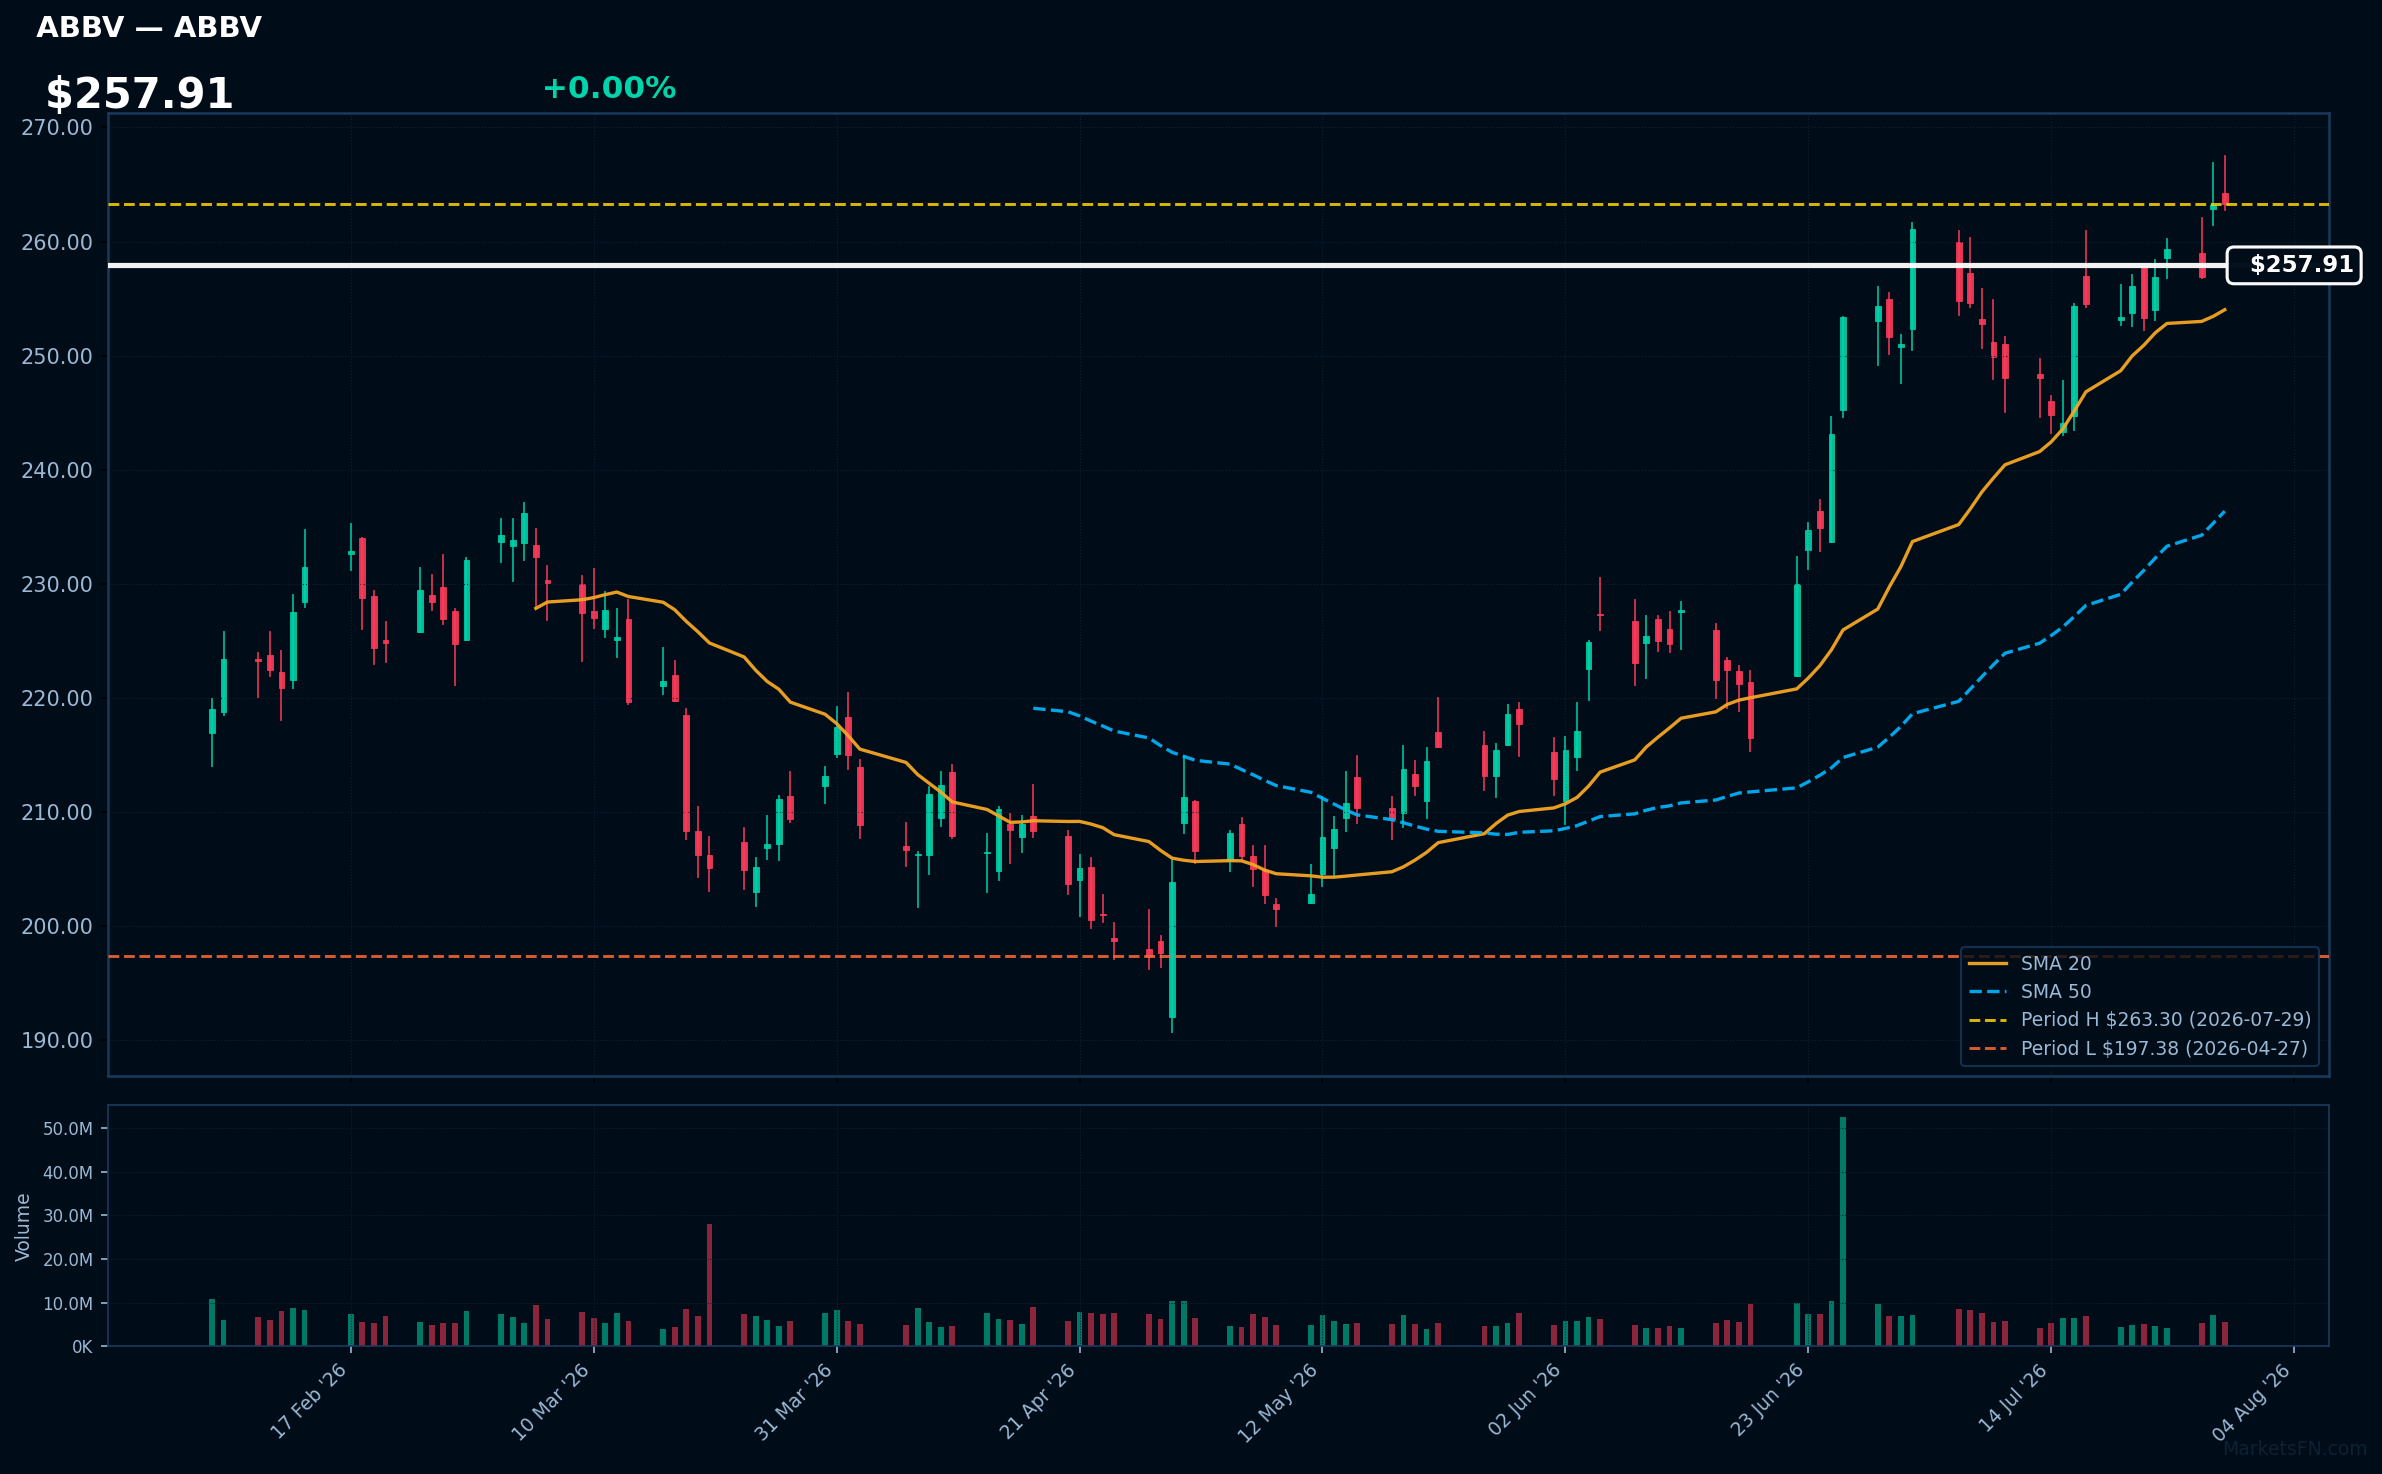
ABBV | Abbvie Inc | Healthcare | Price Last: $263.30 | % Realized: +14.82% | RSI: 59.5 | % above MA200: +17.2% | Trend: Above MA20, MA50, MA200
Abbvie Inc is a biopharmaceutical company that develops and markets therapies for complex diseases. Investors should care about its pipeline and product performance, particularly for key drugs like Humira and Rinvoq, which drive revenue growth.
Abbvie Inc is in a sustained uptrend with price > MA20 > MA50 > MA200. The RSI(14) is 59.5, indicating rising momentum. The stock is 0.0% below its 2026 YTD high, suggesting a potential breakout.
Related headlines
- The Real Price of AbbVie Stock Is Cheaper Than You Think
- AbbVie Secures EU Approval for Rinvoq to Treat Severe Alopecia Areata
- AbbVie Announces European Commission Approval of RINVOQ (upadacitinib) for the Treatment of Adults and Adolescents with Severe Alopecia Areata
- AbbVie Announces European Commission Approval of RINVOQ (upadacitinib) for the Treatment of Adults and Adolescents with Non-Segmental Vitiligo
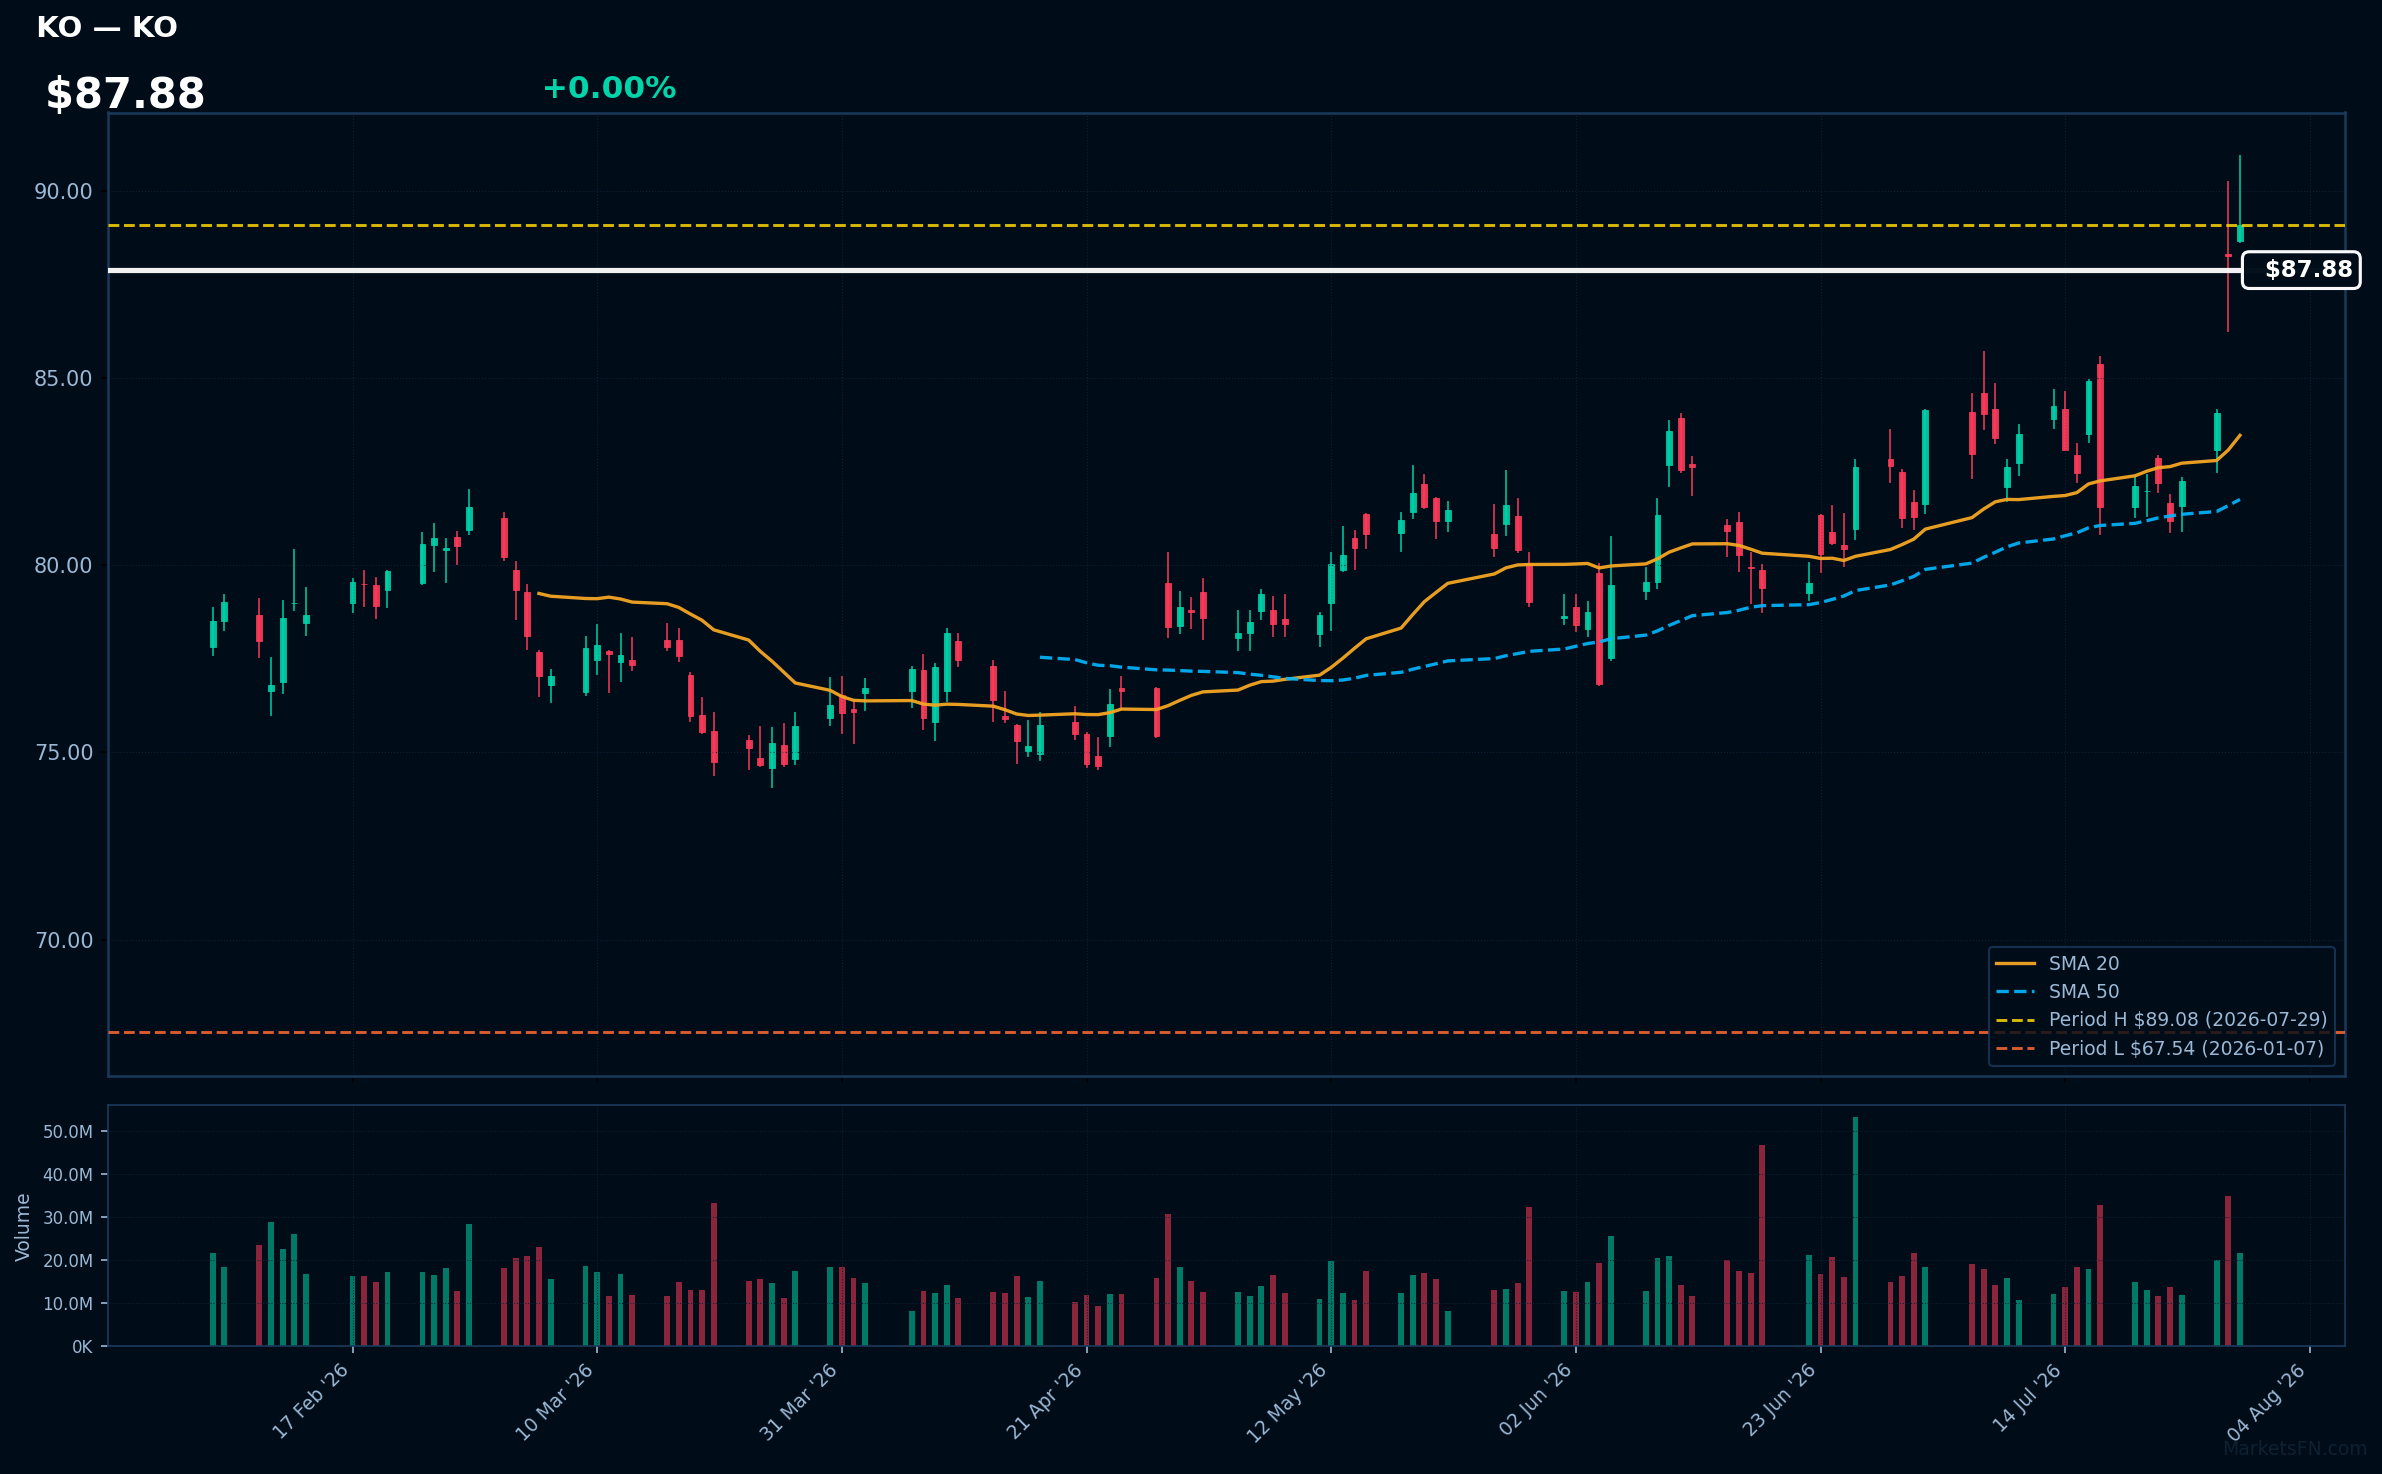
KO | Coca-Cola Co | Consumer Defensive | Price Last: $89.08 | % Realized: +28.88% | RSI: 63.7 | % above MA200: +17.2% | Trend: Above MA20, MA50, MA200
Coca-Cola Co is a beverage company that manufactures and distributes beverages, generating revenue through sales of its products. Investors should care about its ability to maintain market share and pricing power in a competitive market.
Coca-Cola Co's RSI is 63.7, indicating rising momentum. The MA alignment is bullish with price > MA20 > MA50 > MA200, and it's 0.0% below its 2026 YTD high, suggesting a potential breakout.
Related headlines
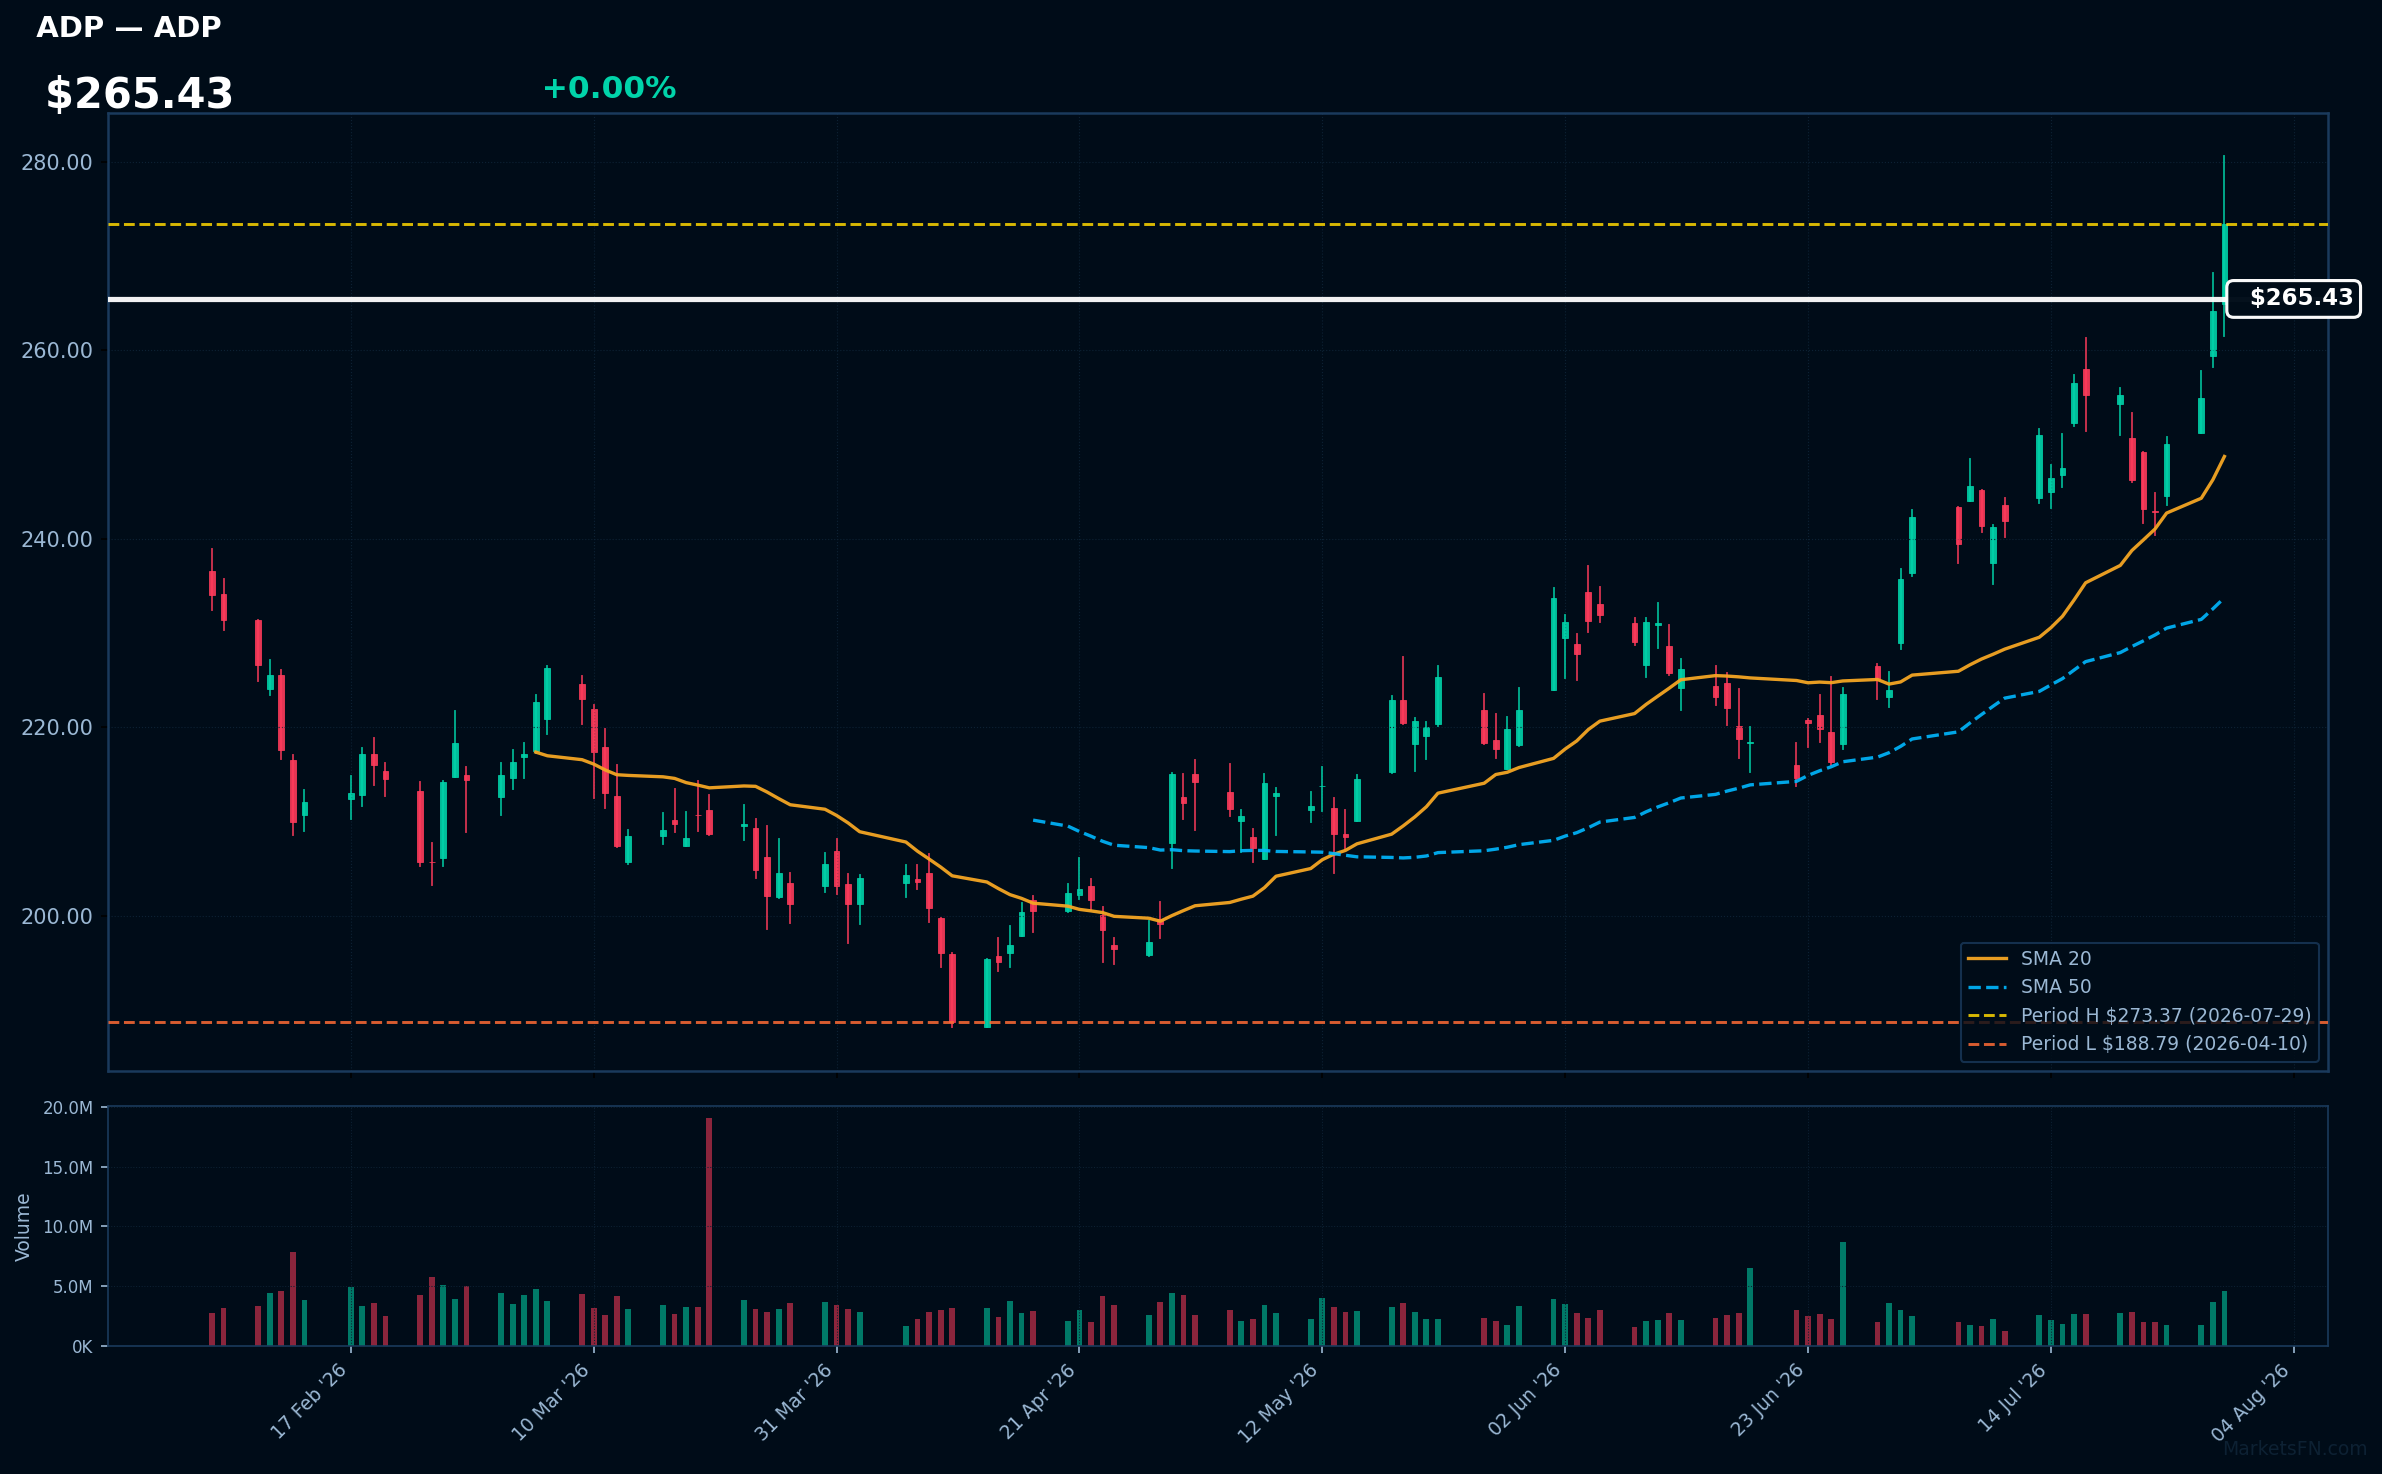
ADP | Automatic Data Processing Inc | Technology | Price Last: $273.37 | % Realized: +8.10% | RSI: 65.0 | % above MA200: +15.8% | Trend: Above MA20, MA50, MA200
Automatic Data Processing Inc provides payroll processing, human capital management, and benefits administration services to businesses, processing payroll for approximately 40 million workers worldwide, making it a critical infrastructure player in the global labor market.
The stock's RSI(14) is 65.0, indicating moderate bullish momentum, with price above MA20, MA50, and MA200, showing a strong uptrend; it's near its 2026 YTD high, up 8.1% YTD, suggesting potential for further breakout.
Related headlines
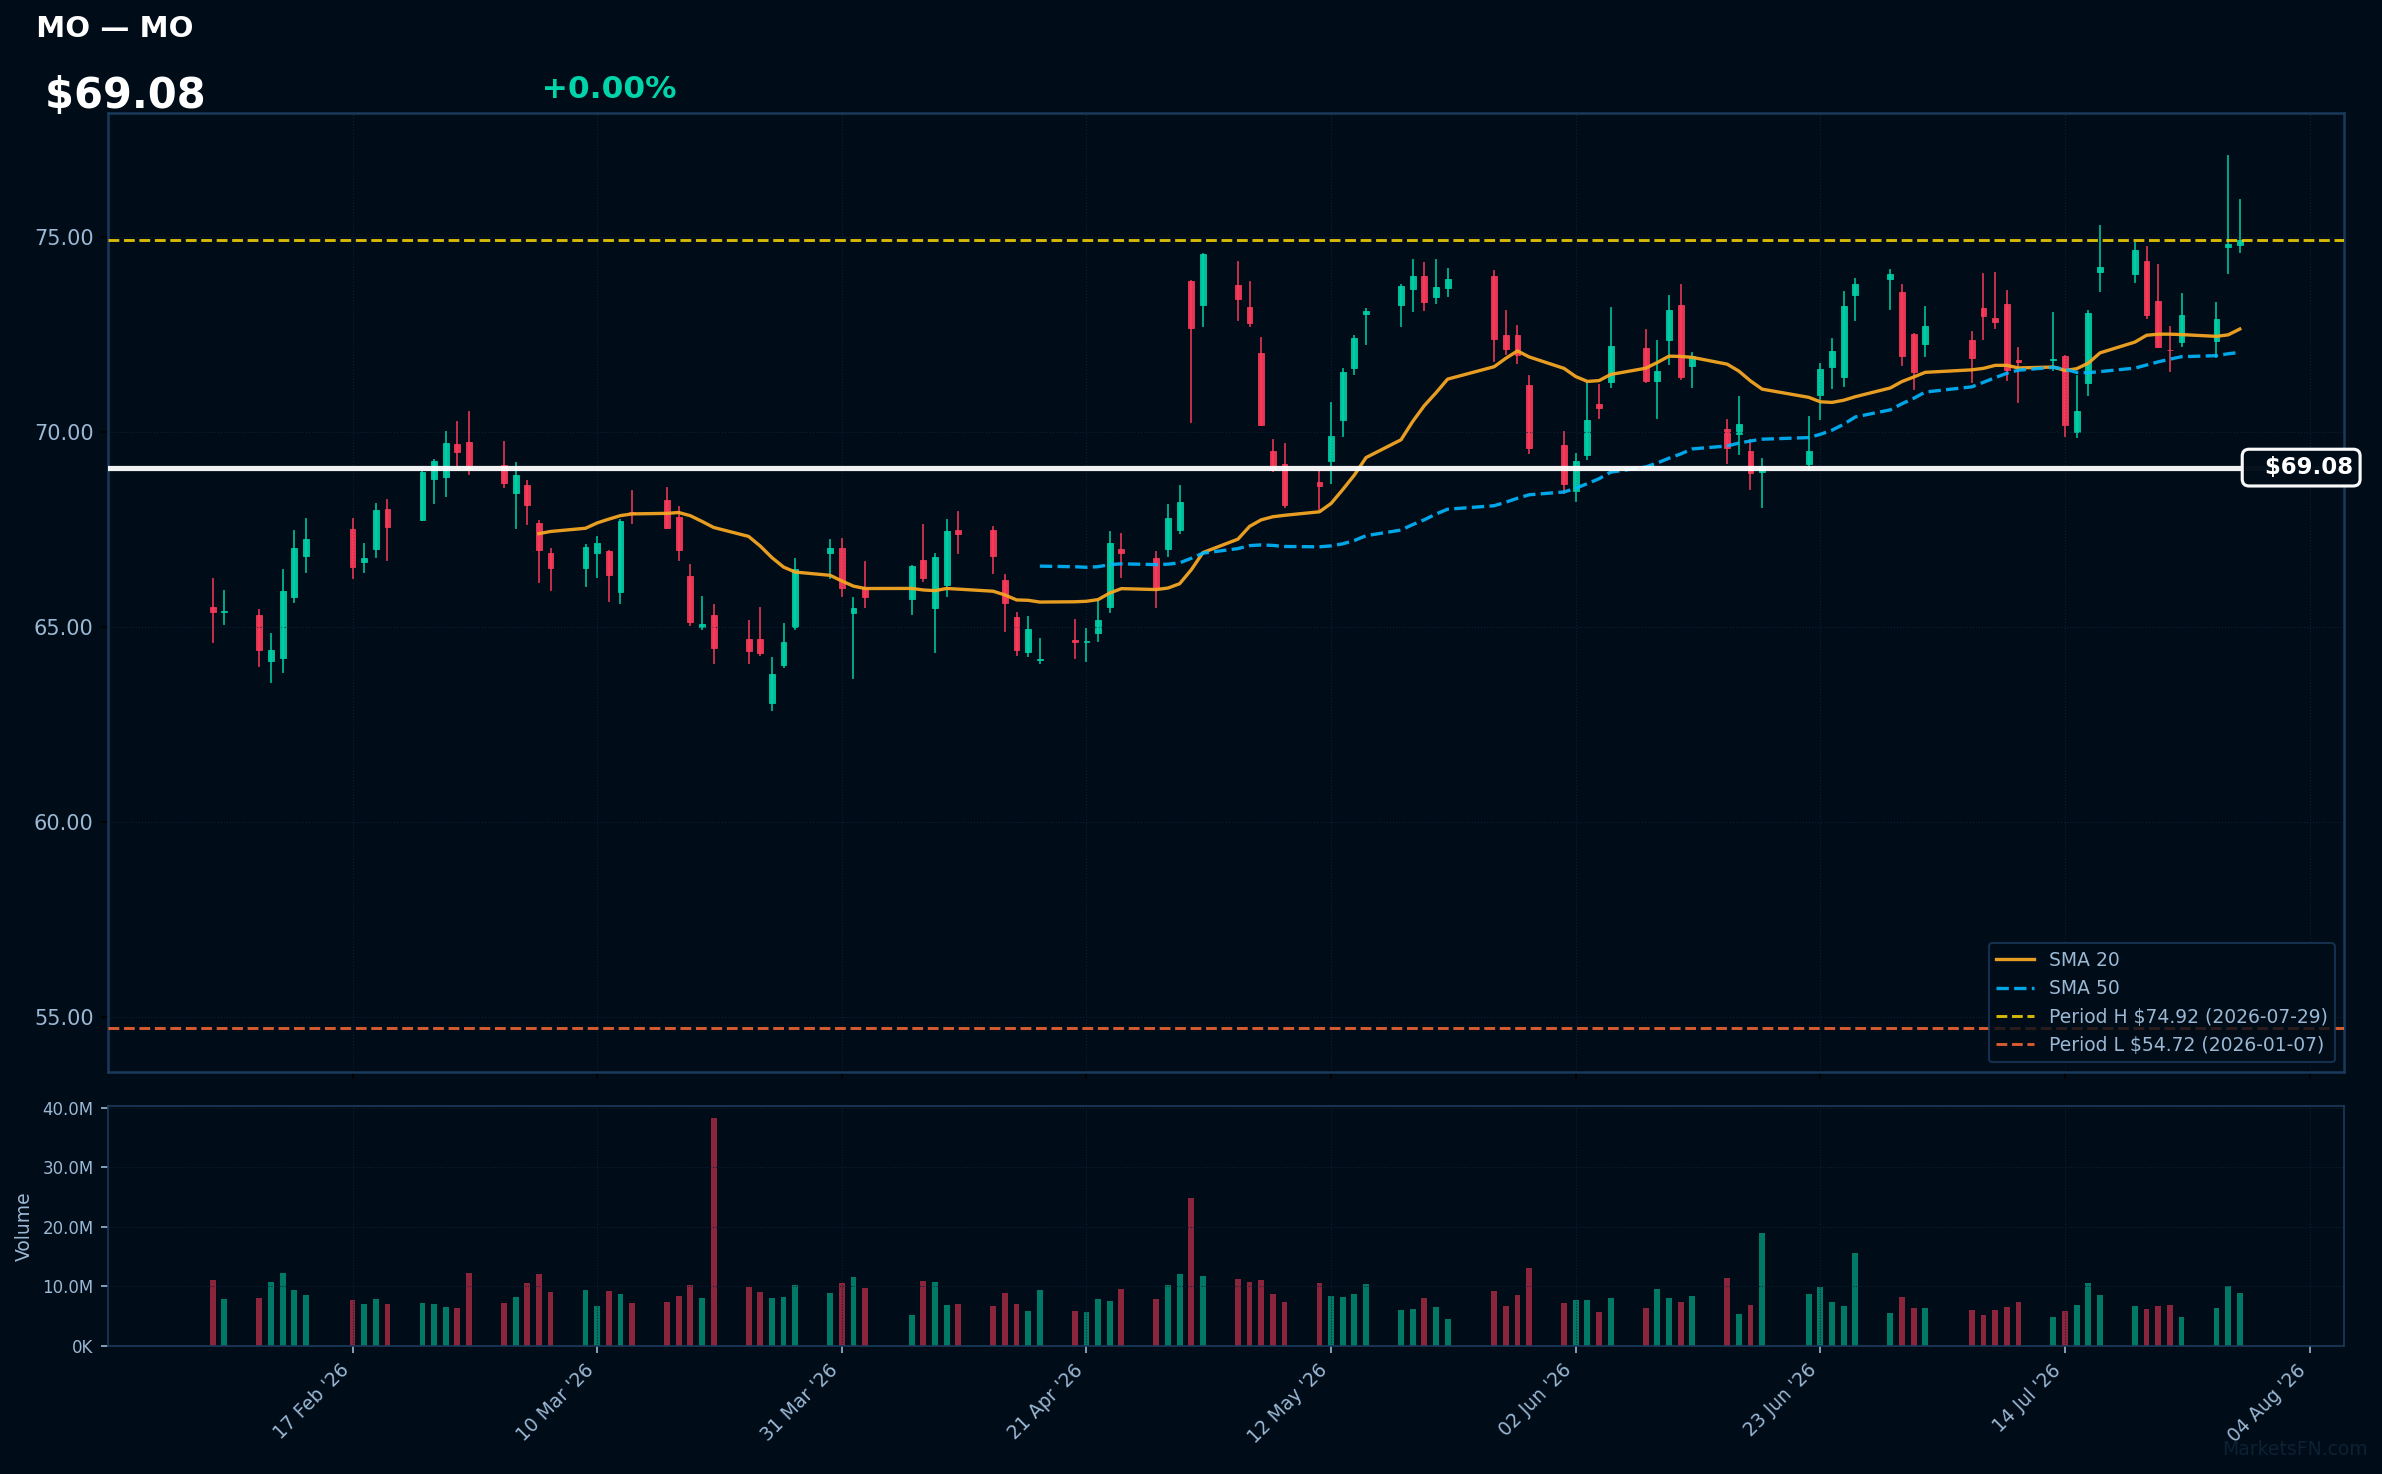
MO | Altria Group Inc | Consumer Defensive | Price Last: $74.92 | % Realized: +30.73% | RSI: 39.9 | % above MA200: +14.3% | Trend: Above MA20, MA50, MA200
Altria Group Inc is a tobacco company owning brands like Marlboro. Investors care due to its stable cash flows and dividend yield, despite declining tobacco consumption. Specific product dominance and pricing power are key factors.
Altria's technicals show mixed signals: RSI(14) at 39.9 indicates potential oversold conditions, while price is above MA200 but below MA20/MA50. The stock is near its 2026 YTD high, up 30.7% YTD, suggesting a potential breakout.
Related headlines
📉 Nearest to 2026 Low
Sectors represented: Industrials (3), Consumer Cyclical (1), Communication Services (1)
| Ticker | Company | Sector | Price Last | % Realized | 2026 YTD Low Date | RSI | % above MA200 | Trend |
|---|---|---|---|---|---|---|---|---|
| TSLA | Tesla Inc | Consumer Cyclical | $298.32 | -31.90% | 2026-07-29 | 29.3 | -27.6% | Below MA20, MA50, MA200 |
| LII | Lennox International Inc | Industrials | $430.02 | -13.81% | 2026-07-29 | 22.8 | -15.7% | Below MA20, MA50, MA200 |
| PSKY | Paramount Skydance Corp | Communication Services | $7.95 | -39.68% | 2026-07-29 | 25.9 | -32.6% | Below MA20, MA50, MA200 |
| TXT | Textron Inc | Industrials | $85.65 | -1.61% | 2026-07-29 | 39.1 | -4.4% | Below MA20, MA50, MA200 |
| HUBB | Hubbell Inc | Industrials | $460.96 | -0.45% | 2026-01-08 | 44.9 | -4.1% | Below MA20, MA50, MA200 |
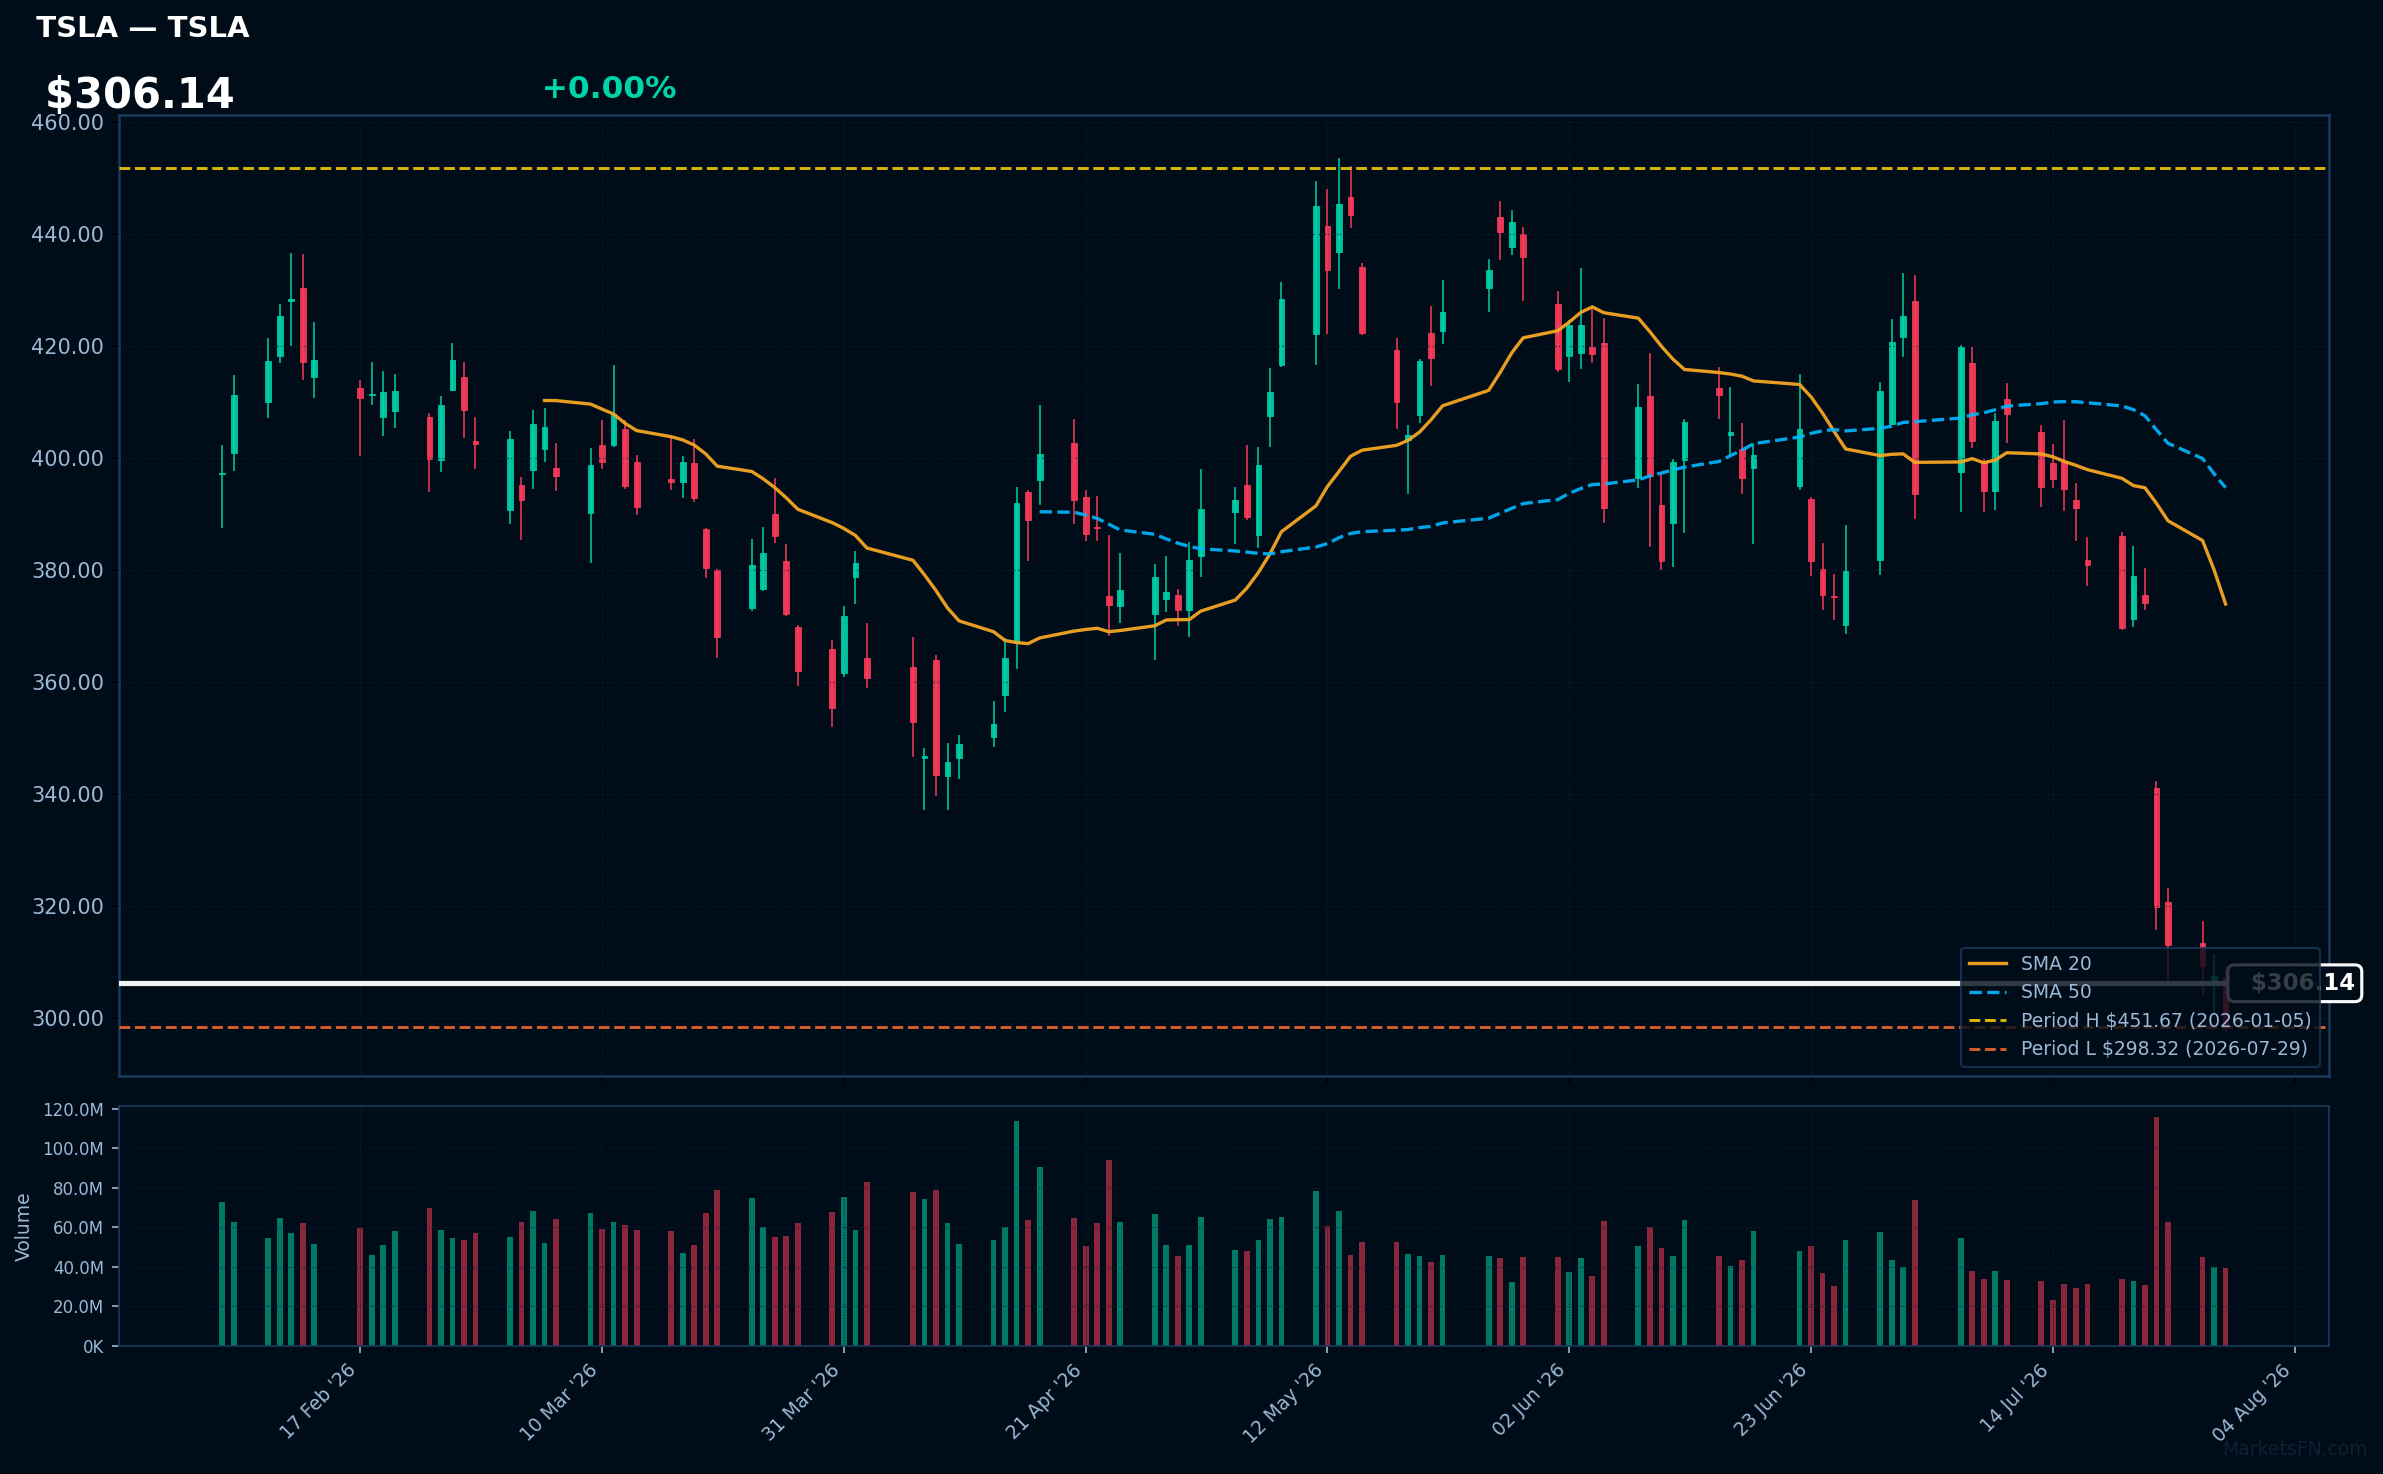
TSLA | Tesla Inc | Consumer Cyclical | Price Last: $298.32 | % Realized: -31.90% | RSI: 29.3 | % above MA200: -27.6% | Trend: Below MA20, MA50, MA200
Tesla Inc is an electric vehicle manufacturer and clean energy company. Investors should care because it's a leader in the EV market and a pioneer in autonomous driving technology, influencing the future of transportation and energy.
Tesla's technical situation is bearish, with RSI(14) at 29.3 indicating oversold conditions, and a sustained downtrend as price ($306.14) remains below MA20, MA50, and MA200, testing major support at its 2026 YTD low.
Related headlines
- Tesla Stock Is Trying to End a Six-Day Losing Streak. Microsoft Is Coming to the Rescue.
- Tesla's Six-Day Losing Streak Took the Stock Below $300 for the First Time in a Year
- Trumps FCC Just Cleared the Field for Teslas Robots
- Tesla Stock Eyes Mag 7s Worst July Gordon Johnson Says Q2 Numbers Expose FSDs Ridiculous Valuation
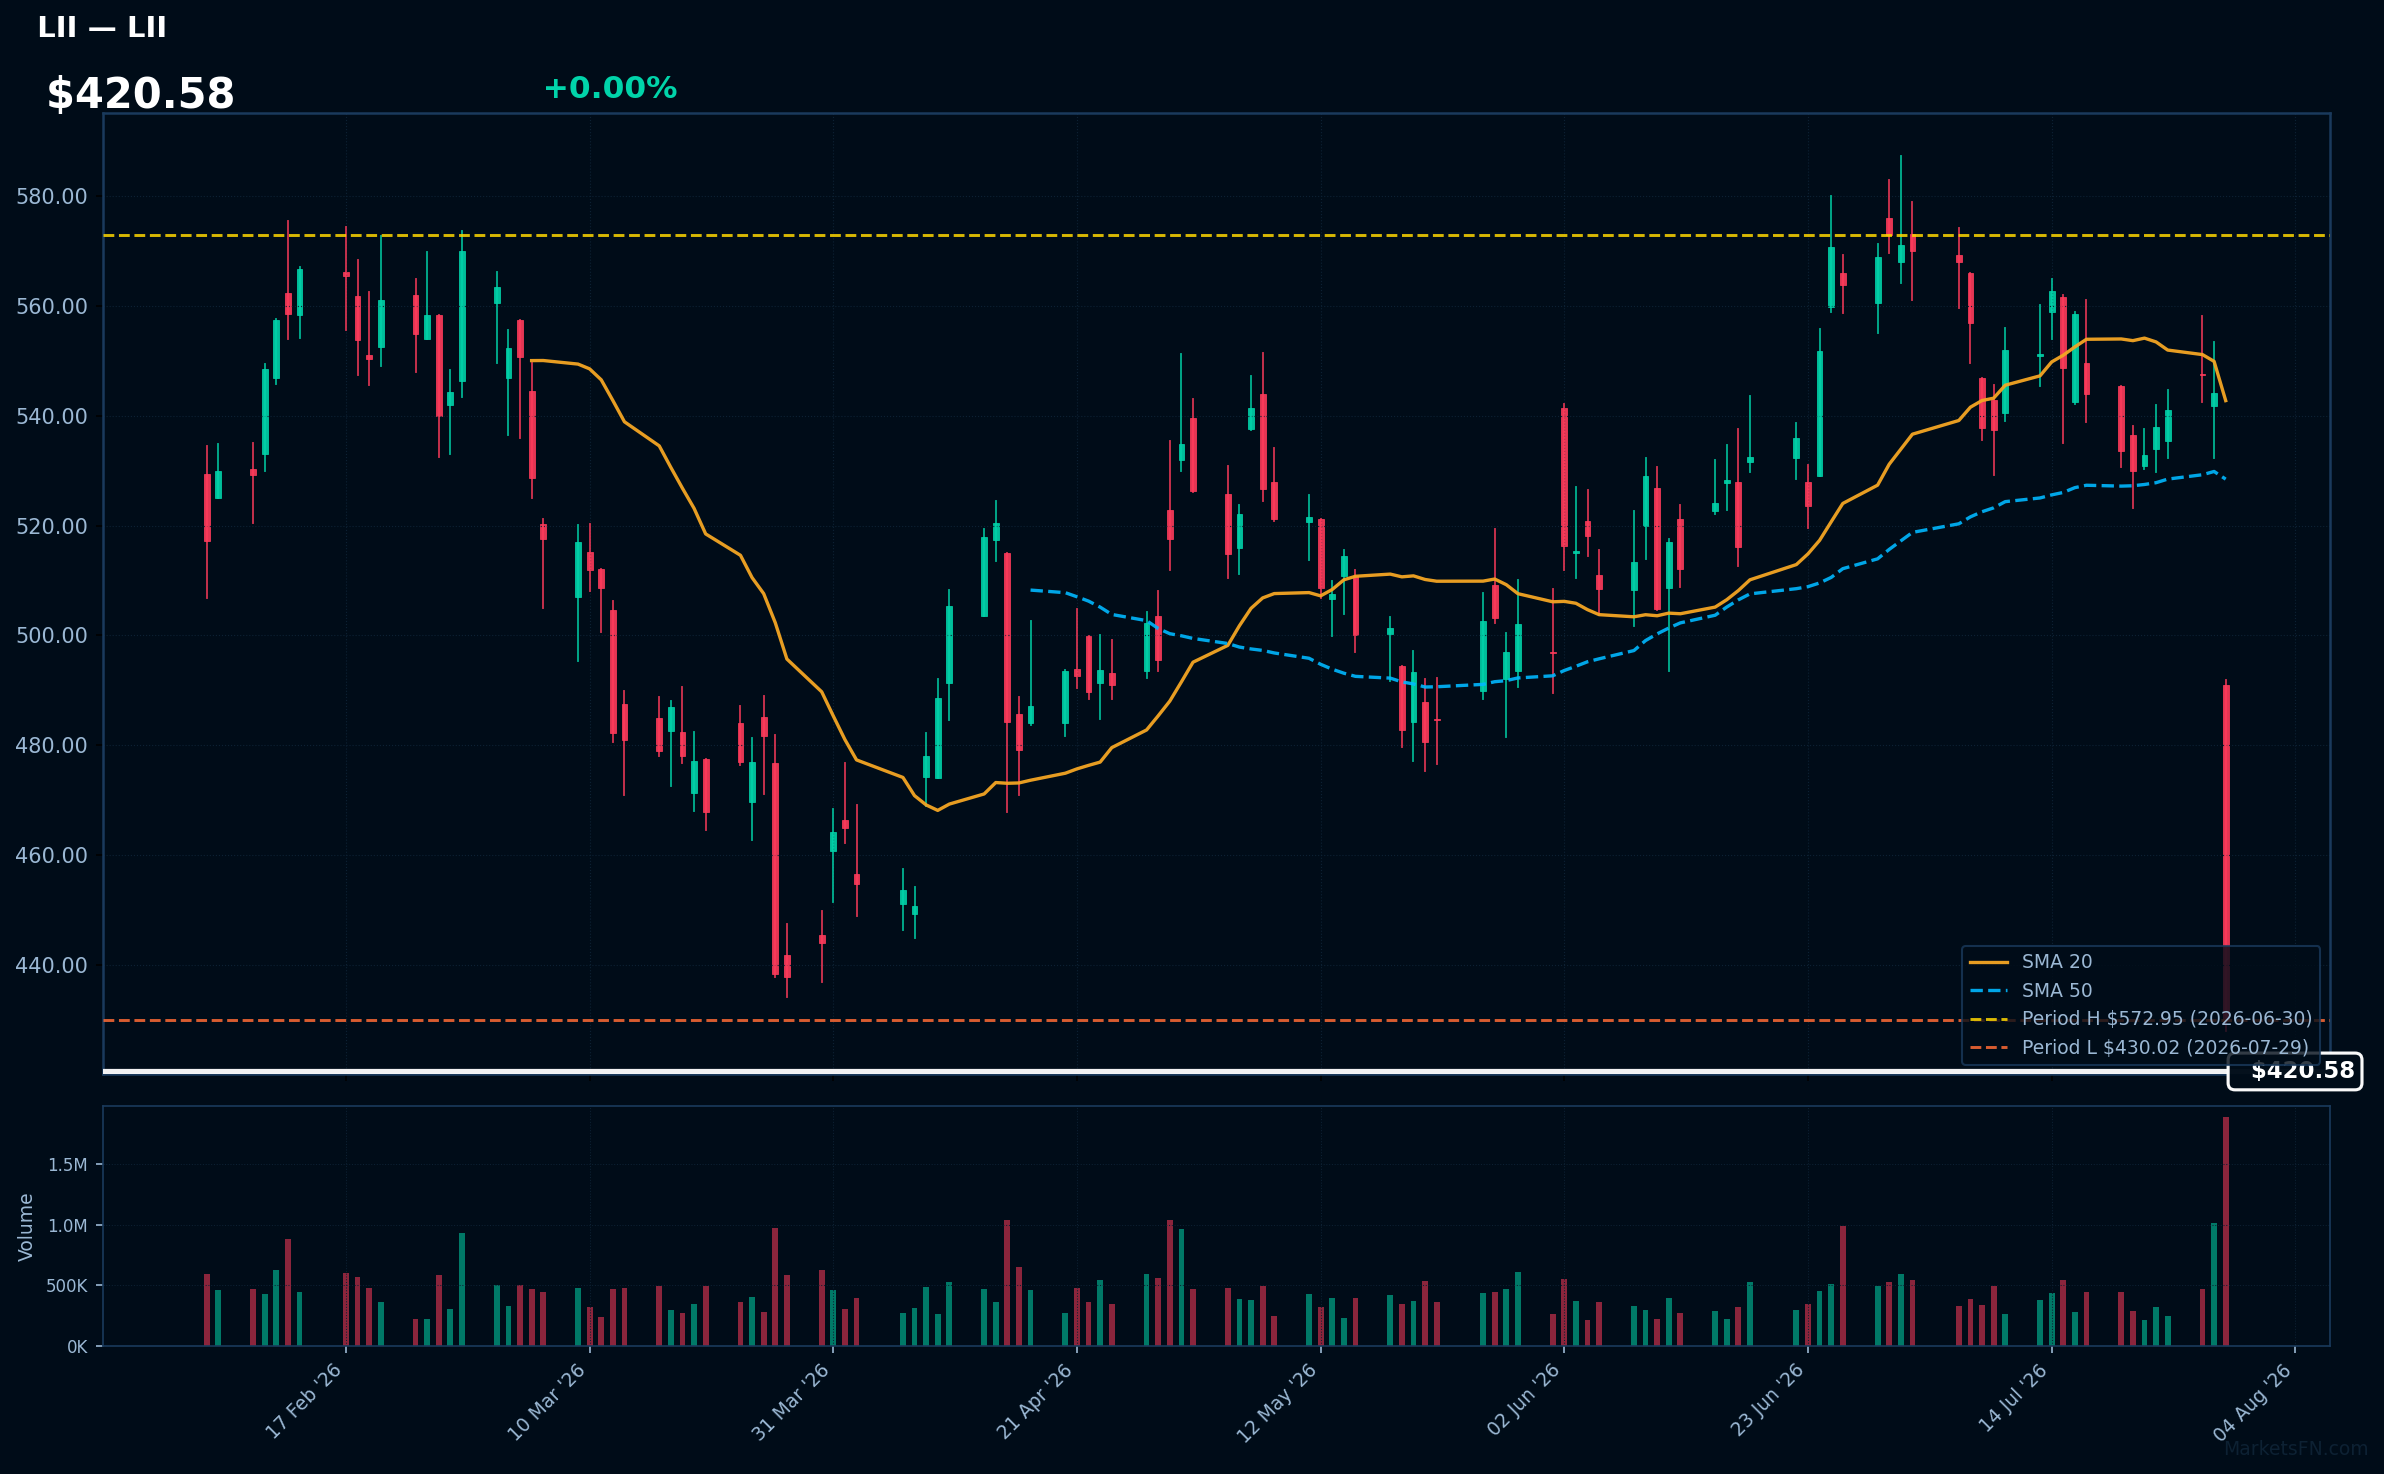
LII | Lennox International Inc | Industrials | Price Last: $430.02 | % Realized: -13.81% | RSI: 22.8 | % above MA200: -15.7% | Trend: Below MA20, MA50, MA200
Lennox International Inc is a climate control solutions provider, manufacturing HVAC equipment for residential and commercial markets. Investors should care about its performance as it reflects demand for energy-efficient heating and cooling systems, a key indicator of construction activity and energy consumption trends.
Lennox International Inc is testing major support at its 2026 YTD low, with an RSI(14) of 22.8 indicating oversold conditions. The stock is below its MA20, MA50, and MA200, showing mixed signals, and has returned -13.8% YTD in 2026.
Related headlines
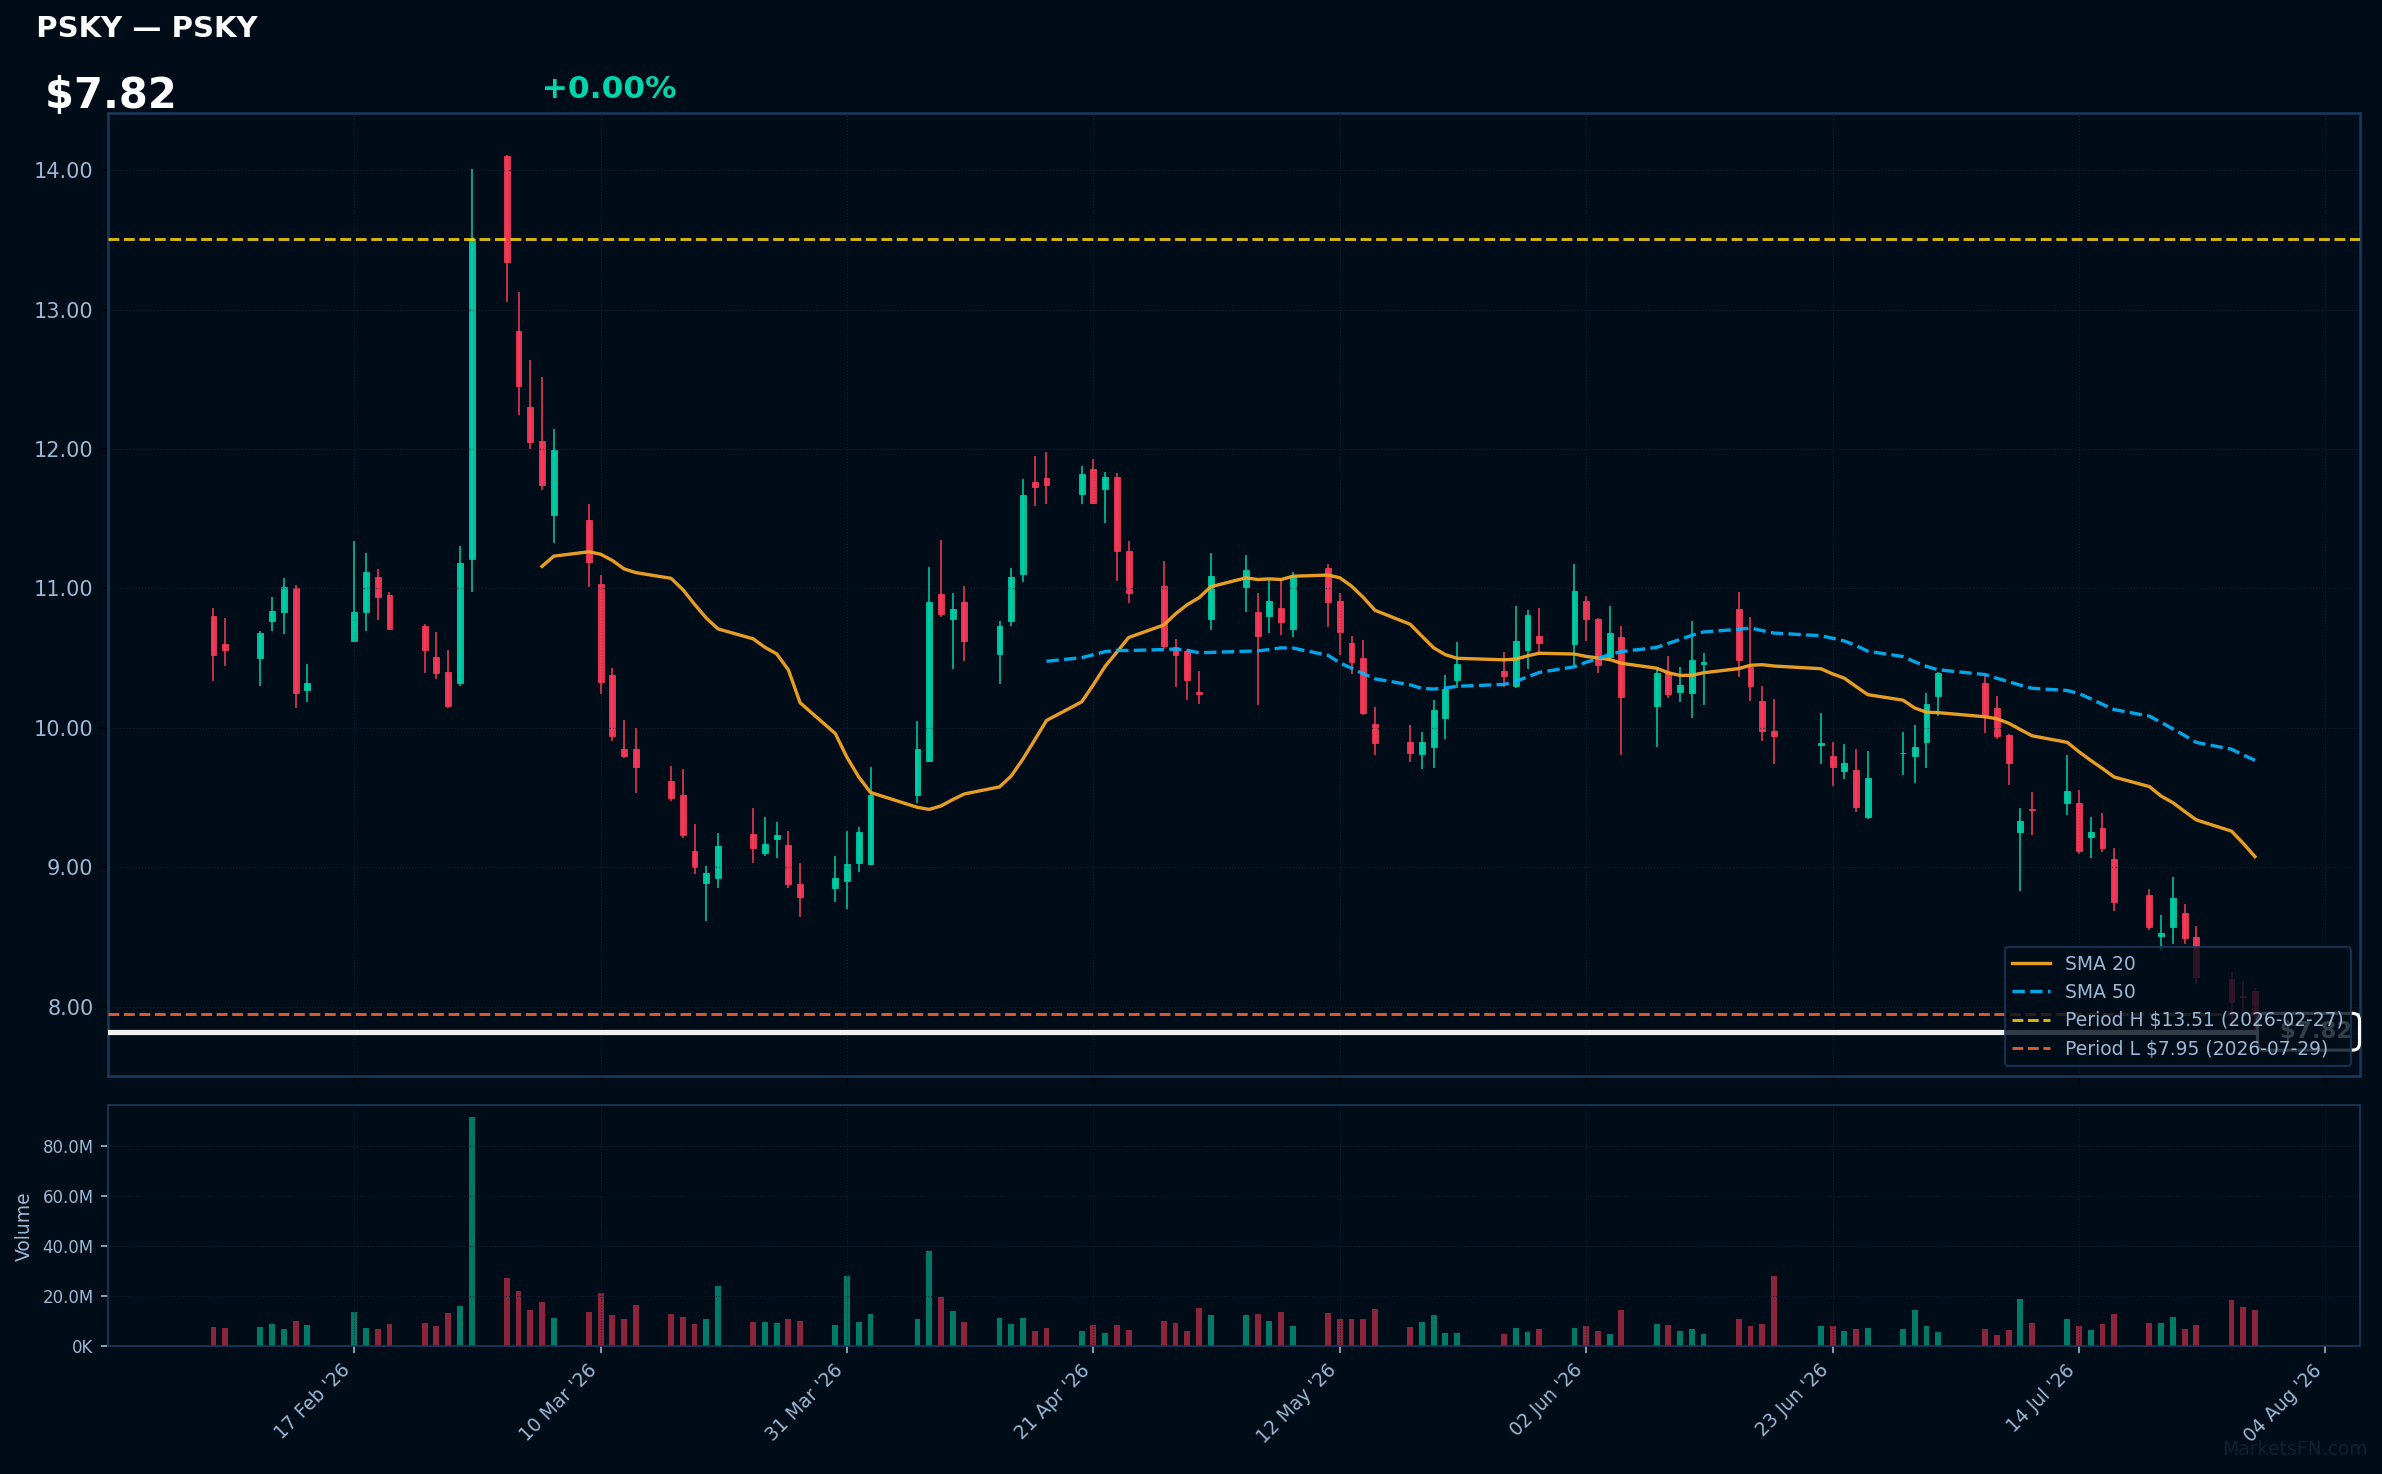
PSKY | Paramount Skydance Corp | Communication Services | Price Last: $7.95 | % Realized: -39.68% | RSI: 25.9 | % above MA200: -32.6% | Trend: Below MA20, MA50, MA200
Paramount Skydance Corp is not described in the data provided, making it impossible to determine its business activities or investor relevance.
The stock exhibits a sustained downtrend with price ($7.82) below MA20, MA50, and MA200. The RSI(14) is 25.9, indicating oversold conditions. It's testing major support at its 2026 YTD low, with a -39.7% return over the same period.
Related headlines
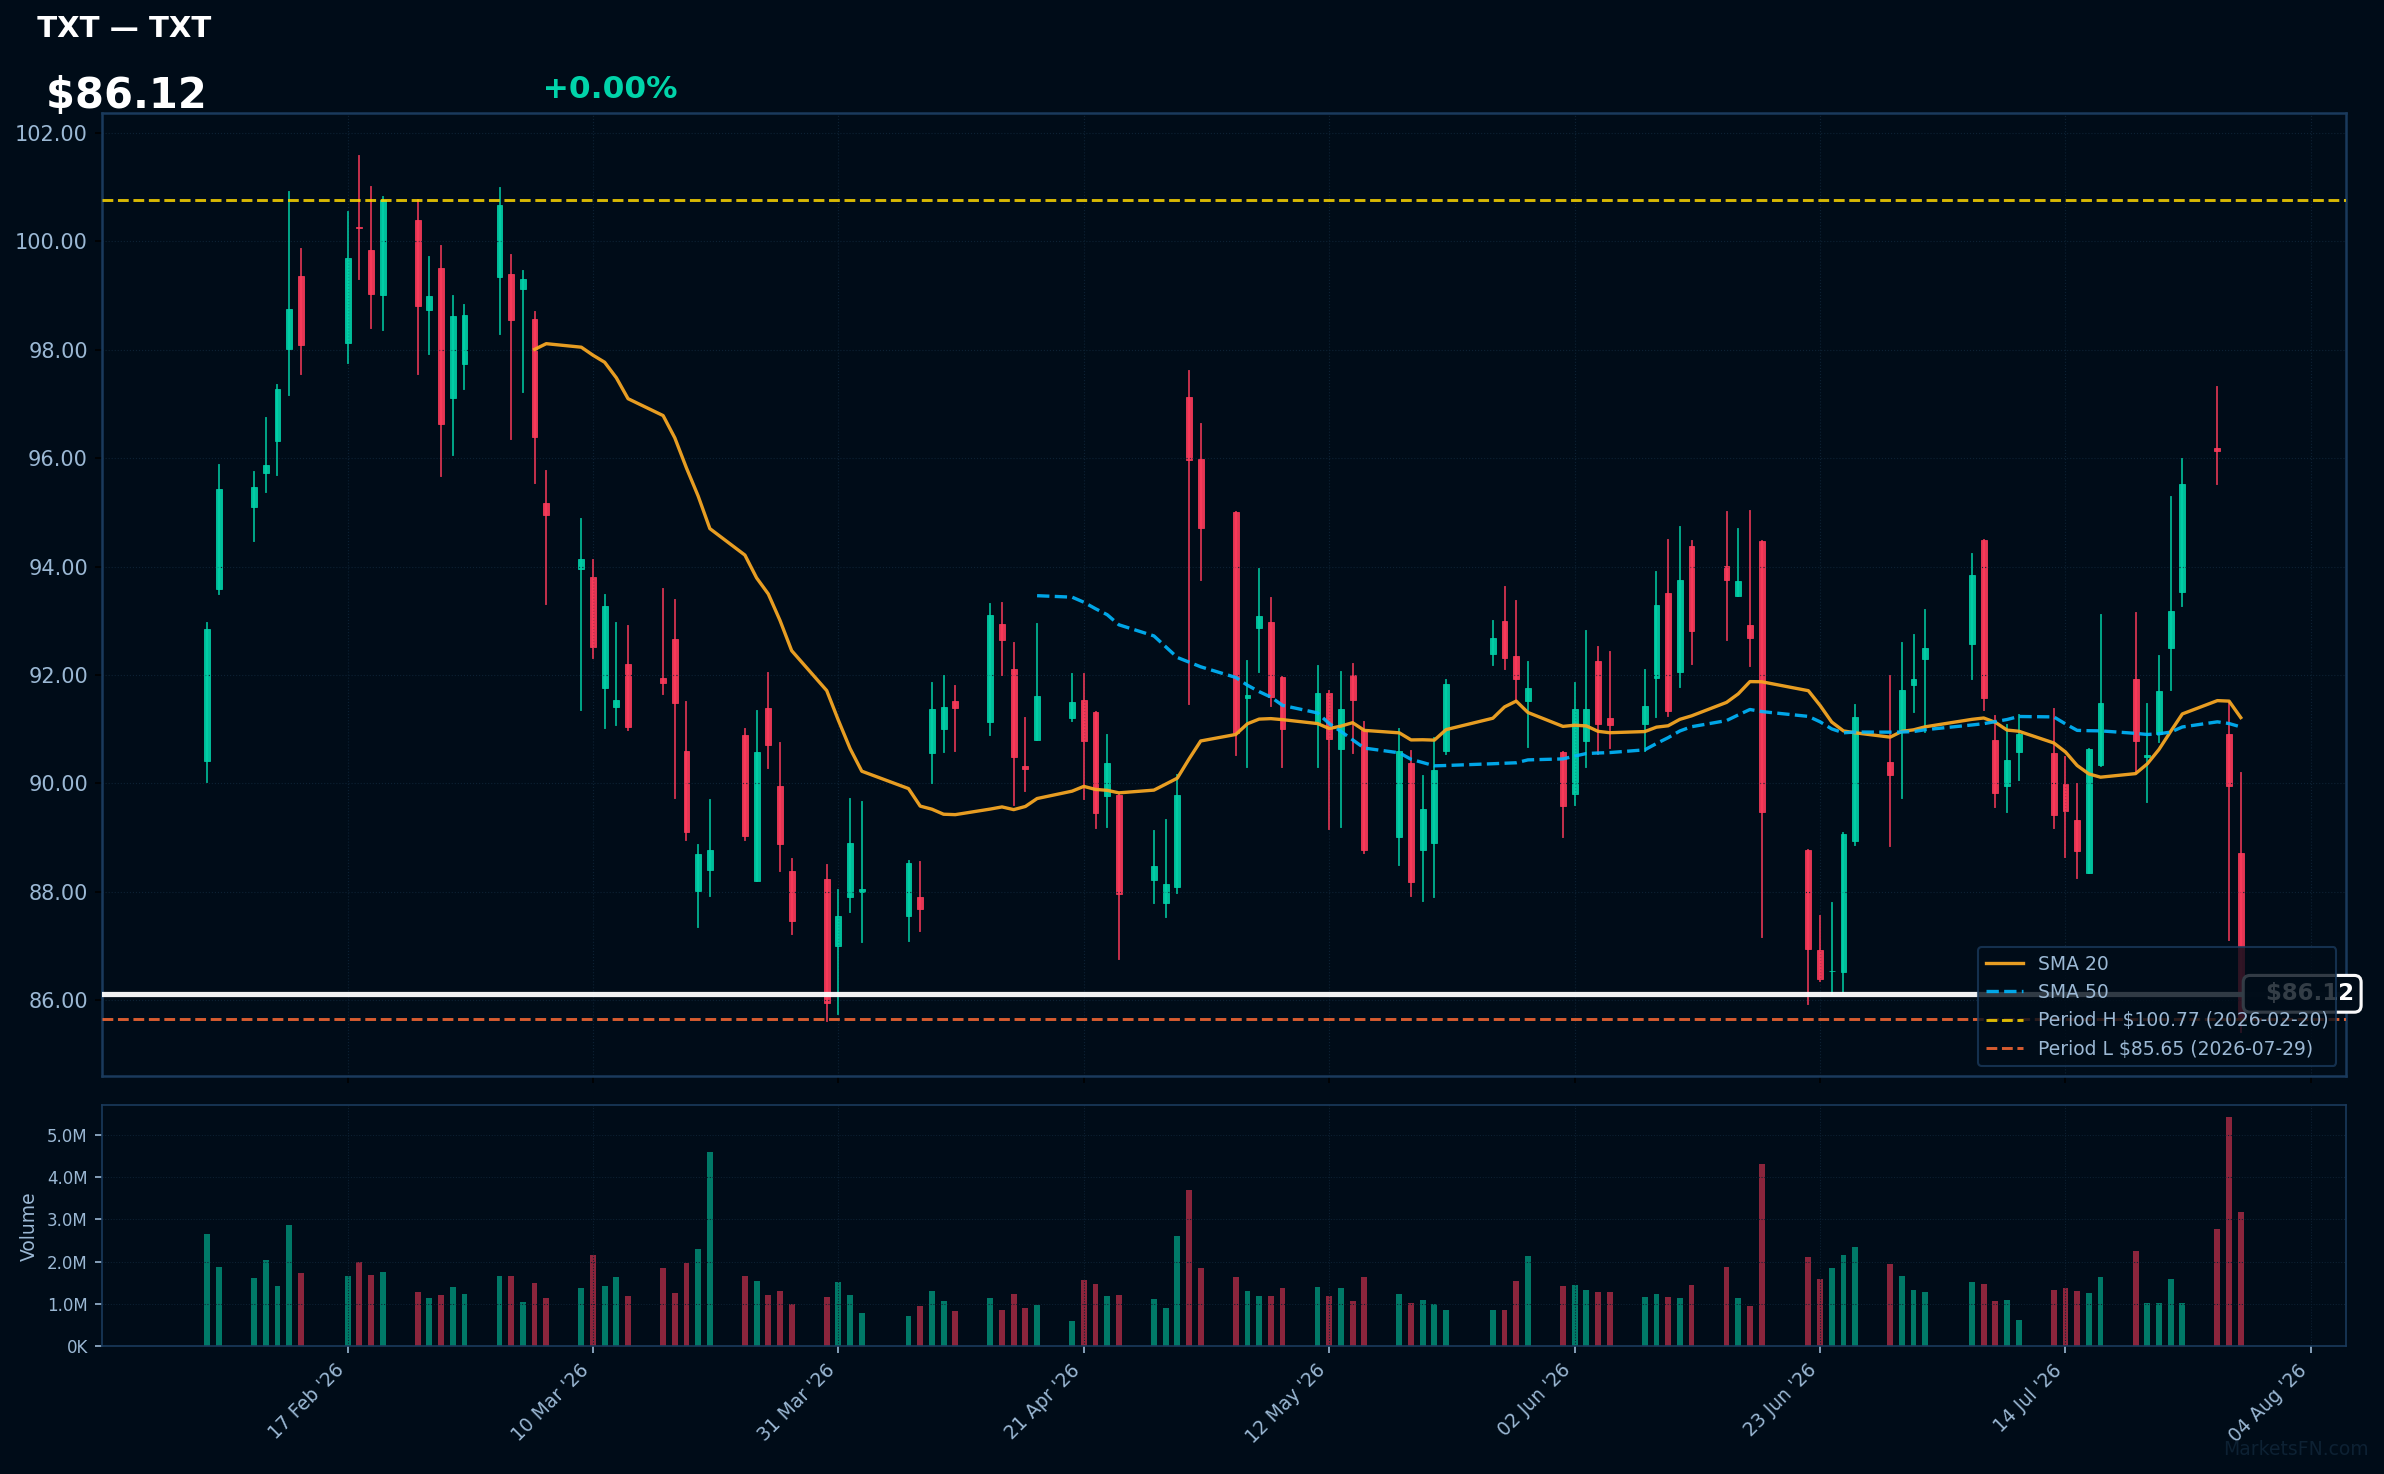
TXT | Textron Inc | Industrials | Price Last: $85.65 | % Realized: -1.61% | RSI: 39.1 | % above MA200: -4.4% | Trend: Below MA20, MA50, MA200
Textron Inc is a multi-industry conglomerate with businesses in aerospace, defense, and industrial products, manufacturing Bell helicopters, Cessna aircraft, and other equipment; investors care due to its diversified revenue streams and exposure to government defense spending.
Textron Inc's technical situation indicates a warning sign with an RSI(14) of 39.1, below MA20/MA50/MA200, and a price only 0.0% above its 2026 YTD low, suggesting major support is being tested with a -1.6% return over the 2026 YTD period.
Related headlines
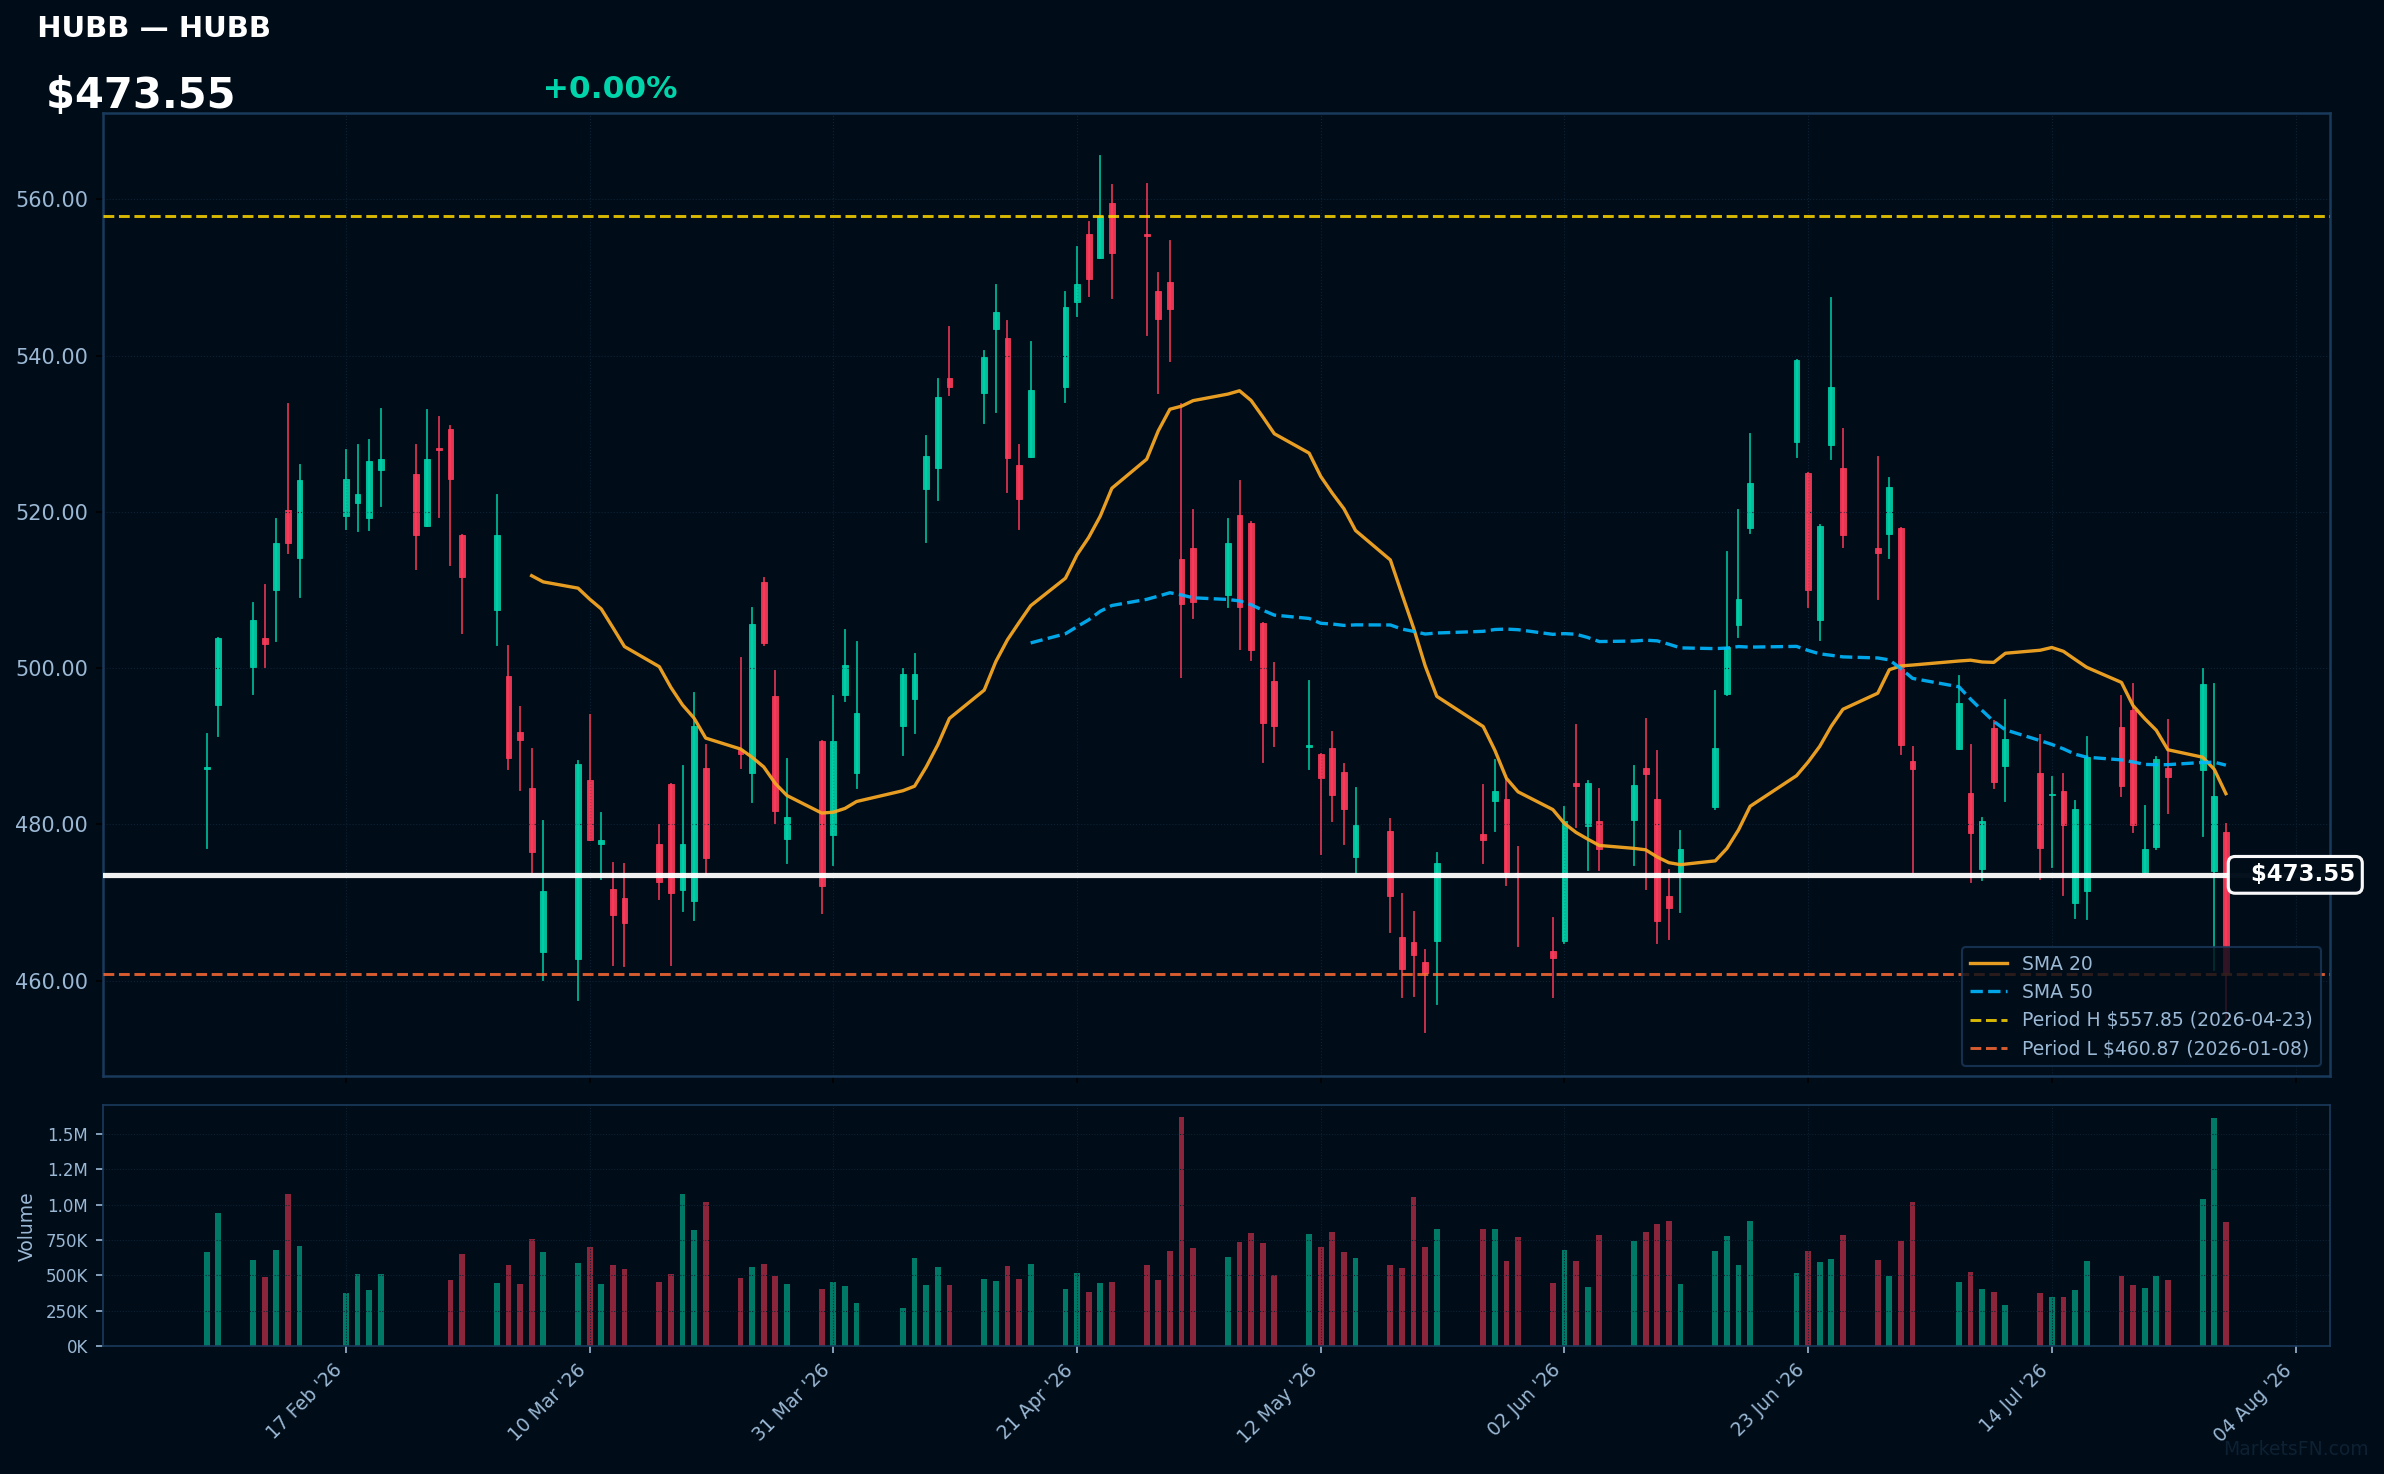
HUBB | Hubbell Inc | Industrials | Price Last: $460.96 | % Realized: -0.45% | RSI: 44.9 | % above MA200: -4.1% | Trend: Below MA20, MA50, MA200
Hubbell Inc is an electrical and electronic products manufacturer. Investors should care because its performance reflects demand for infrastructure and industrial projects, as well as its ability to manage complex product lines and supply chains.
Hubbell Inc's technical situation is bearish, with an RSI(14) of 44.9 indicating neutral territory, but the stock is below MA20, MA50, and MA200, and is testing major support at its 2026 YTD low.
Related headlines
Market Commentary
The S&P 500 stocks listed are near their 2026 year-to-date (YTD) extremes, with some at their highs and others at their lows. Stocks like V, ABBV, KO, ADP, and MO are at their 2026 YTD highs, indicating strong performance, while TSLA, LII, PSKY, TXT, and HUBB are at their 2026 YTD lows, suggesting significant declines.
The stocks at their YTD highs are from diverse sectors, including consumer staples (KO, MO), financials (V, ADP), and healthcare (ABBV), potentially indicating broad market stability and investor confidence in these sectors. Conversely, the stocks at their YTD lows represent various industries, including industrials (LII, TXT, HUBB), consumer discretionary (TSLA), and entertainment (PSKY), which may be experiencing sector-specific challenges.
Investors should monitor these stocks for signs of trend continuation or reversal, as they may signal broader market movements. Watching the performance of these stocks near their YTD extremes can provide insights into sector rotation and overall market sentiment, helping investors make informed decisions.
Methodology: All 503 S&P 500 constituents screened. Close prices downloaded from 2026-01-01. Period high = highest close since Jan 1 2026; period low = lowest close since Jan 1 2026. Distance = (current price / period extreme − 1) × 100. Technical indicators computed on up to 1 year of daily OHLCV data.
Disclaimer: For informational purposes only. Not investment advice. Past performance is not indicative of future results.

