S&P 500 52-Week Highs & Lows Radar: Apple (AAPL), Home Depot, (HD) and more
MarketsFN Team

S&P 500 52-Week Highs & Lows Radar: Apple (AAPL), Home Depot, (HD) and more
Screening all 503 S&P 500 constituents for stocks nearest to their 52-week high and their 52-week low. Data as of September 28, 2026. % Realized = 52-week total return.
Legend: RSI > 70 = overbought · RSI < 30 = oversold · Green % Realized = positive 52W return · Red = negative.
📈 Nearest to 52-Week High
Sectors represented: Healthcare (3), Technology (1), Communication Services (1)
| Ticker | Company | Sector | Price Last | % Realized | 52-Week High Date | RSI | % above MA200 | Trend |
|---|---|---|---|---|---|---|---|---|
| AAPL | Apple Inc | Technology | $342.38 | +34.57% | 2026-09-28 | 66.7 | +18.8% | Above MA20, MA50, MA200 |
| A | Agilent Technologies Inc | Healthcare | $173.46 | +40.17% | 2026-09-28 | 75.7 | +31.2% | Above MA20, MA50, MA200 |
| WBD | Warner Bros. Discovery Inc | Communication Services | $30.87 | +63.66% | 2026-09-28 | 75.4 | +11.6% | Above MA20, MA50, MA200 |
| BIIB | Biogen Inc | Healthcare | $228.37 | +64.86% | 2026-09-28 | 63.6 | +17.6% | Above MA20, MA50, MA200 |
| TECH | Bio-Techne Corp | Healthcare | $72.60 | +39.00% | 2026-09-25 | 65.2 | +17.5% | Above MA20, MA50, MA200 |
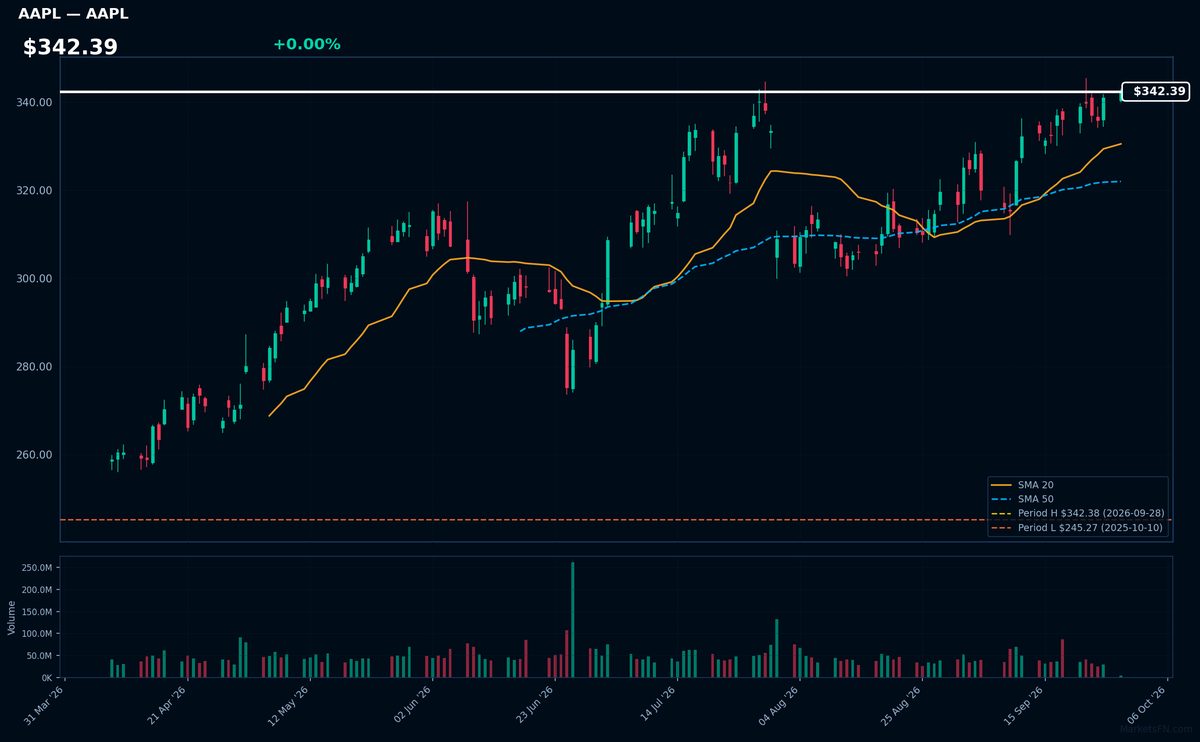
AAPL | Apple Inc | Technology | Price Last: $342.38 | % Realized: +34.57% | RSI: 66.7 | % above MA200: +18.8% | Trend: Above MA20, MA50, MA200
Apple Inc designs, manufactures, and markets consumer electronics, software, and services. Investors care about its innovative product ecosystem, including iPhones, Macs, and wearables, driving revenue growth and profitability.
AAPL's RSI(14) is 66.7, indicating rising momentum. The bullish MA alignment (price > MA20 > MA50 > MA200) and 0.0% proximity to its 52-Week high suggest a sustained uptrend near a potential breakout level.
Related headlines
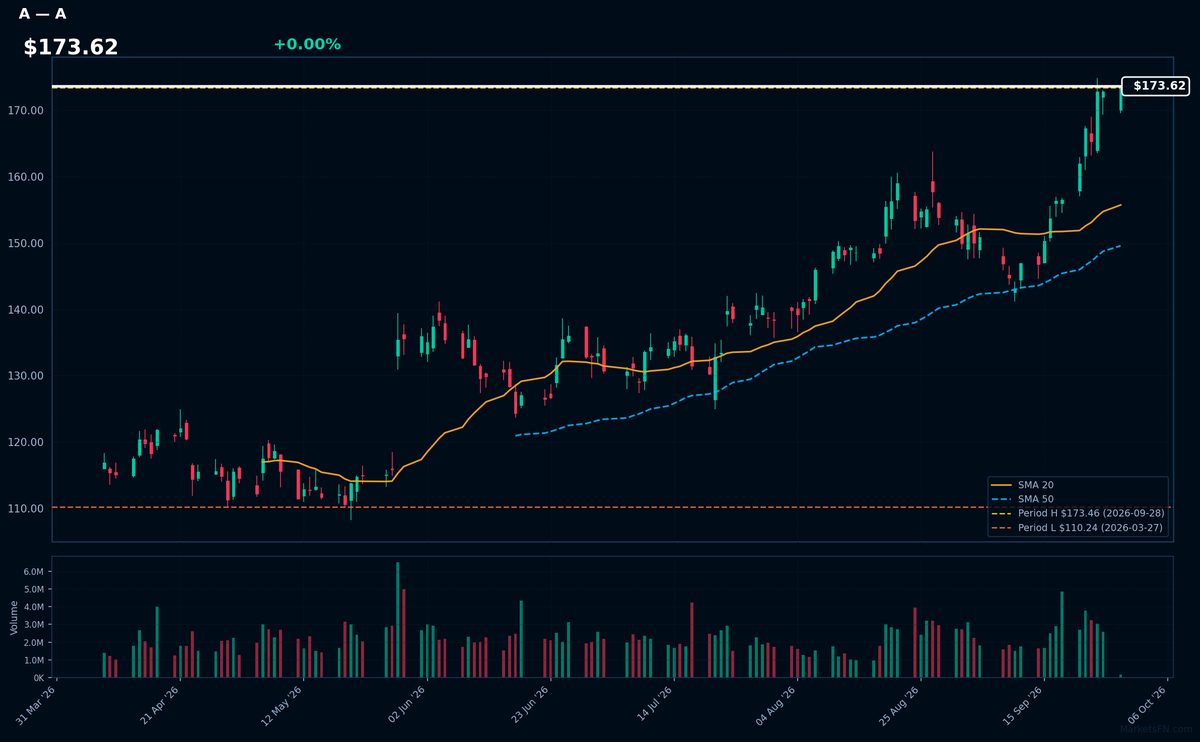
A | Agilent Technologies Inc | Healthcare | Price Last: $173.46 | % Realized: +40.17% | RSI: 75.7 | % above MA200: +31.2% | Trend: Above MA20, MA50, MA200
Agilent Technologies Inc is a life sciences and diagnostics company that provides instruments, software, and services for laboratory analysis, benefiting from the growing demand for precision medicine and laboratory testing. Investors care due to its strong presence in a growing industry.
Agilent Technologies Inc is in a sustained uptrend with a bullish MA alignment (price > MA20 > MA50 > MA200), RSI(14) at 75.7, and is 0.0% below its 52-Week high, indicating strong momentum; the high RSI value may be a warning sign of overbought conditions.
Related headlines
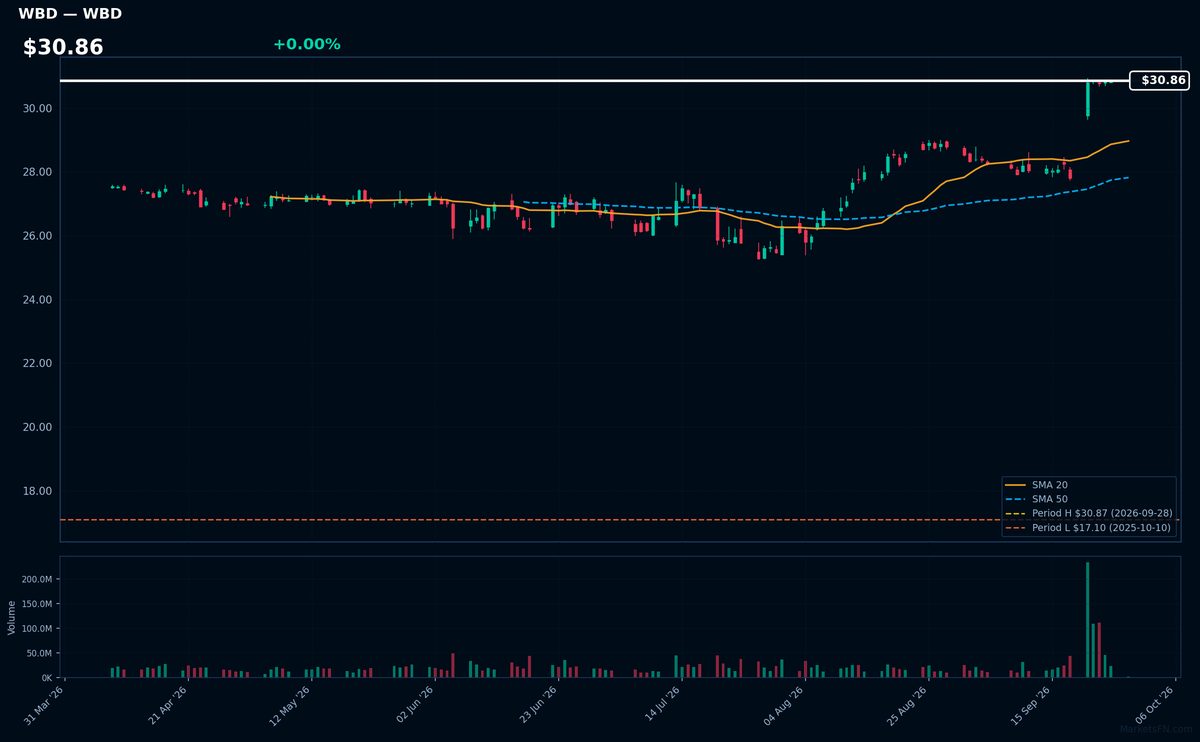
WBD | Warner Bros. Discovery Inc | Communication Services | Price Last: $30.87 | % Realized: +63.66% | RSI: 75.4 | % above MA200: +11.6% | Trend: Above MA20, MA50, MA200
Warner Bros. Discovery Inc is a media conglomerate with a diverse portfolio of entertainment and news assets, including HBO, Warner Bros., and Discovery Channel, making it a significant player in content creation and distribution, which is crucial for investors due to its influence on the global media landscape.
Warner Bros. Discovery Inc is near a potential breakout at $30.86, with an RSI(14) of 75.4 indicating strong momentum, and a bullish MA alignment (price > MA20 > MA50 > MA200), suggesting a sustained uptrend, with the stock 0.0% below its 52-Week high.
Related headlines
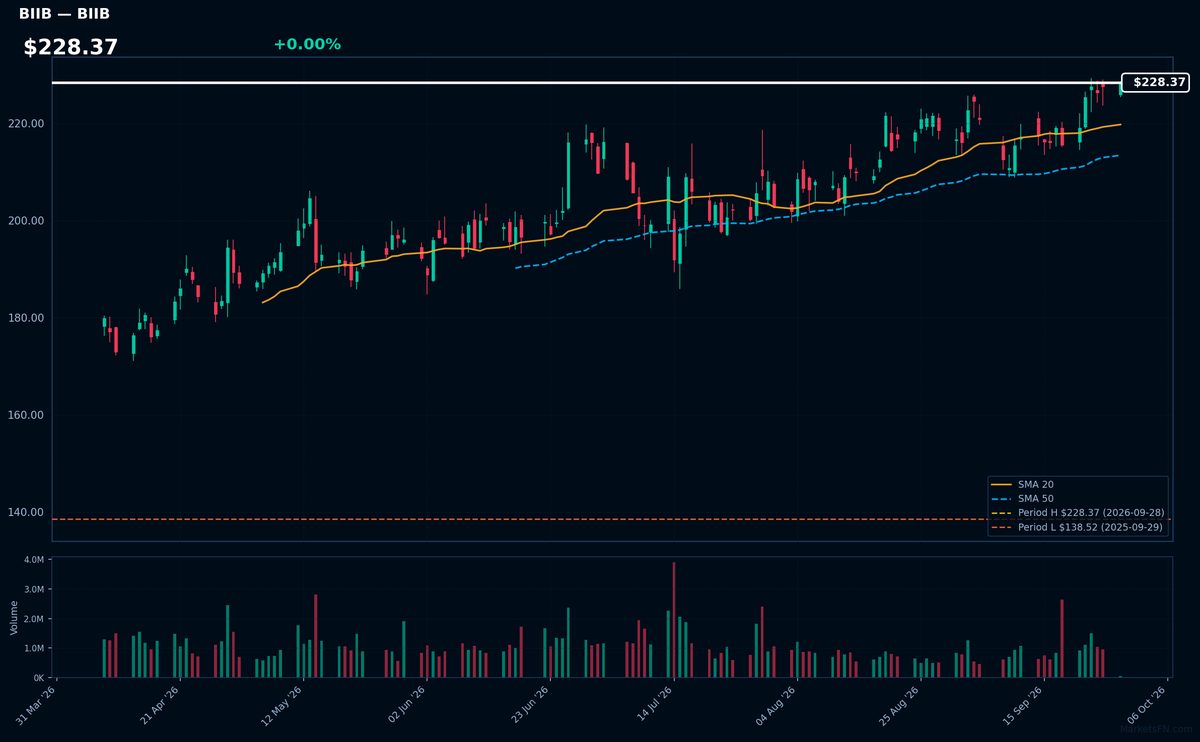
BIIB | Biogen Inc | Healthcare | Price Last: $228.37 | % Realized: +64.86% | RSI: 63.6 | % above MA200: +17.6% | Trend: Above MA20, MA50, MA200
Biogen Inc is a biotechnology company that develops treatments for neurological and neurodegenerative diseases. Investors should care because its therapies for conditions like multiple sclerosis have significant market potential and the company's pipeline impacts its growth prospects.
Biogen's current technical situation indicates strong momentum: RSI(14) is 63.6, and the stock is in a sustained uptrend with price > MA20 > MA50 > MA200. It's near a potential breakout, 0.0% below its 52-Week high, after a 64.9% 52-Week return.
Related headlines
- Stoke Therapeutics and Biogen Present Long-Term Clinical Data that Support the Disease-Modifying Potential of Zorevunersen, an Investigational Medicine for the Treatment of Dravet Syndrome, at the 16th European Epilepsy Congress (EEC)
- Stoke Therapeutics and Biogen to present four-year zorevunersen data at epilepsy congress
- Stoke Therapeutics and Biogen Announce Presentations of Clinical Data from Studies of Zorevunersen, an Investigational Medicine for the Treatment of Dravet Syndrome, at the 16th European Epilepsy Congress (EEC)
- Wolfe Research upgrades Biogen, AbbVie on pipeline strength and valuation
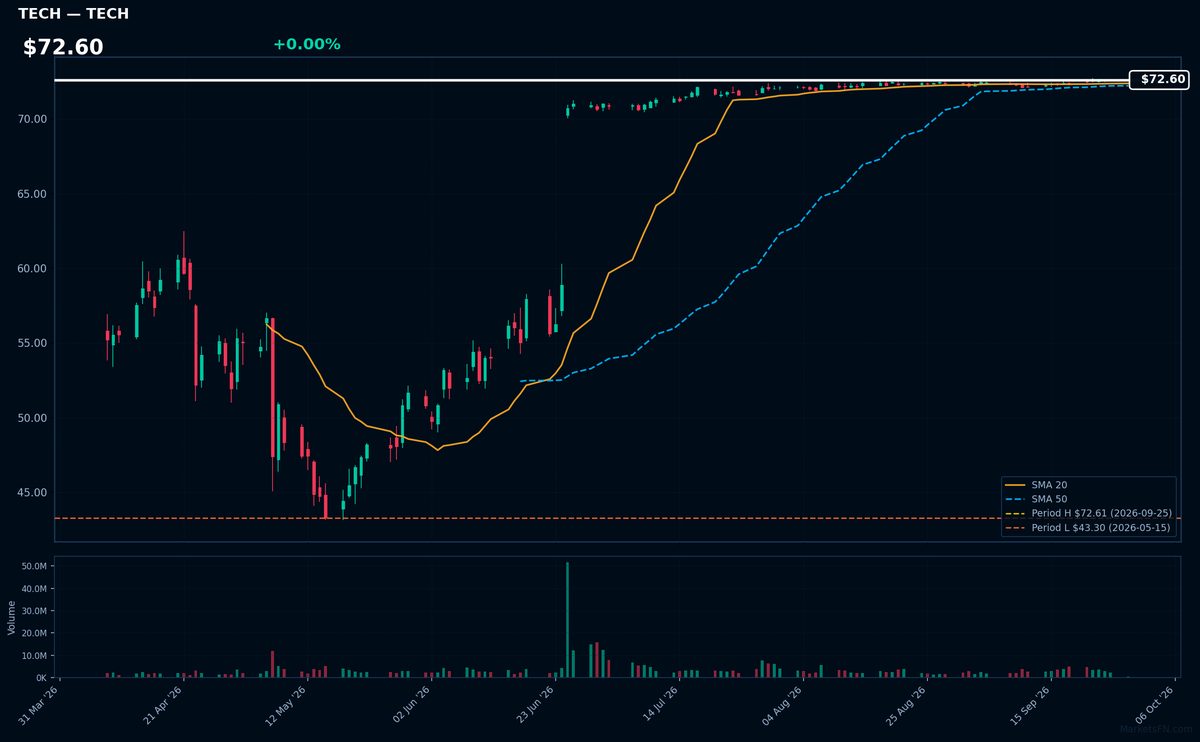
TECH | Bio-Techne Corp | Healthcare | Price Last: $72.60 | % Realized: +39.00% | RSI: 65.2 | % above MA200: +17.5% | Trend: Above MA20, MA50, MA200
Bio-Techne Corp is a life science research and diagnostic products provider, offering a range of tools for protein analysis. Investors should care due to its role in advancing biomedical research and diagnostics, potentially driving long-term growth.
The stock exhibits a bullish MA alignment with price > MA20 > MA50 > MA200, RSI(14) at 65.2, and is 0.0% below its 52-Week high, indicating strong momentum with a potential breakout; 52-Week return is 39.0%.
Related headlines
- Bio-Techne Shareholders Approve Acquisition by Merck KGaA, Darmstadt, Germany
- Bio-Techne Opens New Customer Experience Center in Dusseldorf to Accelerate Scientific Discovery and Customer Collaboration
- Are FULC, WEAV, TECH Obtaining Fair Deals for their Shareholders?
- Bio-Techne Achieves Science Based Targets Validation and Reports Significant Progress Toward Climate Goals
📉 Nearest to 52-Week Low
Sectors represented: Consumer Cyclical (2), Consumer Defensive (1), Communication Services (1), Utilities (1)
| Ticker | Company | Sector | Price Last | % Realized | 52-Week Low Date | RSI | % above MA200 | Trend |
|---|---|---|---|---|---|---|---|---|
| HD | Home Depot, Inc | Consumer Cyclical | $291.53 | -28.33% | 2026-09-28 | 30.2 | -14.4% | Below MA20, MA50, MA200 |
| PEP | PepsiCo Inc | Consumer Defensive | $127.67 | -8.92% | 2026-09-28 | 27.2 | -13.6% | Below MA20, MA50, MA200 |
| LOW | Lowe's Cos., Inc | Consumer Cyclical | $188.08 | -25.75% | 2026-09-28 | 32.1 | -19.2% | Below MA20, MA50, MA200 |
| CMCSA | Comcast Corp | Communication Services | $21.80 | -26.15% | 2026-09-28 | 26.8 | -18.6% | Below MA20, MA50, MA200 |
| SO | Southern Company | Utilities | $82.60 | -12.04% | 2026-09-28 | 20.7 | -10.4% | Below MA20, MA50, MA200 |
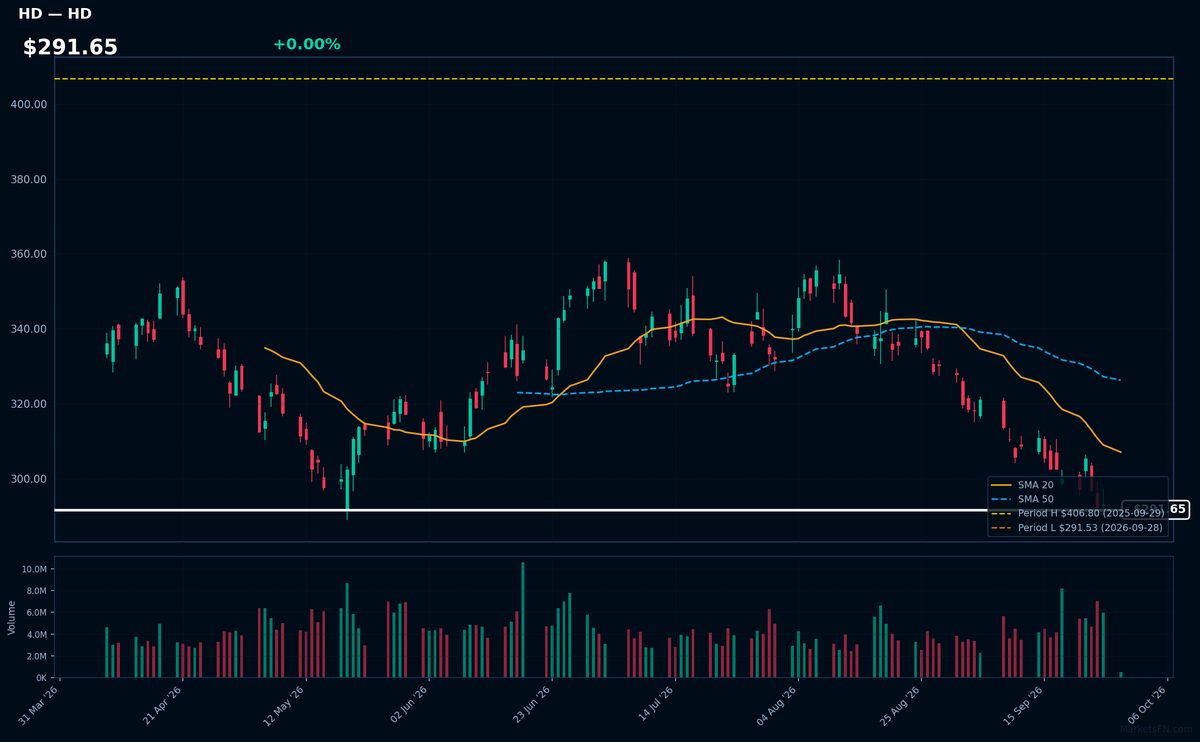
HD | Home Depot, Inc | Consumer Cyclical | Price Last: $291.53 | % Realized: -28.33% | RSI: 30.2 | % above MA200: -14.4% | Trend: Below MA20, MA50, MA200
Home Depot, Inc is a home improvement retailer selling building materials, tools, and gardening supplies. Investors care about its performance as it reflects housing market trends and consumer spending on home renovations.
Home Depot's technicals indicate a sustained downtrend with price ($291.65) below MA20, MA50, and MA200. RSI(14) is 30.2, nearing oversold territory, and the stock is at its 52-Week low, testing major support.
Related headlines
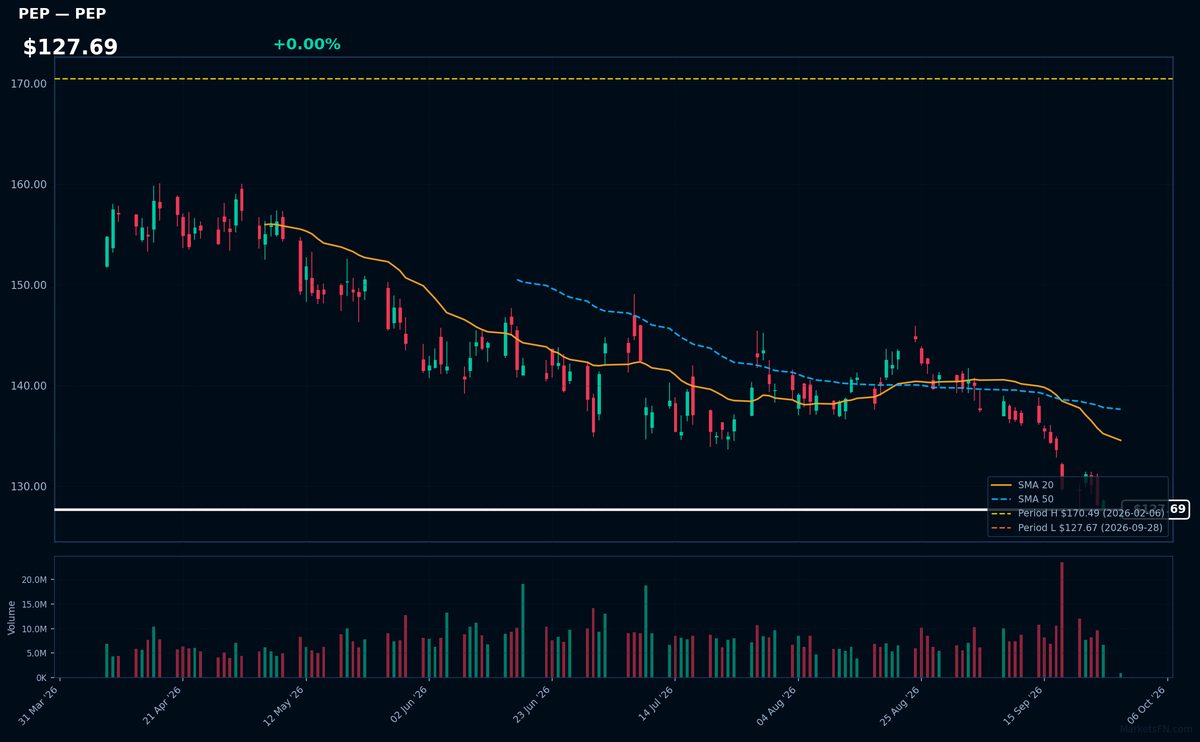
PEP | PepsiCo Inc | Consumer Defensive | Price Last: $127.67 | % Realized: -8.92% | RSI: 27.2 | % above MA200: -13.6% | Trend: Below MA20, MA50, MA200
PepsiCo Inc is a diversified food and beverage company with brands like Pepsi, Lay's, and Gatorade, generating revenue through beverage sales, snack foods, and other categories, making it a significant player in the consumer staples sector.
PepsiCo's current technical situation is bearish, with an RSI(14) of 27.2 indicating oversold conditions, and a sustained downtrend as price ($127.69) remains below MA20, MA50, and MA200, testing major support at its 52-Week low.
Related headlines
- Deutsche Bank lowers PepsiCo rating as turnaround now more complicated
- PEP Stock Faces Fresh Test: Deutsche Bank Flags Concerns Over PepsiCos North America Recovery
- PEP Stock Heads For Worst Month Since May: PepsiCo Commits $1B To Colombia Expansion, Targets Higher Prices Ahead Of Q3 Earnings
- Why Did NKE, PEP, FRMI Stocks Dip To 52-Week Lows Last Week?
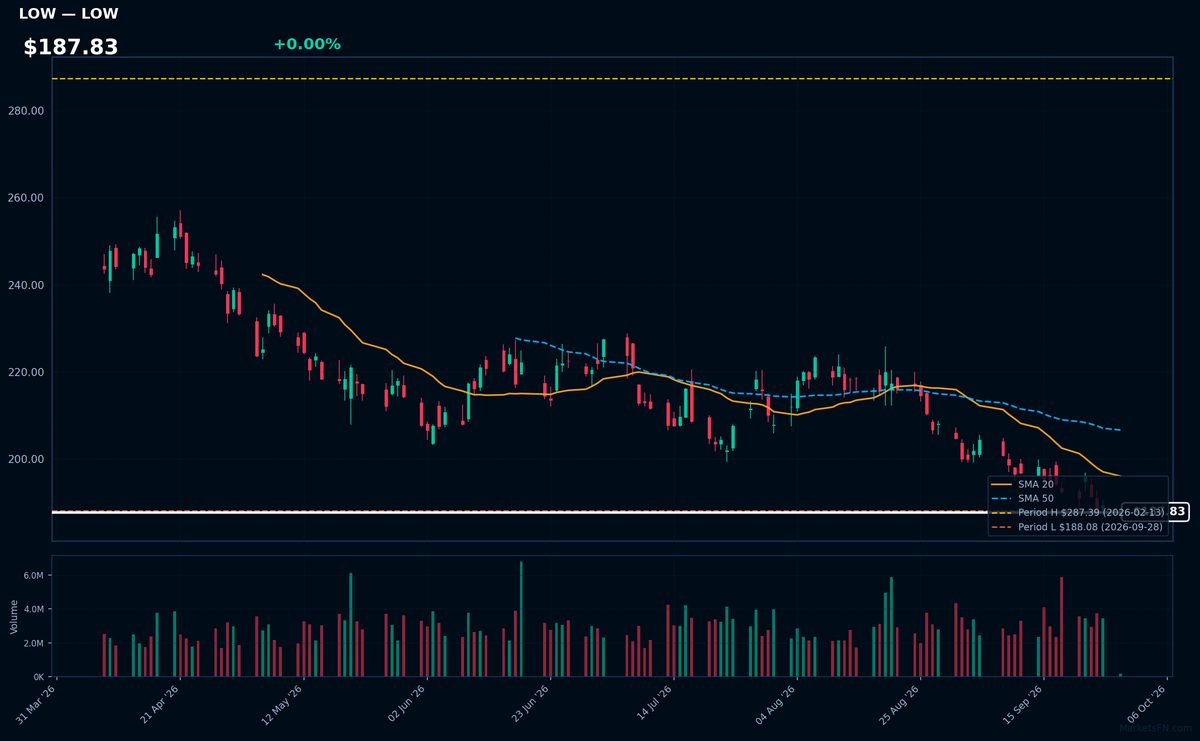
LOW | Lowe's Cos., Inc | Consumer Cyclical | Price Last: $188.08 | % Realized: -25.75% | RSI: 32.1 | % above MA200: -19.2% | Trend: Below MA20, MA50, MA200
Lowe's Cos., Inc is a home improvement retailer selling products for construction, renovation, and maintenance. Investors care about its performance as it reflects housing market trends and consumer spending habits.
Lowe's is testing major support with a price 0.0% above its 52-Week low, RSI(14) at 32.1, and bearish MA alignment (price < MA20 < MA50 < MA200), indicating a sustained downtrend and potential further decline, a warning sign.
Related headlines
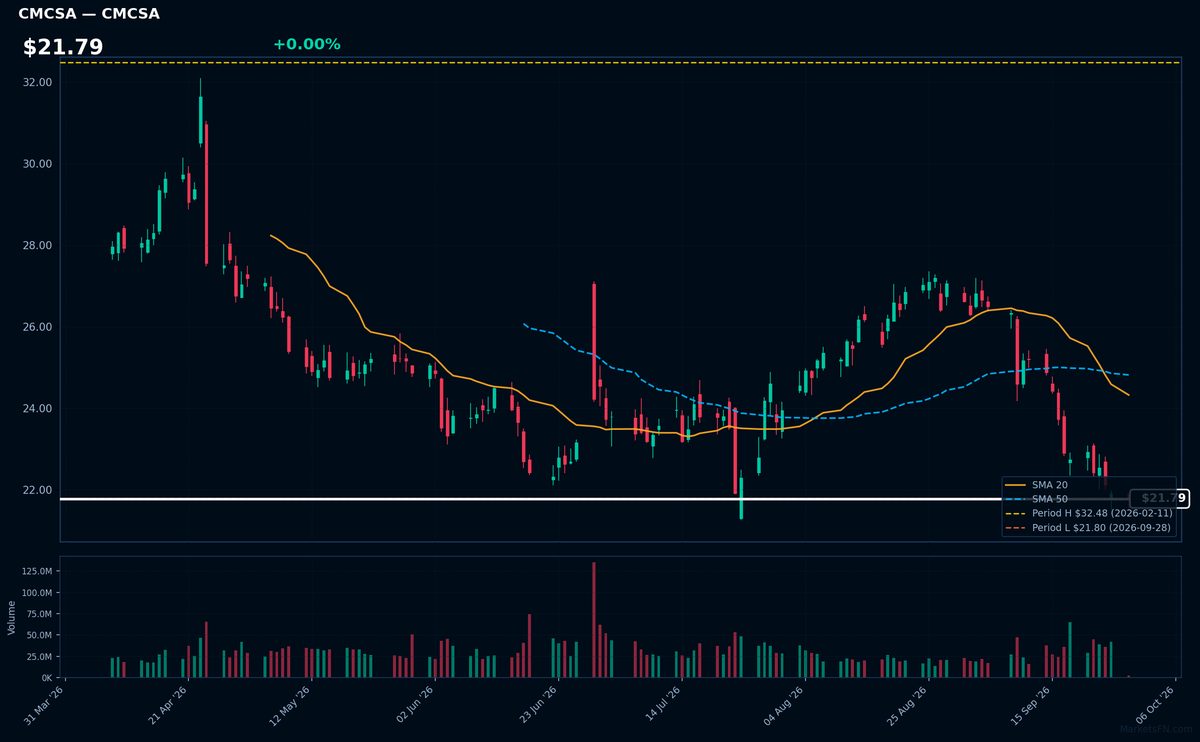
CMCSA | Comcast Corp | Communication Services | Price Last: $21.80 | % Realized: -26.15% | RSI: 26.8 | % above MA200: -18.6% | Trend: Below MA20, MA50, MA200
Comcast Corp is a media and telecommunications conglomerate providing cable television, internet, and phone services, as well as owning NBCUniversal, a major media company with film, television, and theme park assets, making it a significant player in both consumer connectivity and content creation.
Comcast Corp's current technical situation is bearish, with an RSI(14) of 26.8 indicating oversold conditions, and a bearish MA alignment (price < MA20 < MA50 < MA200), with the stock at its 52-Week low, suggesting a sustained downtrend and potential further decline.
Related headlines
- Comcast Completes Washington County, Pennsylvania Expansion Connecting Thousands to High-Speed Internet for the First Time
- KeyBanc Revamps Comcast Stock Price Target for Rest of 2026
- KeyBanc gets bearish on Comcast as broadband competition intensifies
- Comcast Stock Is Downgraded to Sell. Why the Trouble Runs Deep.
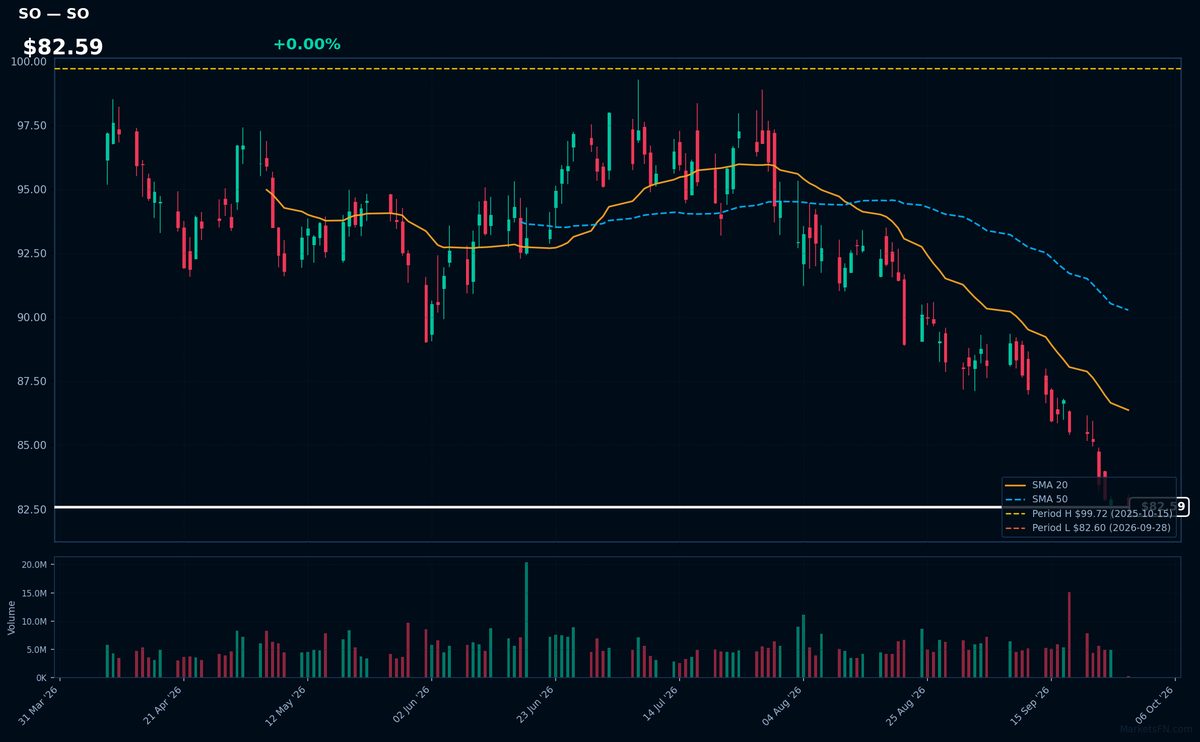
SO | Southern Company | Utilities | Price Last: $82.60 | % Realized: -12.04% | RSI: 20.7 | % above MA200: -10.4% | Trend: Below MA20, MA50, MA200
Southern Company is a large electric utility holding company providing electricity to customers across the southeastern United States. Investors care about its regulated returns, rate case outcomes, and ability to meet growing demand through its generation and transmission infrastructure.
Southern Company's technicals indicate a sustained downtrend with price at $82.59 below all key MAs (MA20, MA50, MA200) and RSI(14) at 20.7, signaling oversold conditions near its 52-Week low. This is a potential warning sign, not momentum or fundamental strength.
Related headlines
Market Commentary
The S&P 500 stocks listed are currently trading near their 52-week extremes, with some at highs and others at lows. Stocks like AAPL, A, WBD, BIIB, and TECH are at their 52-week highs, while HD, PEP, LOW, CMCSA, and SO are at their 52-week lows. This indicates a significant price movement, potentially driven by fundamental factors or market sentiment.
The stocks near 52-week highs are from diverse sectors, including technology (AAPL, TECH), healthcare (BIIB), and media (WBD). Those near 52-week lows are primarily from consumer staples (PEP) and retail (HD, LOW), as well as utilities (SO) and communications (CMCSA). This sector rotation may be driven by macro themes such as changing consumer behavior, technological advancements, or shifts in regulatory environments.
Key levels to watch include the sustainability of these stocks at their current extremes. Potential catalysts could include earnings reports, industry trends, and broader economic indicators. Monitoring these factors will be crucial in determining whether these stocks continue to trade near their 52-week extremes or revert to mean price levels.
Methodology: All 503 S&P 500 constituents screened. 52-week high = highest daily close over the past 252 trading days (approx. 1 year). 52-week low = lowest daily close over the same period. Distance = (current price / extreme − 1) × 100. Technical indicators computed on up to 1 year of daily OHLCV data.
Disclaimer: For informational purposes only. Not investment advice. Past performance is not indicative of future results.

