S&P 500 52-Week Highs & Lows Radar: Apple (AAPL), Paramount Skydance (PSKY) and more
MarketsFN Team

S&P 500 52-Week Highs & Lows Radar: Apple (AAPL), Paramount Skydance (PSKY) and more
Screening all 503 S&P 500 constituents for stocks nearest to their 52-week high and their 52-week low. Data as of July 29, 2026. % Realized = 52-week total return.
Legend: RSI > 70 = overbought · RSI < 30 = oversold · Green % Realized = positive 52W return · Red = negative.
📈 Nearest to 52-Week High
Sectors represented: Healthcare (2), Technology (1), Financial (1), Consumer Defensive (1)
| Ticker | Company | Sector | Price Last | % Realized | 52-Week High Date | RSI | % above MA200 | Trend |
|---|---|---|---|---|---|---|---|---|
| AAPL | Apple Inc | Technology | $342.72 | +62.22% | 2026-07-29 | 70.0 | +23.8% | Above MA20, MA50, MA200 |
| V | Visa Inc | Financial | $369.08 | +5.06% | 2026-07-29 | 66.6 | +11.8% | Above MA20, MA50, MA200 |
| JNJ | Johnson & Johnson | Healthcare | $267.90 | +59.36% | 2026-07-29 | 65.6 | +18.9% | Above MA20, MA50, MA200 |
| ABBV | Abbvie Inc | Healthcare | $266.39 | +39.31% | 2026-07-29 | 70.9 | +18.8% | Above MA20, MA50, MA200 |
| KO | Coca-Cola Co | Consumer Defensive | $90.68 | +30.70% | 2026-07-29 | 70.5 | +19.7% | Above MA20, MA50, MA200 |
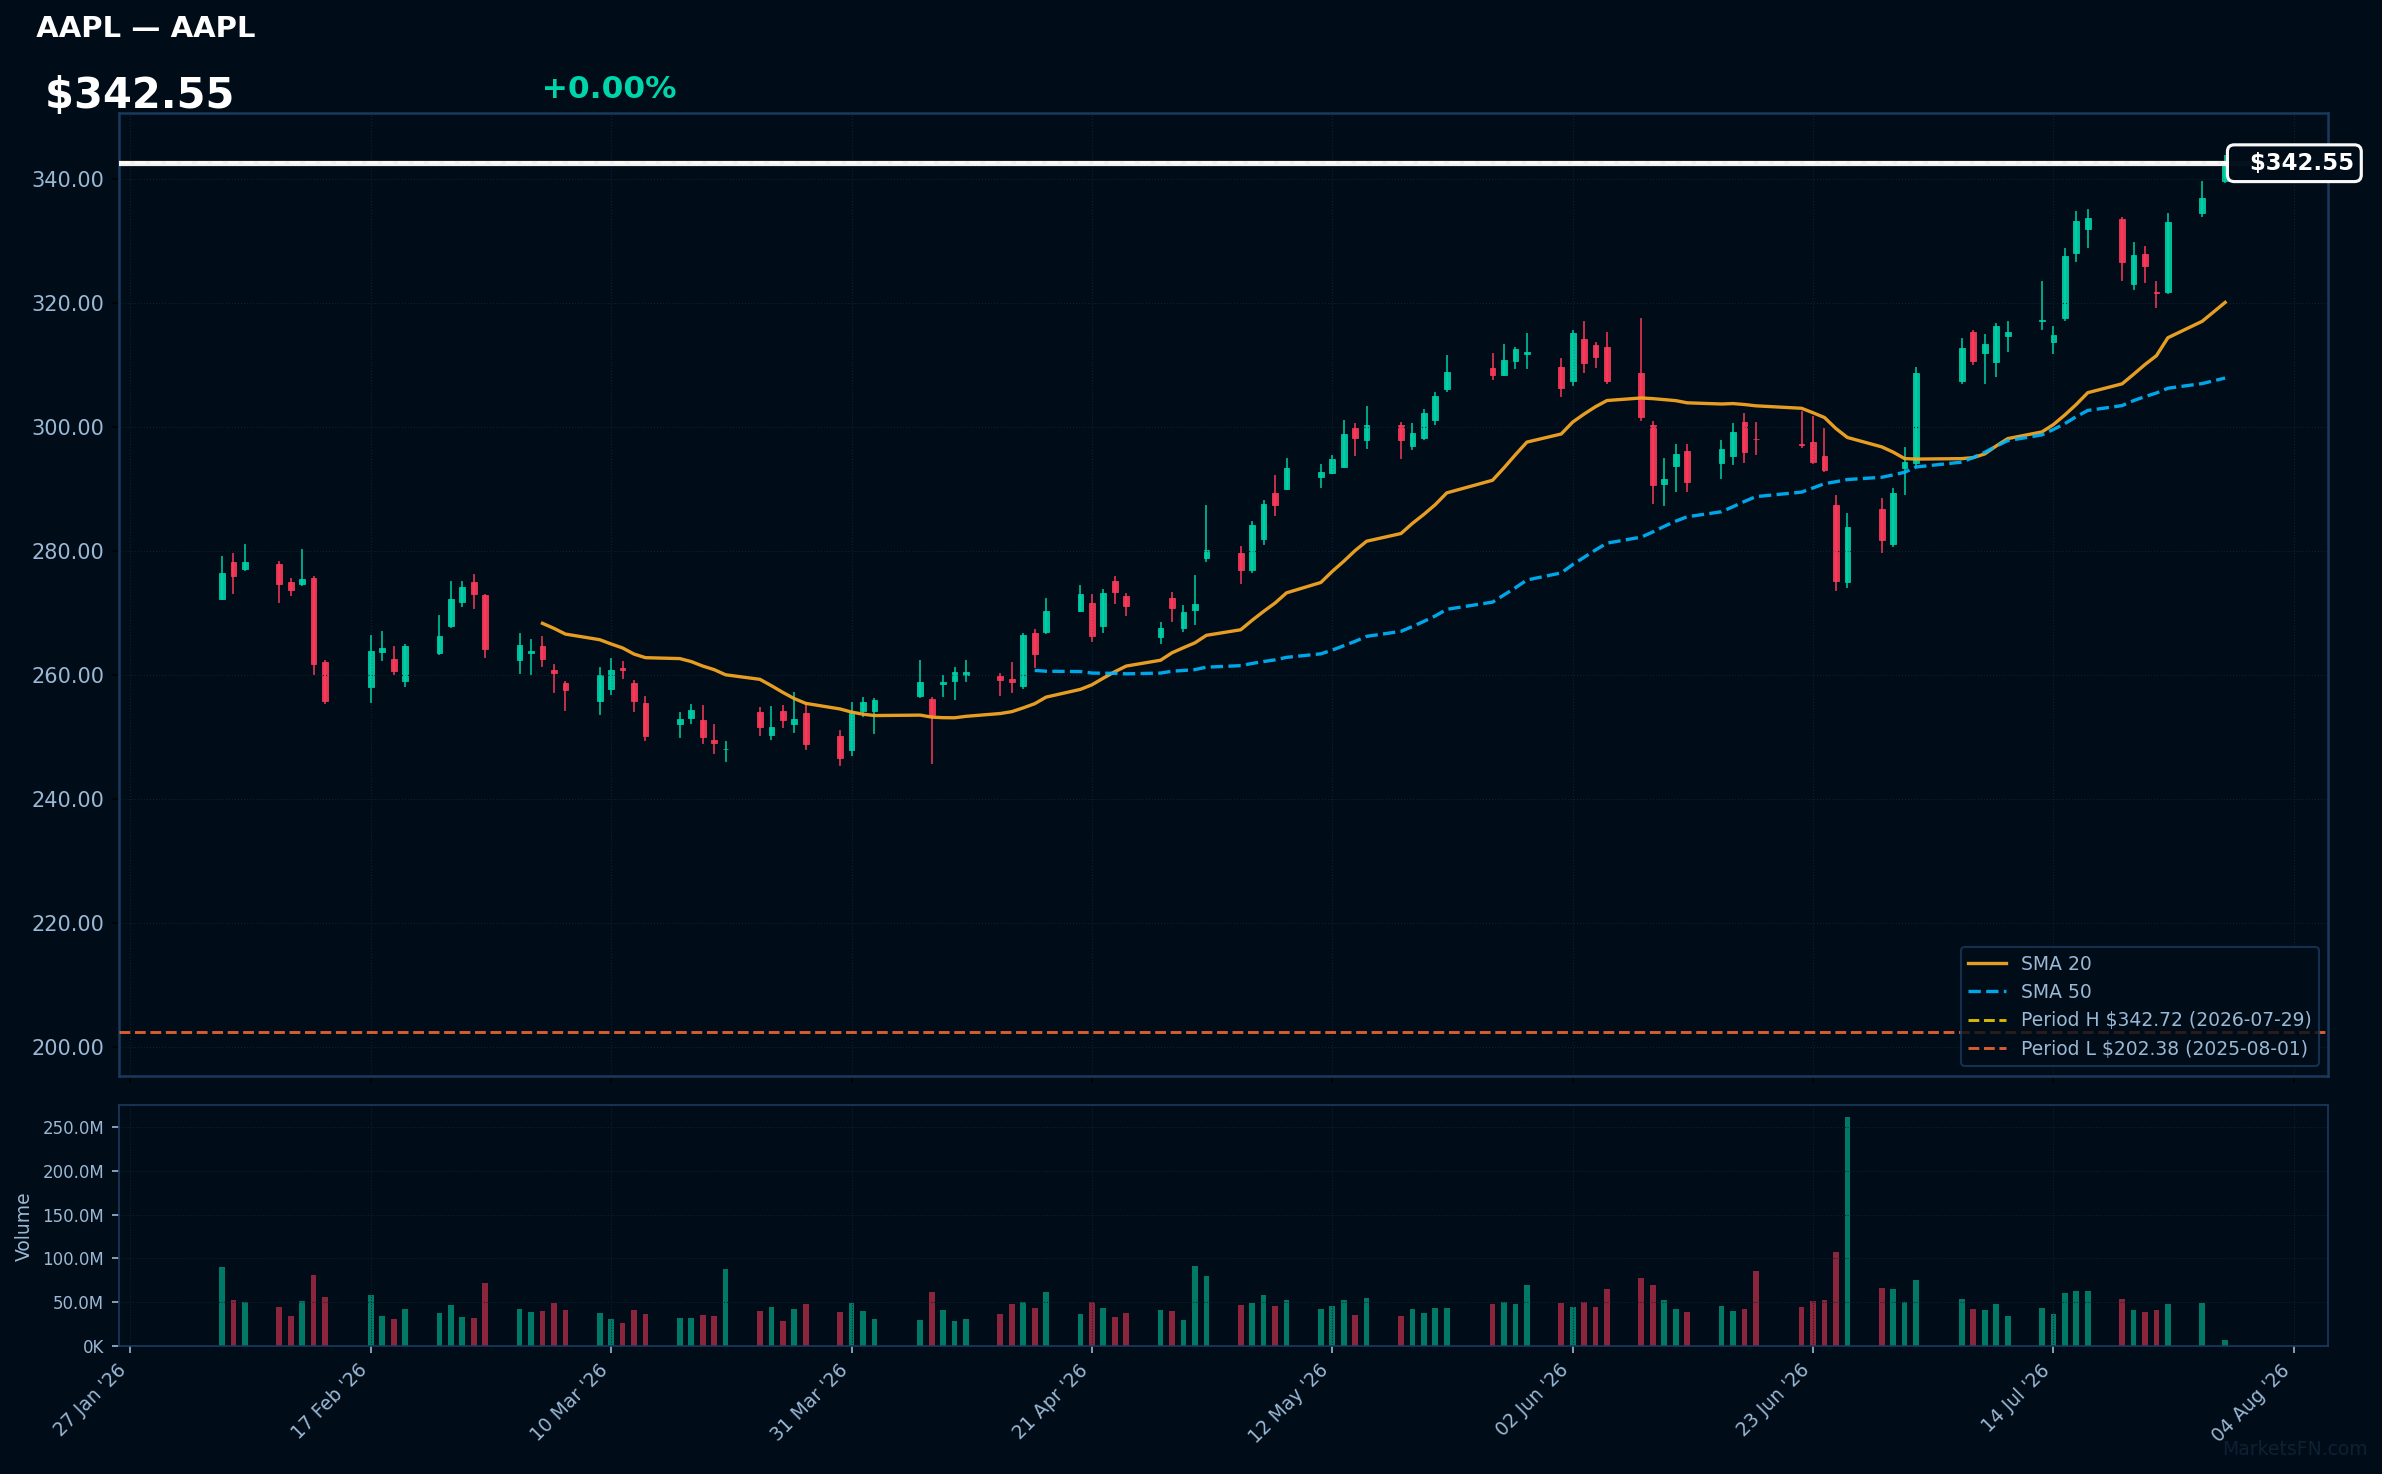
AAPL | Apple Inc | Technology | Price Last: $342.72 | % Realized: +62.22% | RSI: 70.0 | % above MA200: +23.8% | Trend: Above MA20, MA50, MA200
Apple Inc designs, manufactures, and markets consumer electronics, software, and services. Investors care about its innovative product ecosystem, including iPhones, Macs, and wearables, which drive revenue growth and profitability.
AAPL's RSI(14) is 70.0, indicating strong momentum. The bullish MA alignment (price > MA20 > MA50 > MA200) and 0.0% proximity to its 52-Week high suggest a potential breakout, supported by a 62.2% 52-Week return, signaling sustained uptrend.
Related headlines
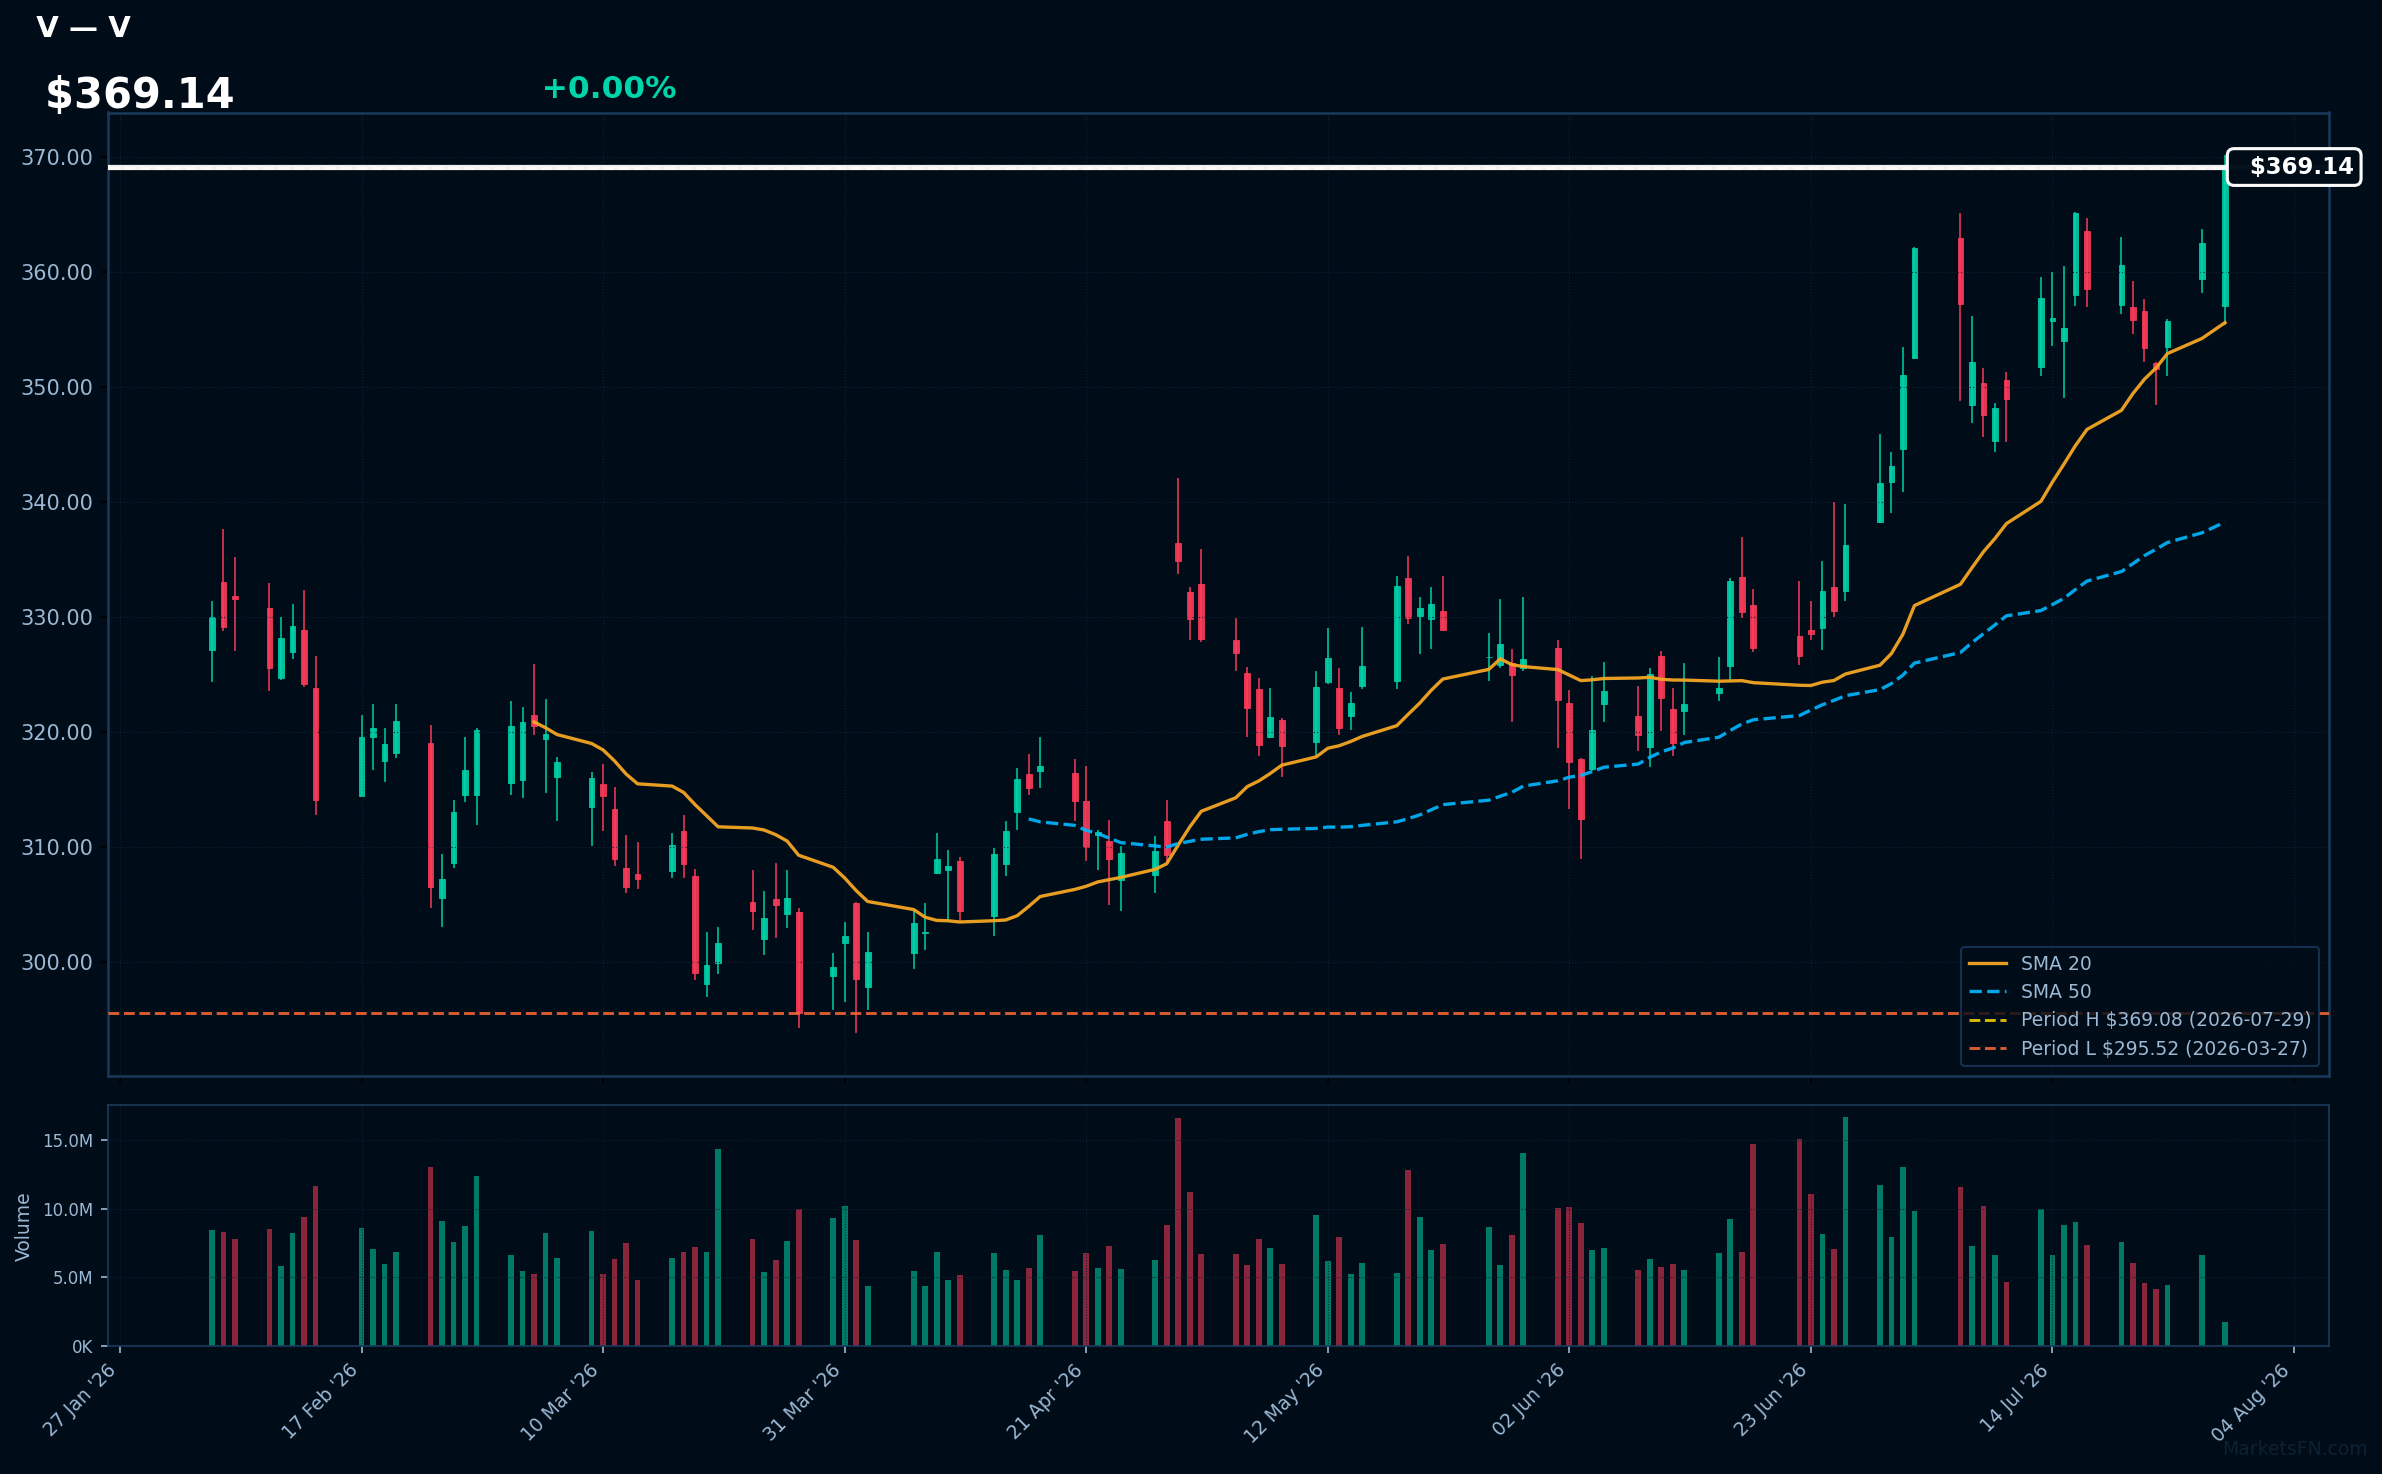
V | Visa Inc | Financial | Price Last: $369.08 | % Realized: +5.06% | RSI: 66.6 | % above MA200: +11.8% | Trend: Above MA20, MA50, MA200
Visa Inc operates a global electronic payments network, facilitating transactions between consumers, merchants, and financial institutions, generating revenue primarily through service fees on transactions, making its performance closely tied to the growth of digital payments.
Visa Inc's current technical situation indicates sustained uptrend with price at $369.14 above MA20, MA50, and MA200, RSI(14) at 66.6, near 52-Week high, suggesting momentum; the 0.0% proximity to 52-Week high and 5.1% 52-Week return reinforce this.
Related headlines
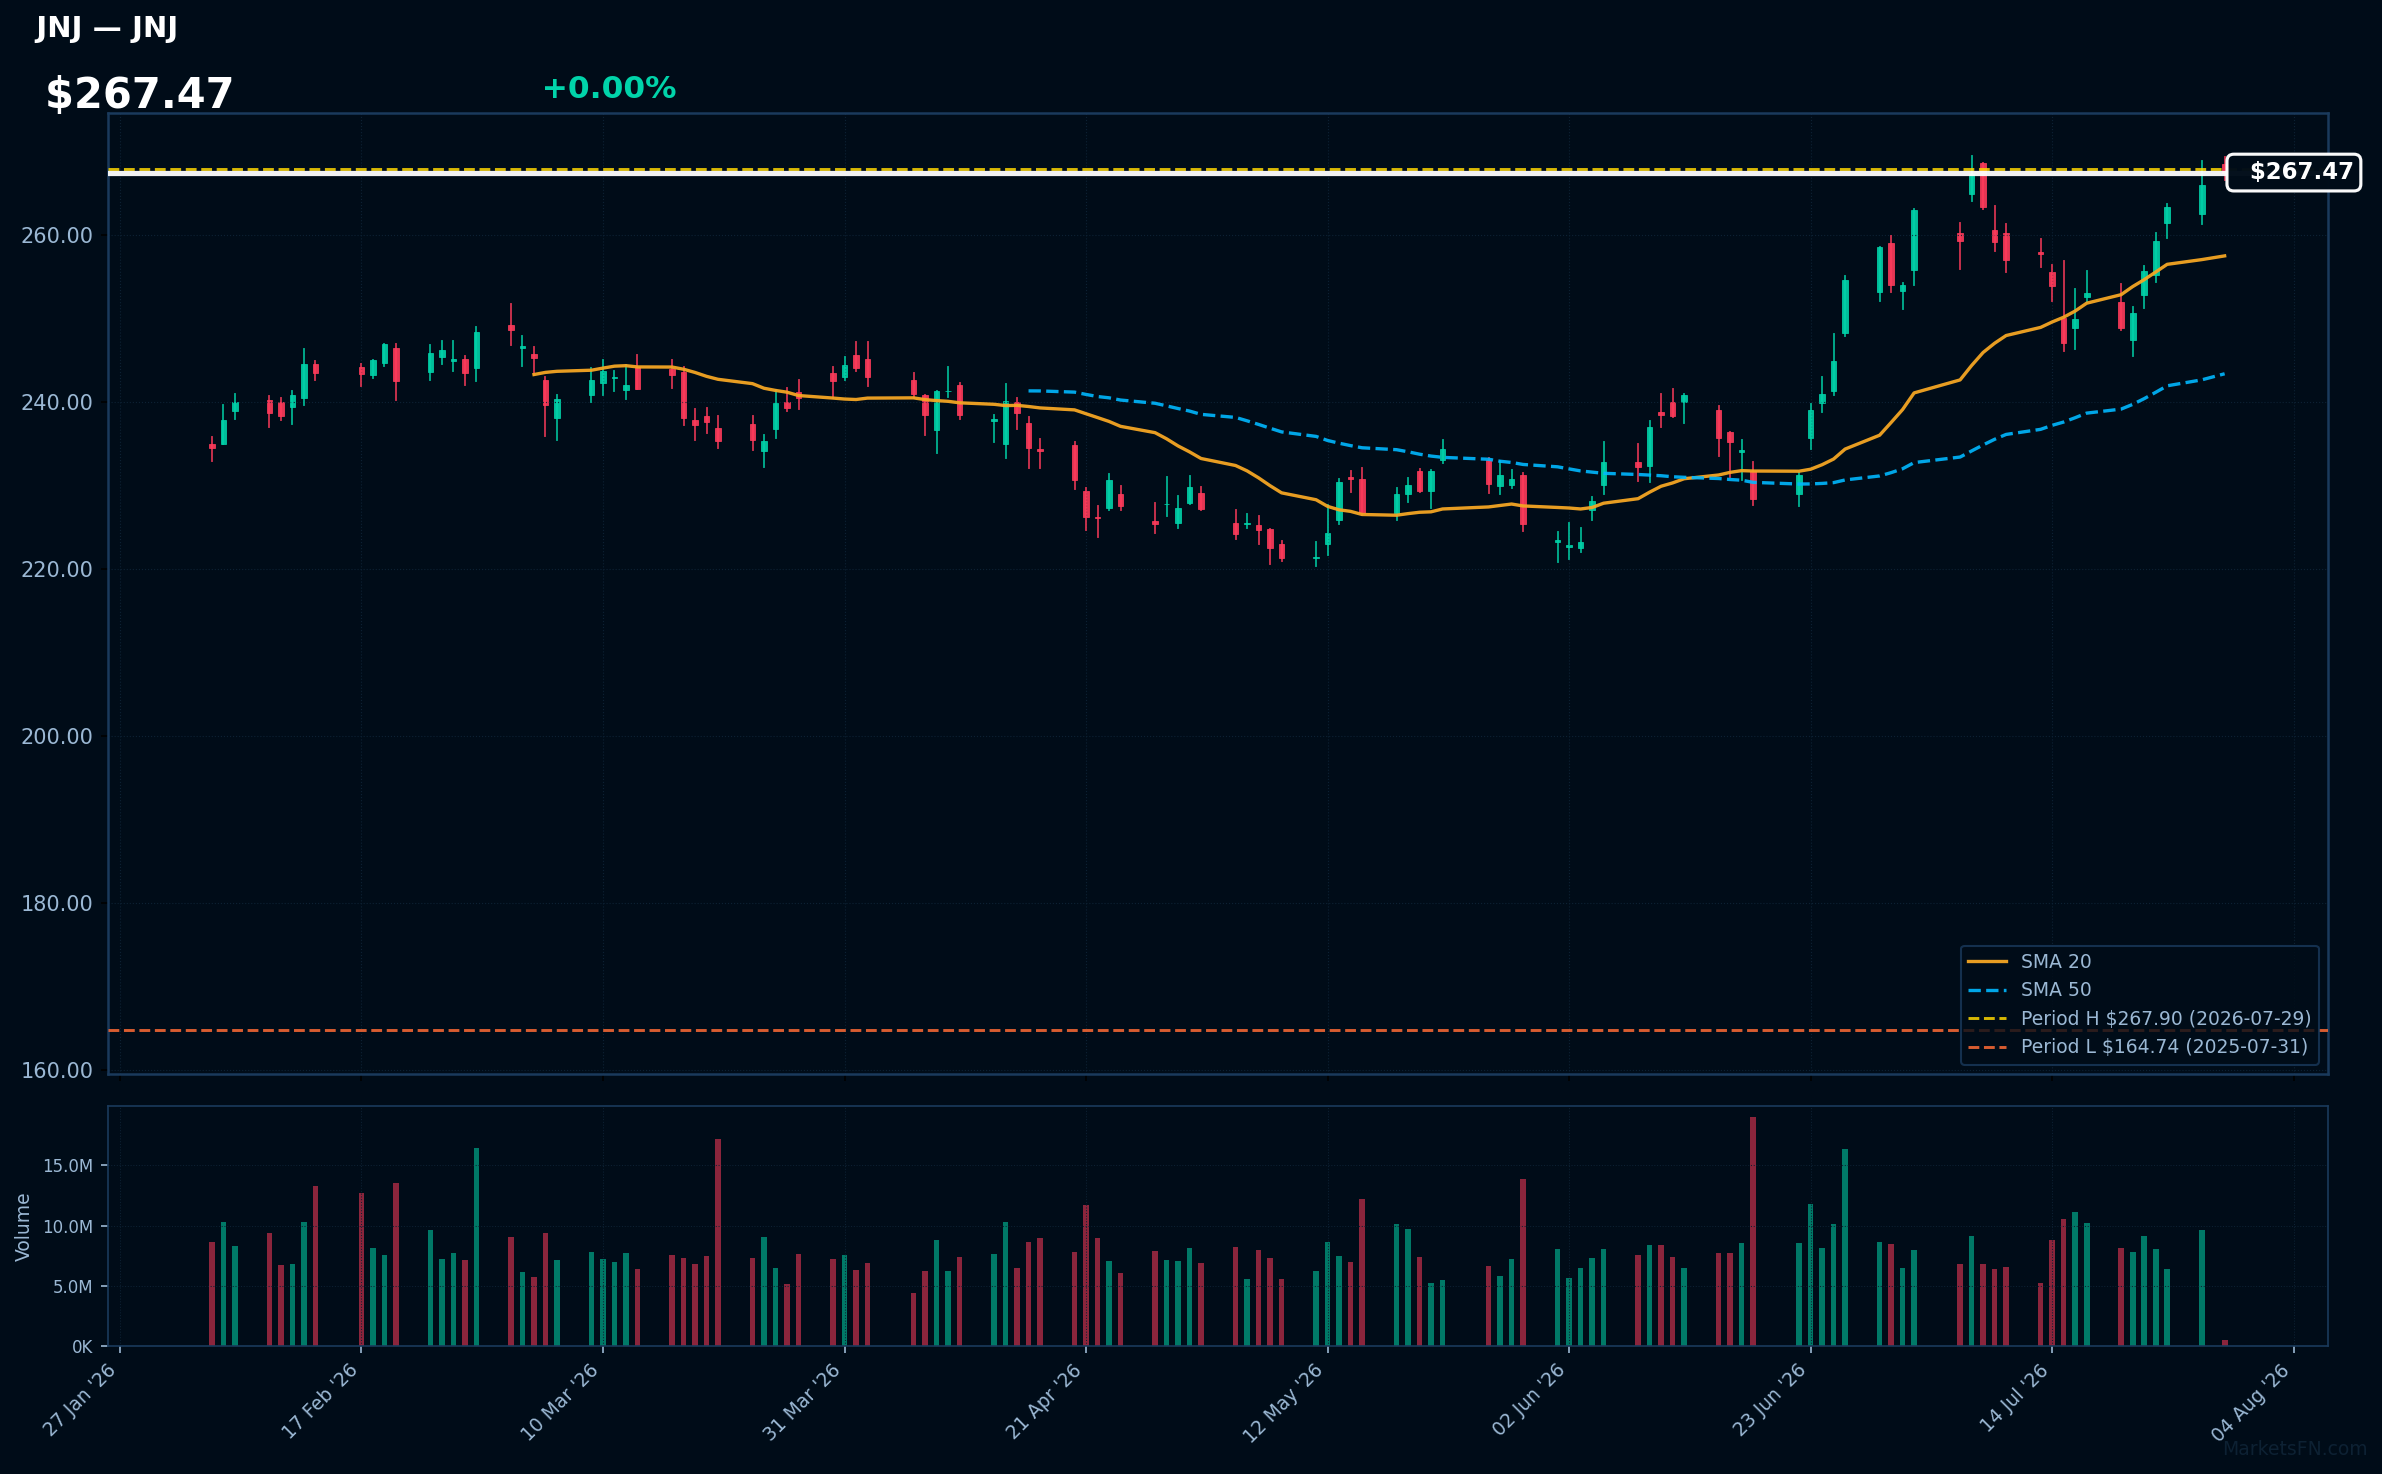
JNJ | Johnson & Johnson | Healthcare | Price Last: $267.90 | % Realized: +59.36% | RSI: 65.6 | % above MA200: +18.9% | Trend: Above MA20, MA50, MA200
Johnson & Johnson is a diversified healthcare company with significant exposure to pharmaceuticals, medical devices, and consumer products. Investors should care due to its broad portfolio and history of innovation, potentially providing stable returns across economic cycles.
Johnson & Johnson's current technical situation indicates sustained uptrend with price at $267.47, RSI(14) at 65.6, and bullish MA alignment (price > MA20 > MA50 > MA200). The stock is 0.0% below its 52-Week high, suggesting potential breakout momentum.
Related headlines
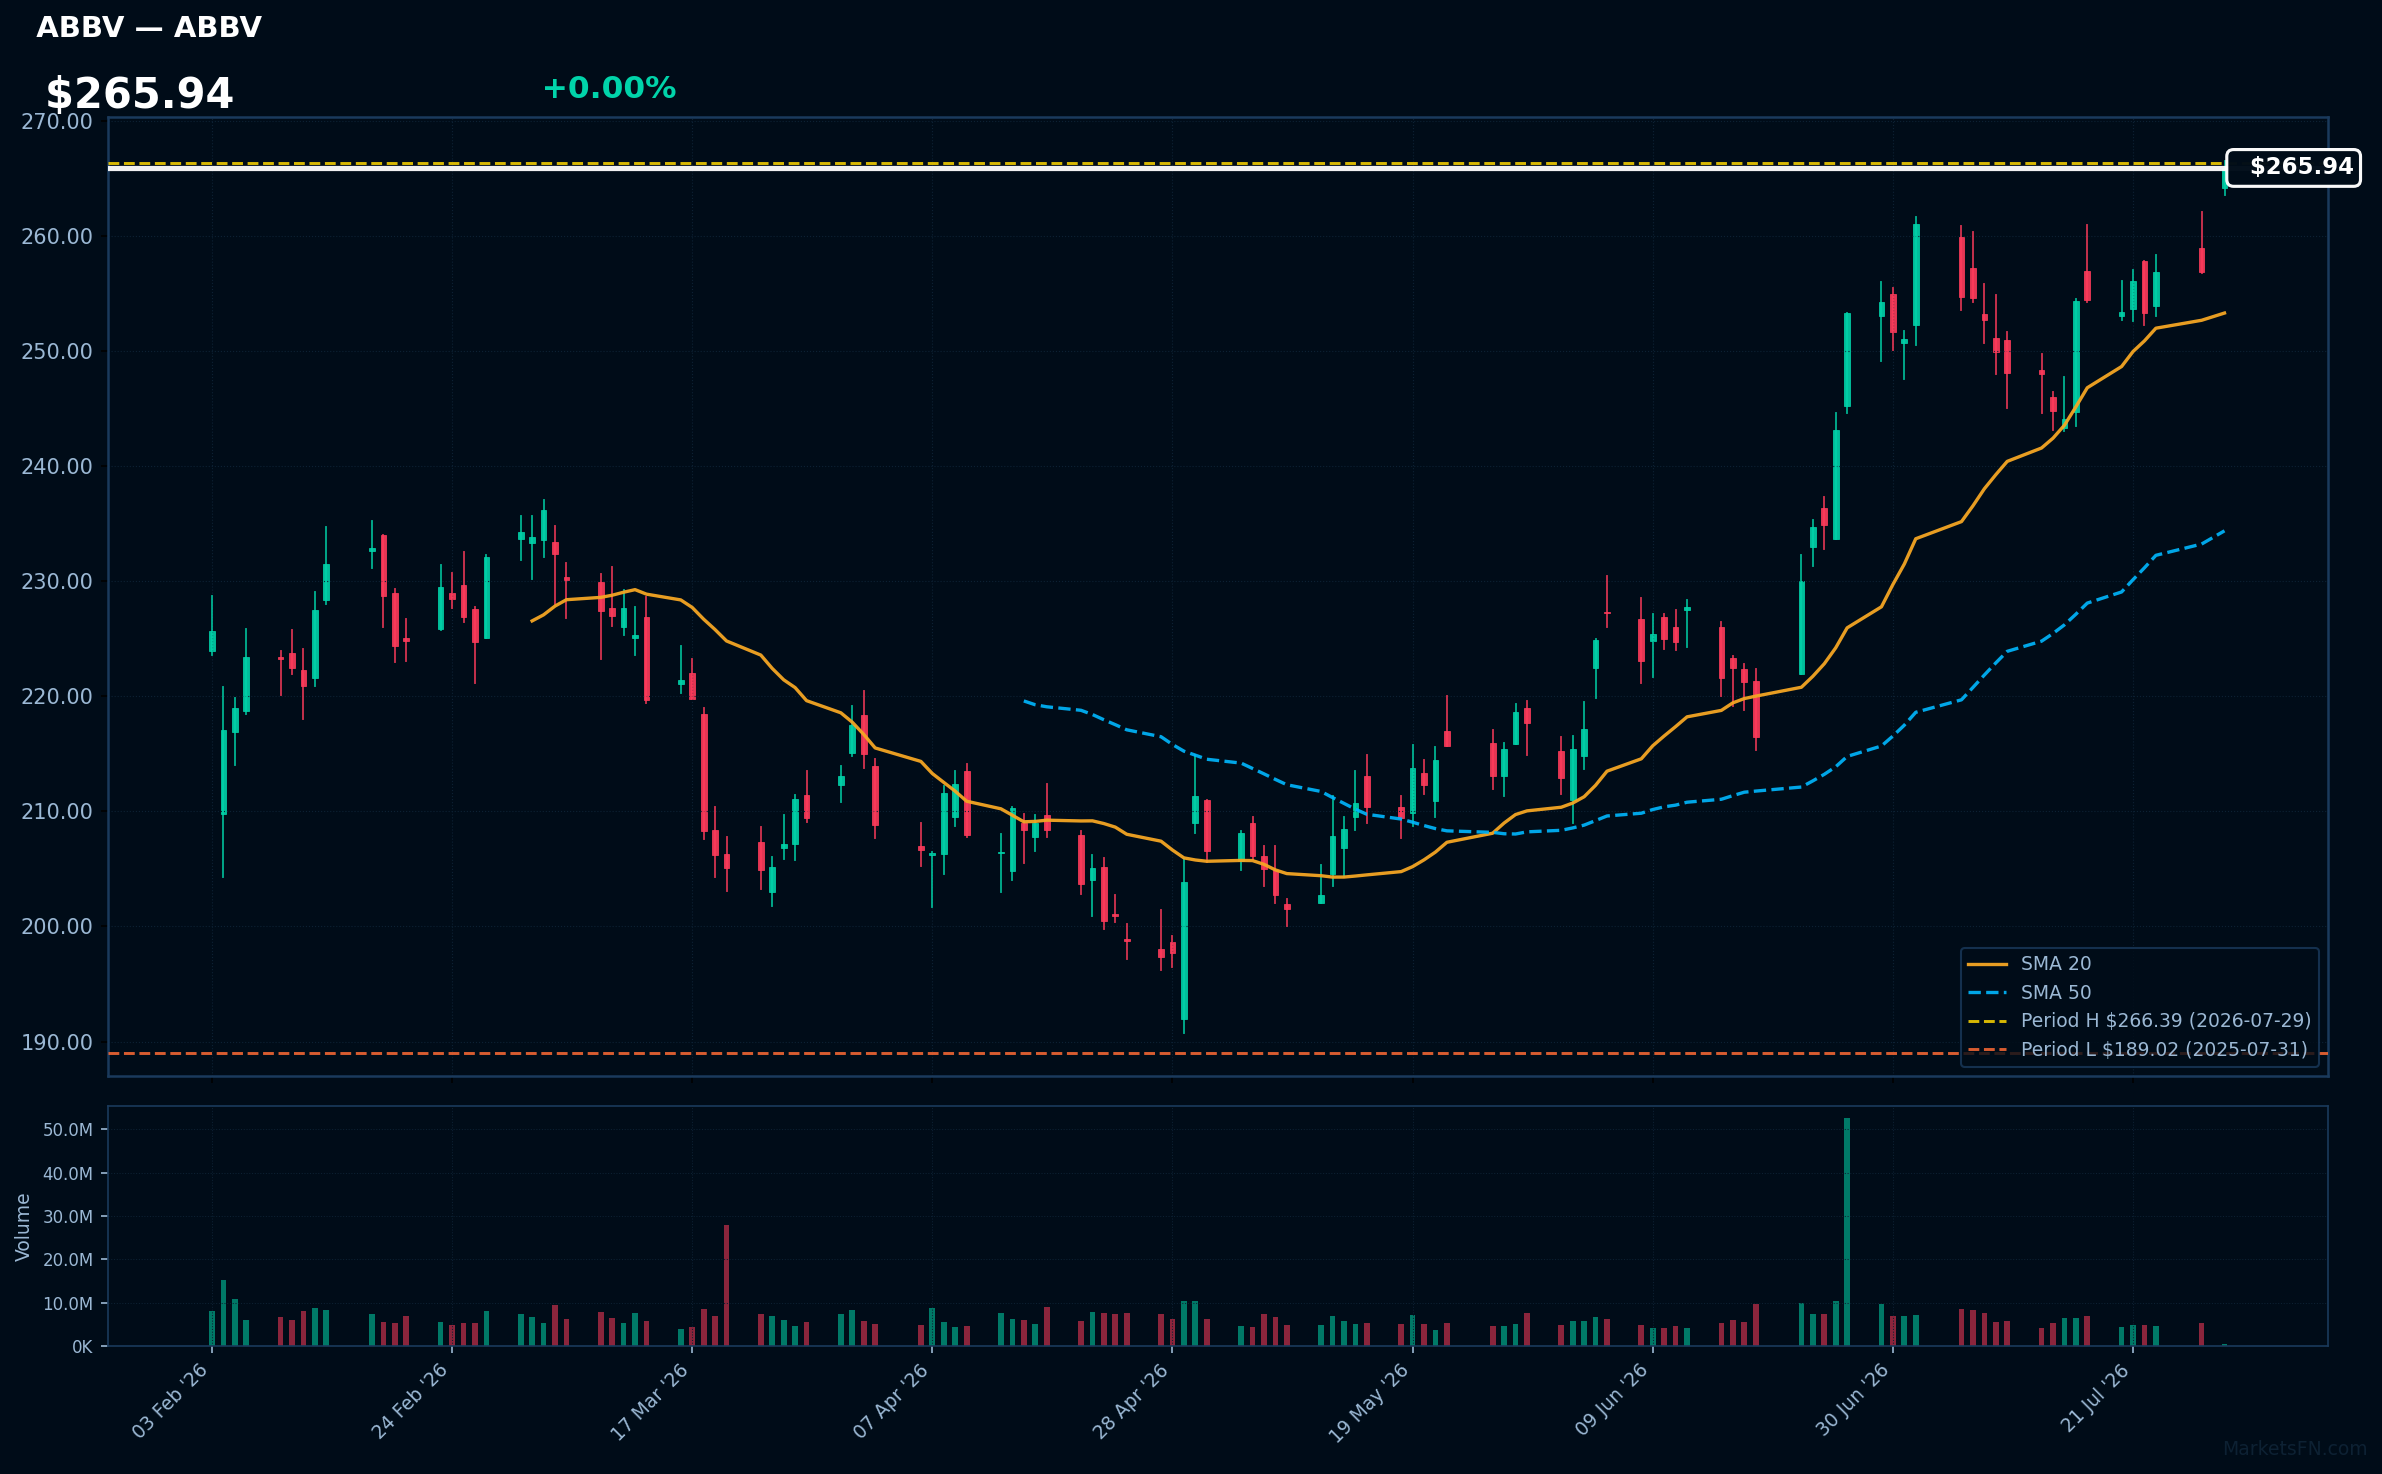
ABBV | Abbvie Inc | Healthcare | Price Last: $266.39 | % Realized: +39.31% | RSI: 70.9 | % above MA200: +18.8% | Trend: Above MA20, MA50, MA200
AbbVie is a biopharmaceutical company that develops and markets therapies for chronic diseases like rheumatoid arthritis and hepatitis C. Investors should care about its pipeline and product sales growth, particularly for its flagship immunology drug Humira and newer therapies like Rinvoq.
AbbVie's current technical situation indicates strong momentum with RSI(14) at 70.9, price above MA20, MA50, and MA200, and a 52-Week return of 39.3%. The stock is 0.0% below its 52-Week high, suggesting a potential breakout.
Related headlines
- AbbVie Secures EU Approval for Rinvoq to Treat Severe Alopecia Areata
- AbbVie Announces European Commission Approval of RINVOQ (upadacitinib) for the Treatment of Adults and Adolescents with Severe Alopecia Areata
- AbbVie Announces European Commission Approval of RINVOQ (upadacitinib) for the Treatment of Adults and Adolescents with Non-Segmental Vitiligo
- The Engine Behind ABBV Stock Has Real Parts
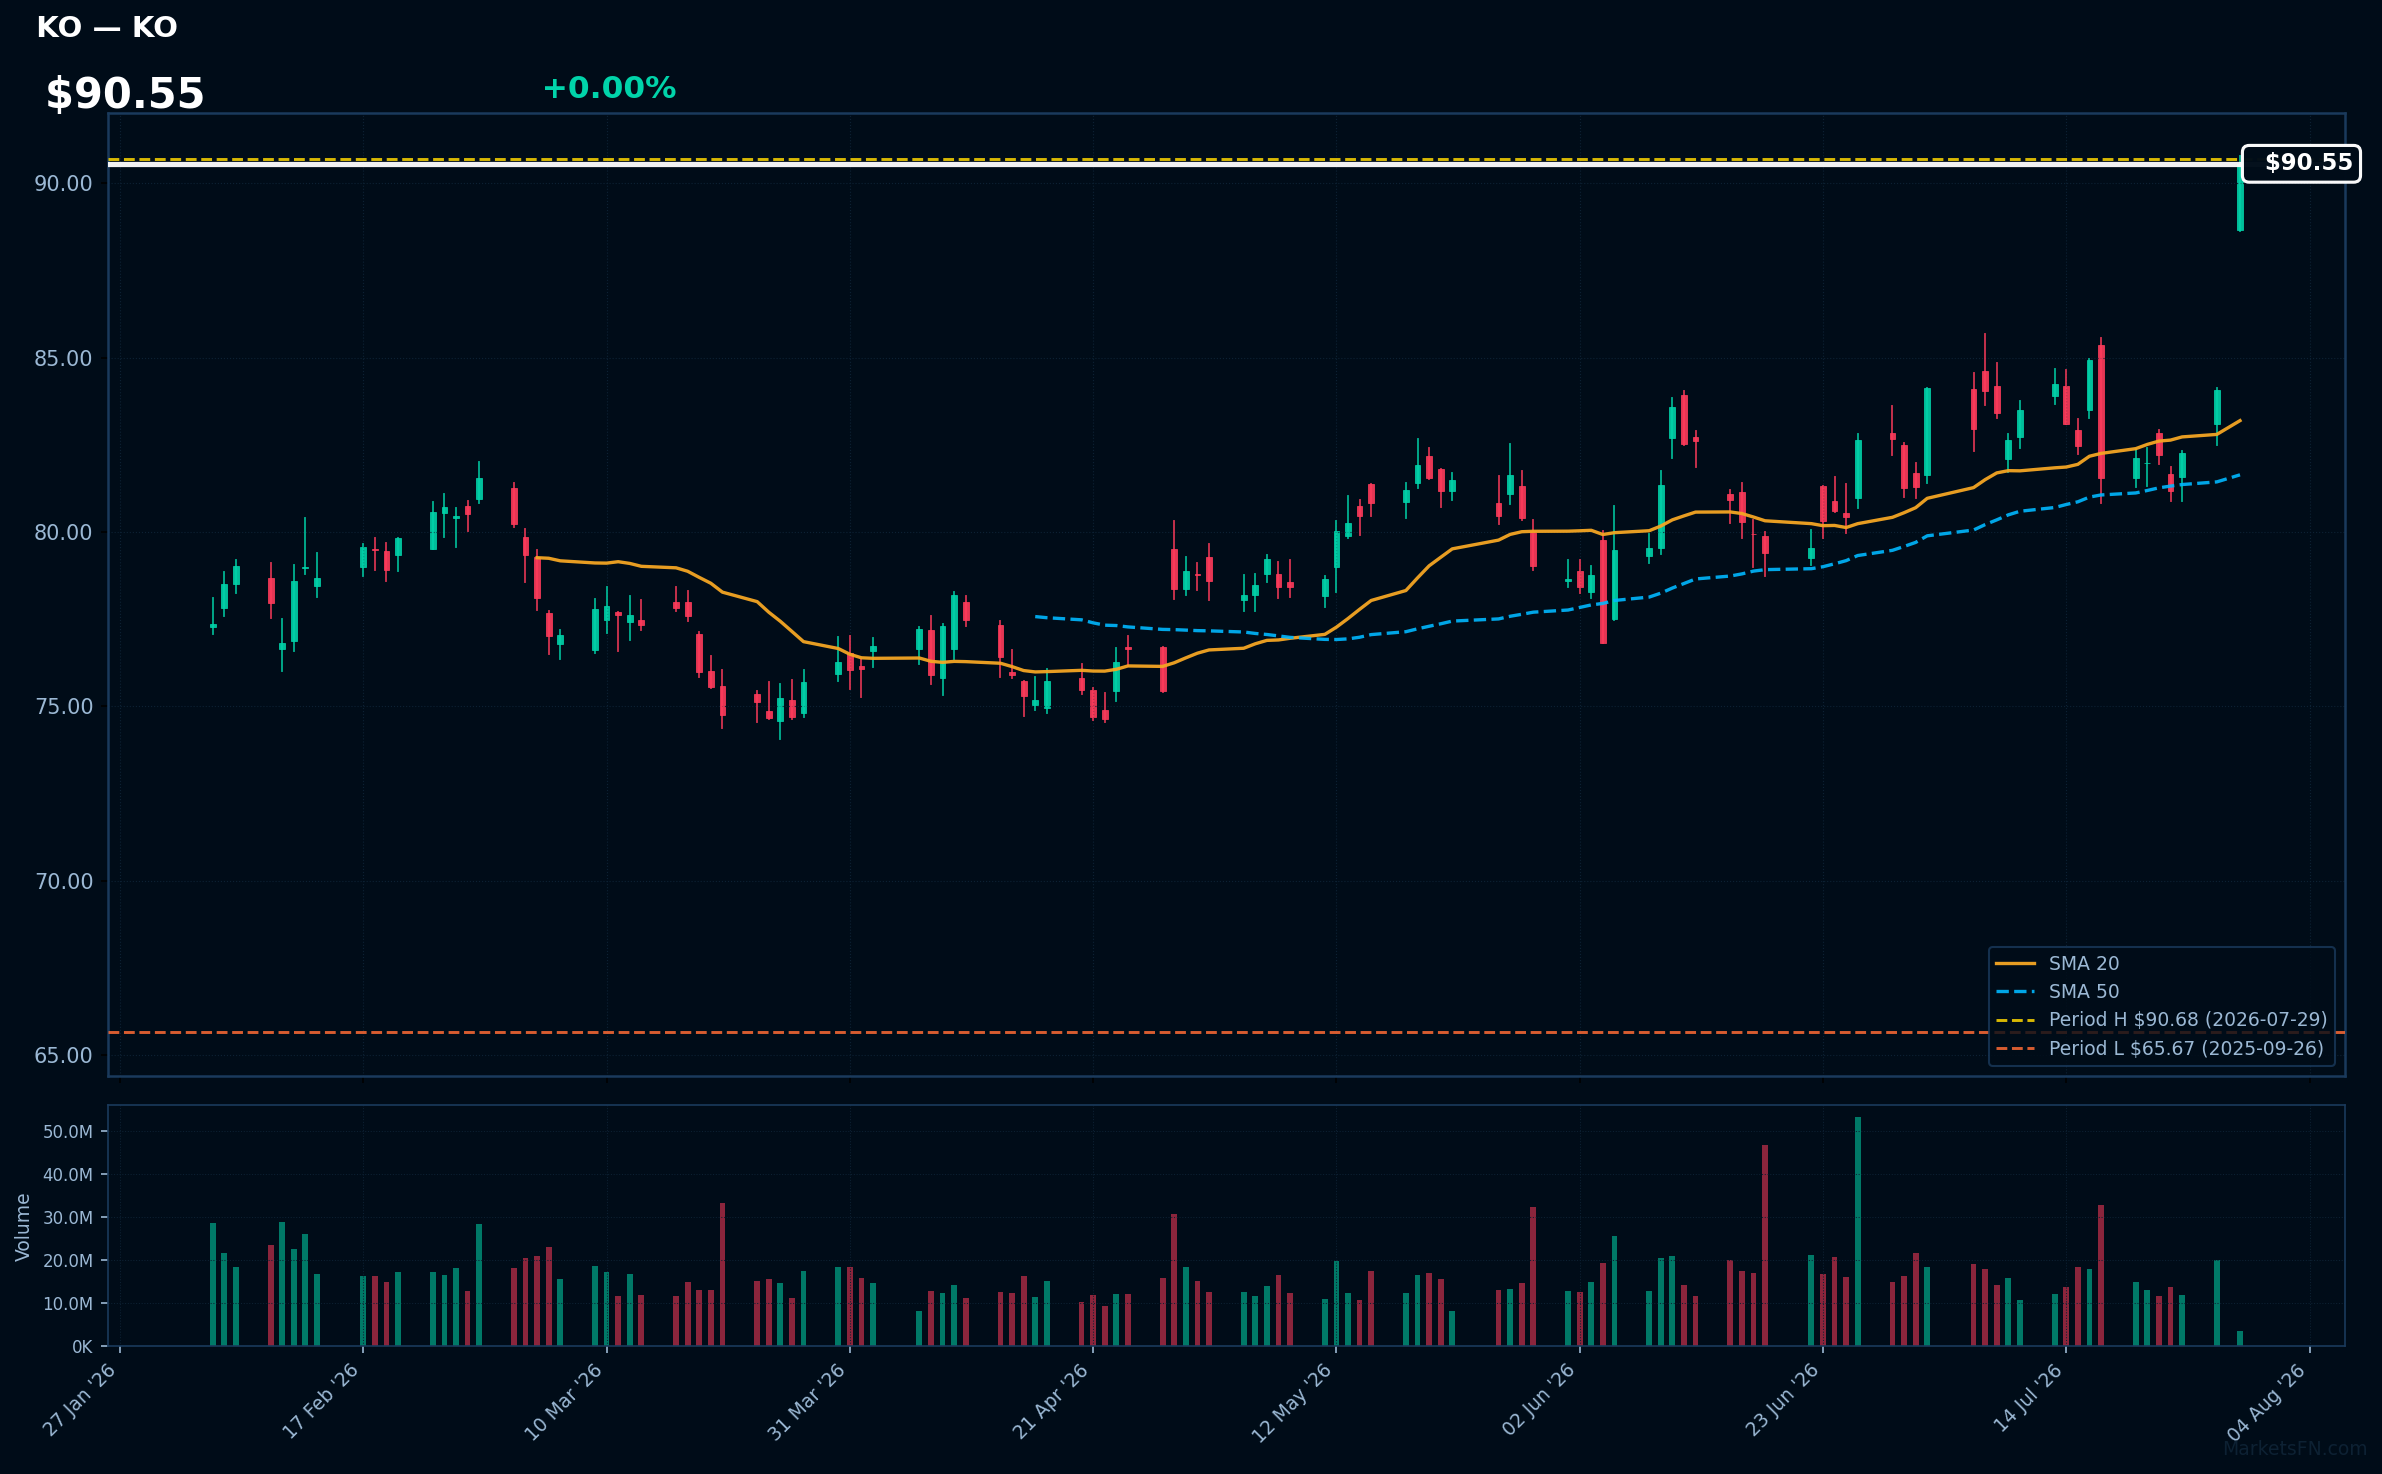
KO | Coca-Cola Co | Consumer Defensive | Price Last: $90.68 | % Realized: +30.70% | RSI: 70.5 | % above MA200: +19.7% | Trend: Above MA20, MA50, MA200
Coca-Cola Co is a beverage company that generates revenue primarily through the sale of soft drinks, juices, and other beverages. Investors should care about its ability to maintain market share and drive growth through new product introductions and geographic expansion.
Coca-Cola Co's technicals indicate strong momentum: RSI(14) is 70.5, nearing overbought territory, with a bullish MA alignment (price > MA20 > MA50 > MA200) and 0.0% below its 52-Week high, suggesting a potential breakout.
Related headlines
📉 Nearest to 52-Week Low
Sectors represented: Consumer Cyclical (2), Technology (2), Communication Services (1)
| Ticker | Company | Sector | Price Last | % Realized | 52-Week Low Date | RSI | % above MA200 | Trend |
|---|---|---|---|---|---|---|---|---|
| PSKY | Paramount Skydance Corp | Communication Services | $8.08 | -39.05% | 2026-07-27 | 28.7 | -32.1% | Below MA20, MA50, MA200 |
| TSLA | Tesla Inc | Consumer Cyclical | $304.95 | -5.06% | 2025-08-01 | 26.6 | -26.2% | Below MA20, MA50, MA200 |
| SNPS | Synopsys, Inc | Technology | $383.01 | -39.76% | 2026-07-24 | 33.7 | -15.0% | Below MA20, MA50, MA200 |
| ROL | Rollins, Inc | Consumer Cyclical | $39.62 | -30.88% | 2026-07-24 | 32.5 | -28.1% | Below MA20, MA50, MA200 |
| ORCL | Oracle Corp | Technology | $118.25 | -52.69% | 2026-07-24 | 31.9 | -36.3% | Below MA20, MA50, MA200 |
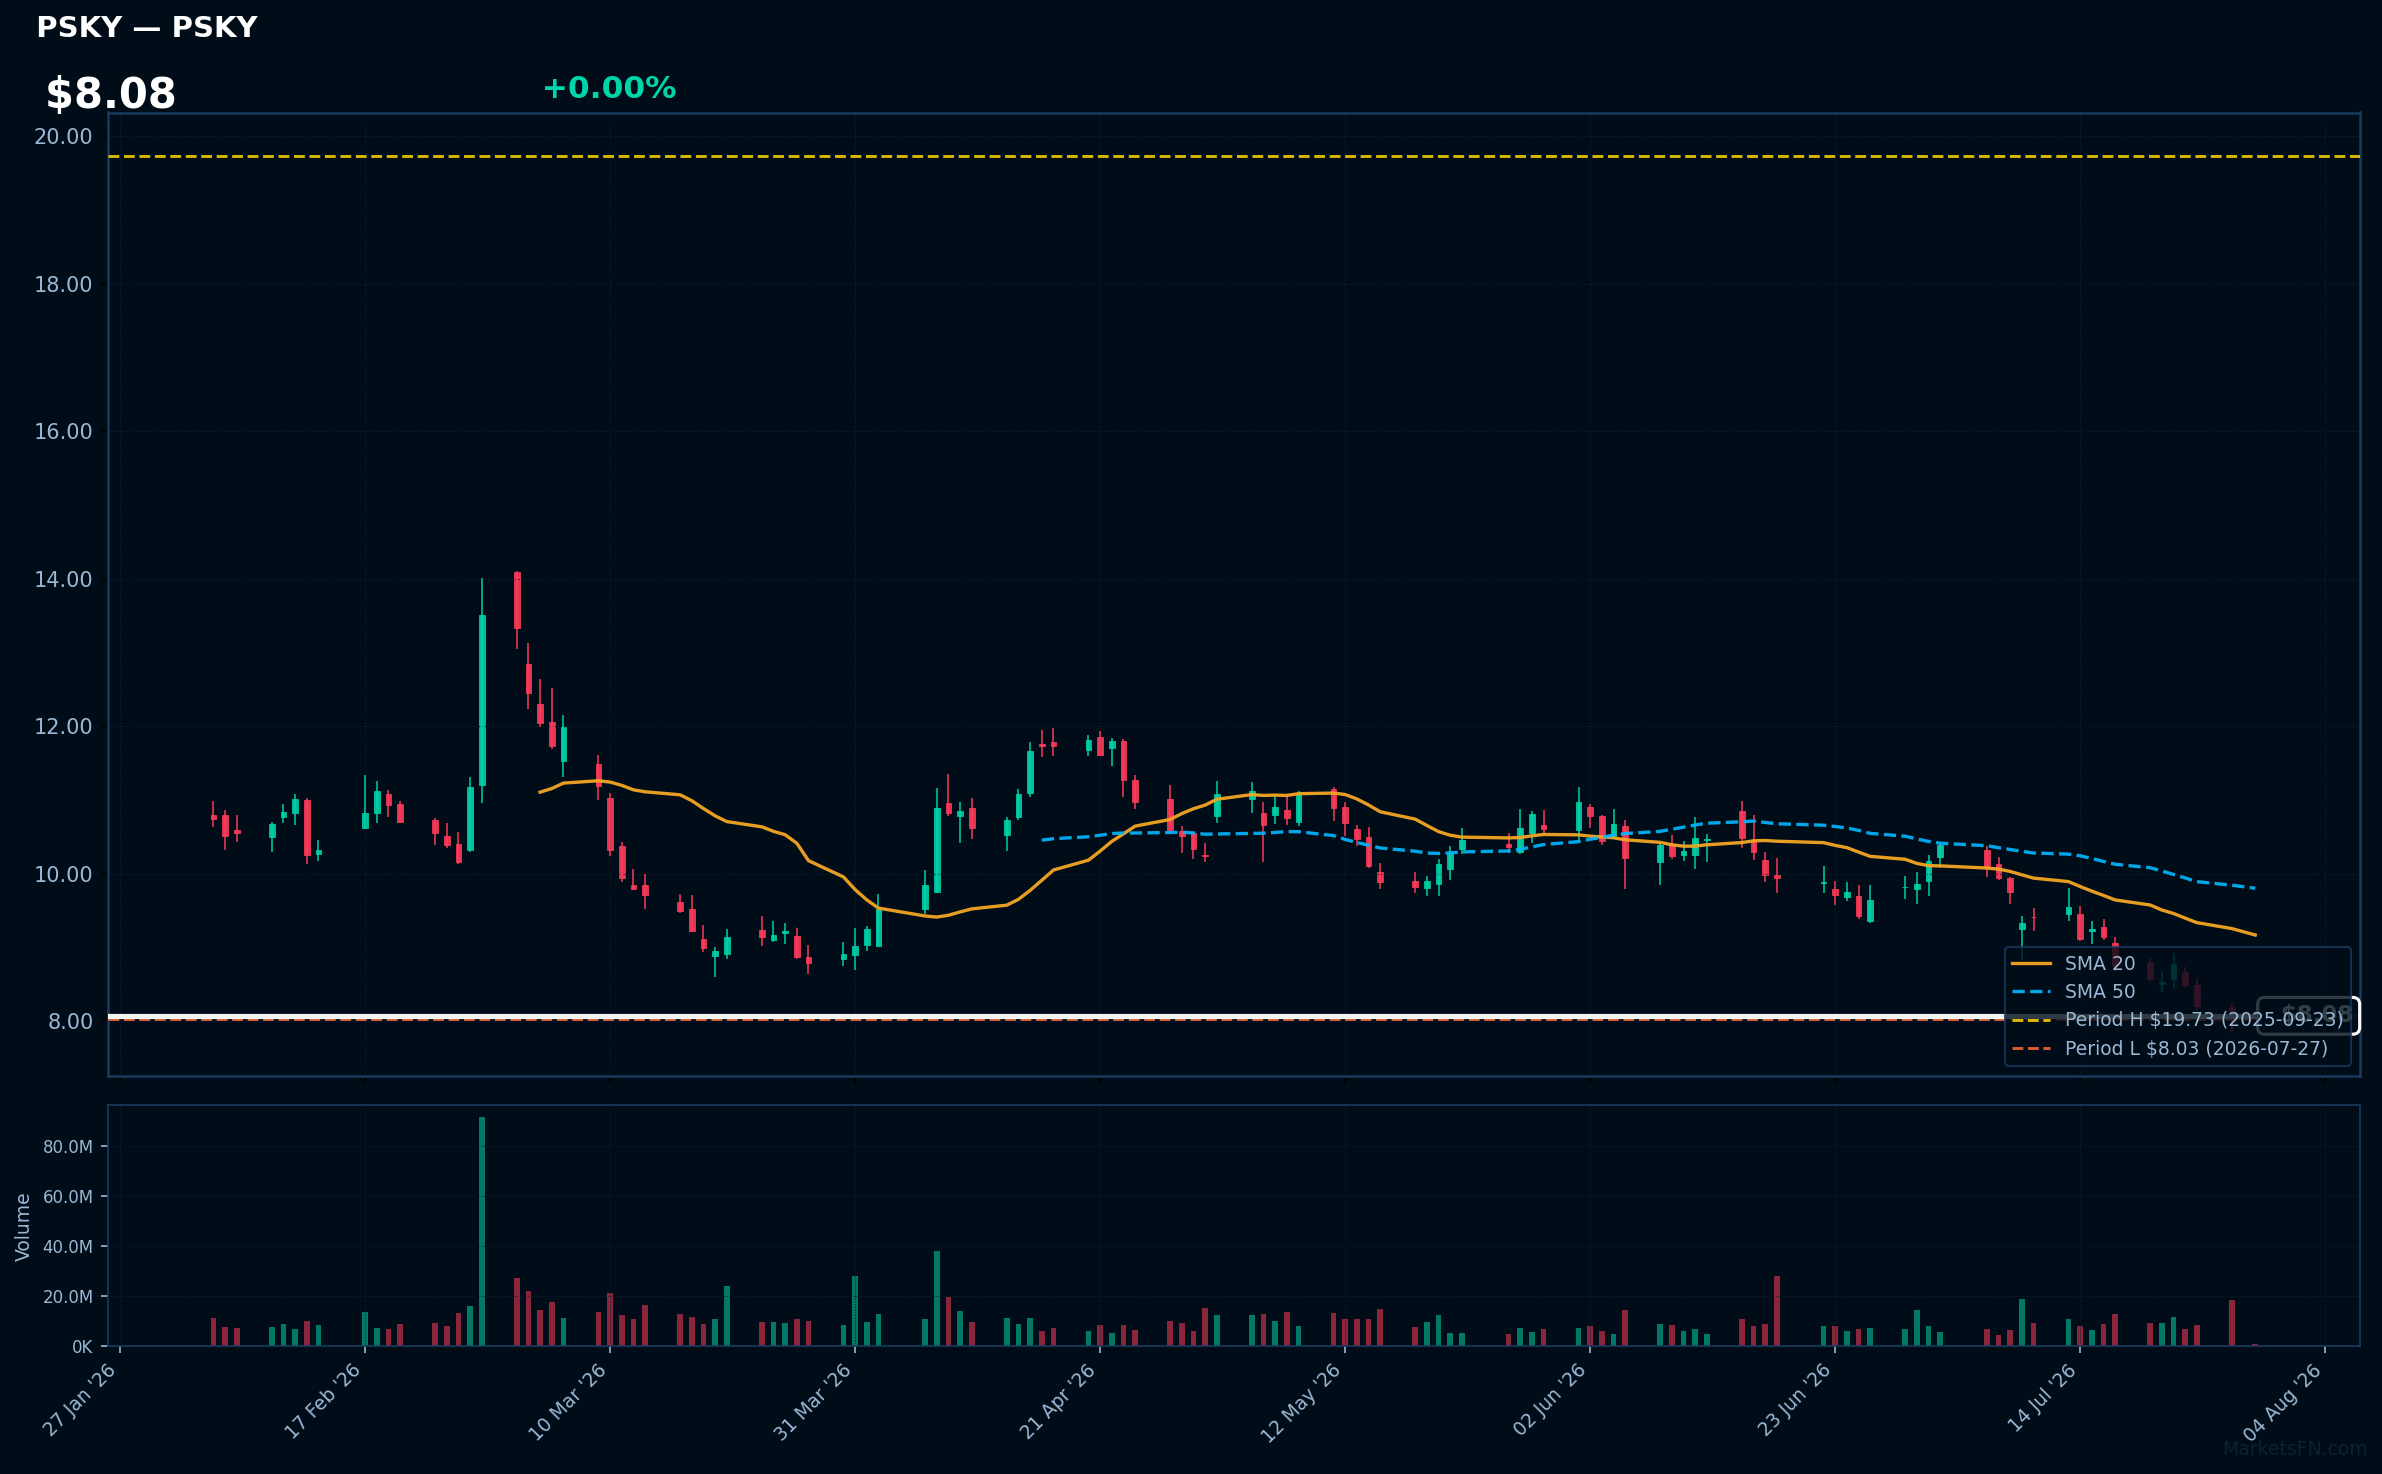
PSKY | Paramount Skydance Corp | Communication Services | Price Last: $8.08 | % Realized: -39.05% | RSI: 28.7 | % above MA200: -32.1% | Trend: Below MA20, MA50, MA200
Paramount Skydance Corp is not described in the data provided, so its business activities and investor relevance cannot be determined from the given information.
Paramount Skydance Corp (PSKY) is in a sustained downtrend with price < MA20 < MA50 < MA200, RSI(14) at 28.7, and is 0.6% above its 52-Week low, indicating a potential warning sign as it tests major support with a 52-Week return of -39.0%.
Related headlines
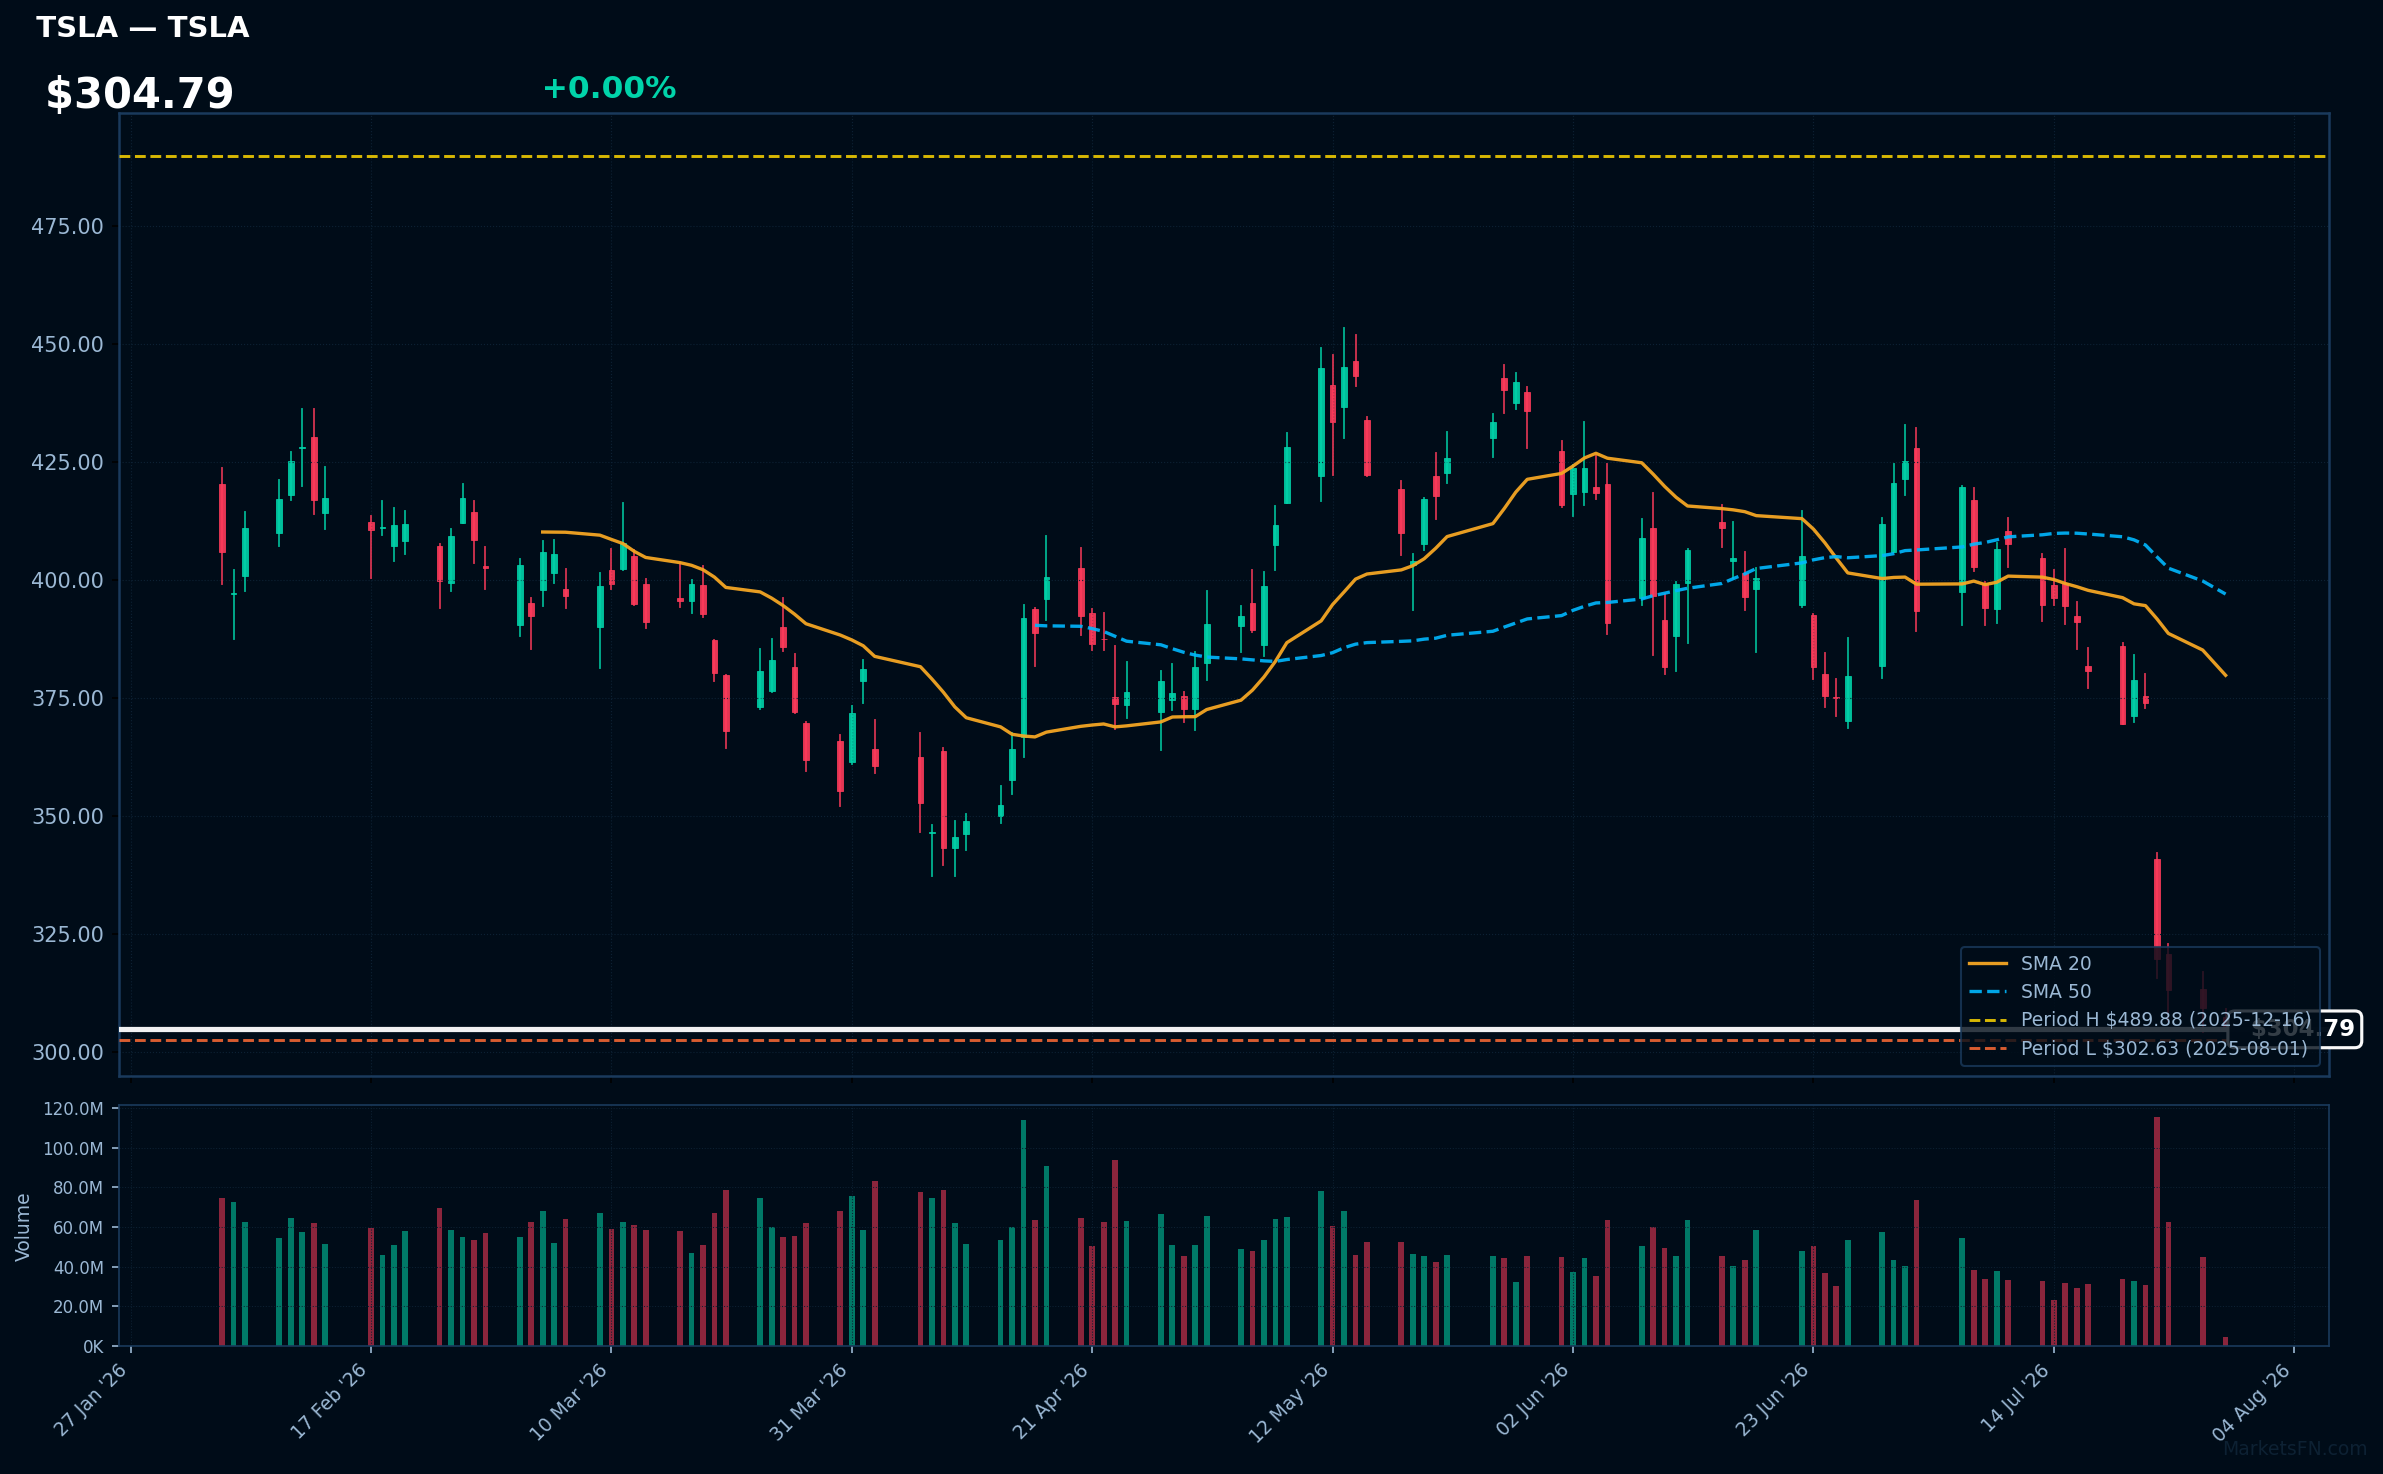
TSLA | Tesla Inc | Consumer Cyclical | Price Last: $304.95 | % Realized: -5.06% | RSI: 26.6 | % above MA200: -26.2% | Trend: Below MA20, MA50, MA200
Tesla Inc is an electric vehicle manufacturer and clean energy company. Investors care about its innovative products, market disruption potential, and leadership in the EV transition, impacting the automotive and energy sectors.
Tesla's technical situation indicates a sustained downtrend with price ($304.79) below MA20, MA50, and MA200. RSI(14) is 26.6, nearing oversold territory, and the stock is 0.8% above its 52-Week low, testing major support.
Related headlines
- Direxion unveils options income ETF suite tied to Nvidia, Tesla and other megacap
- Tesla Stock Falls Again, Putting Trillion-Dollar Status at Risk
- Tesla, ContourGlobal sign 1TWh/year PPA for Project Sterling in Arizona
- A Potential Tesla-SpaceX Merger Could Create Orbit-To-Ground AI Powerhouse With Over $1 Trillion In Chip Savings, Says Analyst
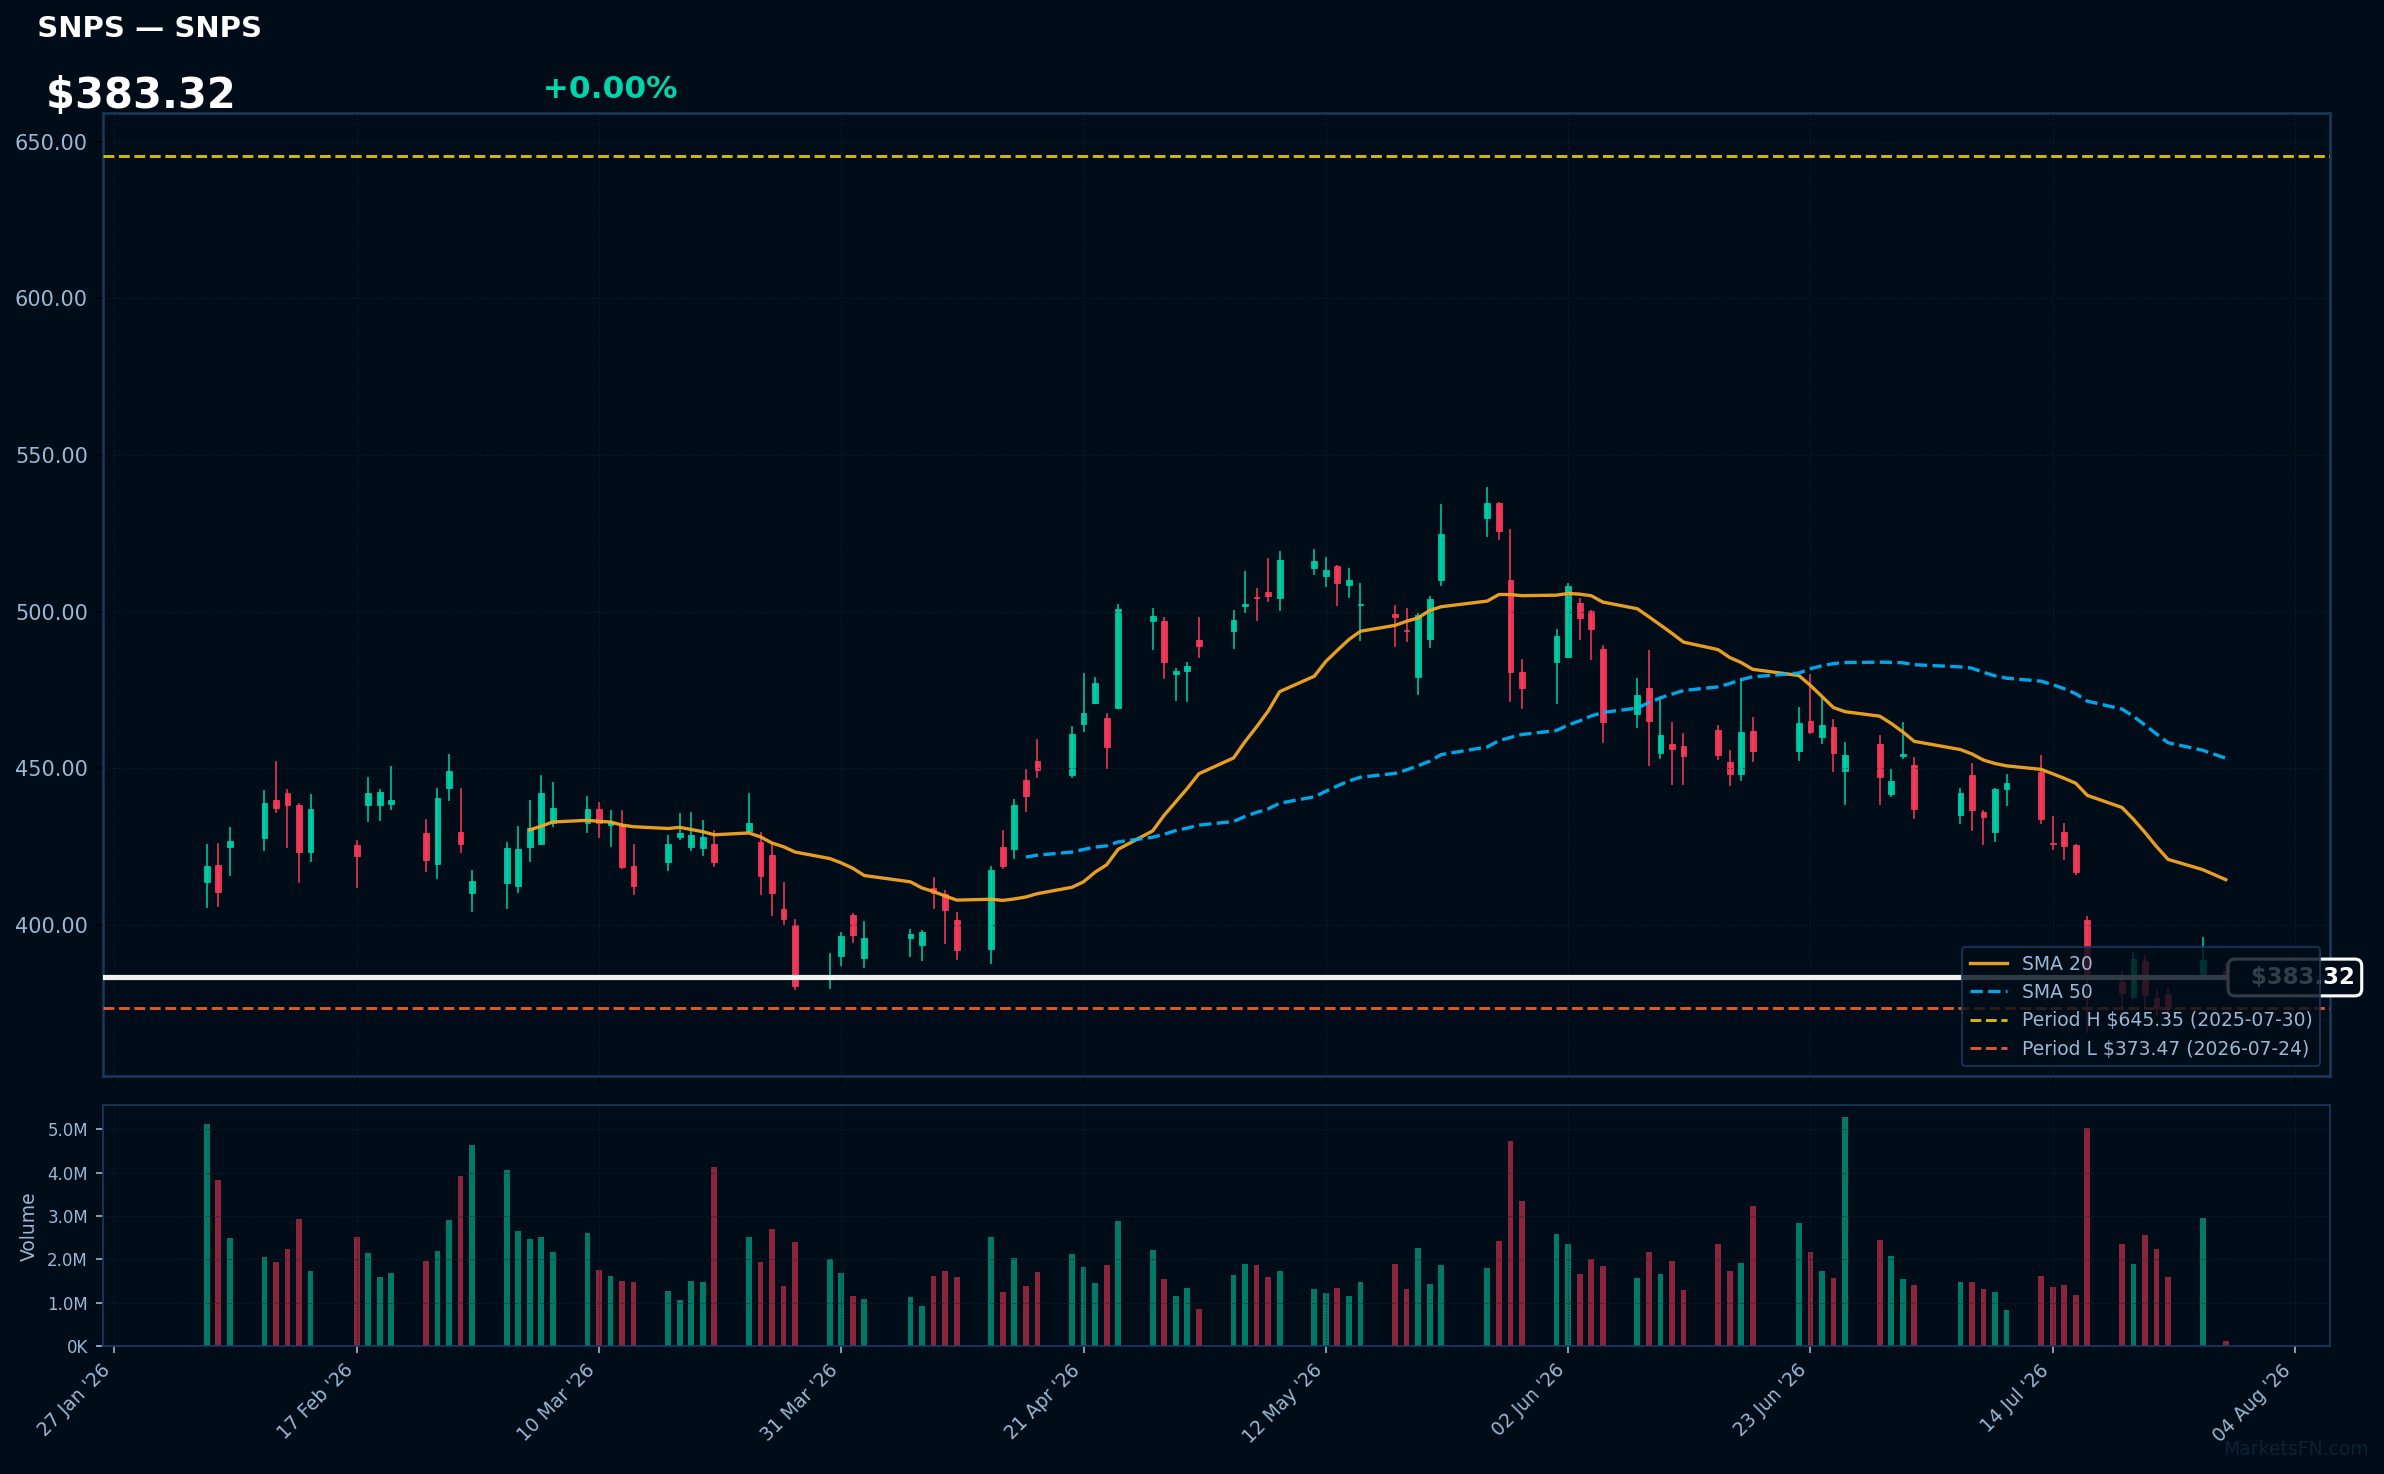
SNPS | Synopsys, Inc | Technology | Price Last: $383.01 | % Realized: -39.76% | RSI: 33.7 | % above MA200: -15.0% | Trend: Below MA20, MA50, MA200
Synopsys, Inc is a software company providing electronic design automation (EDA) tools and semiconductor IP, crucial for chip design and manufacturing. Investors care due to its dominant position in the EDA market and exposure to semiconductor industry trends.
Synopsys' technical situation is bearish, with RSI(14) at 33.7, below MA20/MA50/MA200, and only 2.6% above its 52-Week low, indicating major support testing. The -39.8% 52-Week return and oversold RSI suggest a potential warning sign.
Related headlines
- Synopsys unveils autonomous chip design workflows with Microsoft and AMD collaboration
- Synopsys and Intel Foundry Fast-Track Customer Readiness from Silicon to Systems on Intel 14A
- Synopsys Advances Agentic AI Chip Design with AMD and Microsoft
- Synopsys Showcases Comprehensive Autonomous Engineering Workflows from Silicon to Systems, Developed with NVIDIA Technology
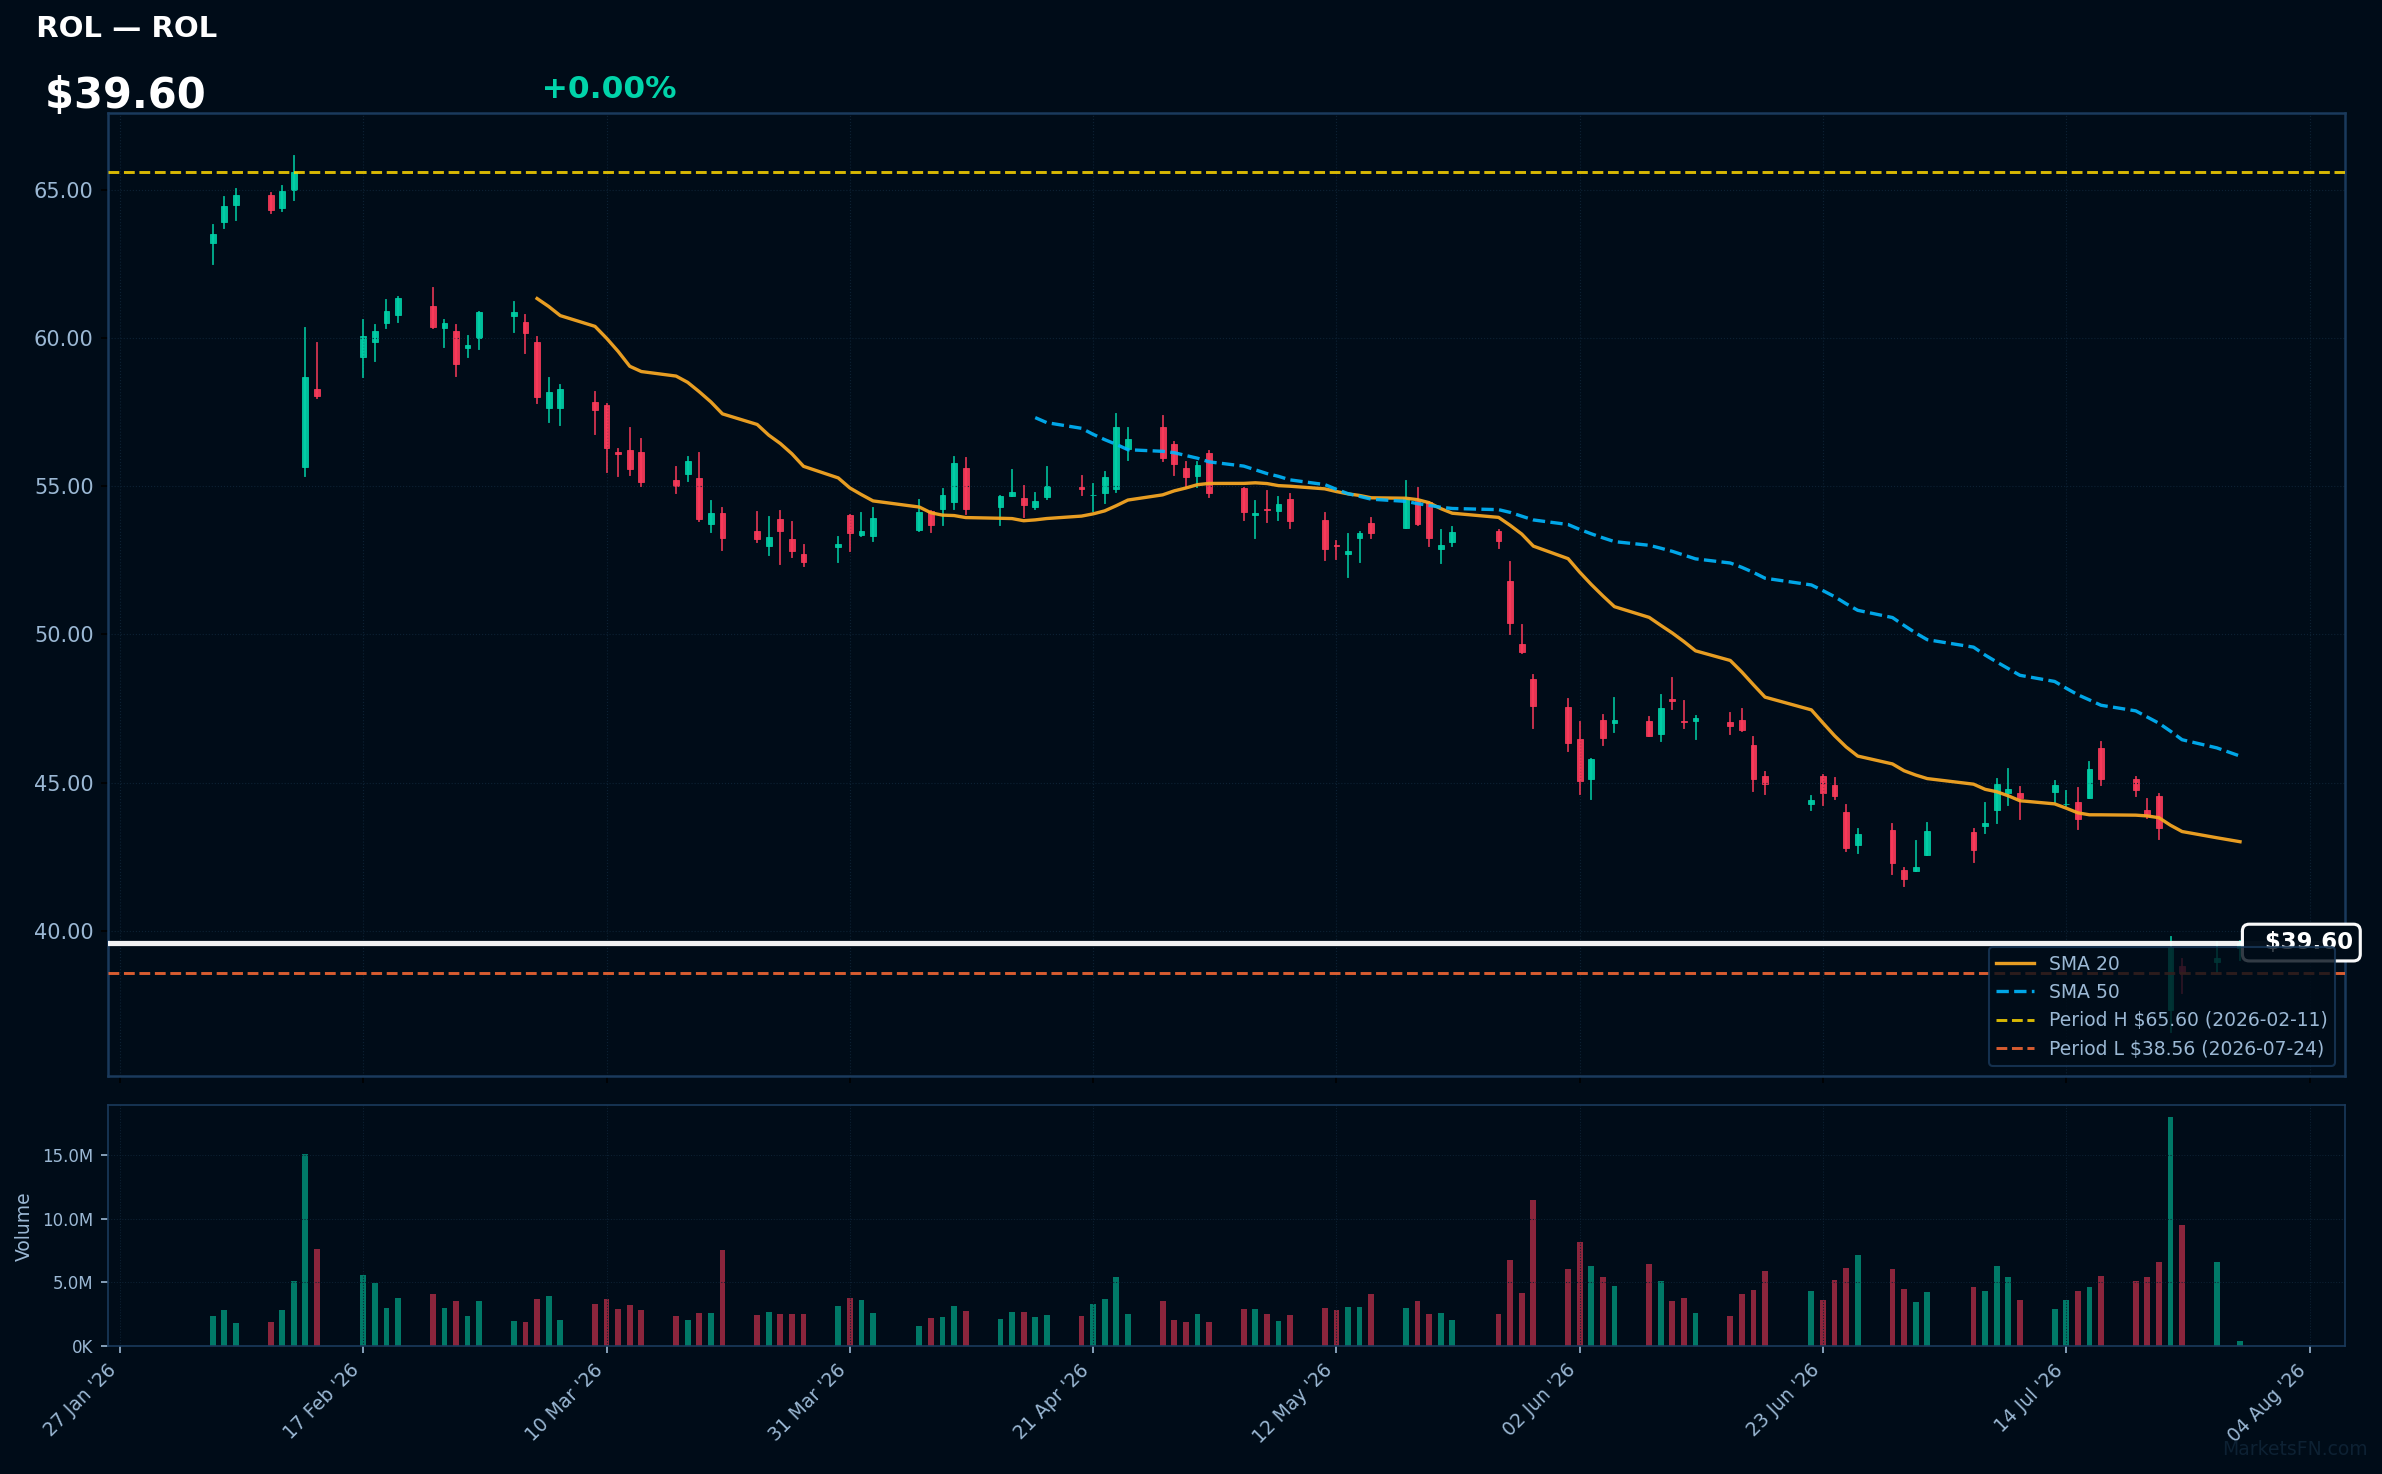
ROL | Rollins, Inc | Consumer Cyclical | Price Last: $39.62 | % Realized: -30.88% | RSI: 32.5 | % above MA200: -28.1% | Trend: Below MA20, MA50, MA200
Rollins, Inc provides pest control services through its Orkin, Terminix, and Rollins subsidiaries, offering termite and pest control solutions to residential and commercial customers, generating recurring revenue through contracts and services.
Rollins, Inc is in a sustained downtrend with price ($39.60) below MA20, MA50, and MA200. The RSI(14) is 32.5, nearing oversold territory, and the stock is 2.7% above its 52-Week low, testing major support after a -30.9% 52-Week return.
Related headlines
- JPMorgan cuts Rollins to Neutral on demand uncertainty, slashes price target
- Rollins Inc (ROL) Q2 2026 Earnings Call Highlights: Strong Growth in Termite and Ancillary ...
- Rollins Inc. stock underperforms Thursday when compared to competitors
- Rollins shares plunge premarket after Q2 miss triggers downgrades
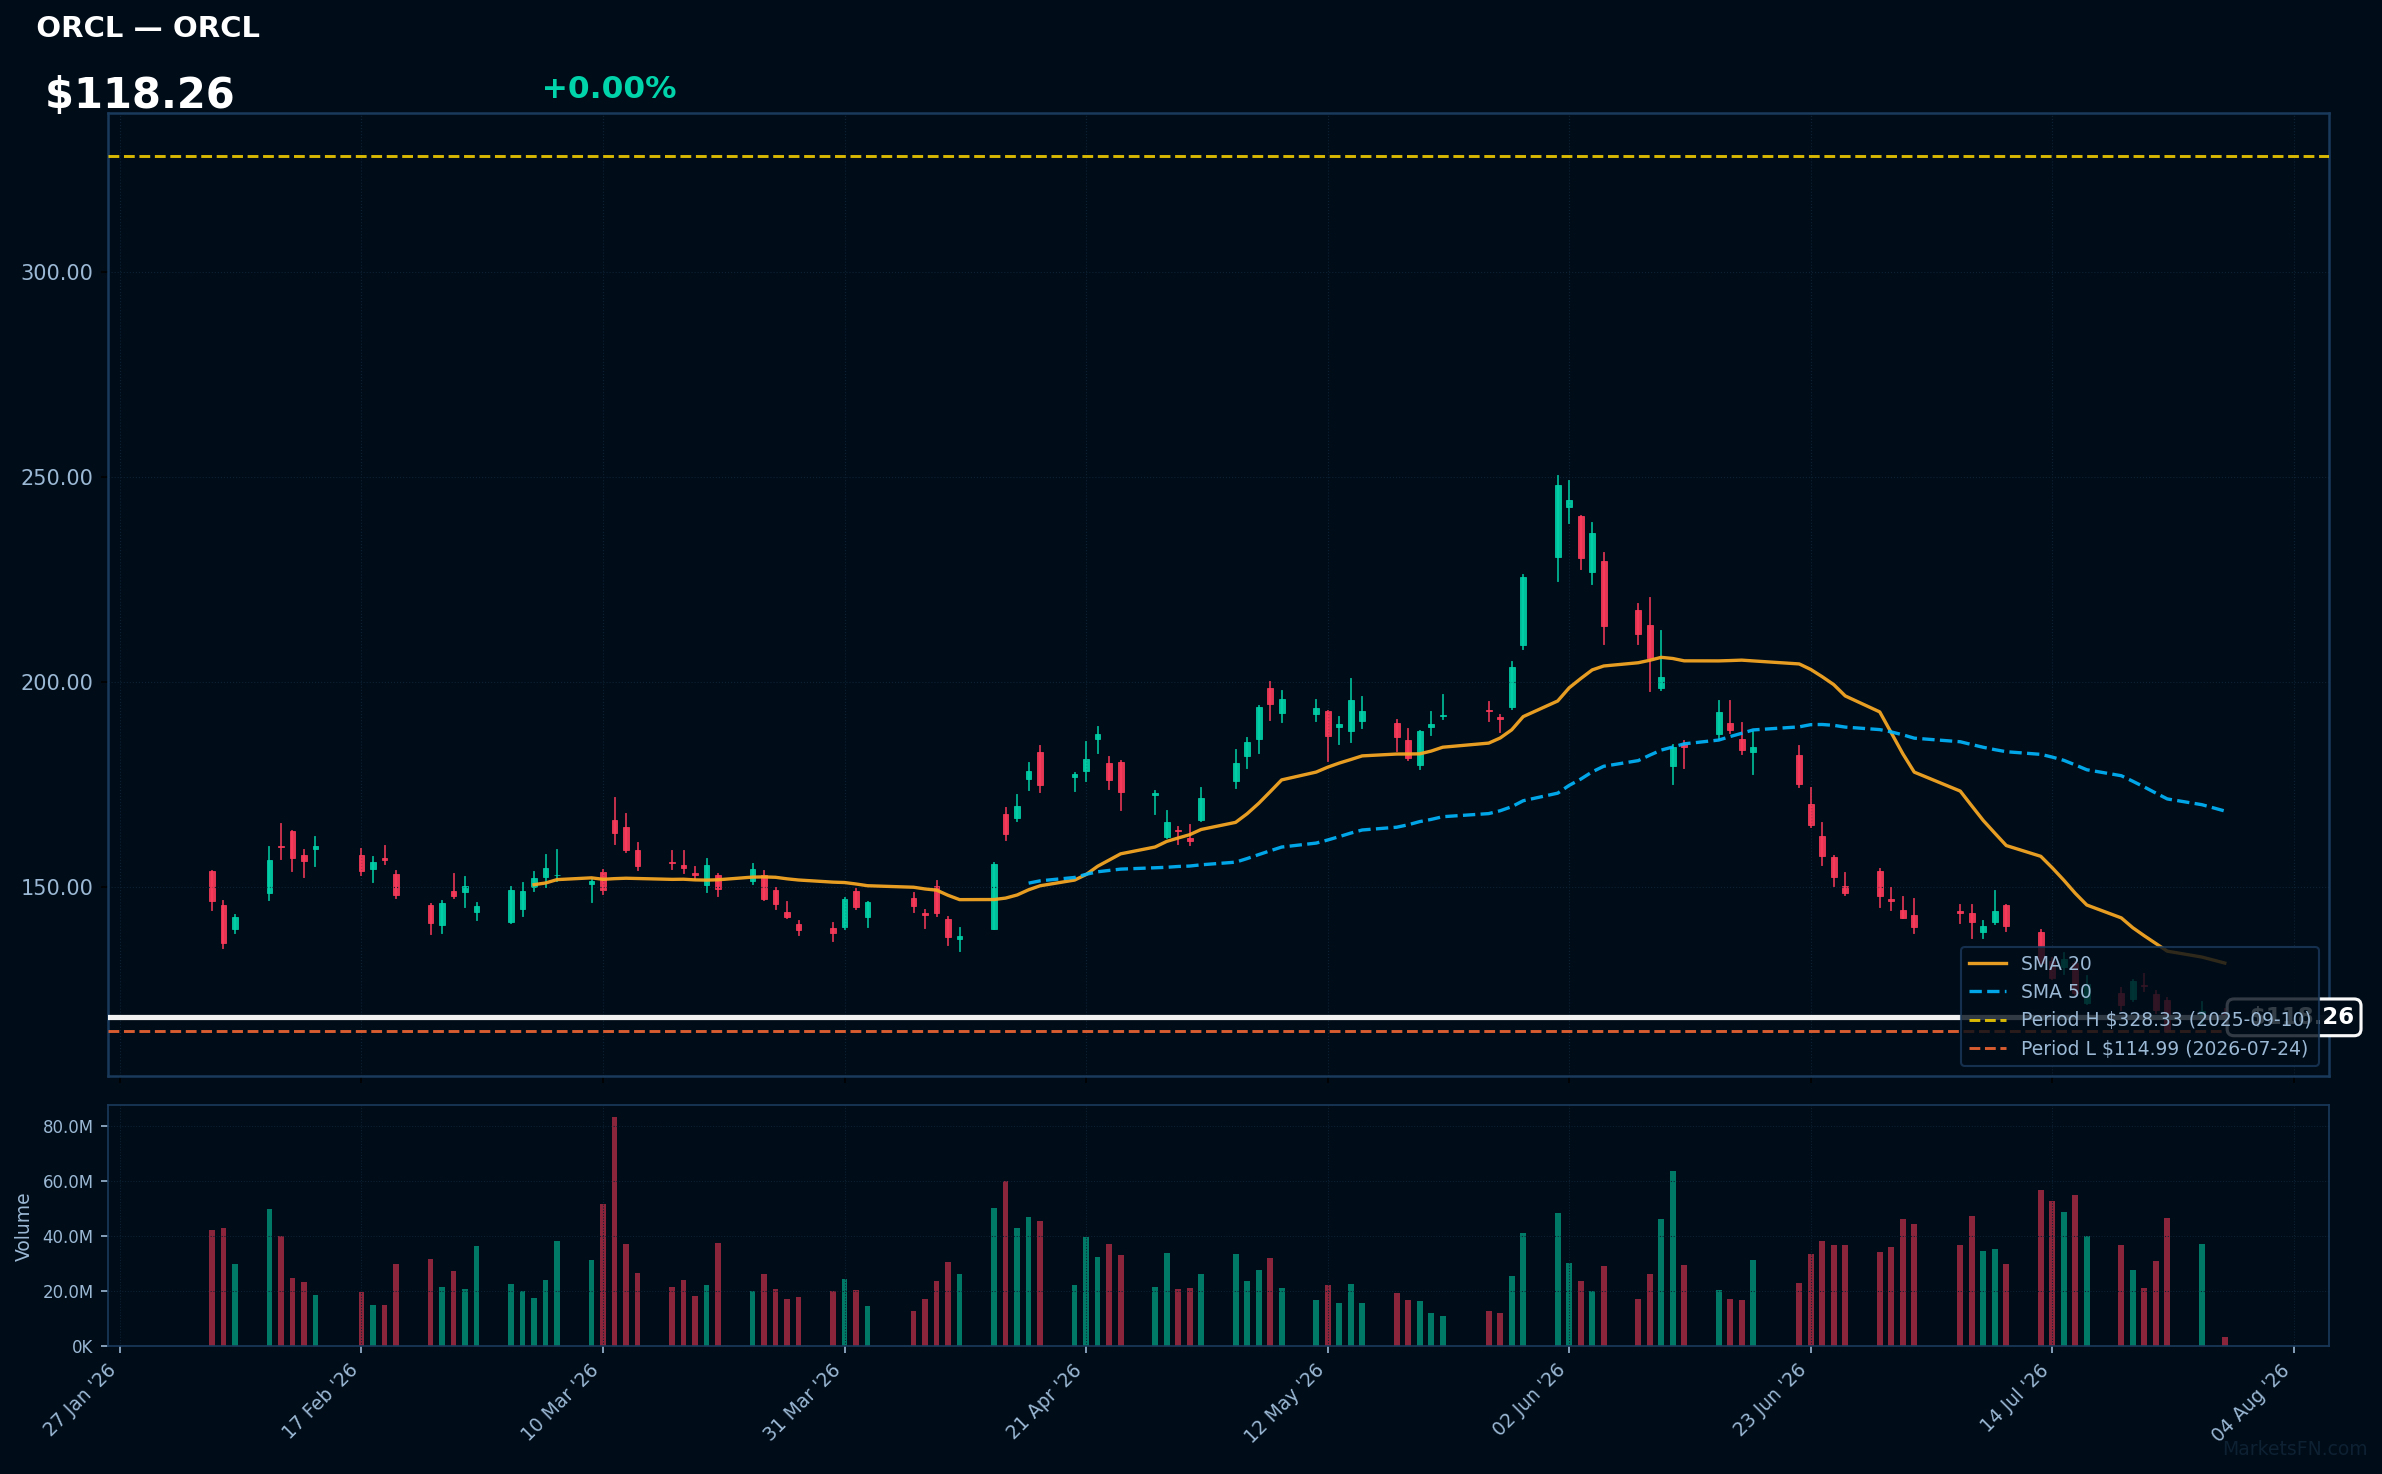
ORCL | Oracle Corp | Technology | Price Last: $118.25 | % Realized: -52.69% | RSI: 31.9 | % above MA200: -36.3% | Trend: Below MA20, MA50, MA200
Oracle Corp is a cloud computing and enterprise software company, providing database management, ERP, and customer relationship management solutions. Investors care about its transition to cloud services and competition in the enterprise software market.
Oracle Corp's technical situation is bearish, with RSI(14) at 31.9, indicating oversold conditions, and a sustained downtrend as price ($118.26) remains below MA20, MA50, and MA200, with the stock 2.8% above its 52-Week low.
Related headlines
- Own Salesforce For AI? Oracle's Order Book Demands A Look
- One number instantly explains why Apple's investors are having a wildly different year than Oracle's
- NVDA, MSFT, and ORCL Forecasts Tech Stocks Gap Higher as Rates Drop
- Nasdaq Futures Lead US Premarket Rally As Iran Ceasefire Reports Ease Fears Ahead Of Big Tech Earnings: Why NVDA, ORCL, SPCX, XOM, OTLK Are In Focus
Market Commentary
The S&P 500 stocks near 52-week extremes indicate a significant market trend. Stocks like AAPL, V, JNJ, ABBV, and KO are trading at their 52-week highs, suggesting a strong uptrend in established companies. Conversely, PSKY, TSLA, SNPS, ROL, and ORCL are near their 52-week lows, potentially signaling a downturn or consolidation in these names.
The presence of stocks at 52-week highs and lows may indicate sector rotation, with investors shifting between established stalwarts and potentially undervalued or distressed companies. The stocks at 52-week highs are largely from the consumer staples and healthcare sectors, which are often considered defensive. In contrast, the stocks near 52-week lows are from a mix of technology and consumer discretionary sectors, which can be more sensitive to economic cycles.
Key levels to watch include the 52-week extremes for these stocks, as breaks above or below these levels can trigger further price movements. Potential catalysts include earnings reports, macroeconomic data releases, and sector-specific news that may influence investor sentiment and drive further rotation between these stocks.
Methodology: All 503 S&P 500 constituents screened. 52-week high = highest daily close over the past 252 trading days (approx. 1 year). 52-week low = lowest daily close over the same period. Distance = (current price / extreme − 1) × 100. Technical indicators computed on up to 1 year of daily OHLCV data.
Disclaimer: For informational purposes only. Not investment advice. Past performance is not indicative of future results.

