S&P 500 52-Week Highs & Lows Radar: Bank Of America (BAC), Nike, (NKE) and more
MarketsFN Team

S&P 500 52-Week Highs & Lows Radar: Bank Of America (BAC), Nike, (NKE) and more
Screening all 503 S&P 500 constituents for stocks nearest to their 52-week high and their 52-week low. Data as of August 17, 2026. % Realized = 52-week total return.
Legend: RSI > 70 = overbought · RSI < 30 = oversold · Green % Realized = positive 52W return · Red = negative.
📈 Nearest to 52-Week High
Sectors represented: Financial (3), Industrials (1), Energy (1)
| Ticker | Company | Sector | Price Last | % Realized | 52-Week High Date | RSI | % above MA200 | Trend |
|---|---|---|---|---|---|---|---|---|
| BAC | Bank Of America Corp | Financial | $64.97 | +35.59% | 2026-08-17 | 70.4 | +19.8% | Above MA20, MA50, MA200 |
| PNC | PNC Financial Services Group Inc | Financial | $257.63 | +34.18% | 2026-08-17 | 64.2 | +16.9% | Above MA20, MA50, MA200 |
| USB | U.S. Bancorp | Financial | $65.79 | +42.68% | 2026-08-17 | 67.9 | +18.3% | Above MA20, MA50, MA200 |
| JCI | Johnson Controls International plc | Industrials | $154.99 | +46.62% | 2026-08-17 | 62.9 | +16.5% | Above MA20, MA50, MA200 |
| MPC | Marathon Petroleum Corp | Energy | $360.70 | +121.74% | 2026-08-17 | 75.8 | +57.2% | Above MA20, MA50, MA200 |
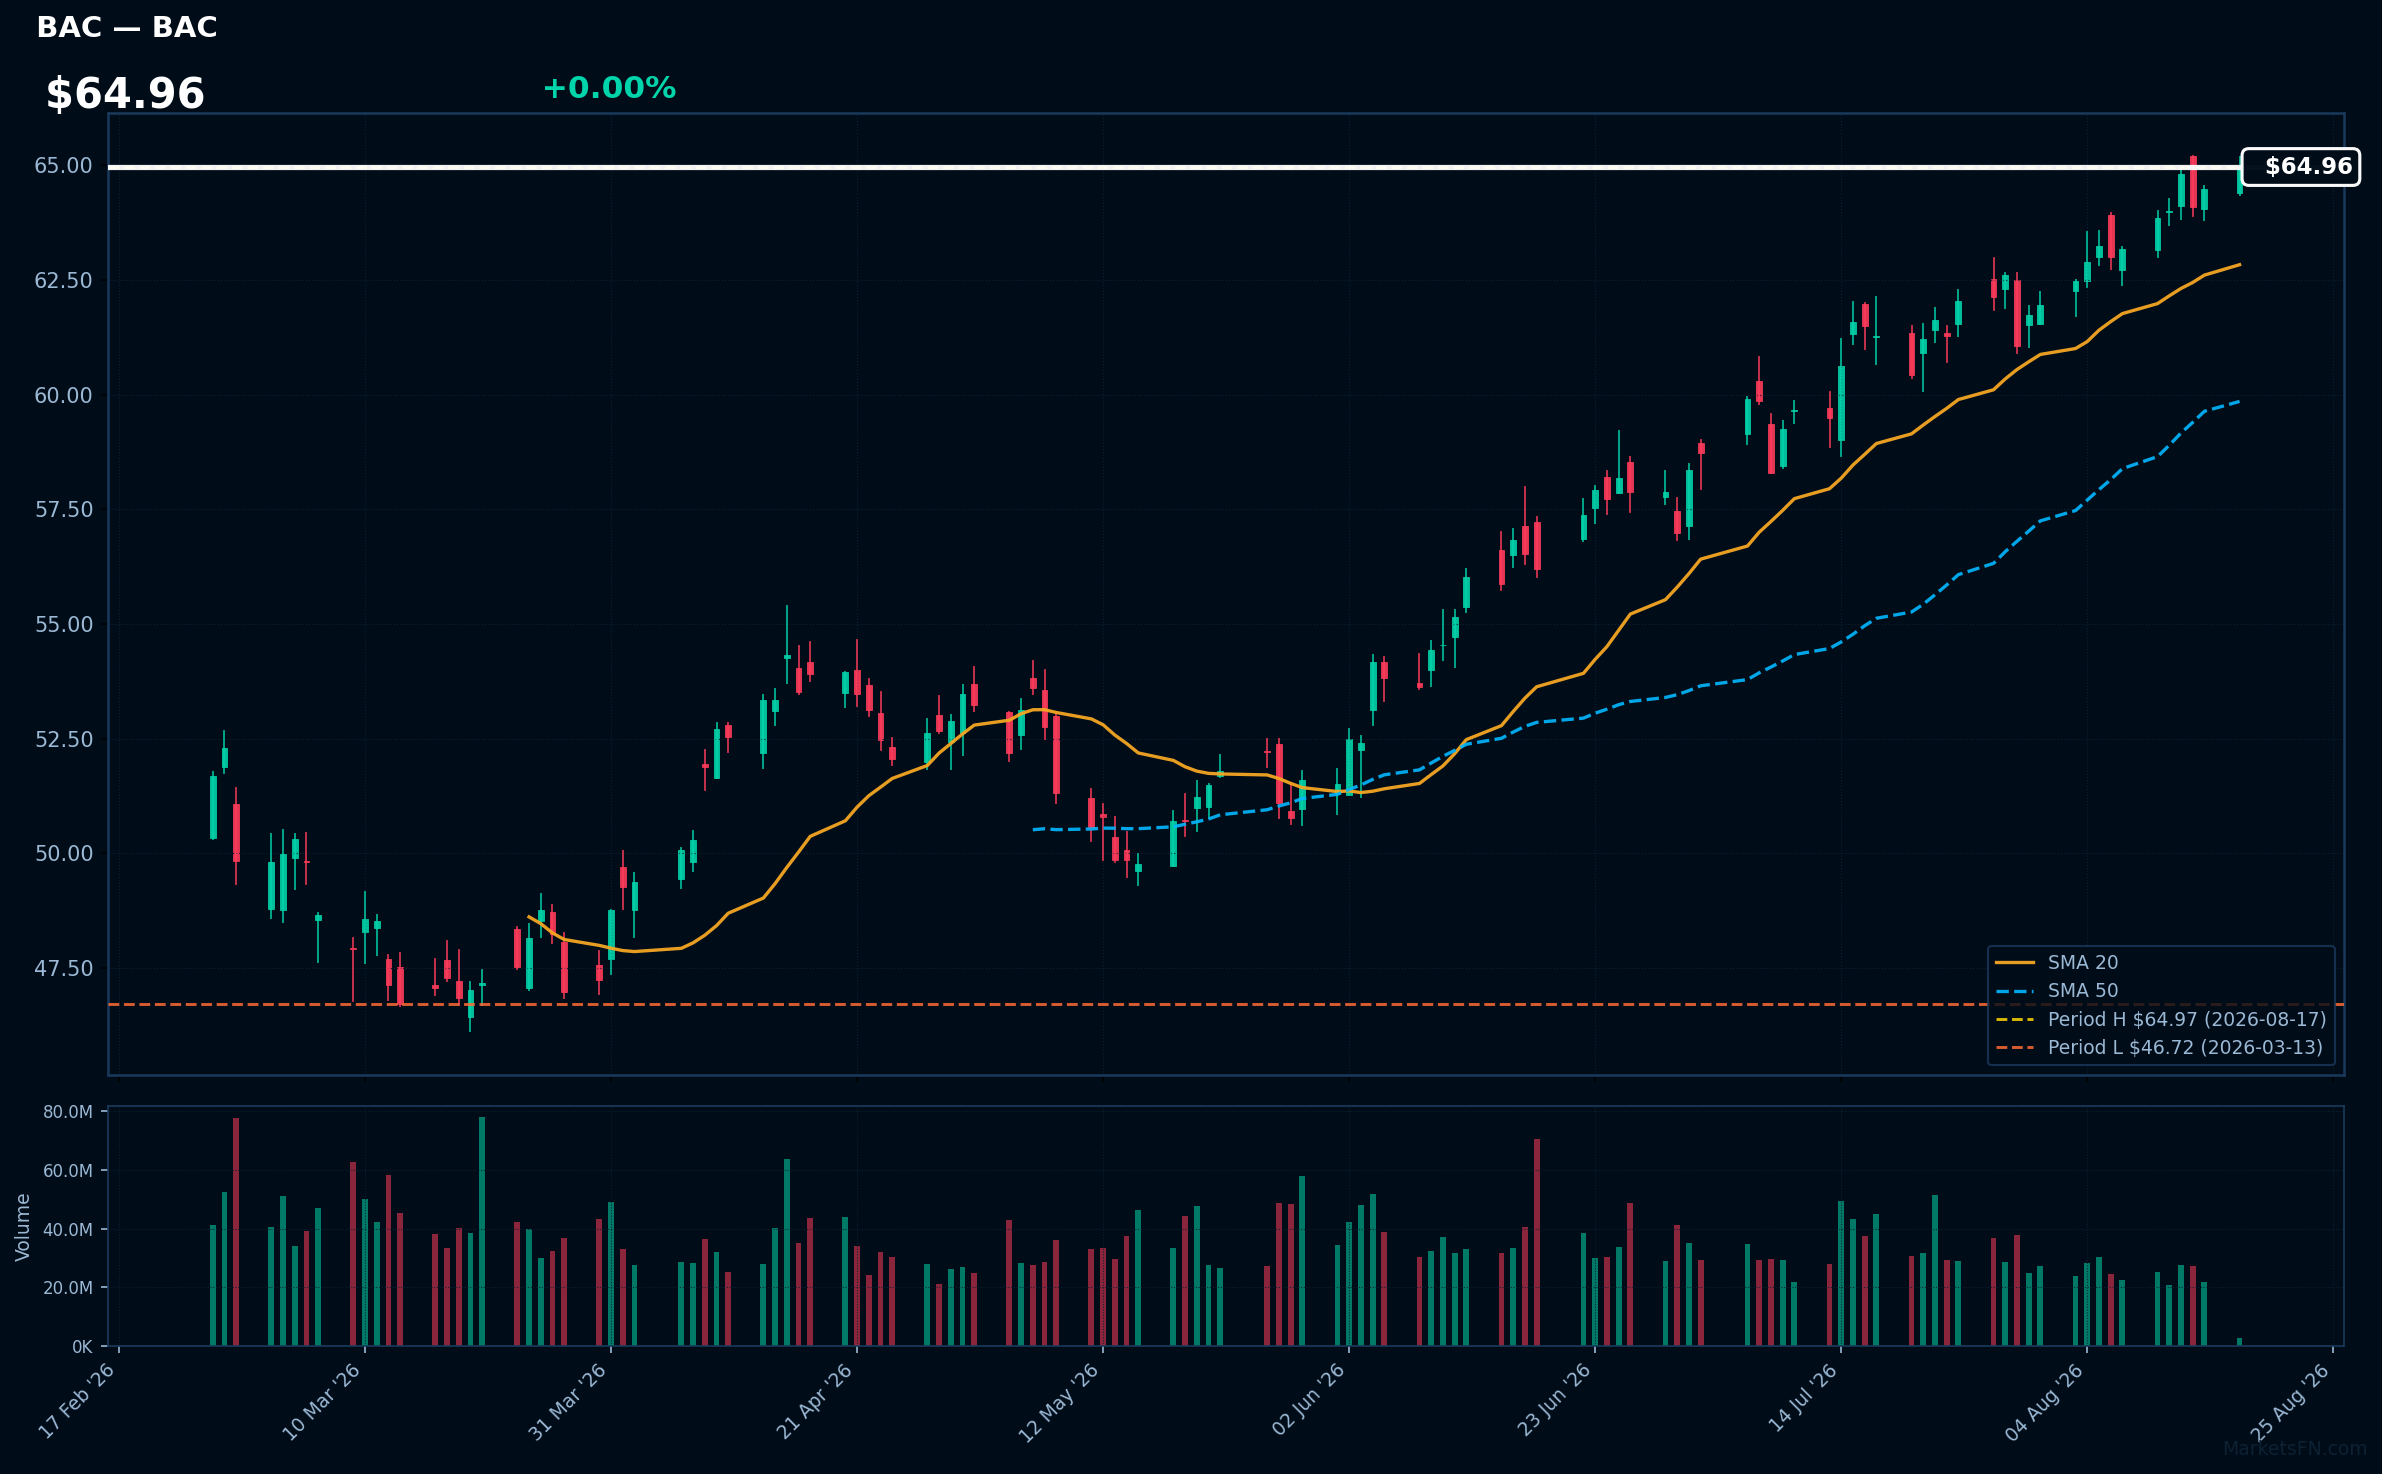
BAC | Bank Of America Corp | Financial | Price Last: $64.97 | % Realized: +35.59% | RSI: 70.4 | % above MA200: +19.8% | Trend: Above MA20, MA50, MA200
Bank Of America Corp (BAC) is a leading financial institution providing banking, investment, and wealth management services. Investors should care due to its significant market presence and potential for growth, particularly in a rising interest rate environment that can enhance profitability.
The current technical situation indicates strong momentum, with an RSI(14) of 70.4 and a bullish MA alignment: price > MA20 > MA50 > MA200. The stock is also 0.0% below its 52-Week high, signaling a potential breakout.
Related headlines
- Central bank market backstops risk fuelling leverage and future crises
- Bond Traders Are Agonizing Over $70 Billion of Shadow Credit Backstops For AI Companies
- Louis Moore Bacon's Top Q2 2026 Move: Bank of America Corp at a -1.49% Portfolio Impact
- Bank of America Sees Bargains in These 16 Knocked-Down AI Stocks
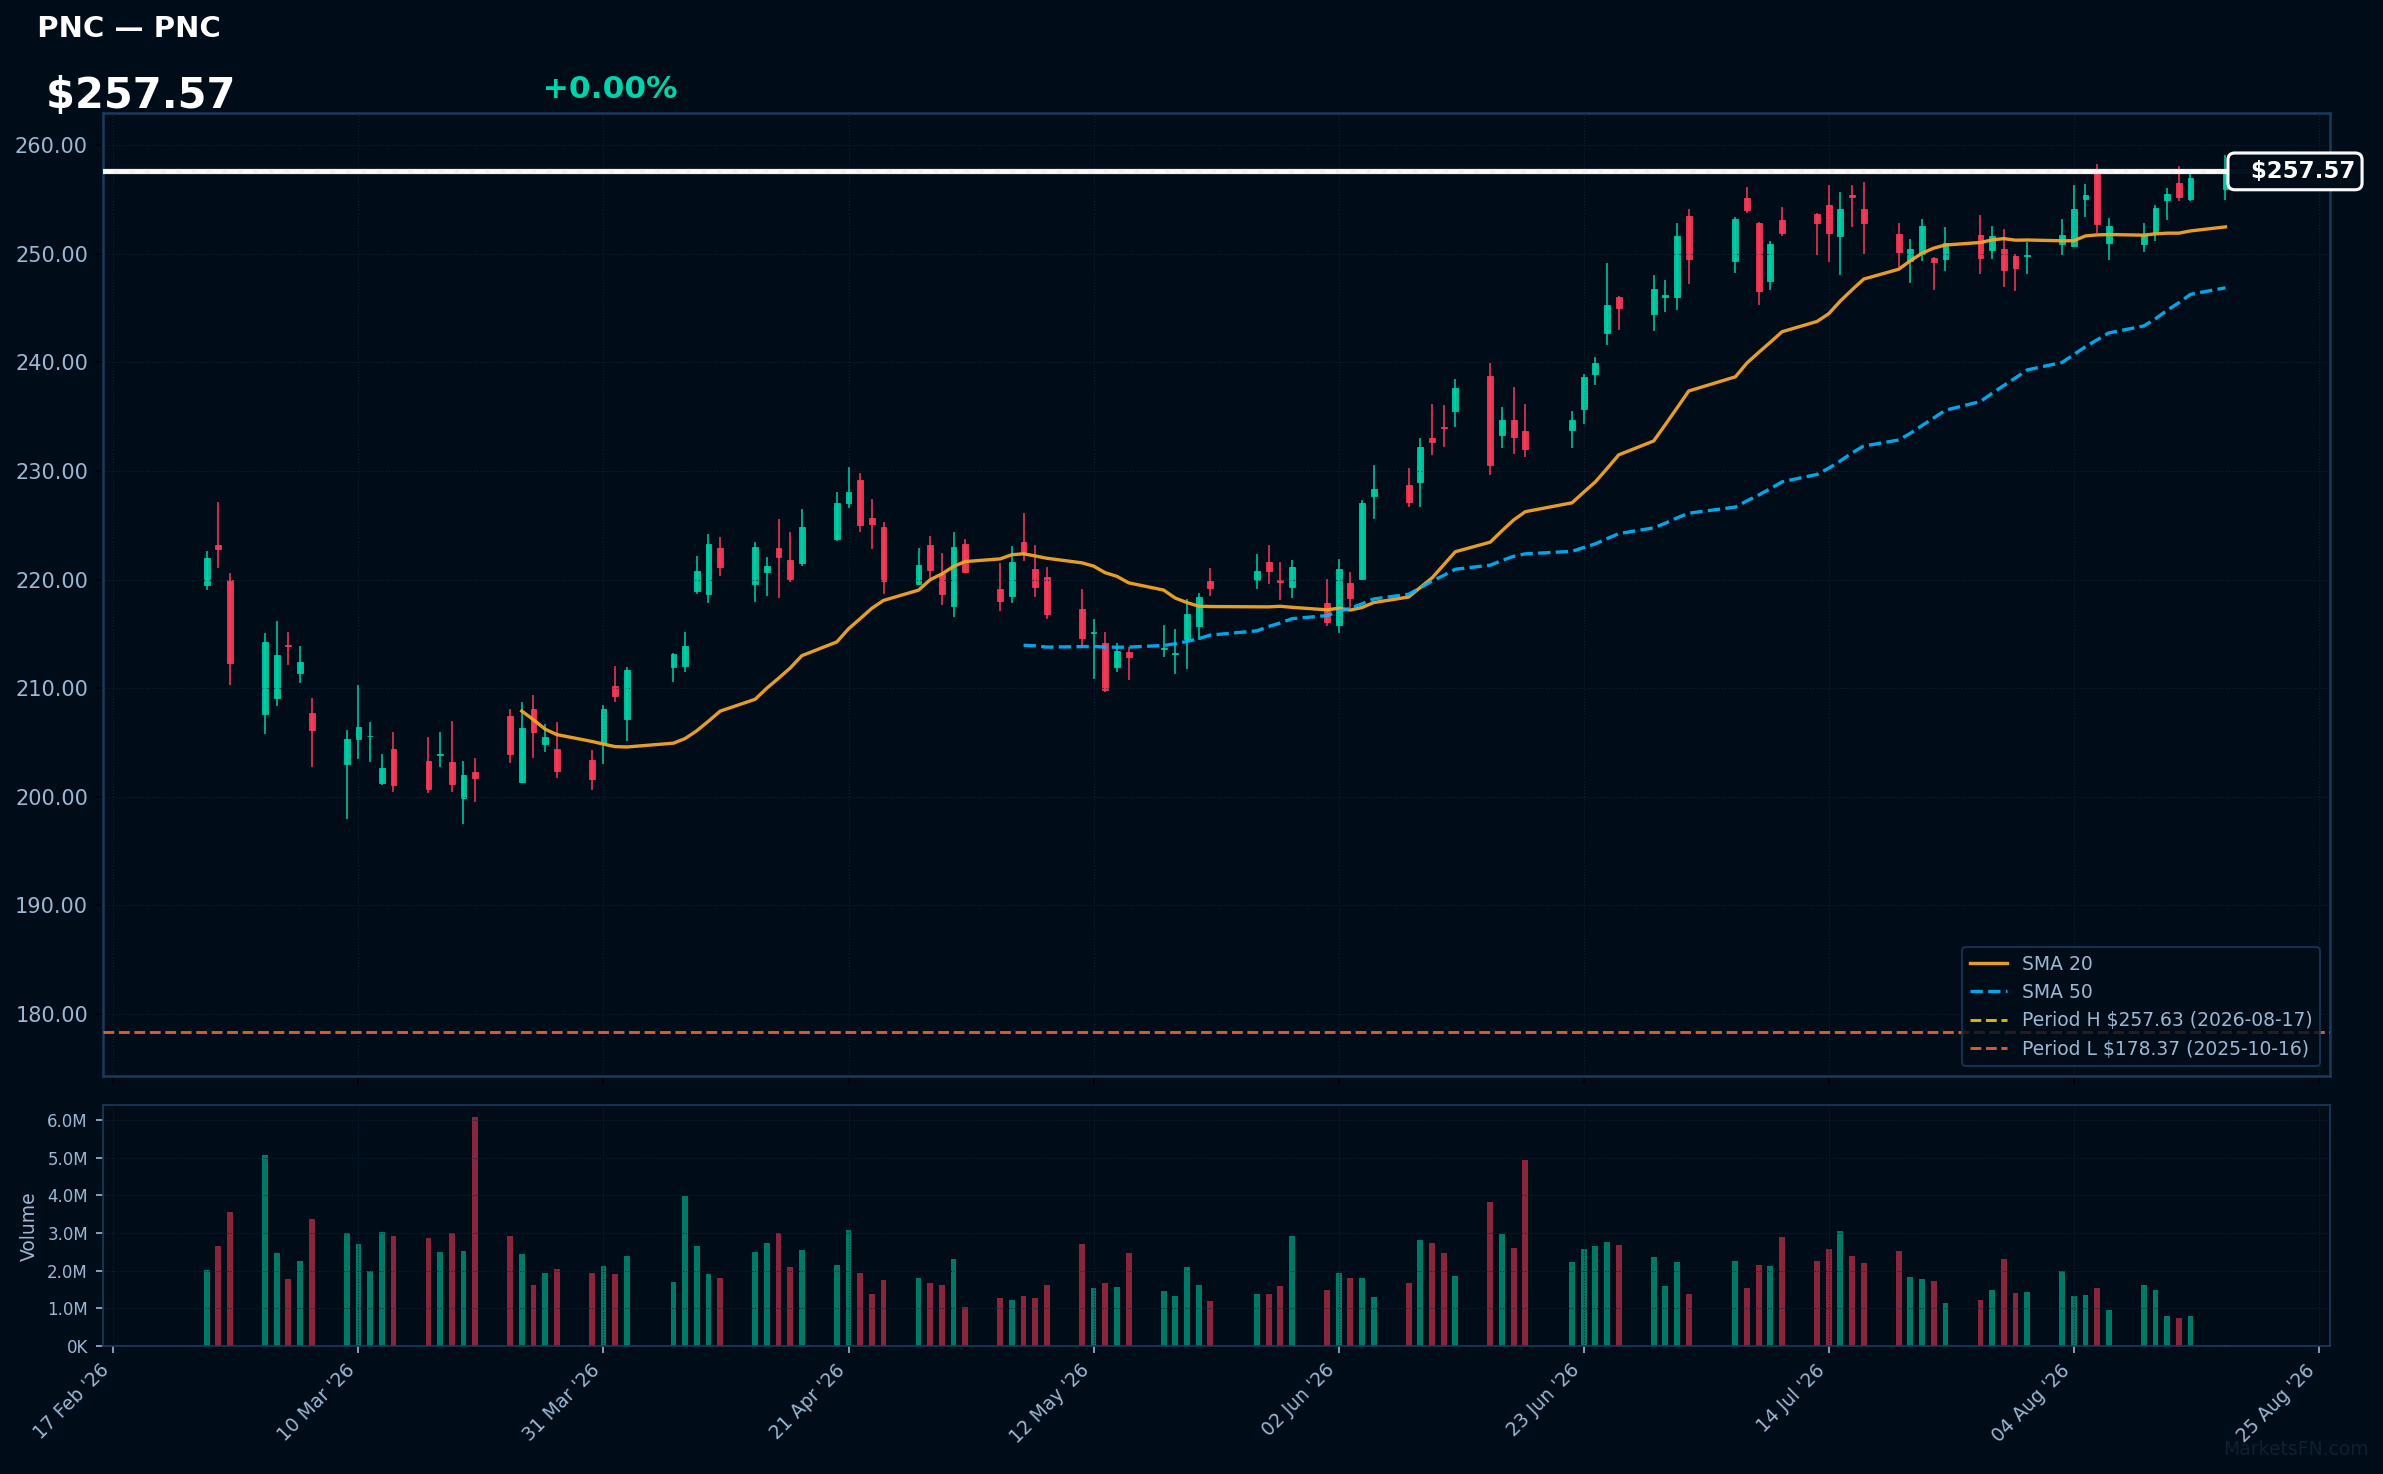
PNC | PNC Financial Services Group Inc | Financial | Price Last: $257.63 | % Realized: +34.18% | RSI: 64.2 | % above MA200: +16.9% | Trend: Above MA20, MA50, MA200
PNC Financial Services Group Inc provides diversified financial services, including retail banking, corporate banking, and investment management. Investors should care due to its strong market position and consistent performance, which can drive growth and shareholder value.
PNC shows bullish momentum with an RSI(14) of 64.2 and a strong MA alignment: price > MA20 > MA50 > MA200. The stock is 0.0% below its 52-Week high, indicating a potential breakout.
Related headlines
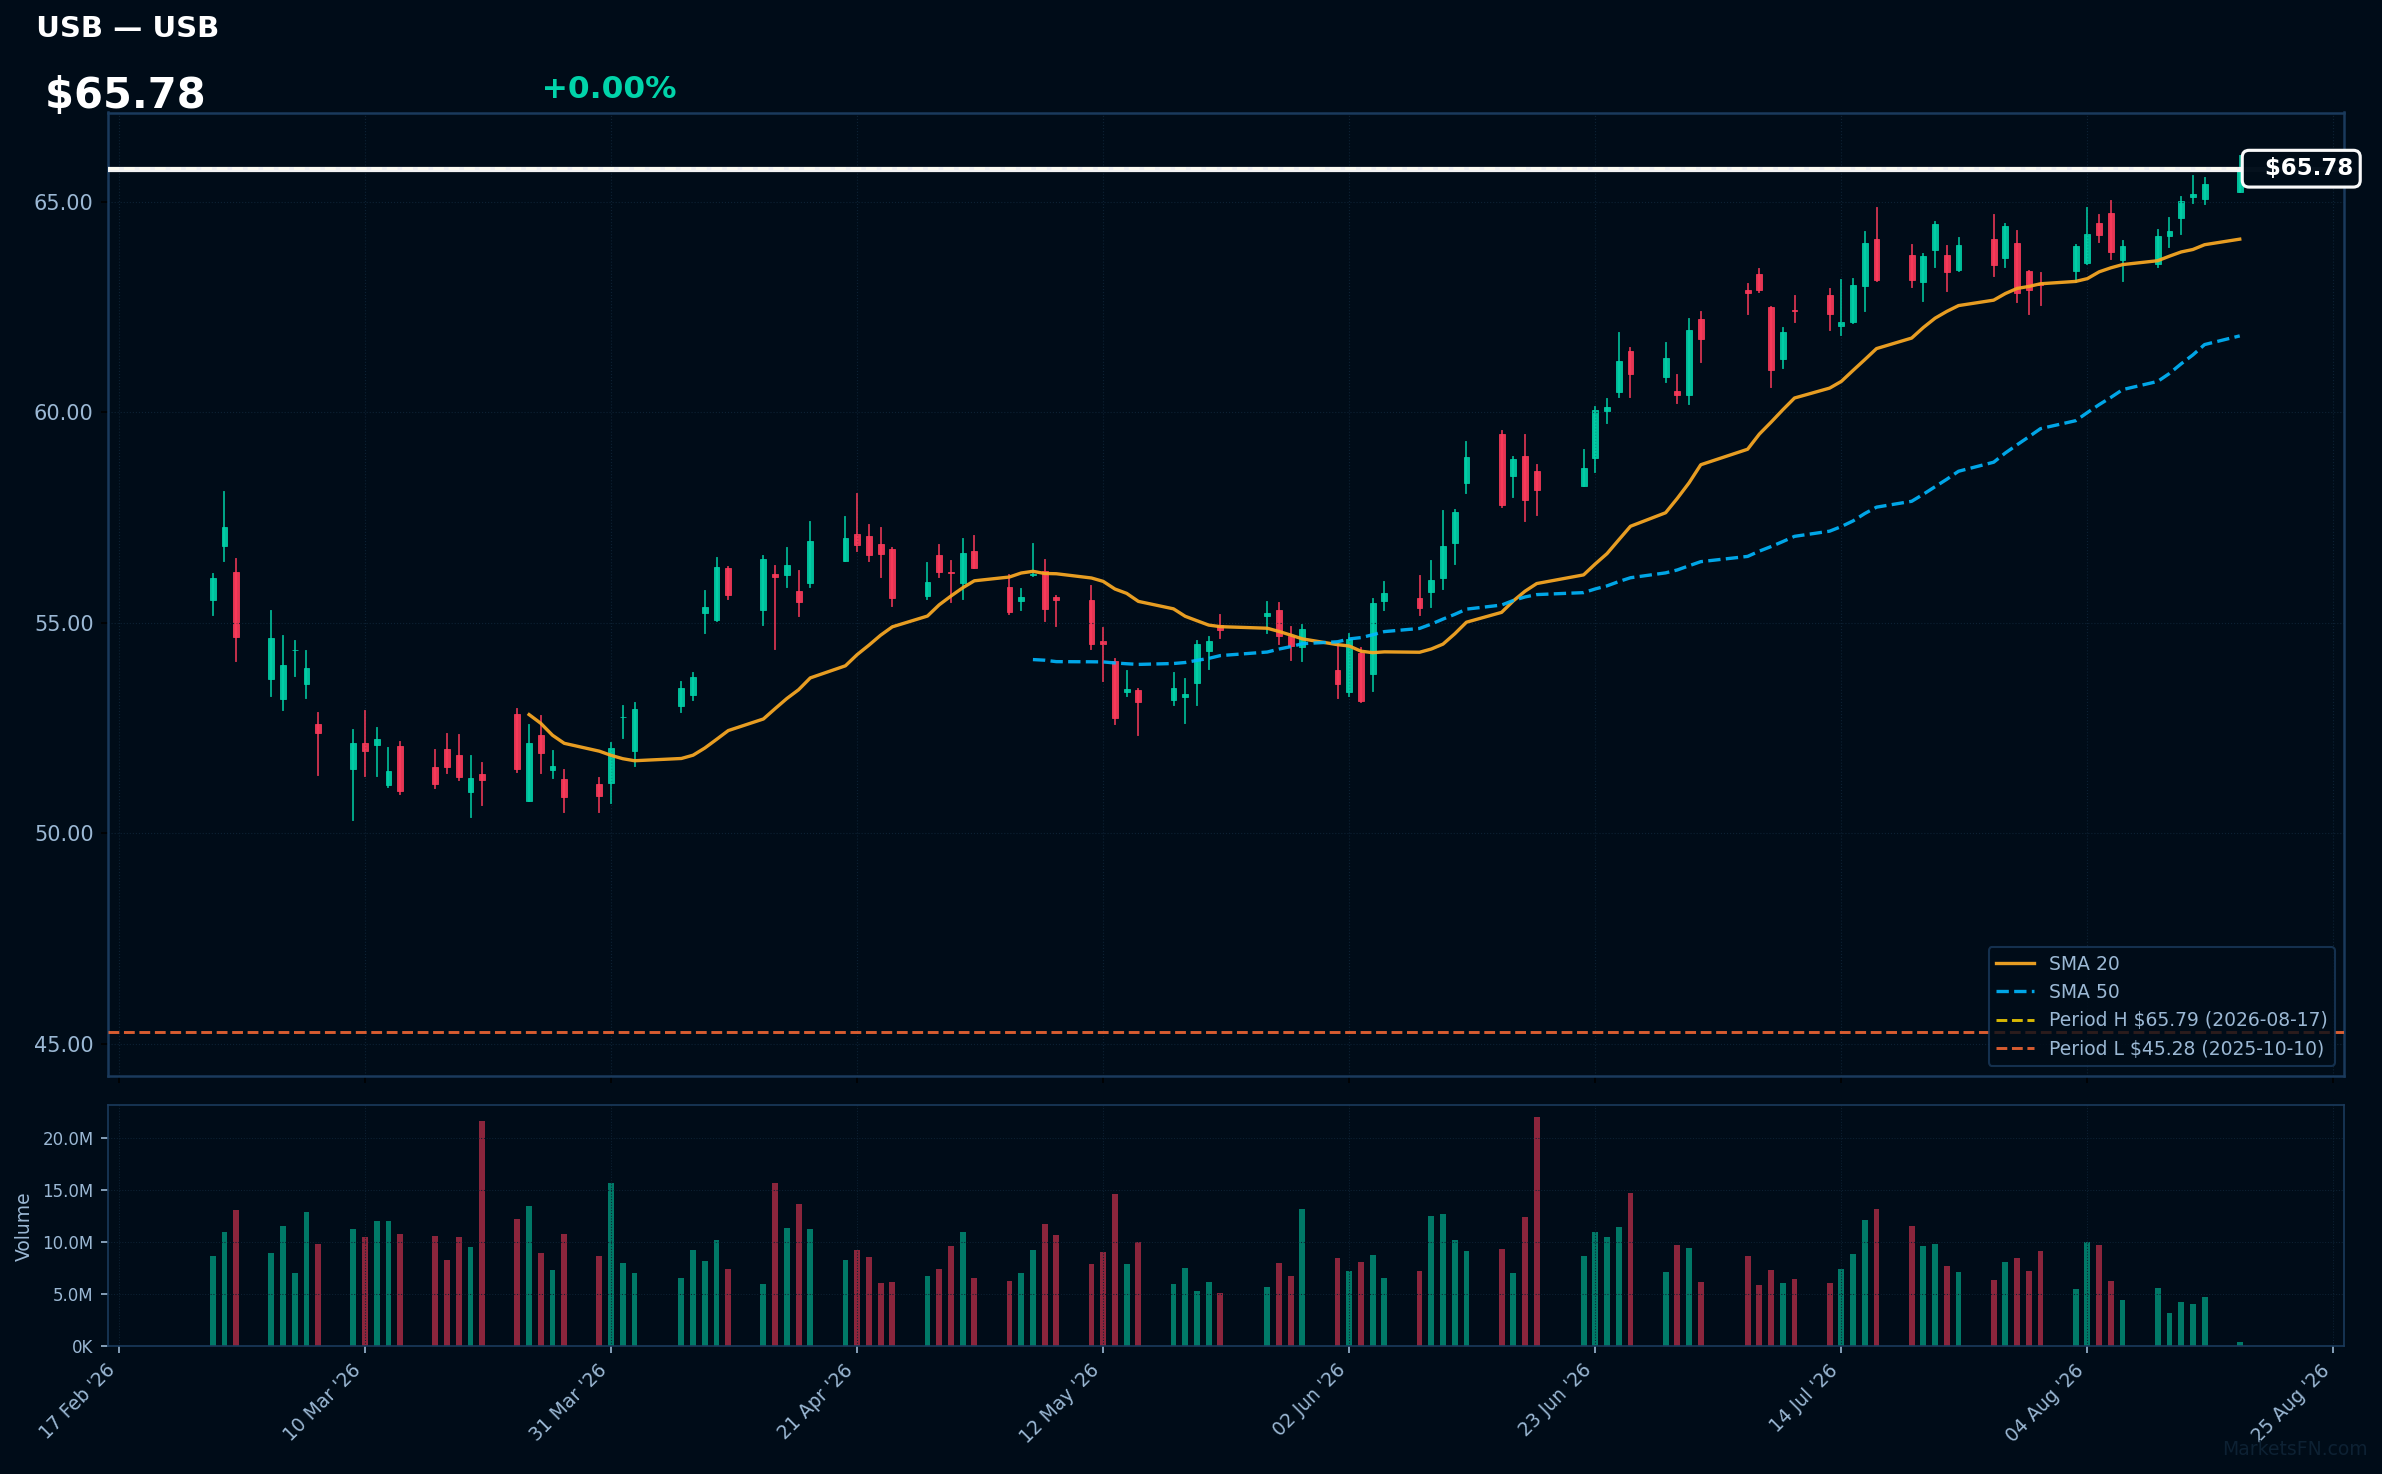
USB | U.S. Bancorp | Financial | Price Last: $65.79 | % Realized: +42.68% | RSI: 67.9 | % above MA200: +18.3% | Trend: Above MA20, MA50, MA200
U.S. Bancorp (USB) operates as a financial services holding company, providing banking, investment, mortgage, trust, and payment services. Investors should care due to its strong market position and consistent performance in a competitive banking landscape.
The current technical situation shows bullish momentum with an RSI(14) of 67.9 and a bullish MA alignment: price > MA20 > MA50 > MA200. The stock is also 0.0% below its 52-Week high.
Related headlines
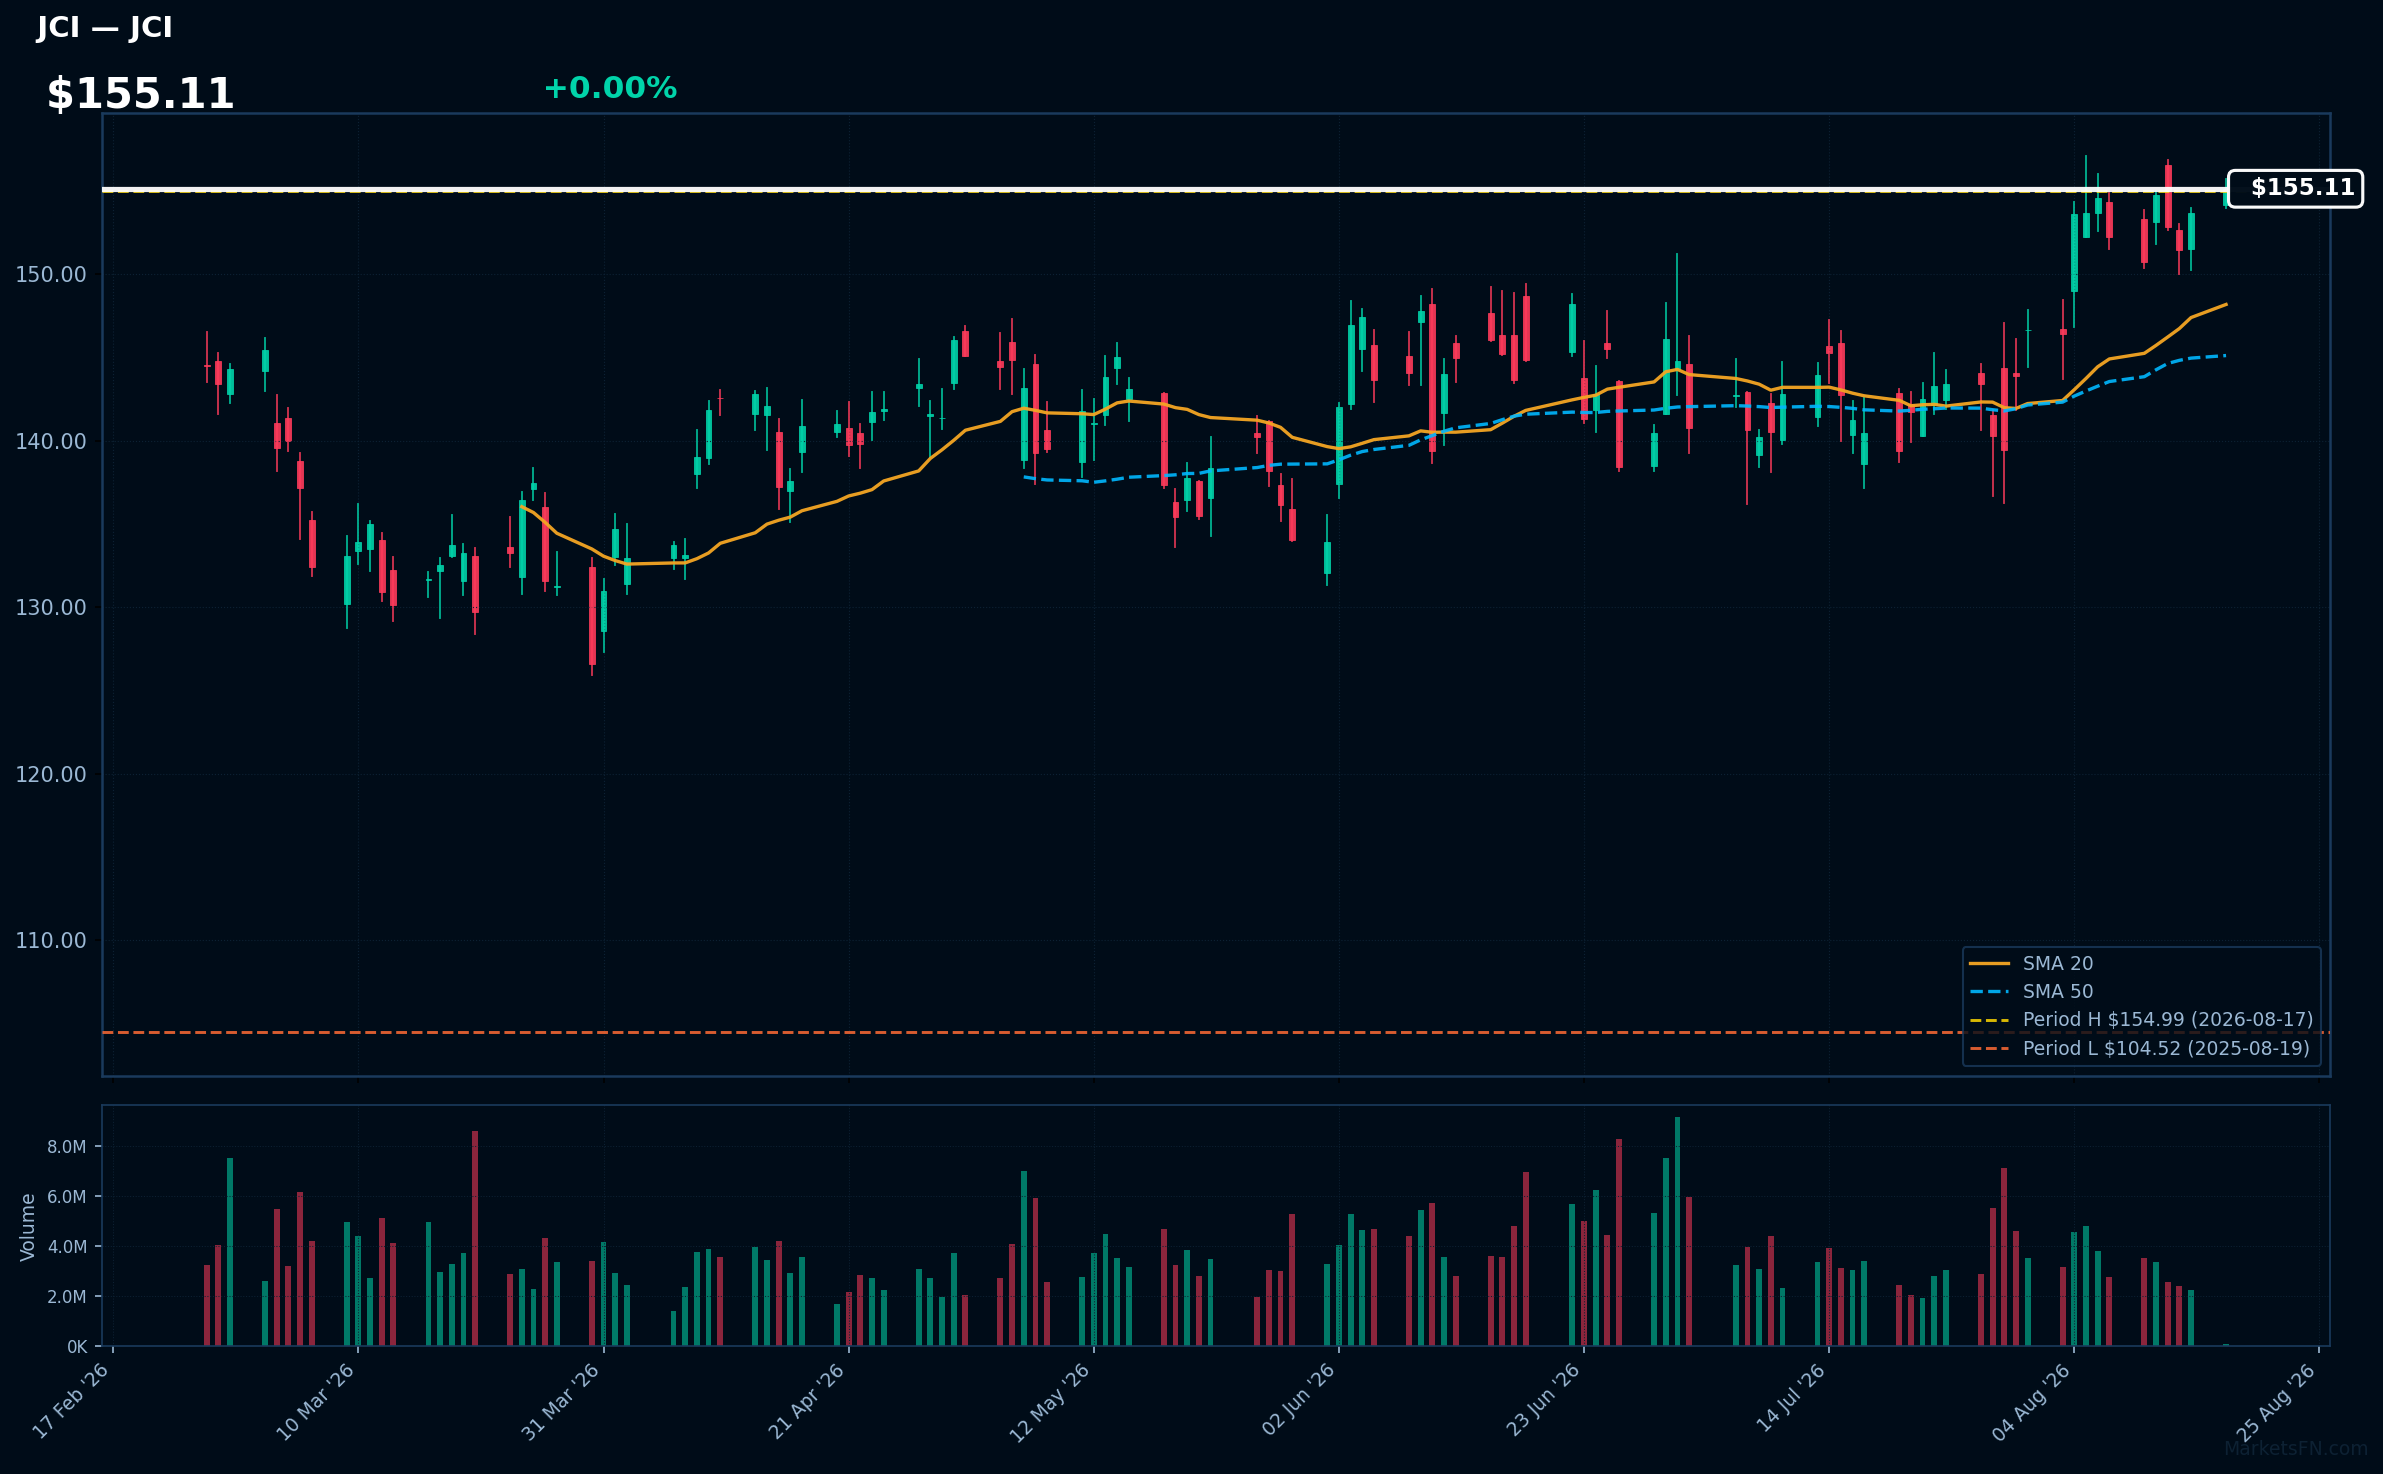
JCI | Johnson Controls International plc | Industrials | Price Last: $154.99 | % Realized: +46.62% | RSI: 62.9 | % above MA200: +16.5% | Trend: Above MA20, MA50, MA200
Johnson Controls International plc specializes in smart building technologies, energy solutions, and HVAC systems, helping businesses enhance efficiency and sustainability. Investors should care due to its innovative approach in a growing market focused on energy management and environmental responsibility.
The current technical situation indicates bullish momentum, with an RSI(14) of 62.9 and a strong MA alignment: price > MA20 > MA50 > MA200, suggesting a sustained uptrend and proximity to a breakout level.
Related headlines
- Johnson Controls touts absorption chillers to cut data center energy demand
- Johnson Controls International PLC (JCI) Q3 2026 Earnings Call Highlights: Strong Revenue ...
- Johnson Controls Reports Strong Q3 Results; Raises FY26 Guidance
- Johnson Controls introduces Absorption Chiller Reference Design Guide, unlocking up to 97MW of additional AI capacity from on-site power generation
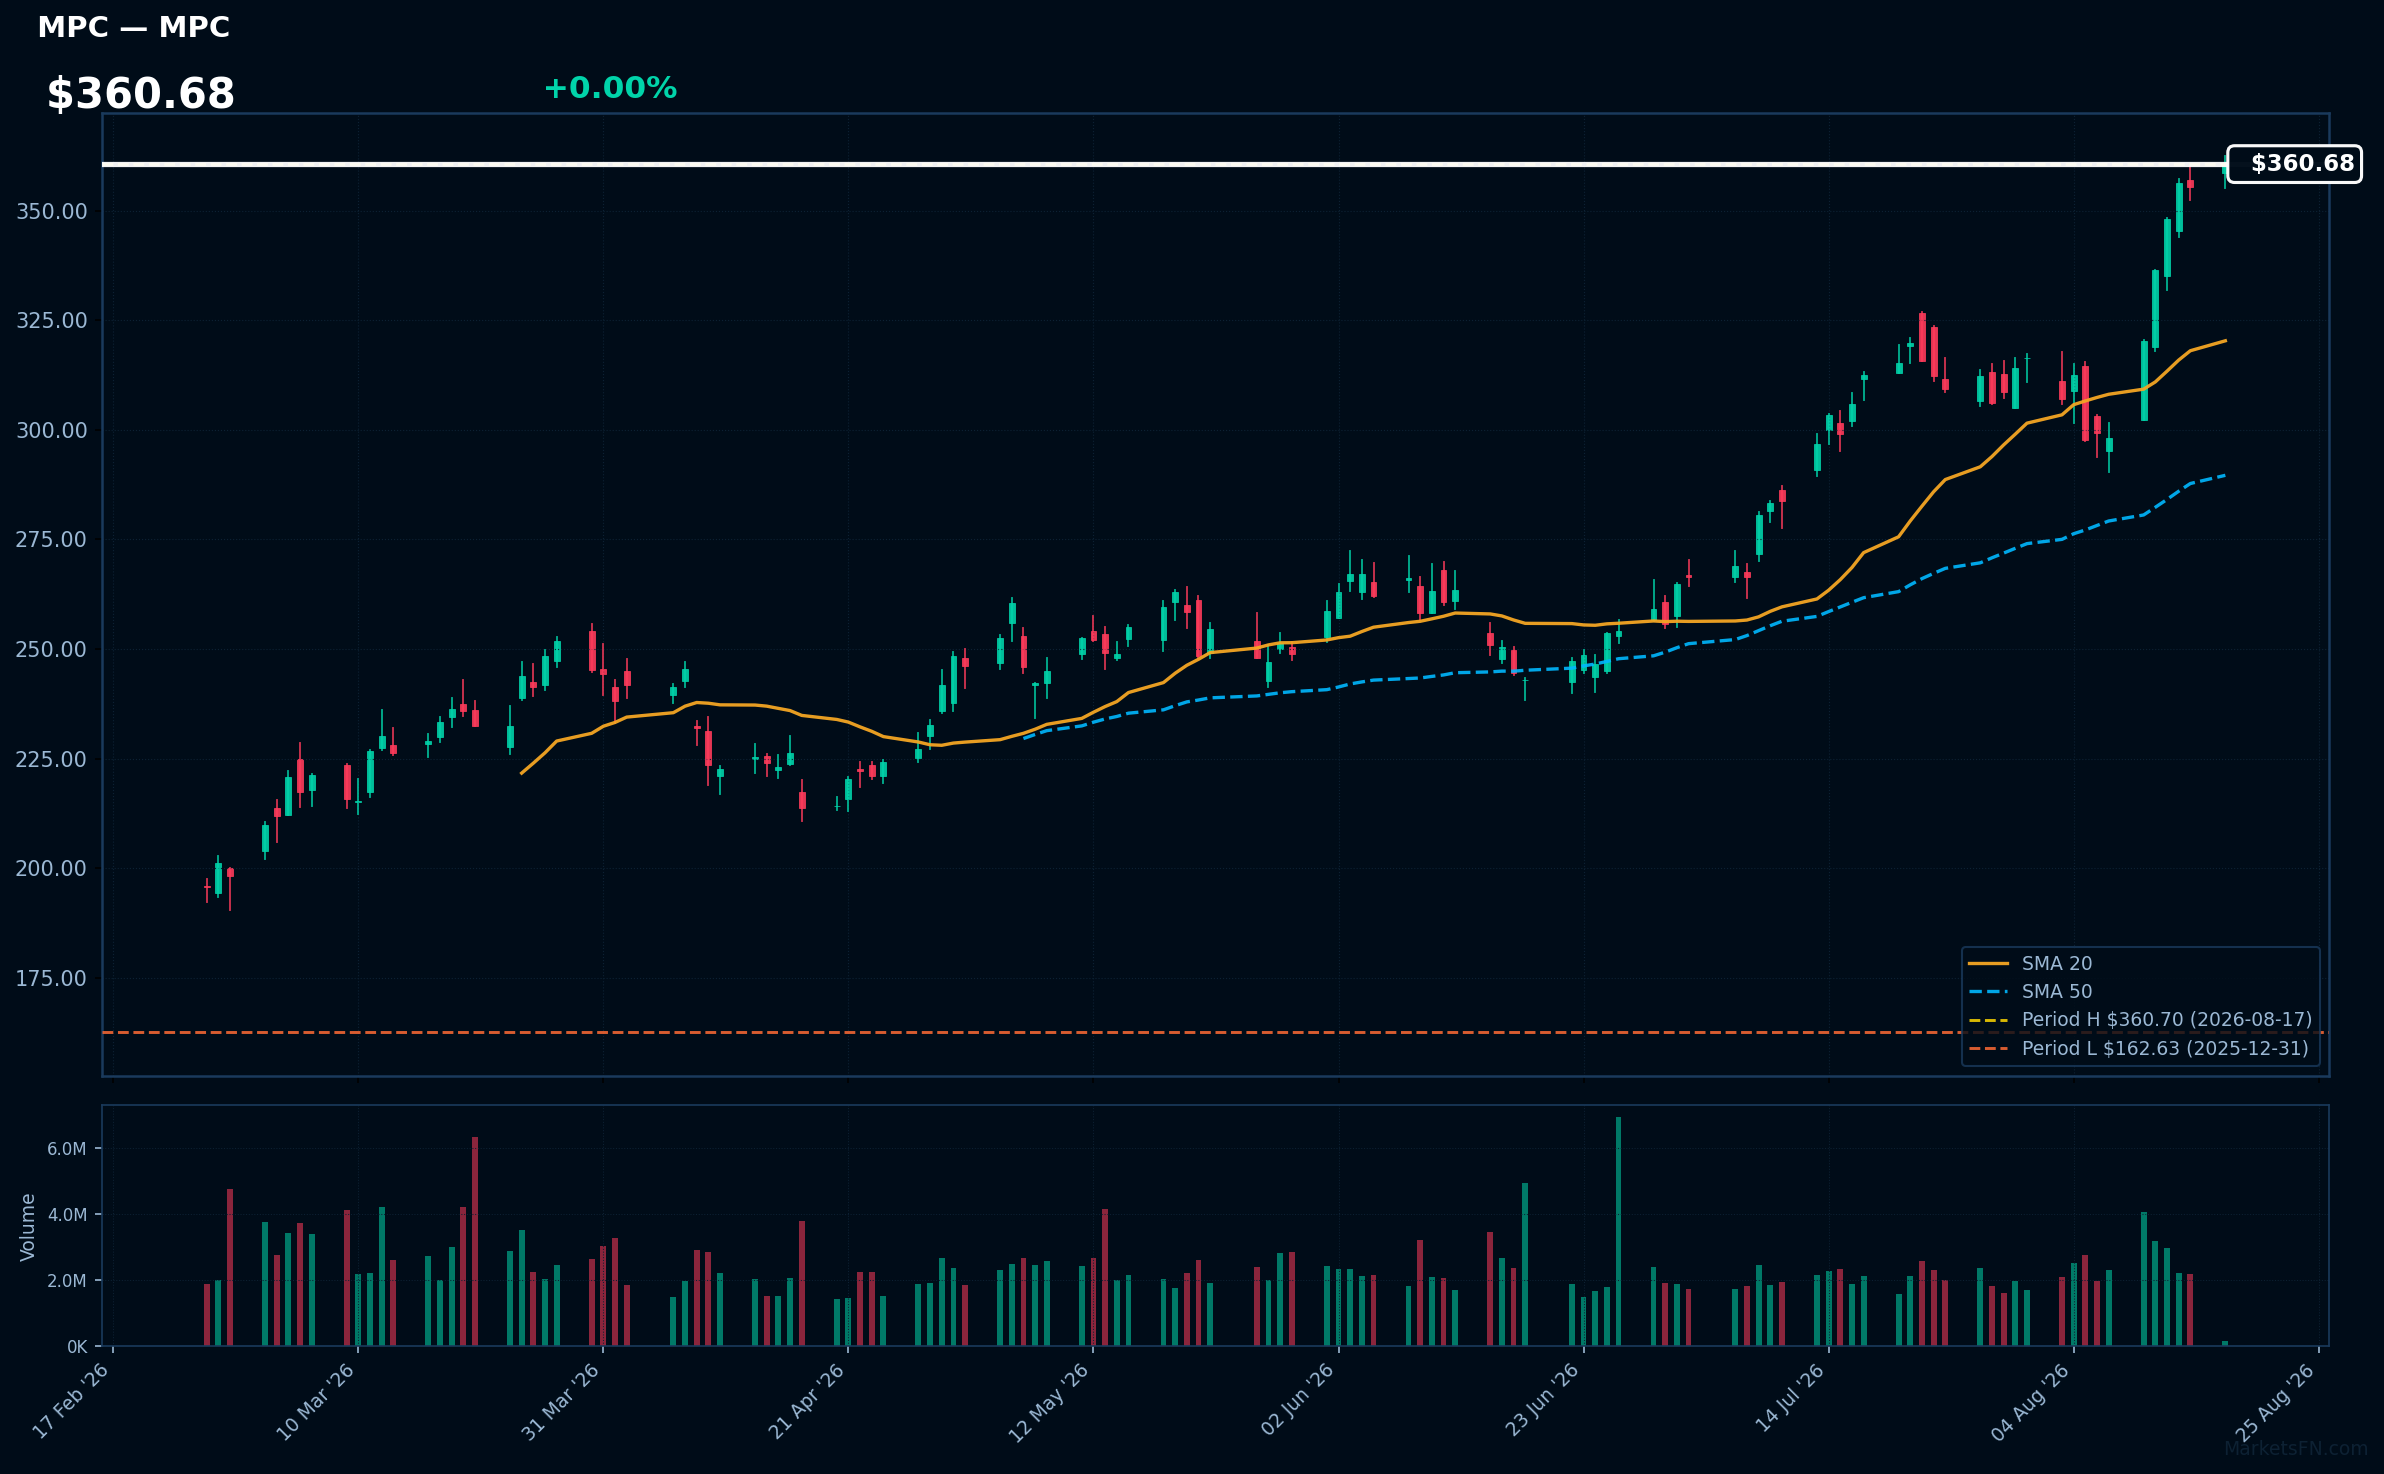
MPC | Marathon Petroleum Corp | Energy | Price Last: $360.70 | % Realized: +121.74% | RSI: 75.8 | % above MA200: +57.2% | Trend: Above MA20, MA50, MA200
Marathon Petroleum Corp (MPC) is a leading independent refiner and marketer of petroleum products, crucial for energy supply. Investors should care due to its significant role in the energy sector and robust performance metrics, including a 121.7% return over the past year.
The current technical situation indicates strong momentum, with an RSI(14) of 75.8 and a bullish MA alignment: price > MA20 > MA50 > MA200. The stock is also 0.0% below its 52-Week high, signaling a potential breakout.
Related headlines
- PSX, MPC Reportedly Weighed A Giant Merger What Sank The $180B Deal Between Phillips 66 And Marathon Petroleum
- MPC, PSX Stocks Hit All-Time Highs Whats Driving The Rally In These Energy Stocks?
- Marathon Petroleum Corp. stock outperforms competitors on strong trading day
- Marathon Petroleum Profit Quadruples on Higher Refining Margins
📉 Nearest to 52-Week Low
Sectors represented: Consumer Cyclical (2), Healthcare (1), Industrials (1), Communication Services (1)
| Ticker | Company | Sector | Price Last | % Realized | 52-Week Low Date | RSI | % above MA200 | Trend |
|---|---|---|---|---|---|---|---|---|
| NKE | Nike, Inc | Consumer Cyclical | $39.85 | -48.53% | 2026-08-17 | 38.6 | -24.9% | Below MA20, MA50, MA200 |
| ZTS | Zoetis Inc | Healthcare | $71.41 | -53.12% | 2026-08-17 | 40.1 | -33.0% | Below MA20, MA50, MA200 |
| ROL | Rollins, Inc | Consumer Cyclical | $36.12 | -36.72% | 2026-08-17 | 26.0 | -32.9% | Below MA20, MA50, MA200 |
| LII | Lennox International Inc | Industrials | $417.26 | -30.46% | 2026-07-31 | 31.5 | -17.3% | Below MA20, MA50, MA200 |
| EA | Electronic Arts, Inc | Communication Services | $209.70 | +0.38% | 2026-07-17 | — | — | — |
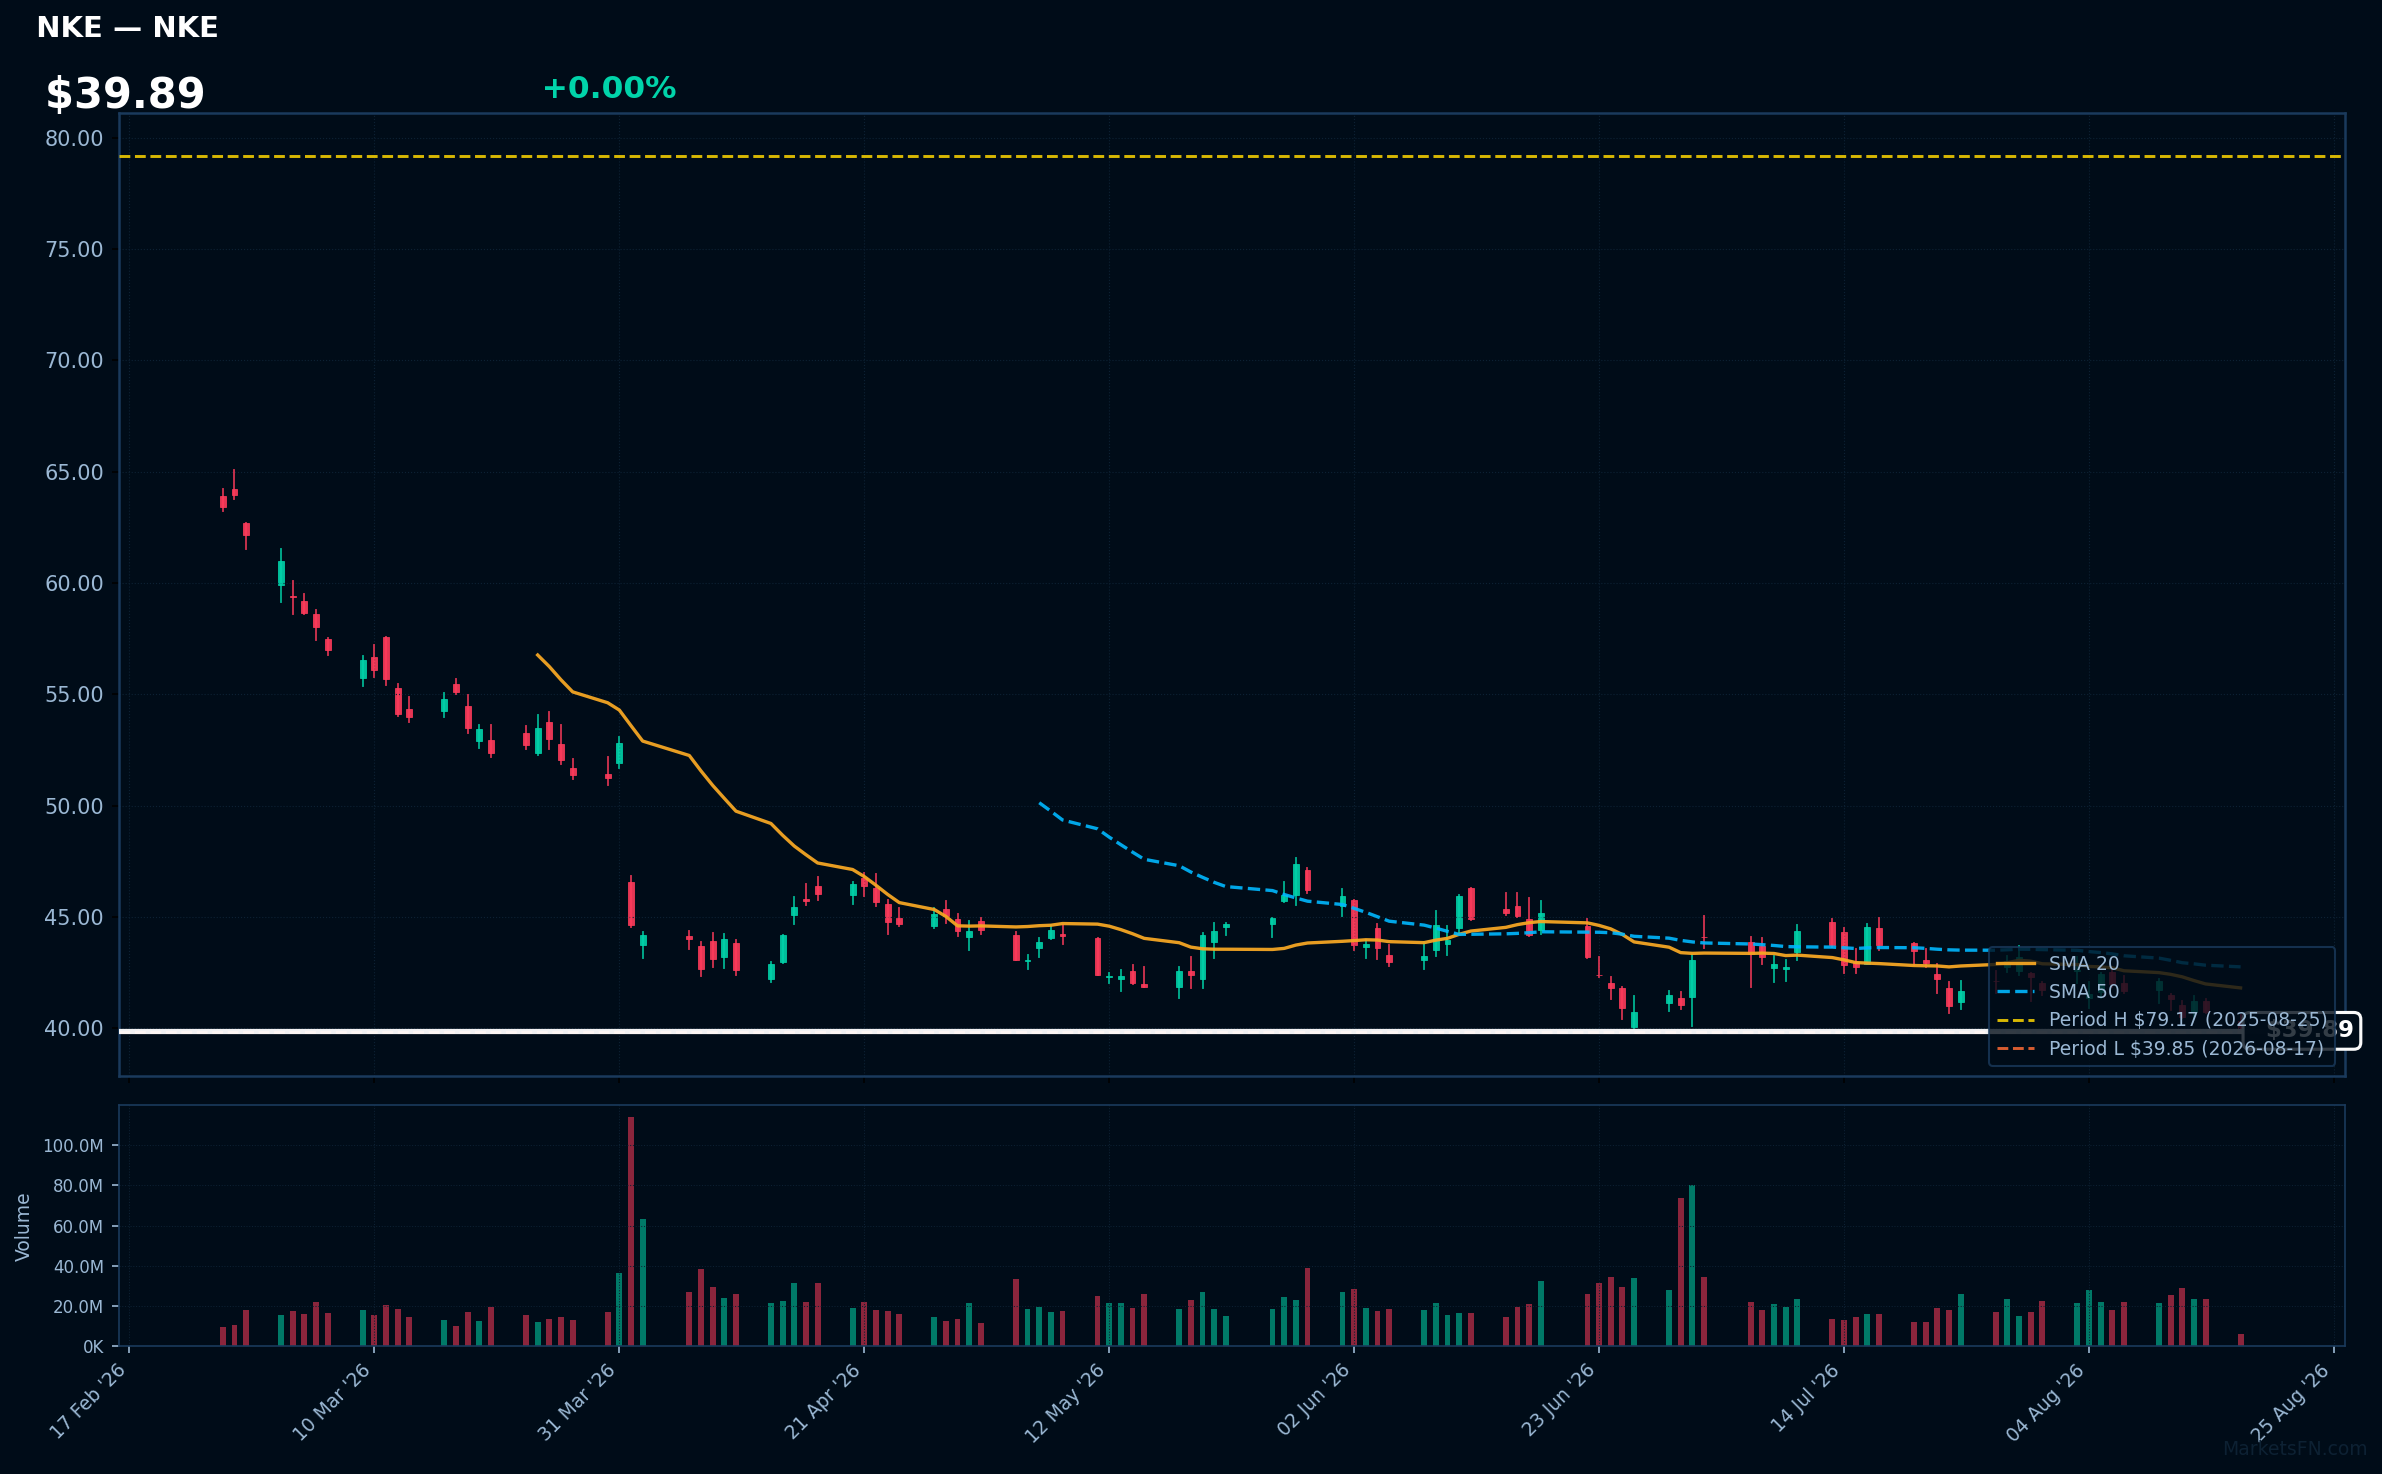
NKE | Nike, Inc | Consumer Cyclical | Price Last: $39.85 | % Realized: -48.53% | RSI: 38.6 | % above MA200: -24.9% | Trend: Below MA20, MA50, MA200
Nike, Inc. designs, develops, and markets athletic footwear, apparel, and equipment. Investors should care due to its strong brand presence and innovation in sportswear, which can drive consumer demand and market share in a competitive landscape.
The current technical situation indicates a bearish trend, with an RSI of 38.6 and a MA alignment of price < MA20 < MA50 < MA200, suggesting sustained downtrend and potential warning signs for investors.
Related headlines
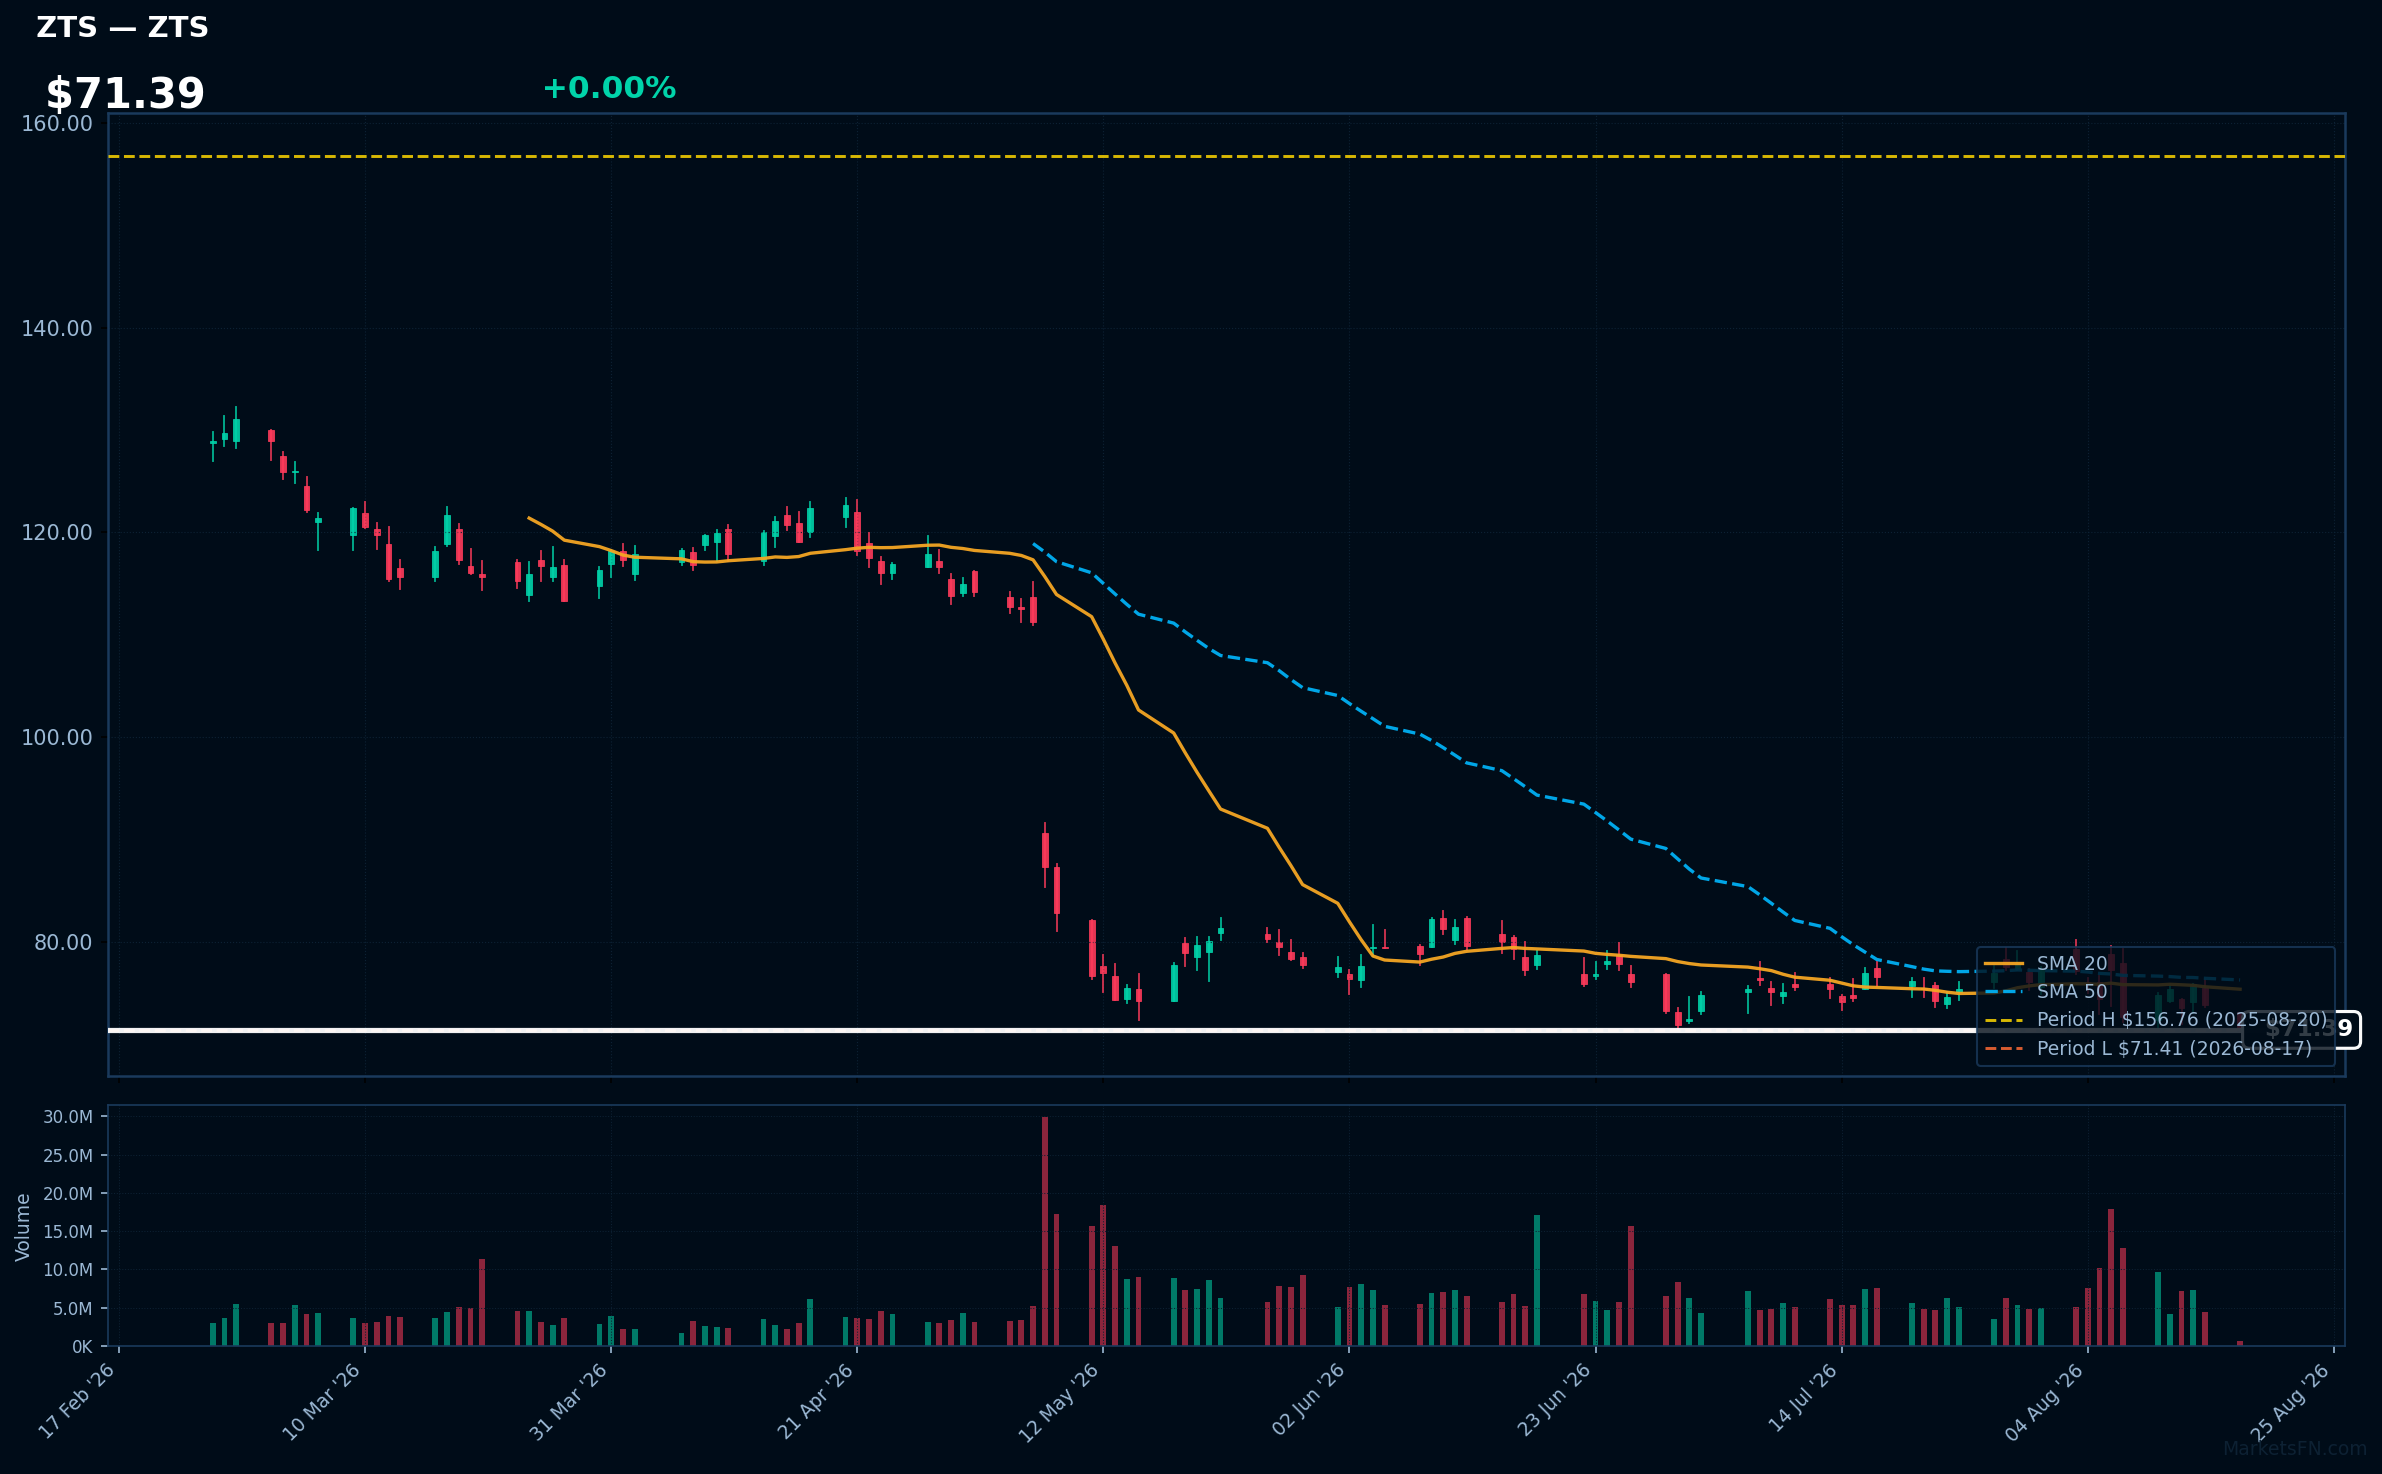
ZTS | Zoetis Inc | Healthcare | Price Last: $71.41 | % Realized: -53.12% | RSI: 40.1 | % above MA200: -33.0% | Trend: Below MA20, MA50, MA200
Zoetis Inc (ZTS) specializes in animal health products, including vaccines and medicines for livestock and pets. Investors should care due to its critical role in the agricultural supply chain and the growing demand for animal health solutions globally.
The current technical situation indicates a bearish trend, with an RSI of 40.1 and a MA alignment of price < MA20 < MA50 < MA200, suggesting sustained downtrend and testing major support just 0.0% above its 52-Week low.
Related headlines
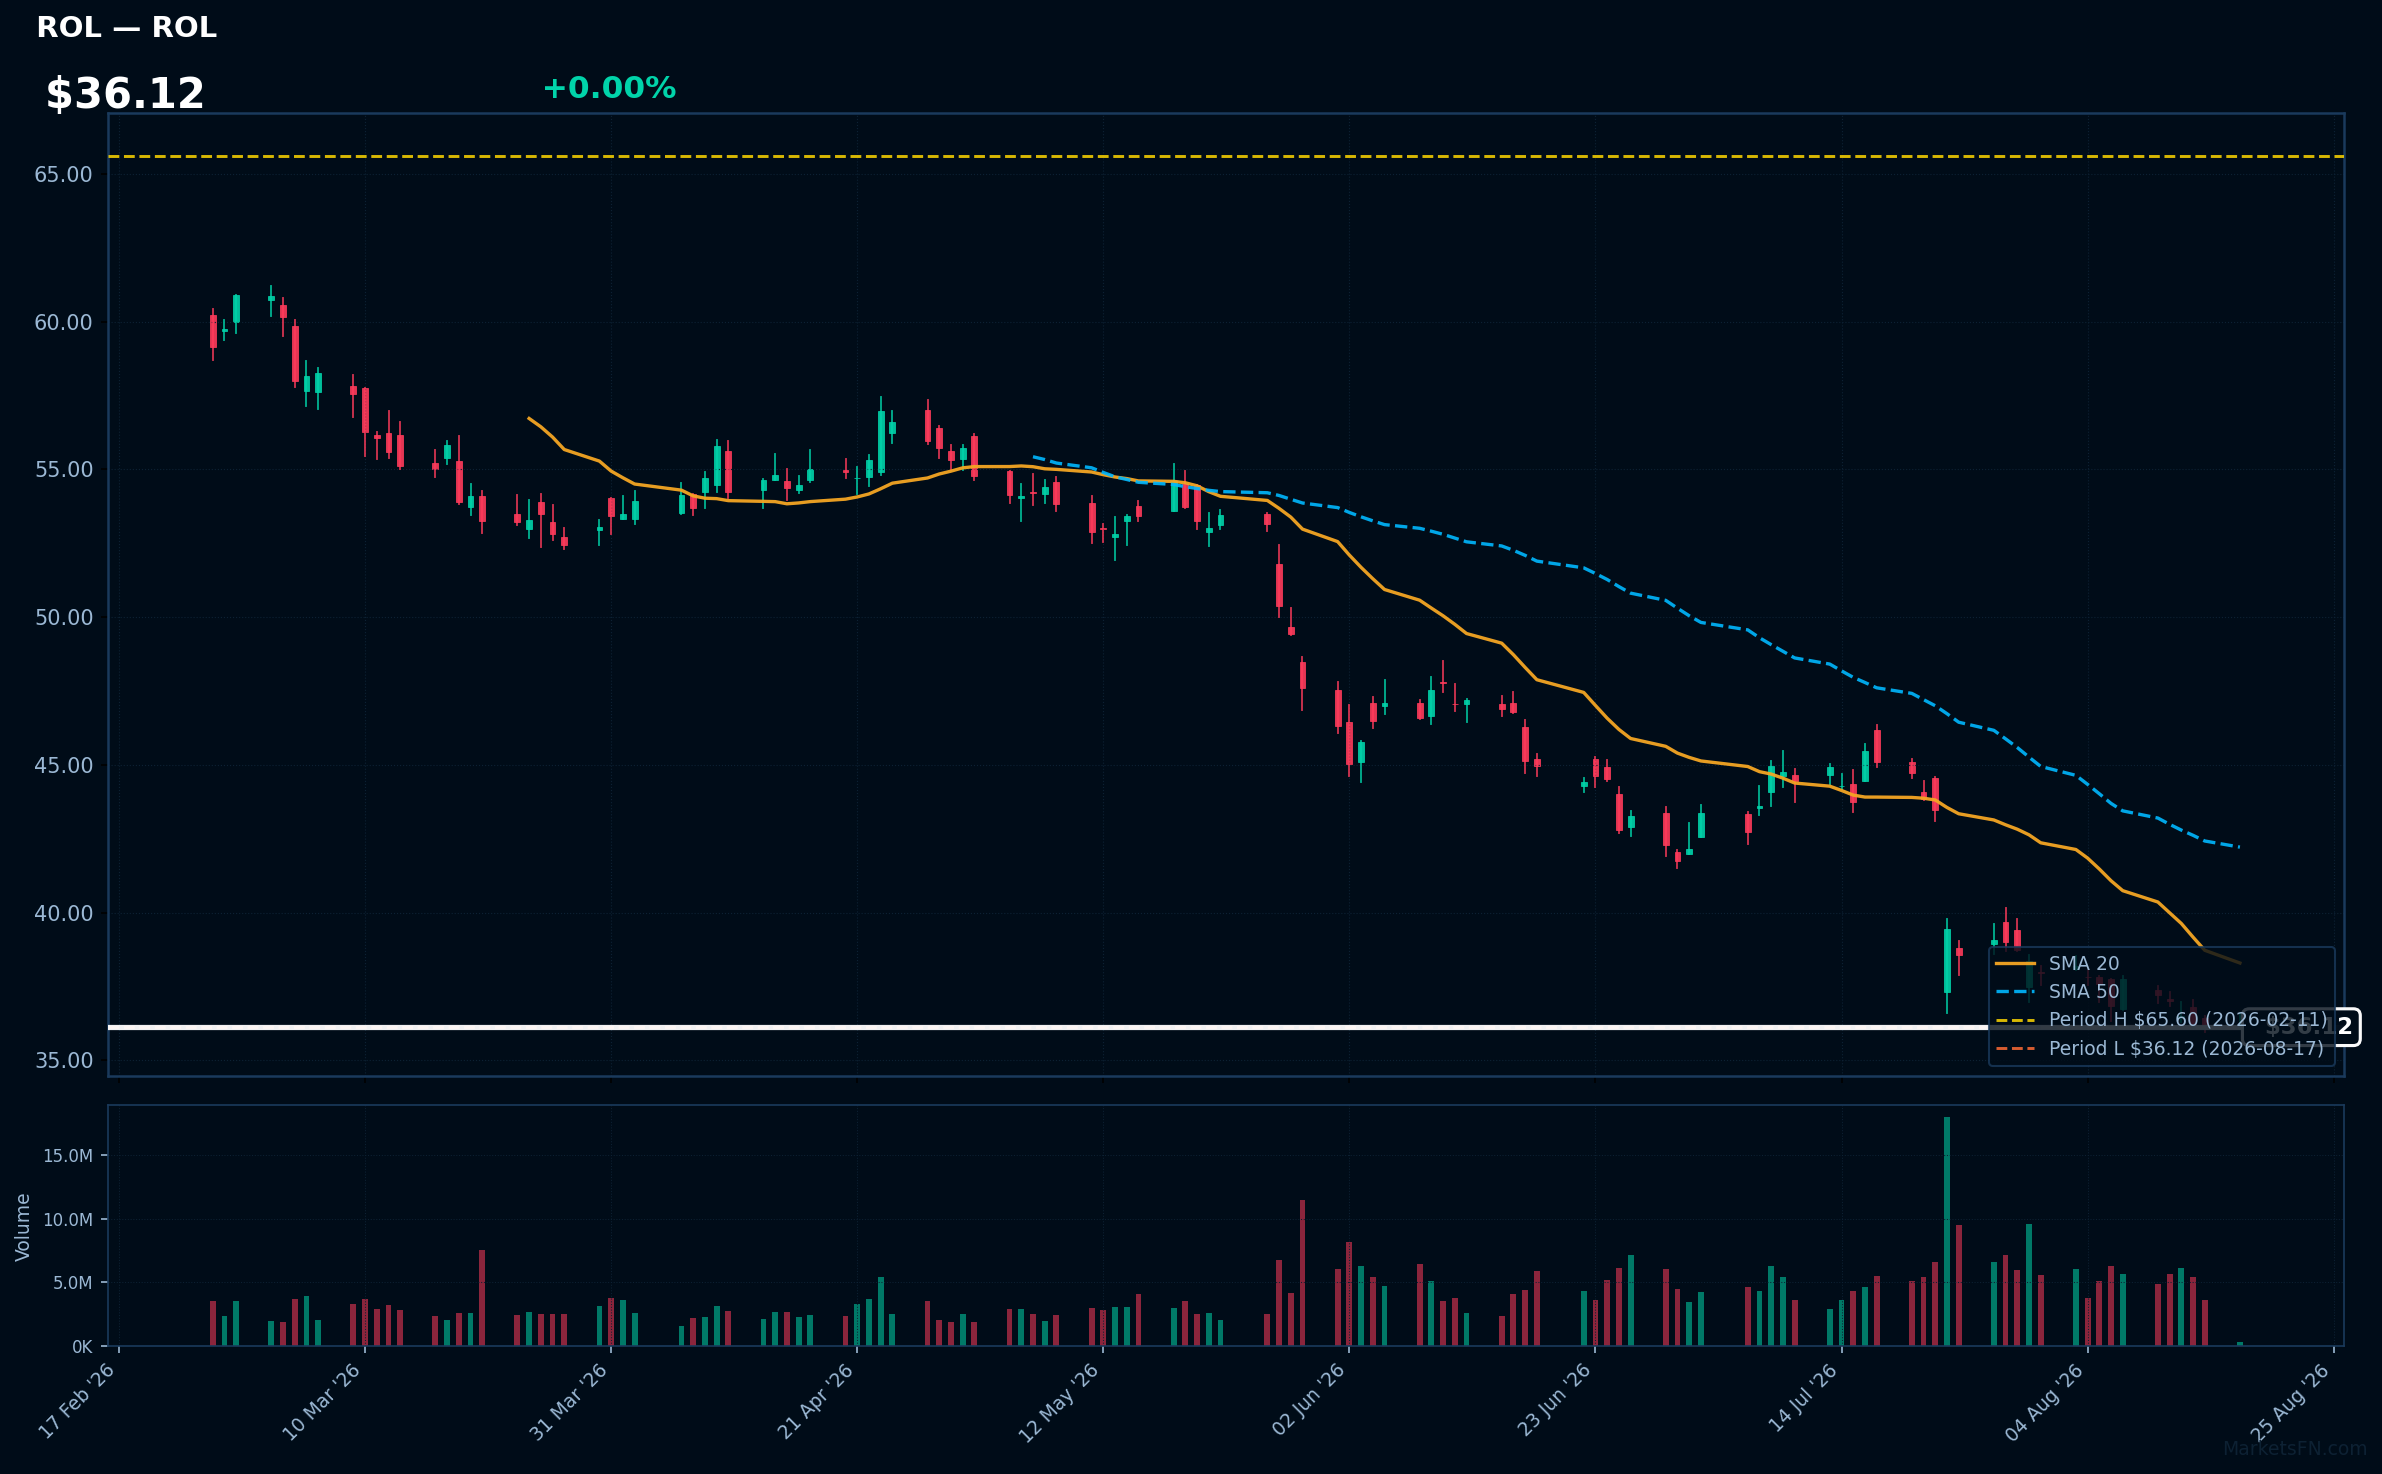
ROL | Rollins, Inc | Consumer Cyclical | Price Last: $36.12 | % Realized: -36.72% | RSI: 26.0 | % above MA200: -32.9% | Trend: Below MA20, MA50, MA200
Rollins, Inc. provides pest control services and products, operating through subsidiaries like Orkin. Investors should care due to its significant market presence and potential for growth in the pest management industry, especially as demand for these services remains steady.
The current technical situation indicates a warning sign, with an RSI(14) of 26.0 and a bearish MA alignment: price < MA20 < MA50 < MA200, indicating a sustained downtrend.
Related headlines
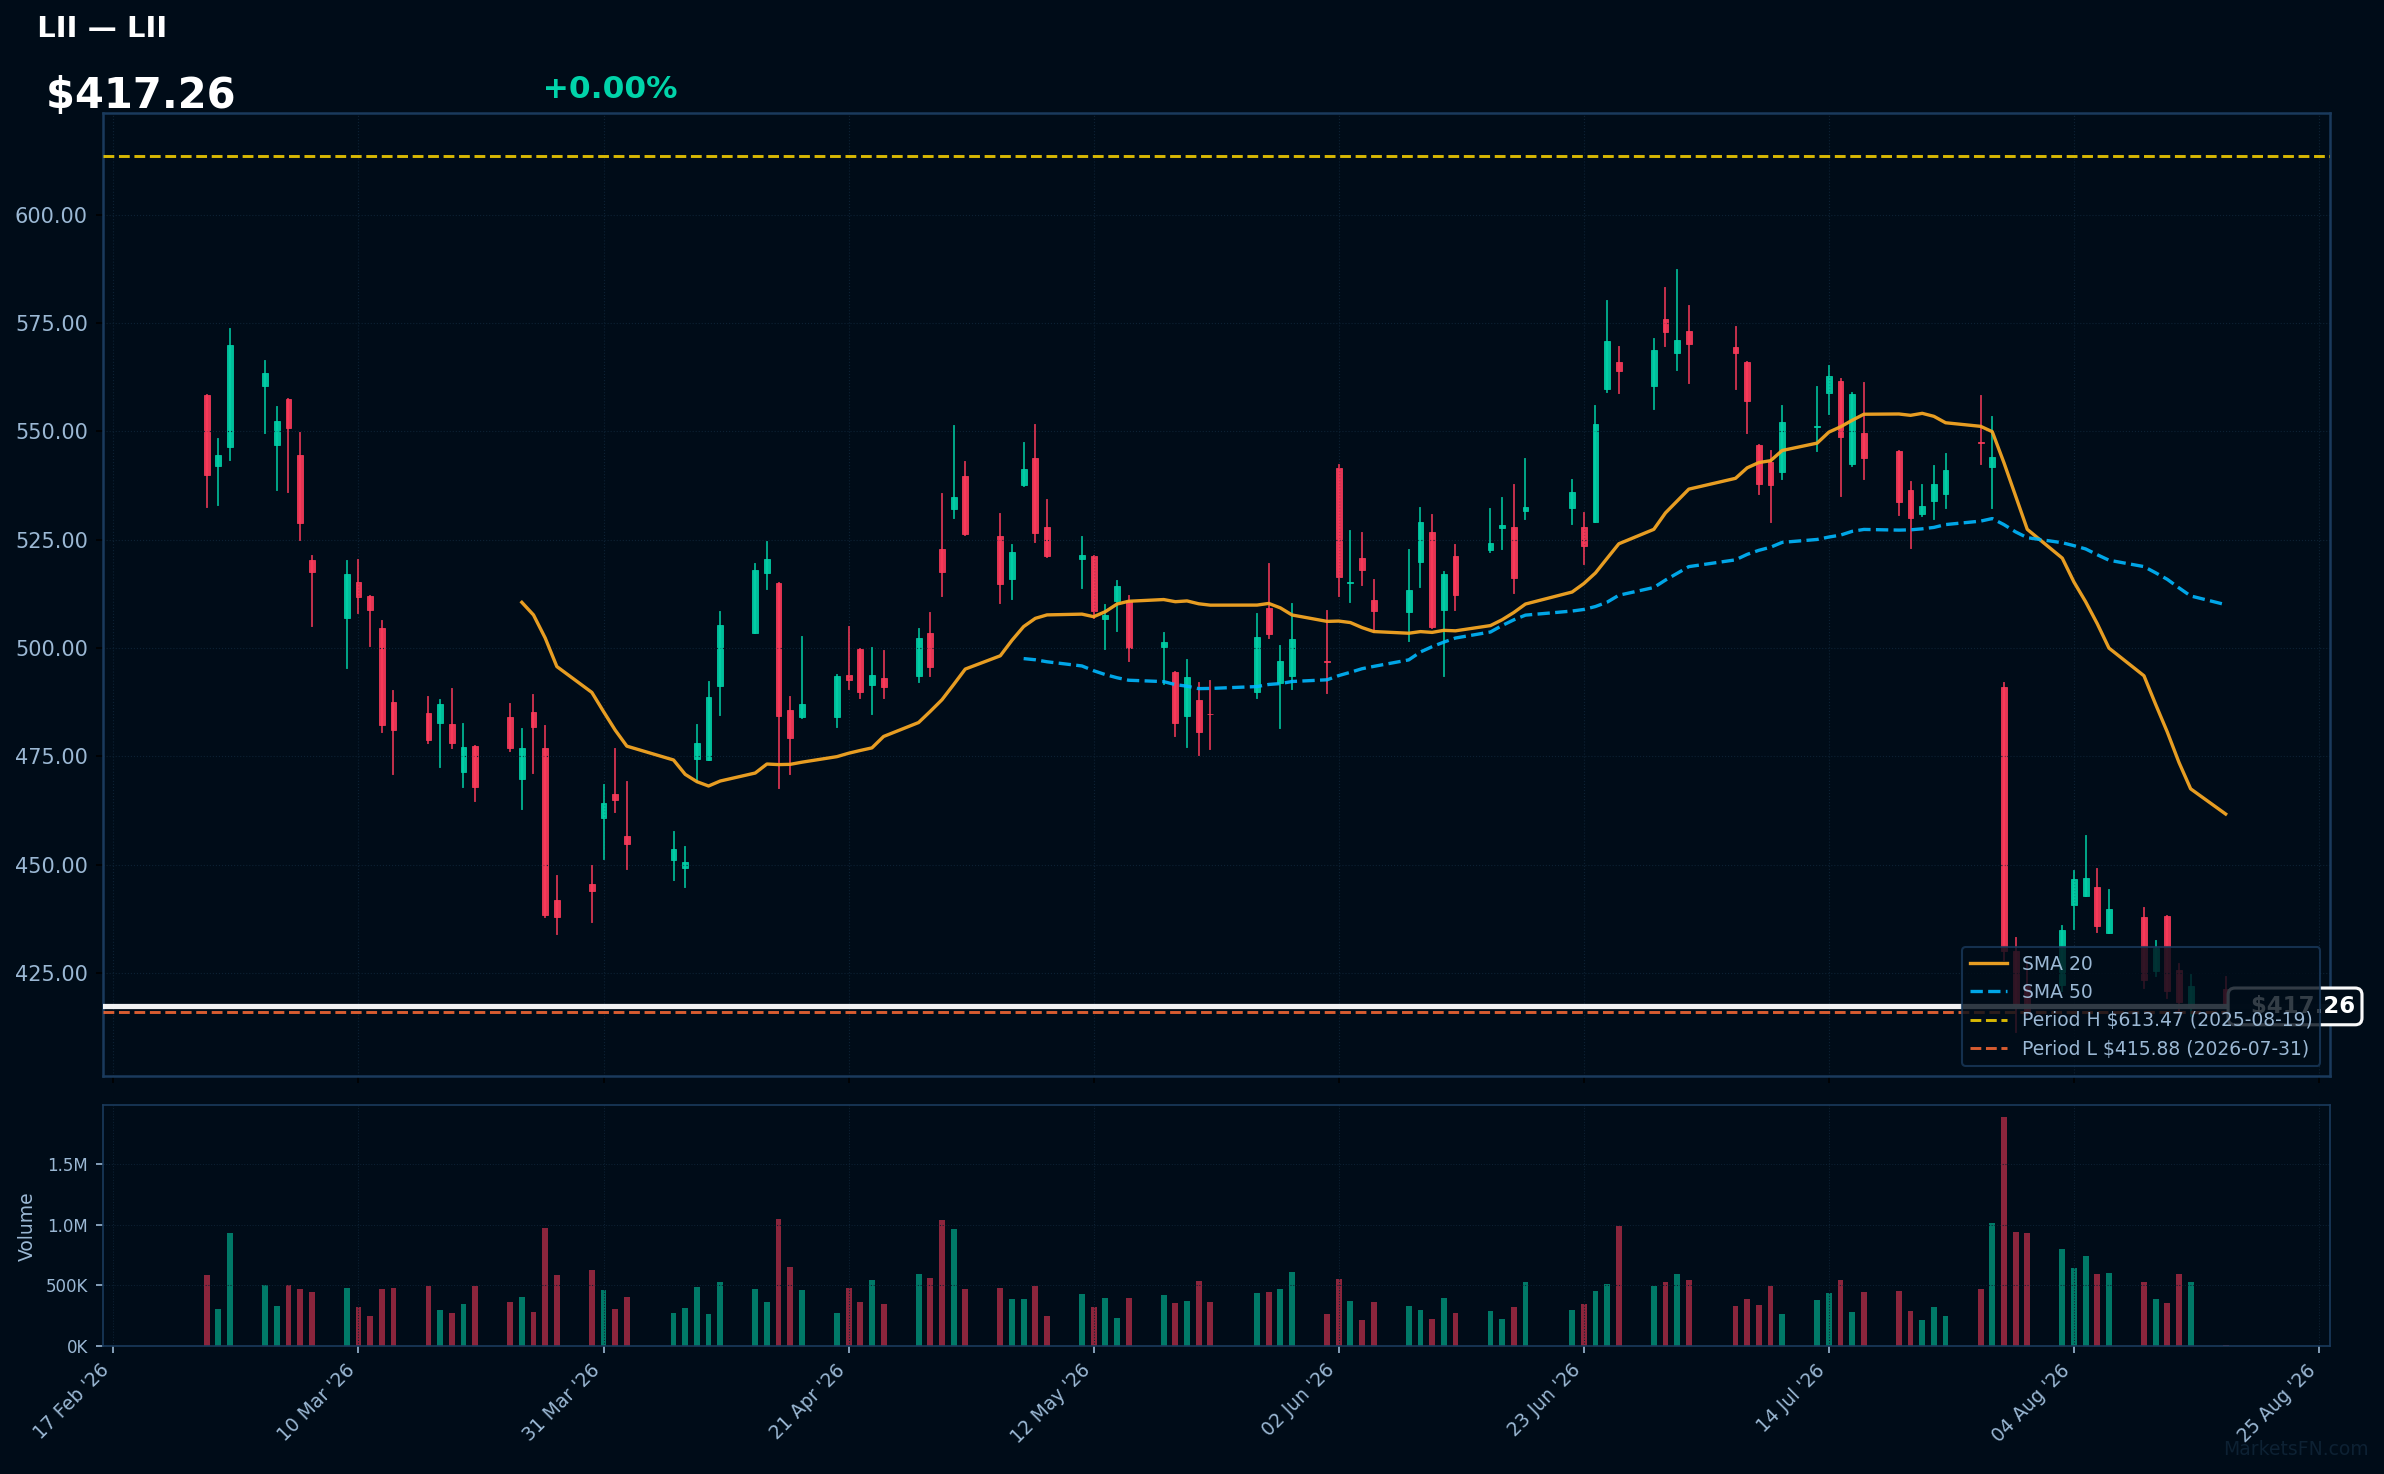
LII | Lennox International Inc | Industrials | Price Last: $417.26 | % Realized: -30.46% | RSI: 31.5 | % above MA200: -17.3% | Trend: Below MA20, MA50, MA200
Lennox International Inc (LII) specializes in manufacturing and selling heating, ventilation, and air conditioning (HVAC) systems. Investors should care due to its significant role in the energy-efficient solutions market, which is increasingly vital amid rising energy costs and climate concerns.
The current technical situation shows mixed signals with an RSI(14) of 31.5, indicating potential oversold conditions. The stock is below MA20/MA50/MA200 and is only 0.3% above its 52-Week low, testing major support.
Related headlines
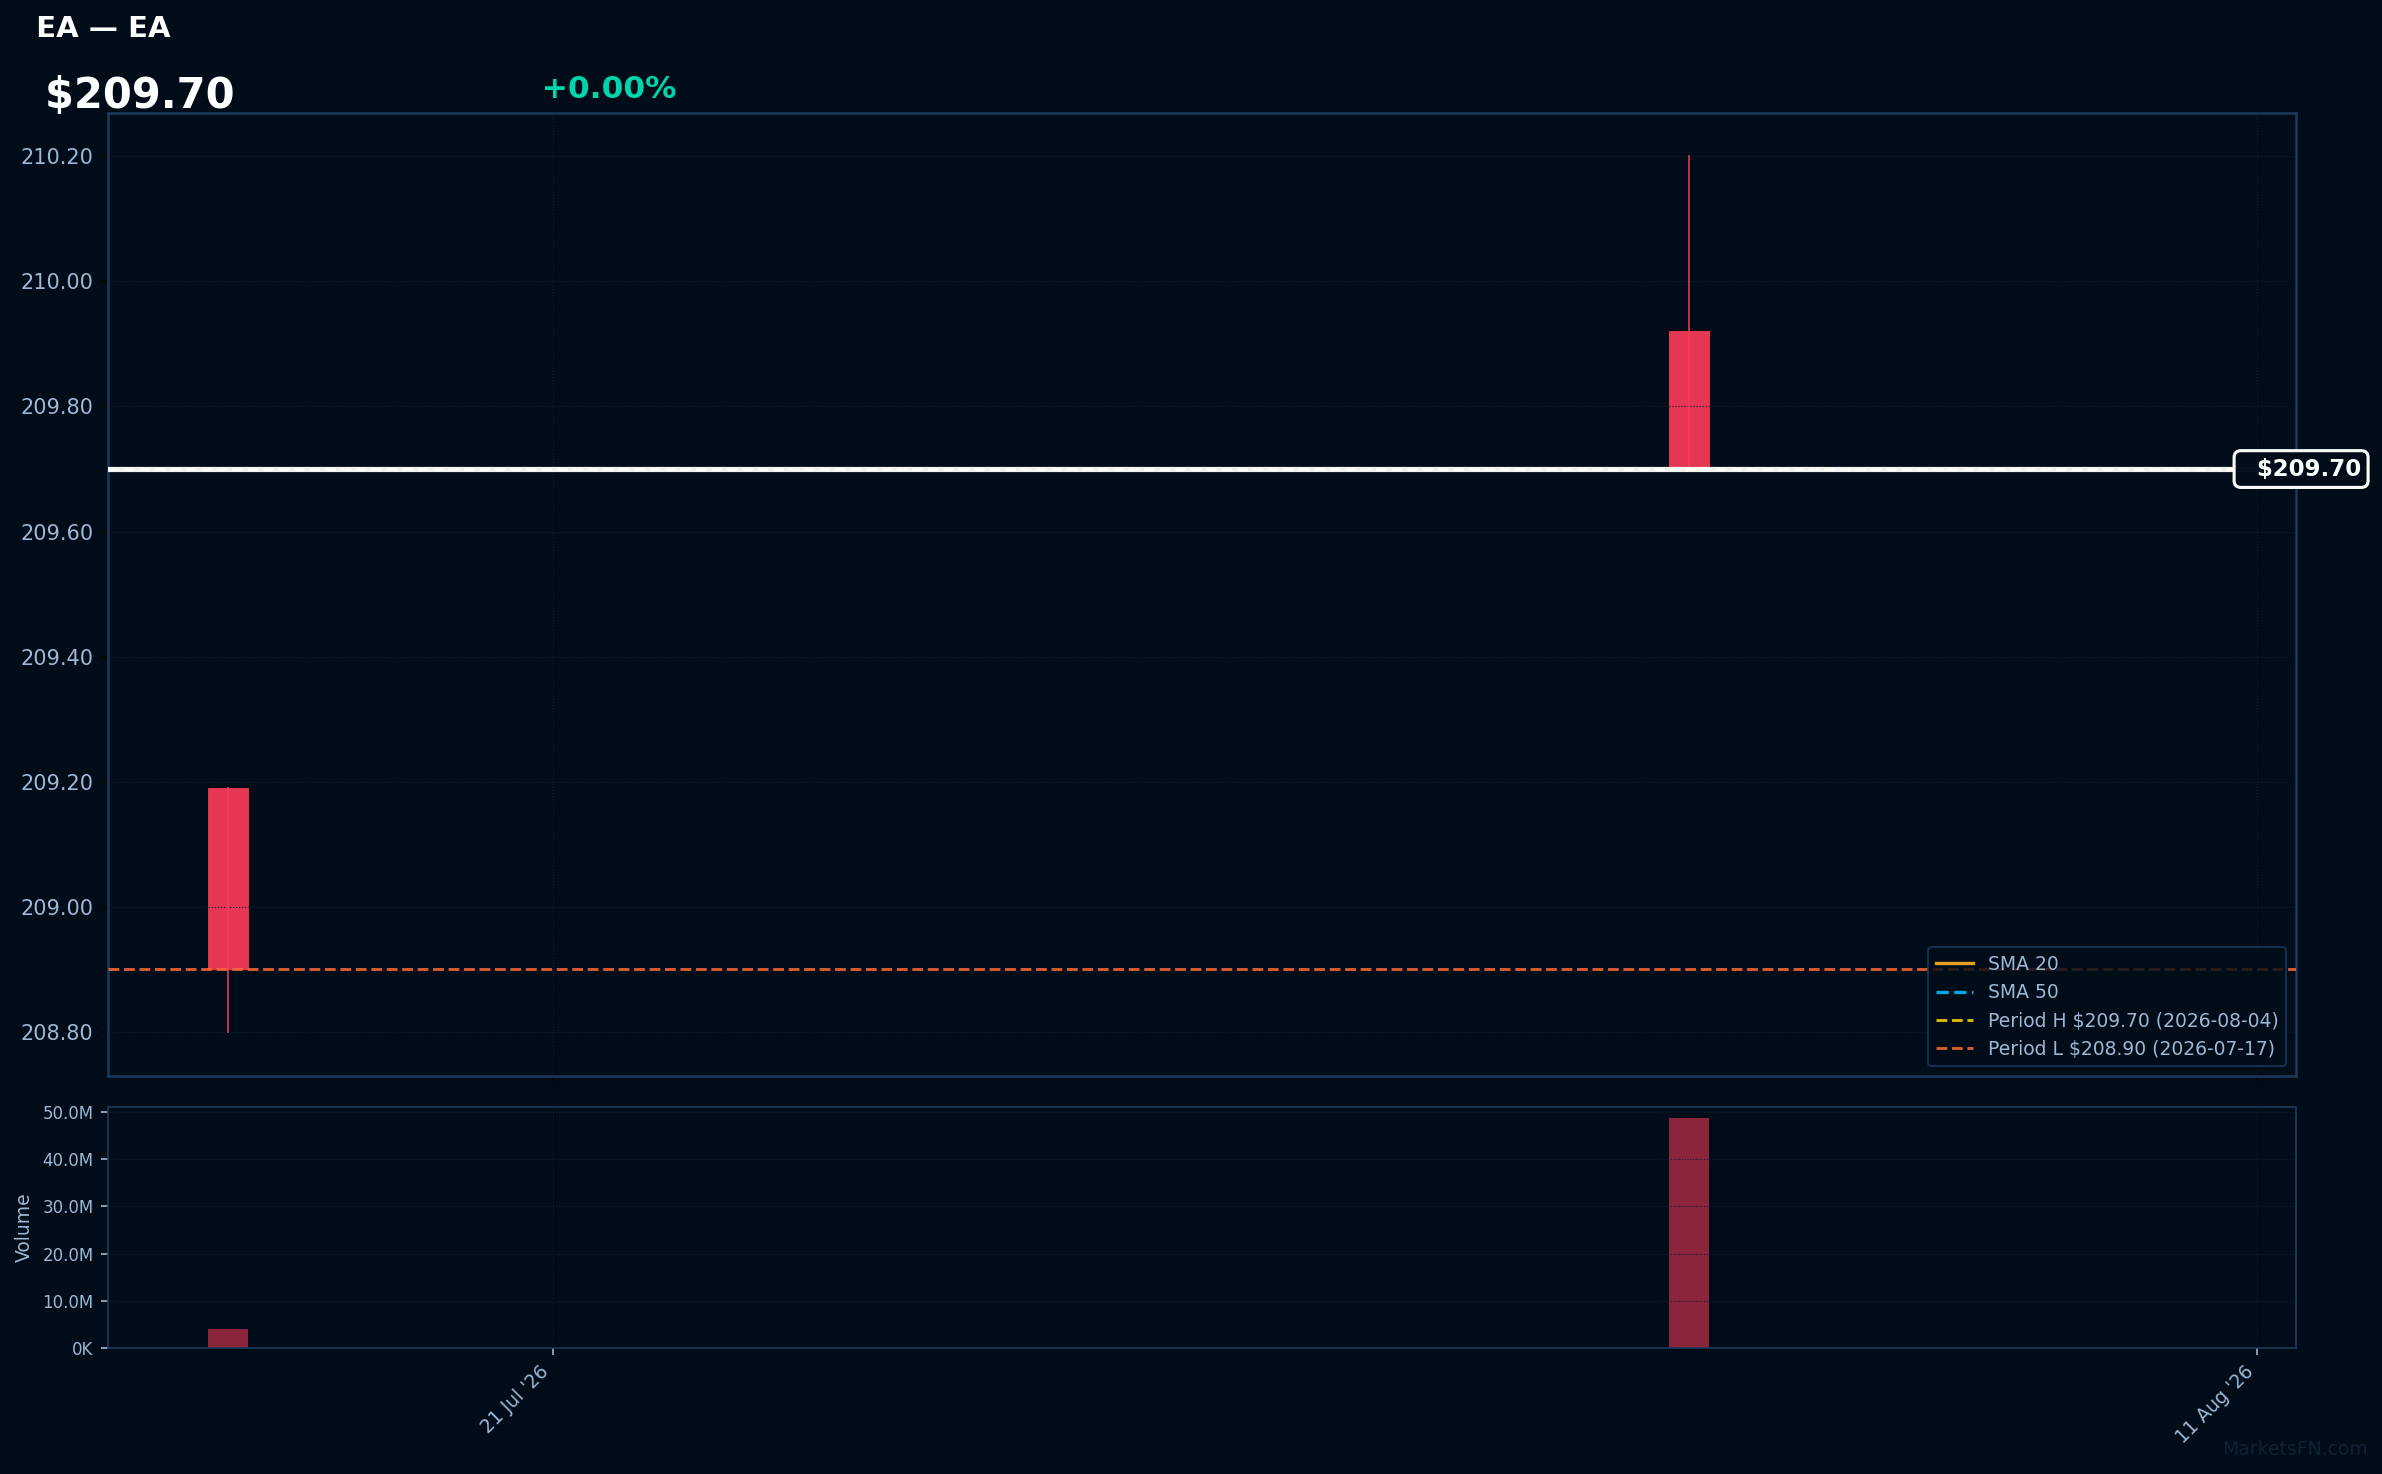
EA | Electronic Arts, Inc | Communication Services | Price Last: $209.70 | % Realized: +0.38% | RSI: — | % above MA200: — | Trend: —
Electronic Arts, Inc. develops and publishes interactive software, primarily in the gaming industry. Investors should care due to its strong portfolio of franchises, including FIFA and Madden, which drive consistent revenue and engagement in a growing market.
Currently, EA is 0.0% below its 52-Week high, indicating potential momentum. However, RSI(14) is N/A and MA data is incomplete, limiting technical analysis.
Market Commentary
The presence of S&P 500 stocks near 52-week extremes indicates significant market sentiment and investor behavior. Stocks like Bank Of America Corp (BAC), PNC Financial Services Group Inc (PNC), and others are at their 52-week highs, suggesting strong bullish momentum and confidence in their performance. Conversely, stocks such as Nike, Inc (NKE) and Zoetis Inc (ZTS) hovering near their 52-week lows may reflect underlying challenges or sector-specific headwinds that investors are currently grappling with.
Sector rotation is likely influencing these price levels, with financials showing resilience as interest rates remain a focal point for investors. The stability in financial stocks like U.S. Bancorp (USB) and Marathon Petroleum Corp (MPC) may be attributed to macroeconomic themes such as inflation and energy prices. In contrast, consumer discretionary stocks like Nike may be facing pressures from changing consumer behavior and economic uncertainty.
Key levels to watch include the 52-week highs for the aforementioned financial stocks, which could serve as resistance points if momentum falters. For those near their lows, such as Electronic Arts, Inc (EA), a break below these levels could signal further declines. Potential catalysts include upcoming earnings reports and economic data releases that could sway investor sentiment and impact these critical price levels.
Methodology: All 503 S&P 500 constituents screened. 52-week high = highest daily close over the past 252 trading days (approx. 1 year). 52-week low = lowest daily close over the same period. Distance = (current price / extreme − 1) × 100. Technical indicators computed on up to 1 year of daily OHLCV data.
Disclaimer: For informational purposes only. Not investment advice. Past performance is not indicative of future results.

