S&P 500 52-Week Highs & Lows Radar: Bristol-Myers Squibb (BMY), Rollins, (ROL) and more
MarketsFN Team

S&P 500 52-Week Highs & Lows Radar: Bristol-Myers Squibb (BMY), Rollins, (ROL) and more
Screening all 503 S&P 500 constituents for stocks nearest to their 52-week high and their 52-week low. Data as of July 30, 2026. % Realized = 52-week total return.
Legend: RSI > 70 = overbought · RSI < 30 = oversold · Green % Realized = positive 52W return · Red = negative.
📈 Nearest to 52-Week High
Sectors represented: Healthcare (3), Industrials (1), Financial (1)
| Ticker | Company | Sector | Price Last | % Realized | 52-Week High Date | RSI | % above MA200 | Trend |
|---|---|---|---|---|---|---|---|---|
| BMY | Bristol-Myers Squibb Co | Healthcare | $64.50 | +40.27% | 2026-07-30 | 69.8 | +16.3% | Above MA20, MA50, MA200 |
| BAX | Baxter International Inc | Healthcare | $28.72 | +2.39% | 2026-07-30 | 80.4 | +46.8% | Above MA20, MA50, MA200 |
| IEX | Idex Corporation | Industrials | $237.74 | +44.71% | 2026-07-30 | 71.2 | +20.5% | Above MA20, MA50, MA200 |
| TECH | Bio-Techne Corp | Healthcare | $72.09 | +24.92% | 2026-07-17 | 74.5 | +21.0% | Above MA20, MA50, MA200 |
| PFG | Principal Financial Group Inc | Financial | $113.93 | +48.75% | 2026-07-28 | 59.3 | +20.2% | Above MA20, MA50, MA200 |
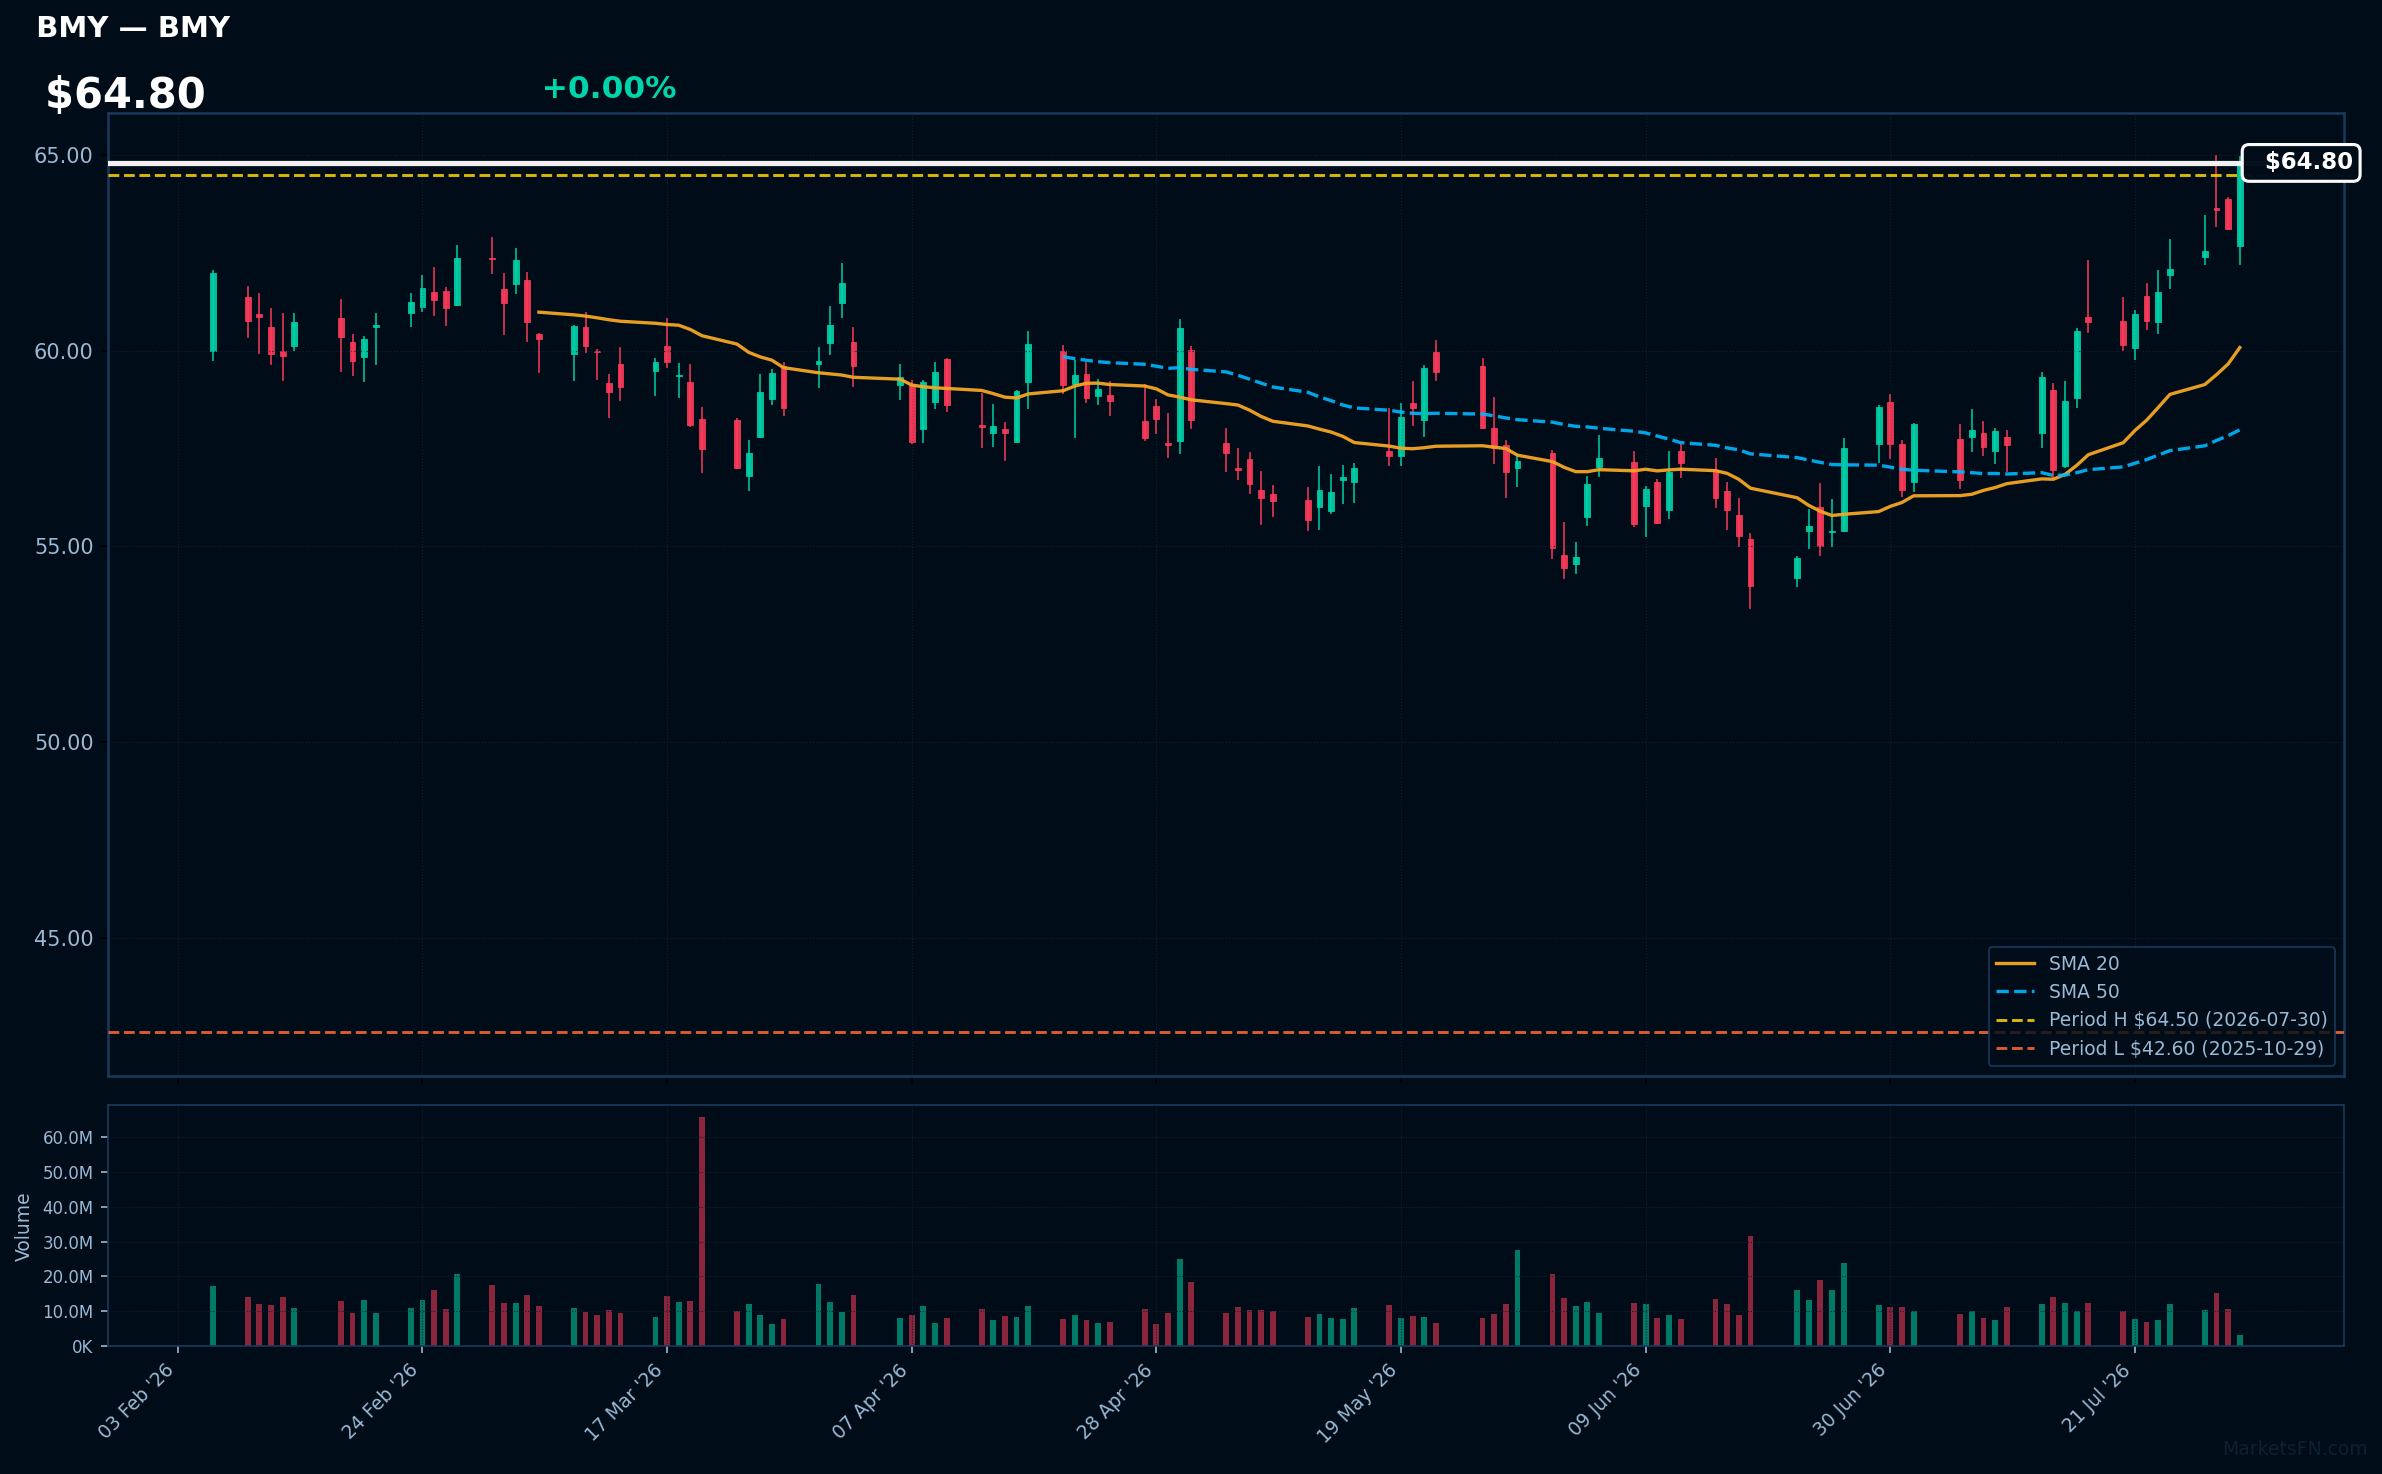
BMY | Bristol-Myers Squibb Co | Healthcare | Price Last: $64.50 | % Realized: +40.27% | RSI: 69.8 | % above MA200: +16.3% | Trend: Above MA20, MA50, MA200
Bristol-Myers Squibb Co is a biopharmaceutical company that develops and markets drugs for various therapeutic areas. Investors should care about its pipeline and approvals, such as for cancer and autoimmune diseases, which drive revenue growth.
The stock shows bullish MA alignment with price > MA20 > MA50 > MA200, RSI(14) at 69.8, near its 52-Week high, indicating strong momentum; however, an RSI near 70 may signal overbought conditions.
Related headlines
- Bristol-Myers Squibb raises annual outlook as Q2 tops estimates; shares up
- SLS Stock Snaps 2-Day Slide: Sellas SLS009 AML Trial Spotlights Big Pharma Drug Combo From ABBV, RHHBY And BMY
- Bristol Myers Squibb Wins EU Green Light for Opdivo-Based Hodgkin Lymphoma Treatment (BMY)
- SMMT Stock Surges Overnight: Cancer Drug Survival Win Raises The Bar As PFE, BMY, MRK Chase Keytruda's Successor
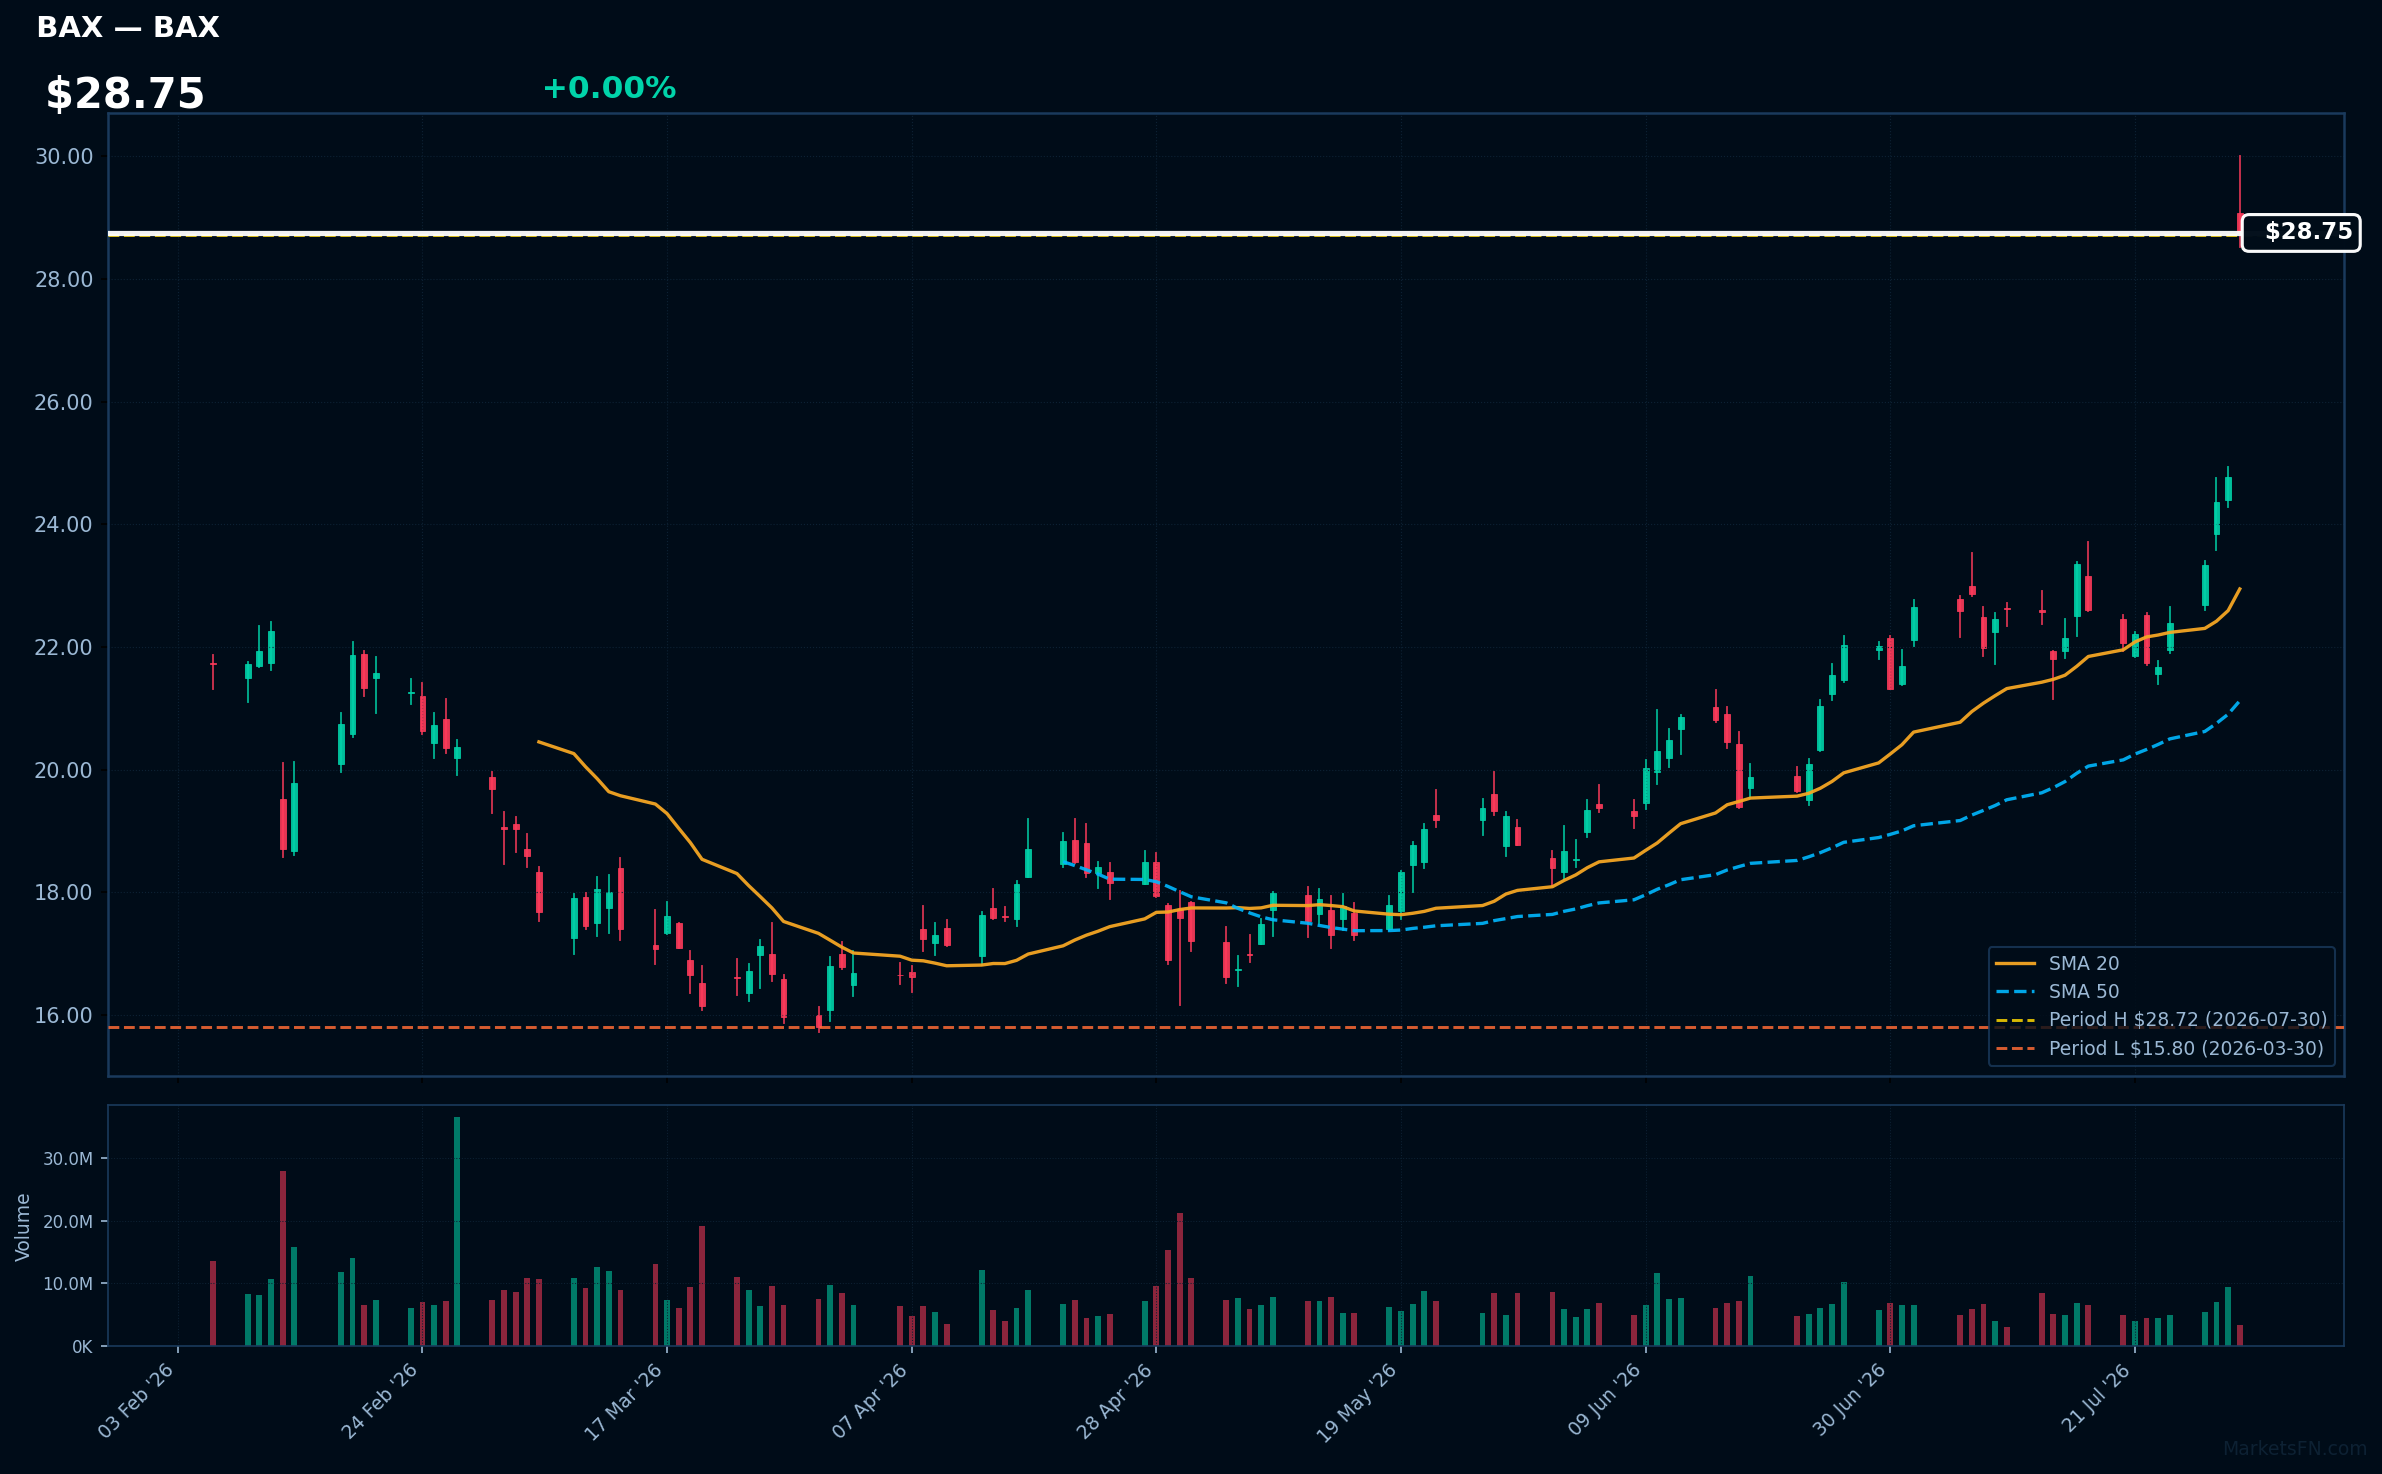
BAX | Baxter International Inc | Healthcare | Price Last: $28.72 | % Realized: +2.39% | RSI: 80.4 | % above MA200: +46.8% | Trend: Above MA20, MA50, MA200
Baxter International Inc is a medical technology company that develops and markets products for renal care, medication delivery, surgical care, and patient monitoring. Investors should care about its pipeline and product demand, particularly in critical care segments.
BAX is in a sustained uptrend with price > MA20 > MA50 > MA200, RSI(14) at 80.4, indicating strong momentum. Its proximity to the 52-Week high (0.0% below) suggests a potential breakout, but the high RSI may be a warning sign of overbought conditions.
Related headlines
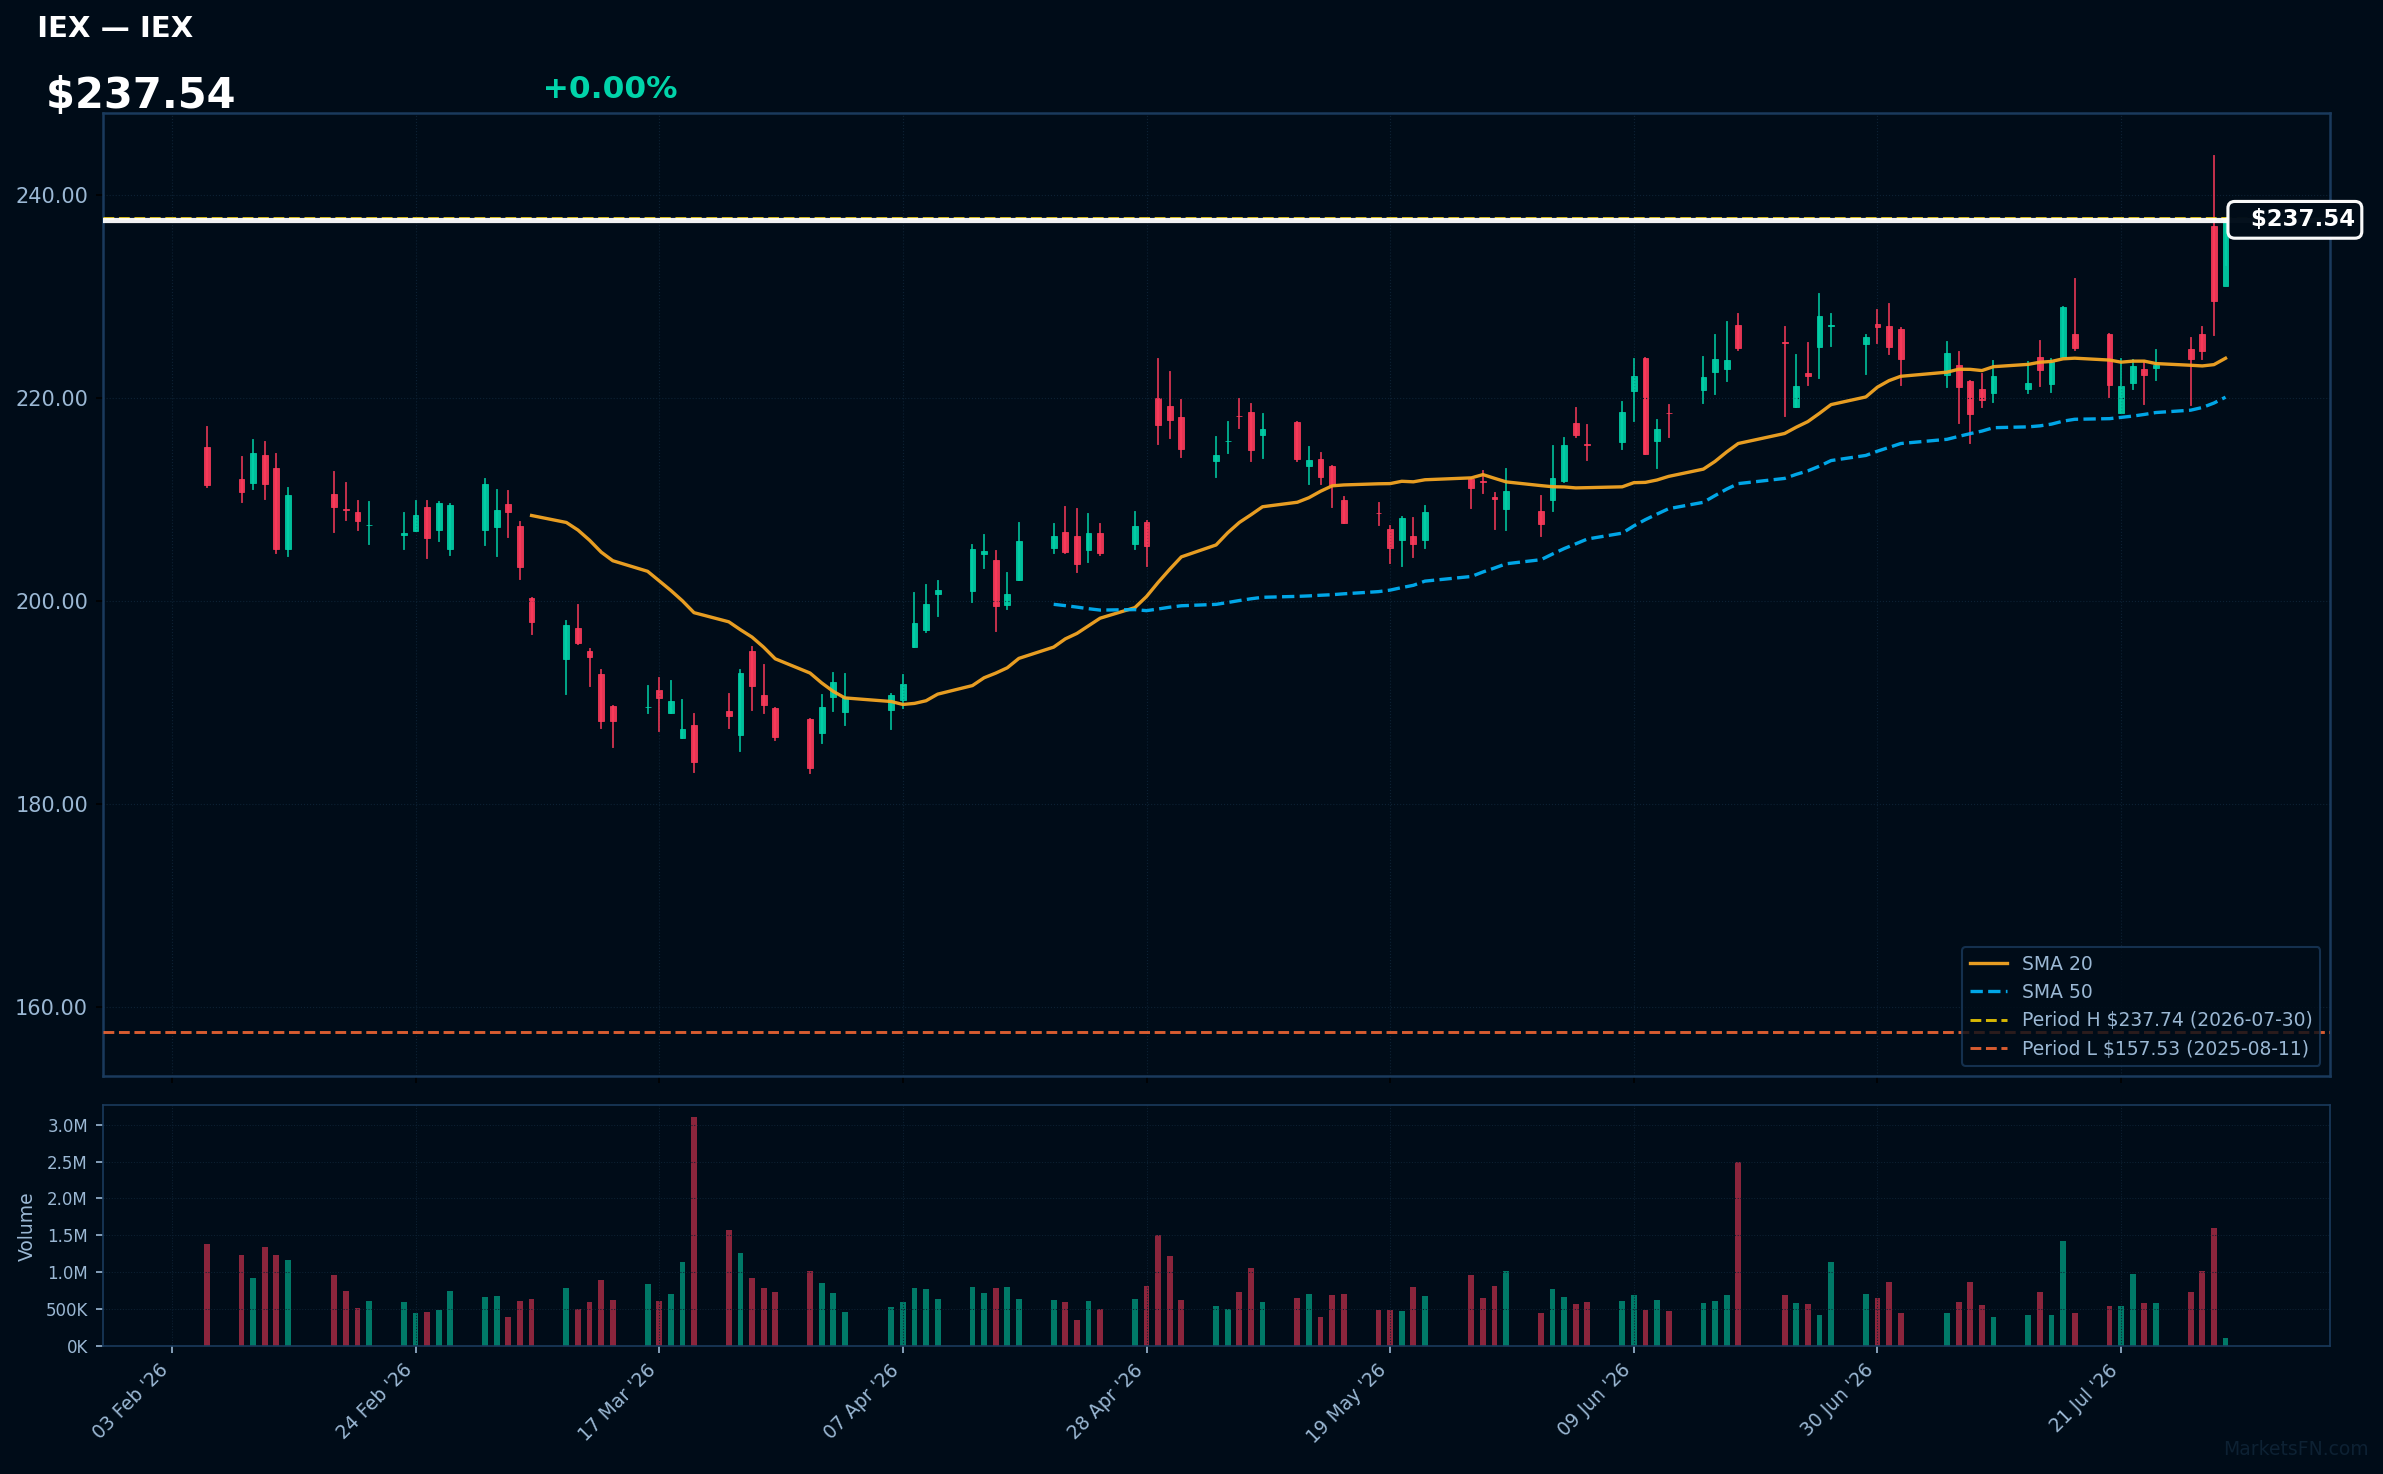
IEX | Idex Corporation | Industrials | Price Last: $237.74 | % Realized: +44.71% | RSI: 71.2 | % above MA200: +20.5% | Trend: Above MA20, MA50, MA200
Idex Corporation is a leading manufacturer of fluidics systems, precision engineered equipment, and other industrial products. Investors should care due to its diversified portfolio and strong market position in niche industries.
Idex Corporation's RSI(14) is 71.2, indicating rising momentum. The MA alignment (price > MA20 > MA50 > MA200) is bullish, with the stock at 0.0% below its 52-Week high, suggesting a potential breakout.
Related headlines
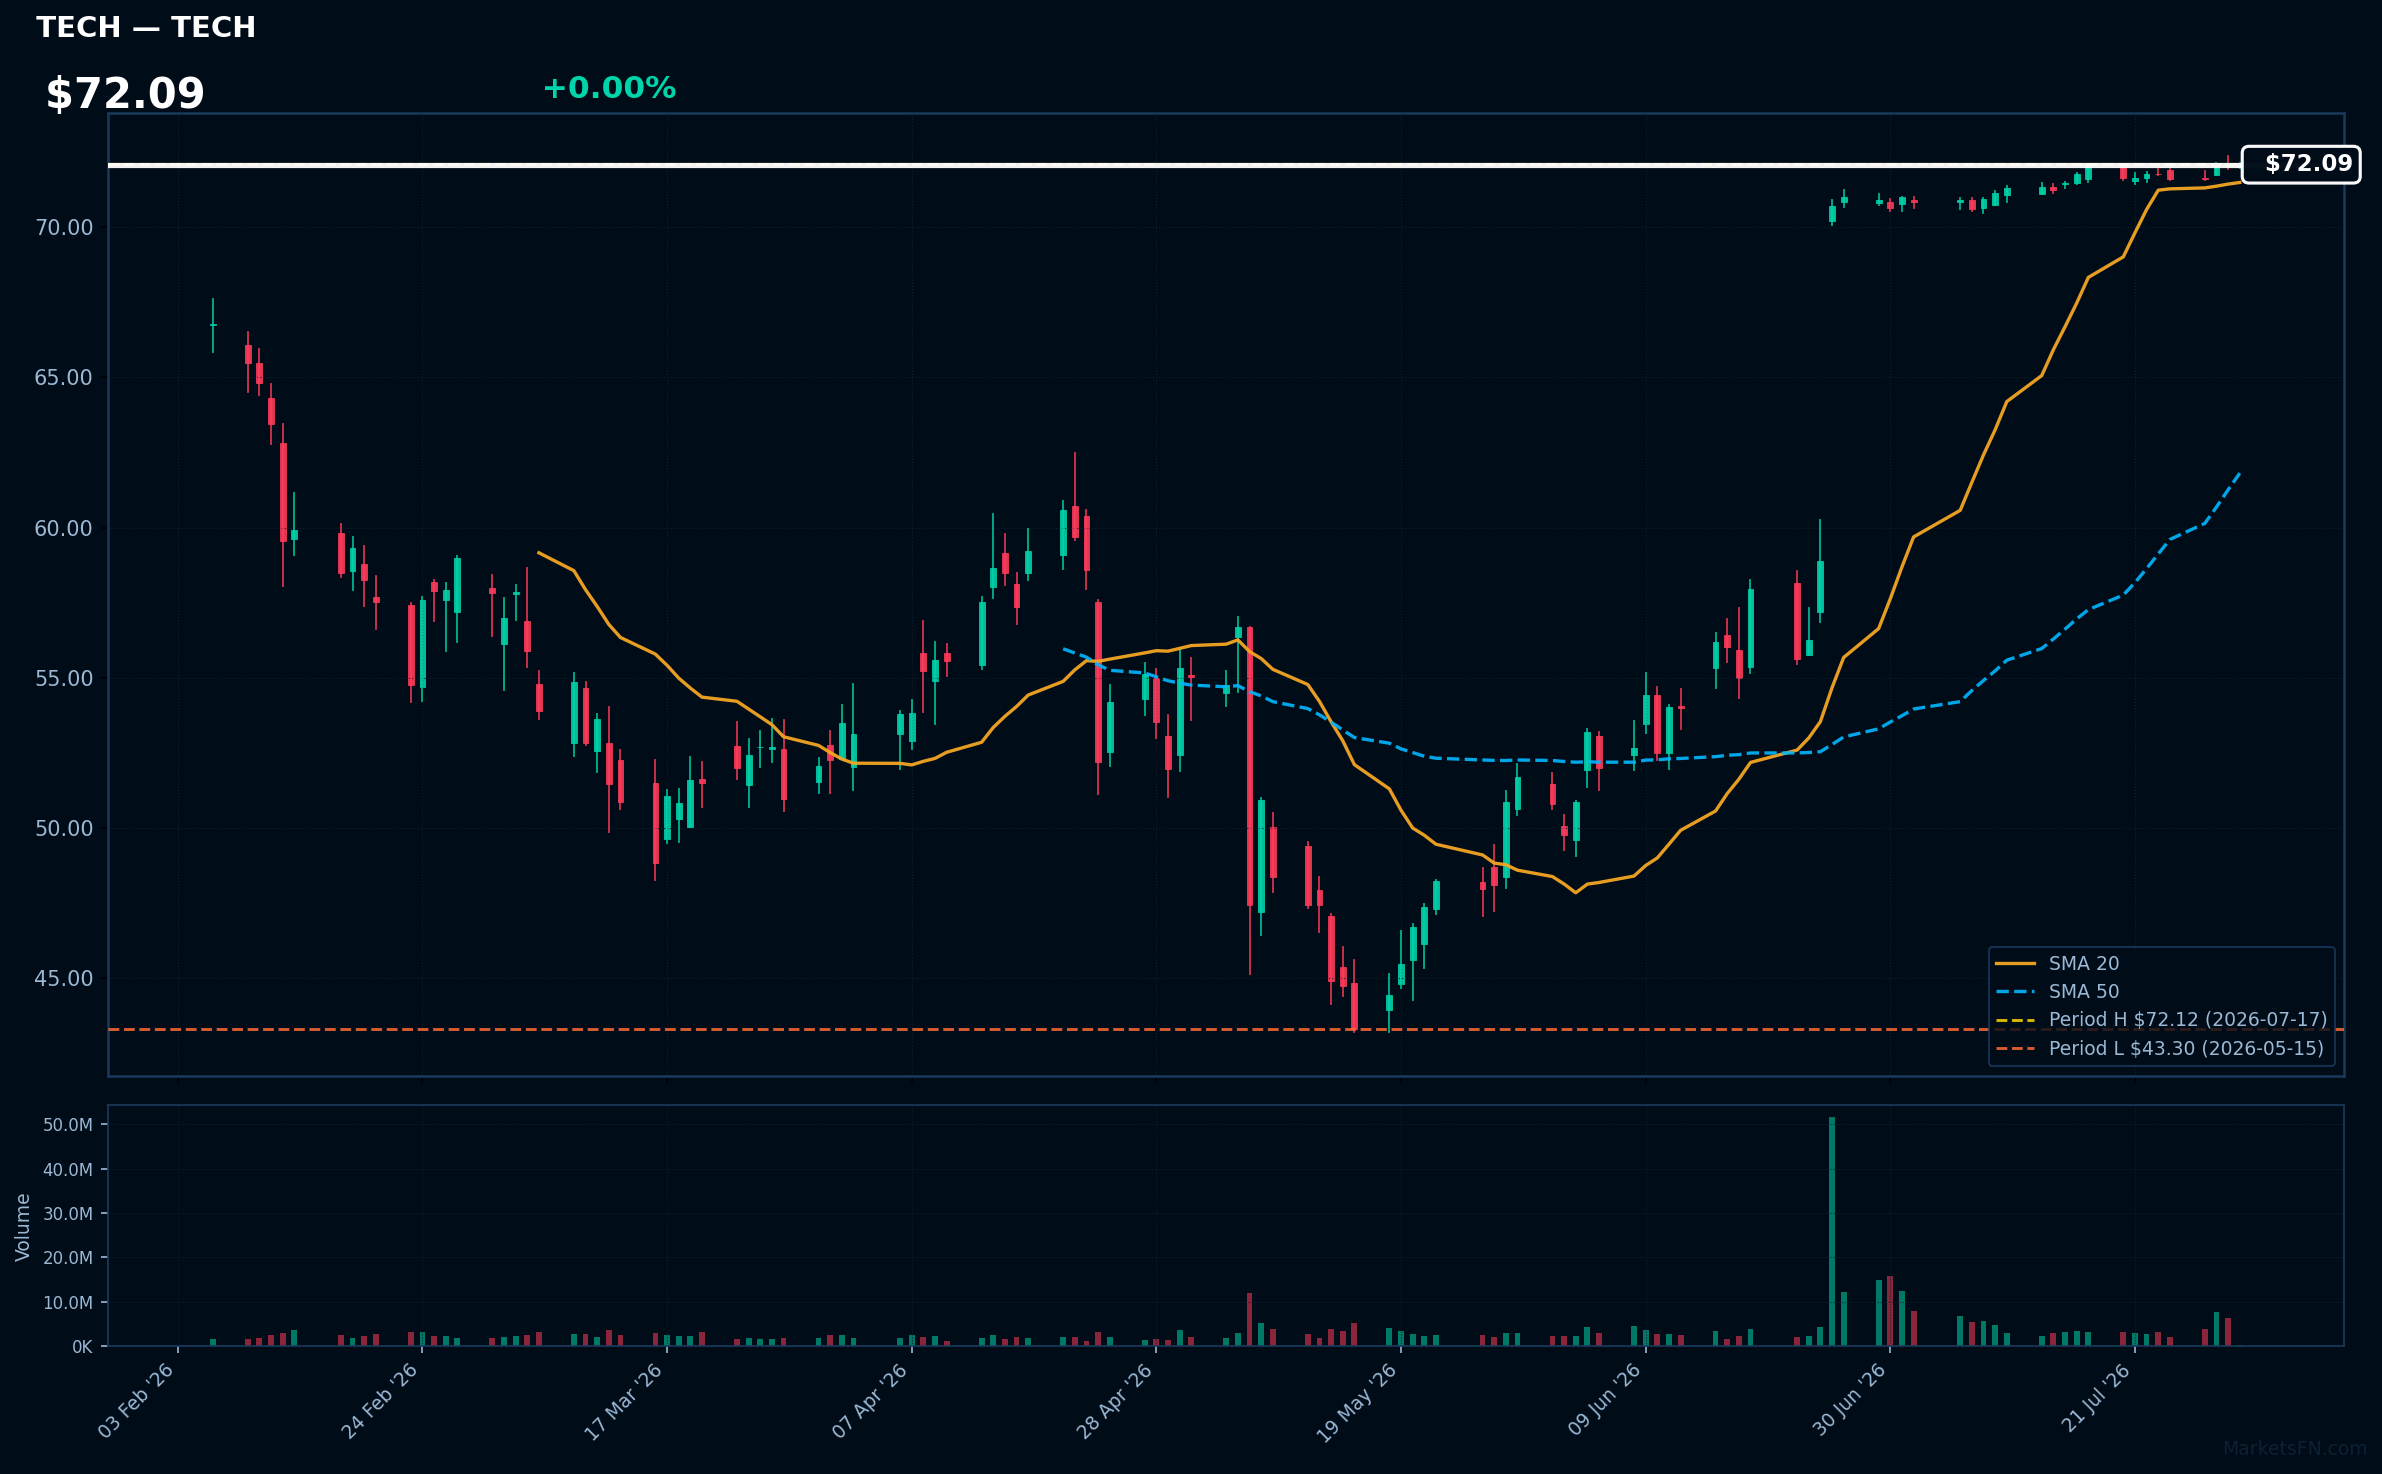
TECH | Bio-Techne Corp | Healthcare | Price Last: $72.09 | % Realized: +24.92% | RSI: 74.5 | % above MA200: +21.0% | Trend: Above MA20, MA50, MA200
Bio-Techne Corp is a life science research and diagnostic products provider, offering a range of tools for protein analysis. Investors should care due to its role in advancing biomedical research and diagnostics, potentially driving long-term growth.
The stock shows strong bullish momentum with RSI(14) at 74.5, price > MA20 > MA50 > MA200, and is 0.0% below its 52-Week high, indicating a potential breakout; 52-Week return is 24.9%. This suggests sustained uptrend and potential for further gains.
Related headlines
- Bio-Techne Launches Expanded R&D Systems AI-Engineered Designer Protein Portfolio
- Are SYNA, IRDM, TECH, PATK Obtaining Fair Deals for their Shareholders?
- Are IRDM, TBPH, SYNA, TECH Obtaining Fair Deals for their Shareholders?
- Germany's Merck KGaA is buying lab-tools supplier Bio-Techne for $11.3 billion
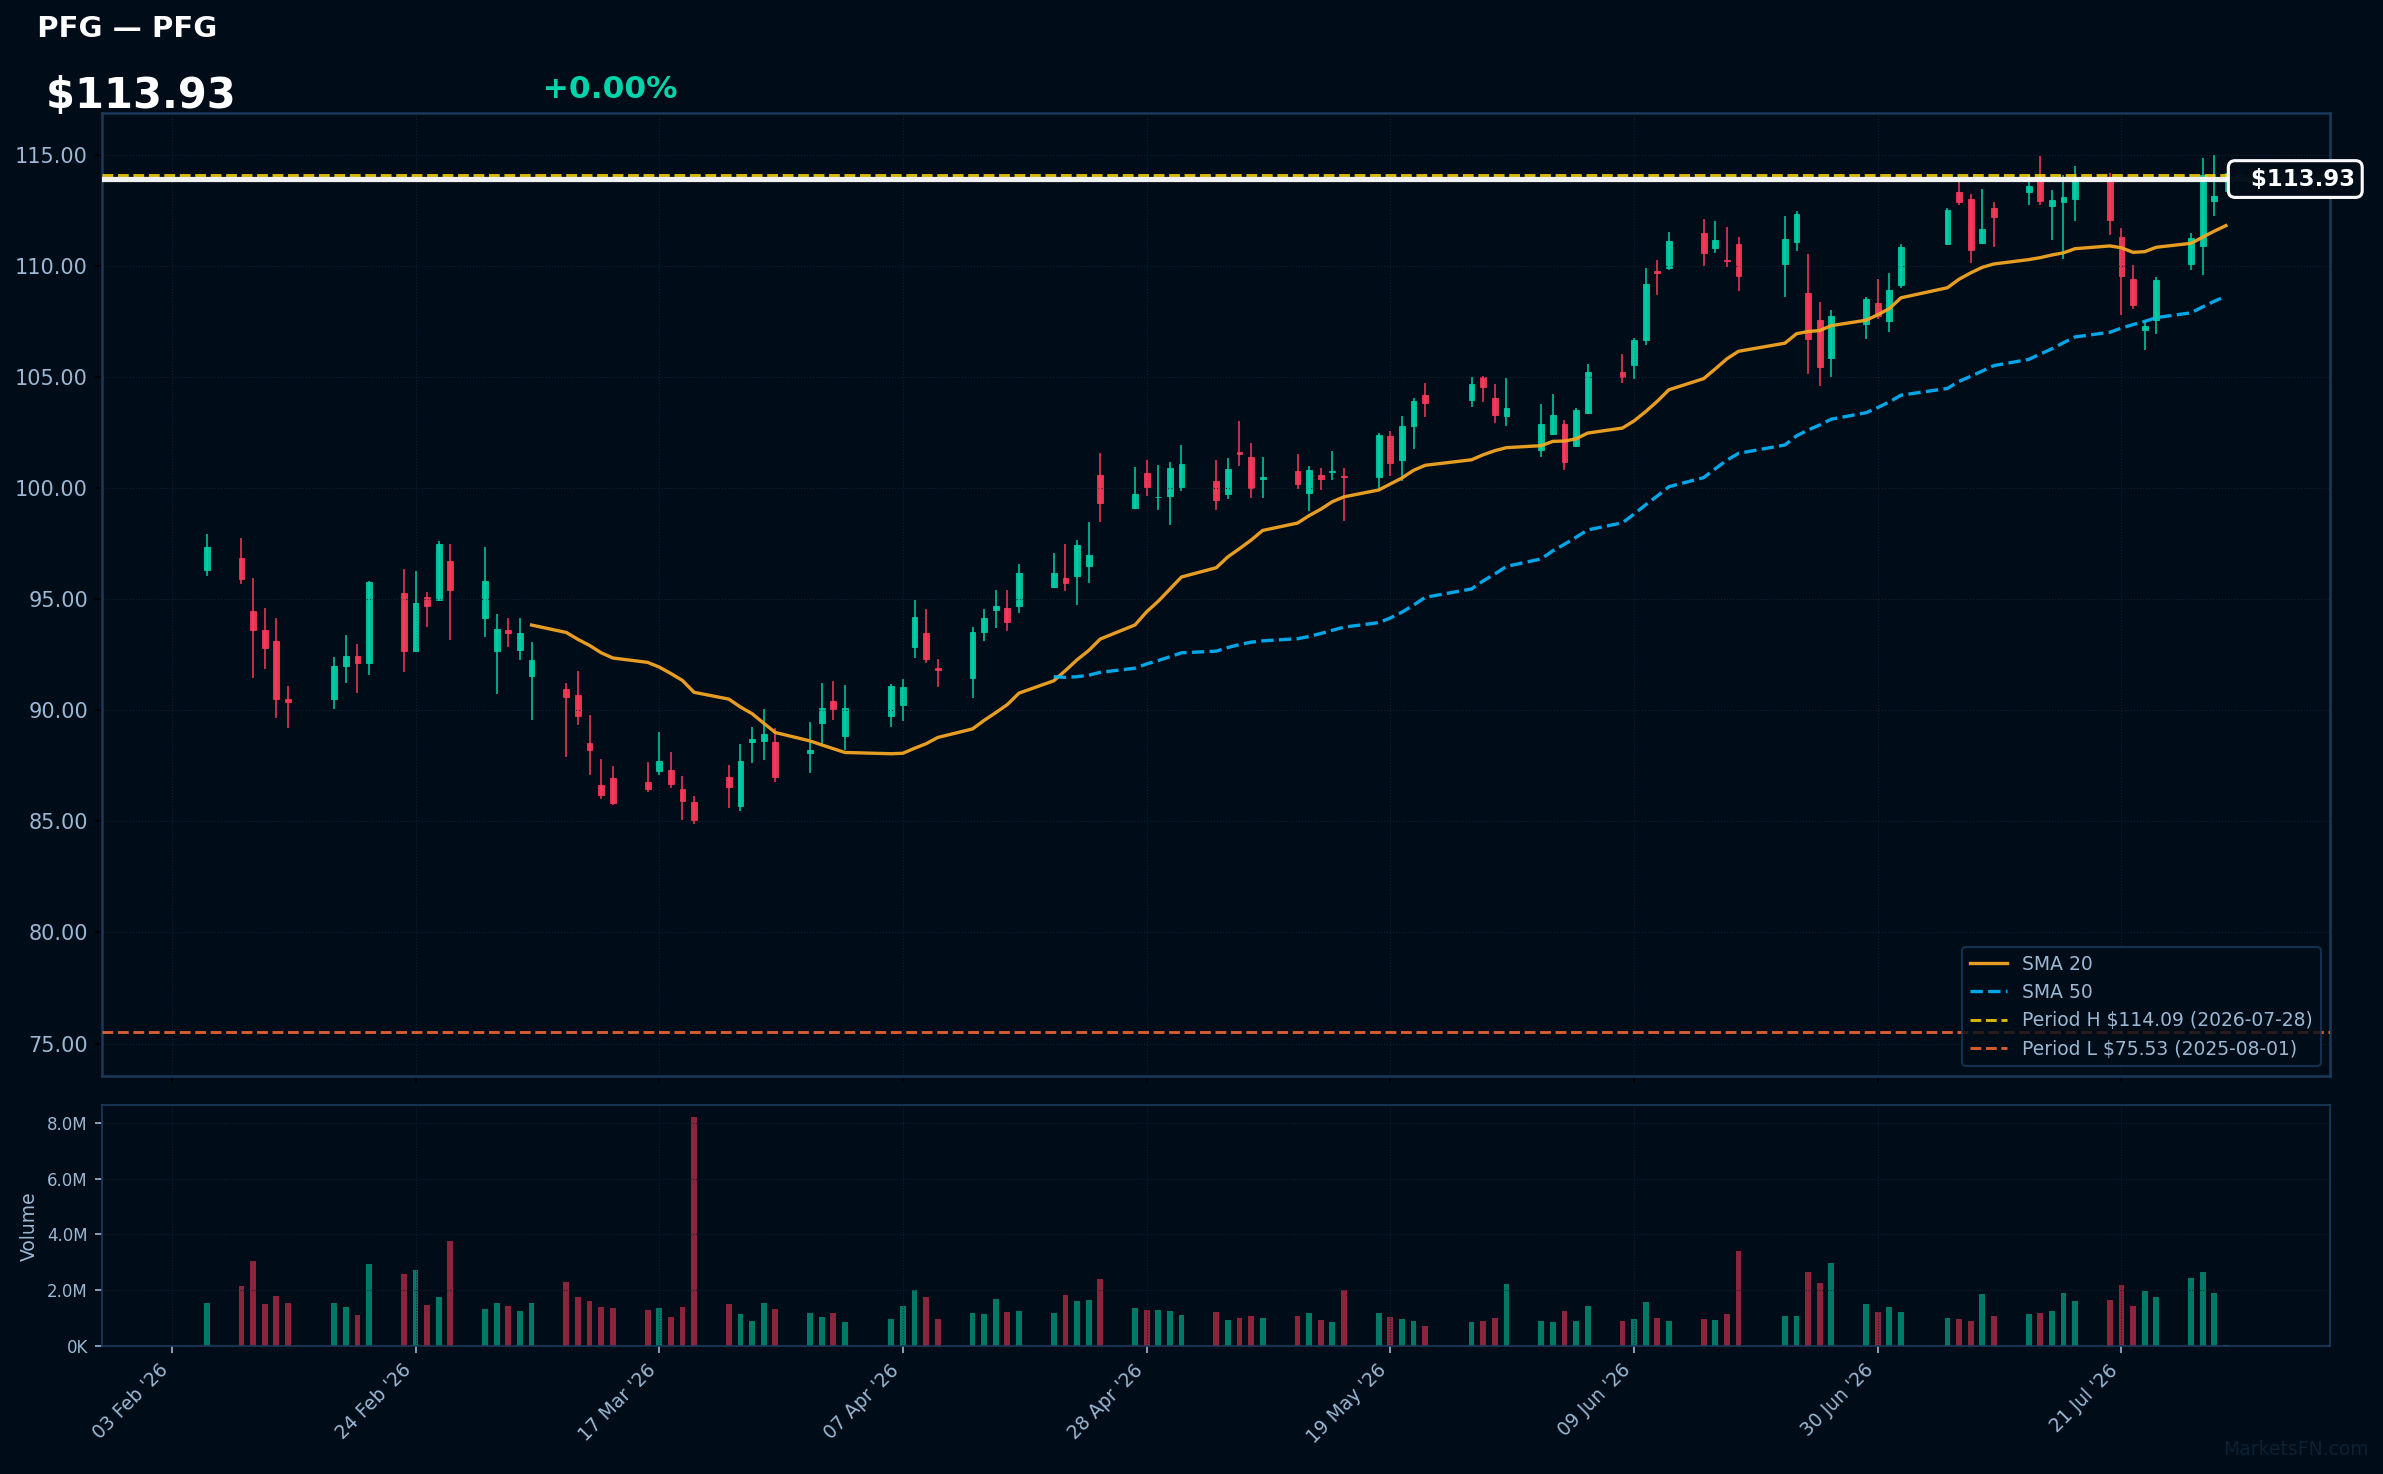
PFG | Principal Financial Group Inc | Financial | Price Last: $113.93 | % Realized: +48.75% | RSI: 59.3 | % above MA200: +20.2% | Trend: Above MA20, MA50, MA200
Principal Financial Group Inc is a life insurance and retirement services company. Investors should care because its performance reflects demand for retirement products and insurance, indicating financial health and consumer confidence.
The stock shows bullish MA alignment with price > MA20 > MA50 > MA200 and RSI(14) at 59.3, indicating sustained uptrend momentum. Near its 52-Week high, it's 0.1% below, suggesting potential breakout.
Related headlines
📉 Nearest to 52-Week Low
Sectors represented: Consumer Cyclical (2), Communication Services (1), Technology (1), Industrials (1)
| Ticker | Company | Sector | Price Last | % Realized | 52-Week Low Date | RSI | % above MA200 | Trend |
|---|---|---|---|---|---|---|---|---|
| ROL | Rollins, Inc | Consumer Cyclical | $37.65 | -34.68% | 2026-07-30 | 25.8 | -31.5% | Below MA20, MA50, MA200 |
| PSKY | Paramount Skydance Corp | Communication Services | $7.84 | -41.09% | 2026-07-30 | 26.0 | -33.6% | Below MA20, MA50, MA200 |
| LKQ | LKQ Corp | Consumer Cyclical | $21.53 | -28.50% | 2026-07-30 | 29.1 | -27.0% | Below MA20, MA50, MA200 |
| SNPS | Synopsys, Inc | Technology | $374.72 | -41.94% | 2026-07-24 | 32.1 | -16.7% | Below MA20, MA50, MA200 |
| LII | Lennox International Inc | Industrials | $432.20 | -29.79% | 2026-07-29 | 24.7 | -15.2% | Below MA20, MA50, MA200 |
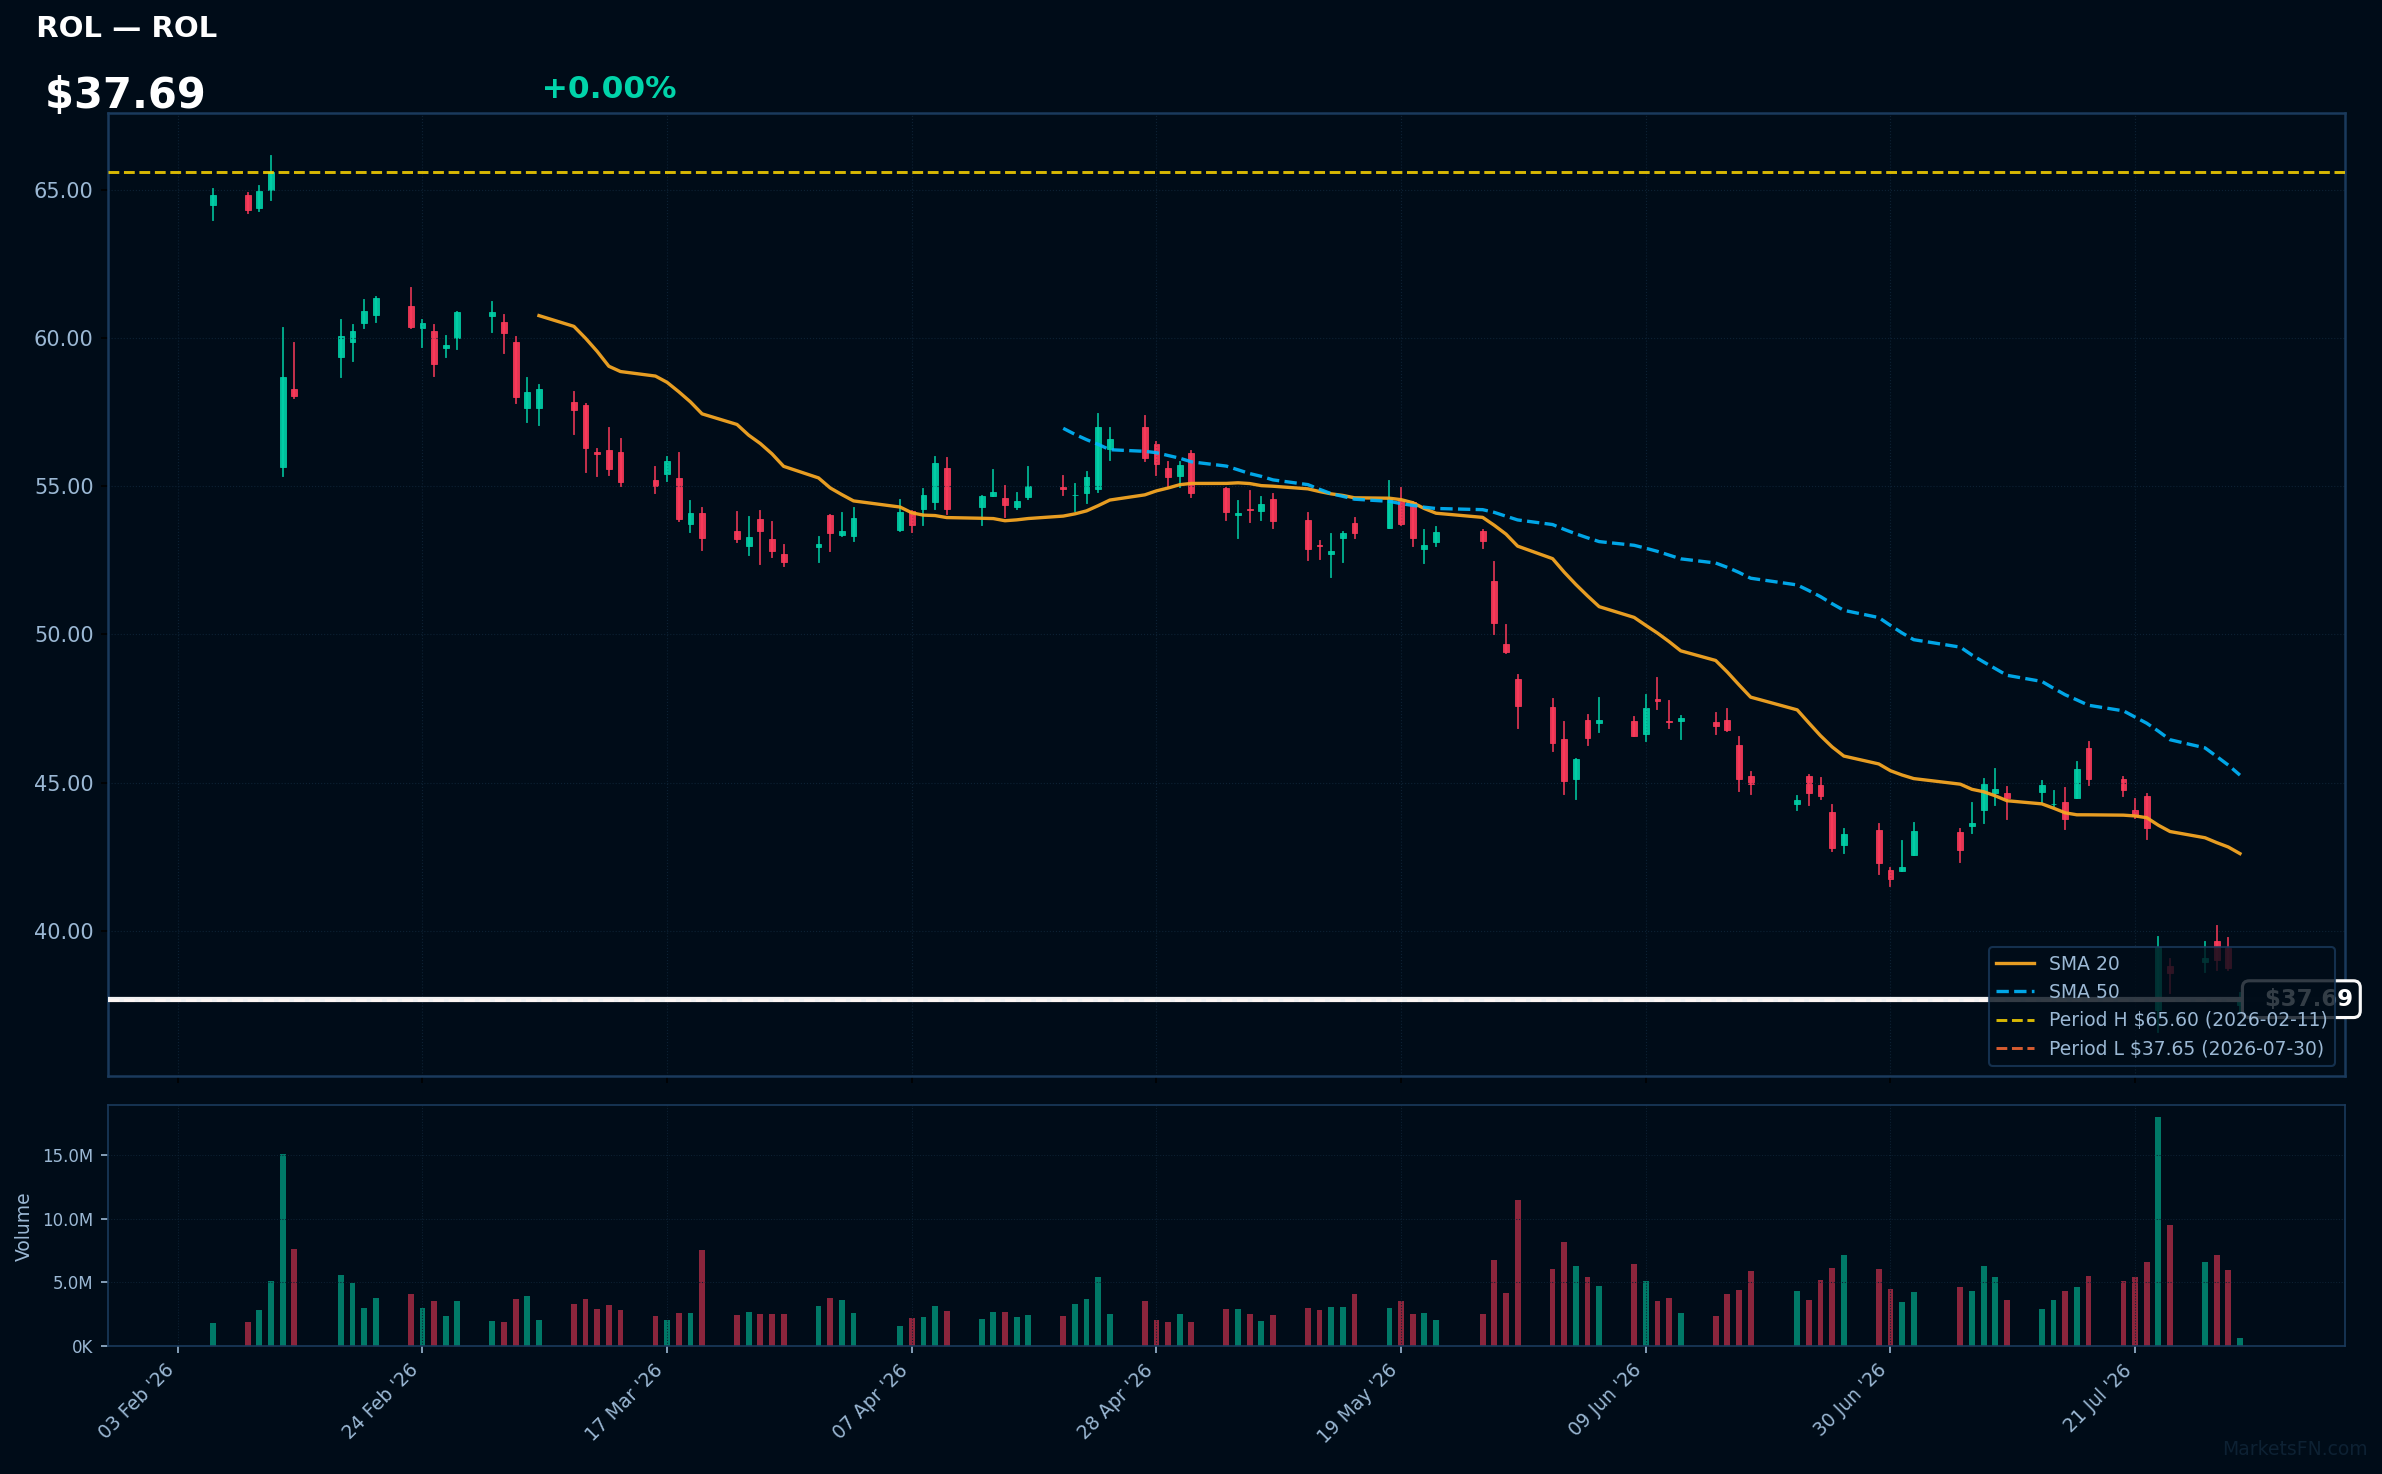
ROL | Rollins, Inc | Consumer Cyclical | Price Last: $37.65 | % Realized: -34.68% | RSI: 25.8 | % above MA200: -31.5% | Trend: Below MA20, MA50, MA200
Rollins, Inc provides pest control services through its Orkin, Terminix, and other brands, serving both residential and commercial clients. Investors should care about its performance as it indicates demand for essential services and the company's competitive positioning.
Rollins, Inc is in a sustained downtrend with price ($37.69) below MA20, MA50, and MA200. The RSI(14) is 25.8, nearing oversold territory, and the stock is at its 52-Week low, indicating potential support testing and a warning sign for further decline.
Related headlines
- JPMorgan cuts Rollins to Neutral on demand uncertainty, slashes price target
- Rollins Inc (ROL) Q2 2026 Earnings Call Highlights: Strong Growth in Termite and Ancillary ...
- Rollins Inc. stock underperforms Thursday when compared to competitors
- Rollins shares plunge premarket after Q2 miss triggers downgrades
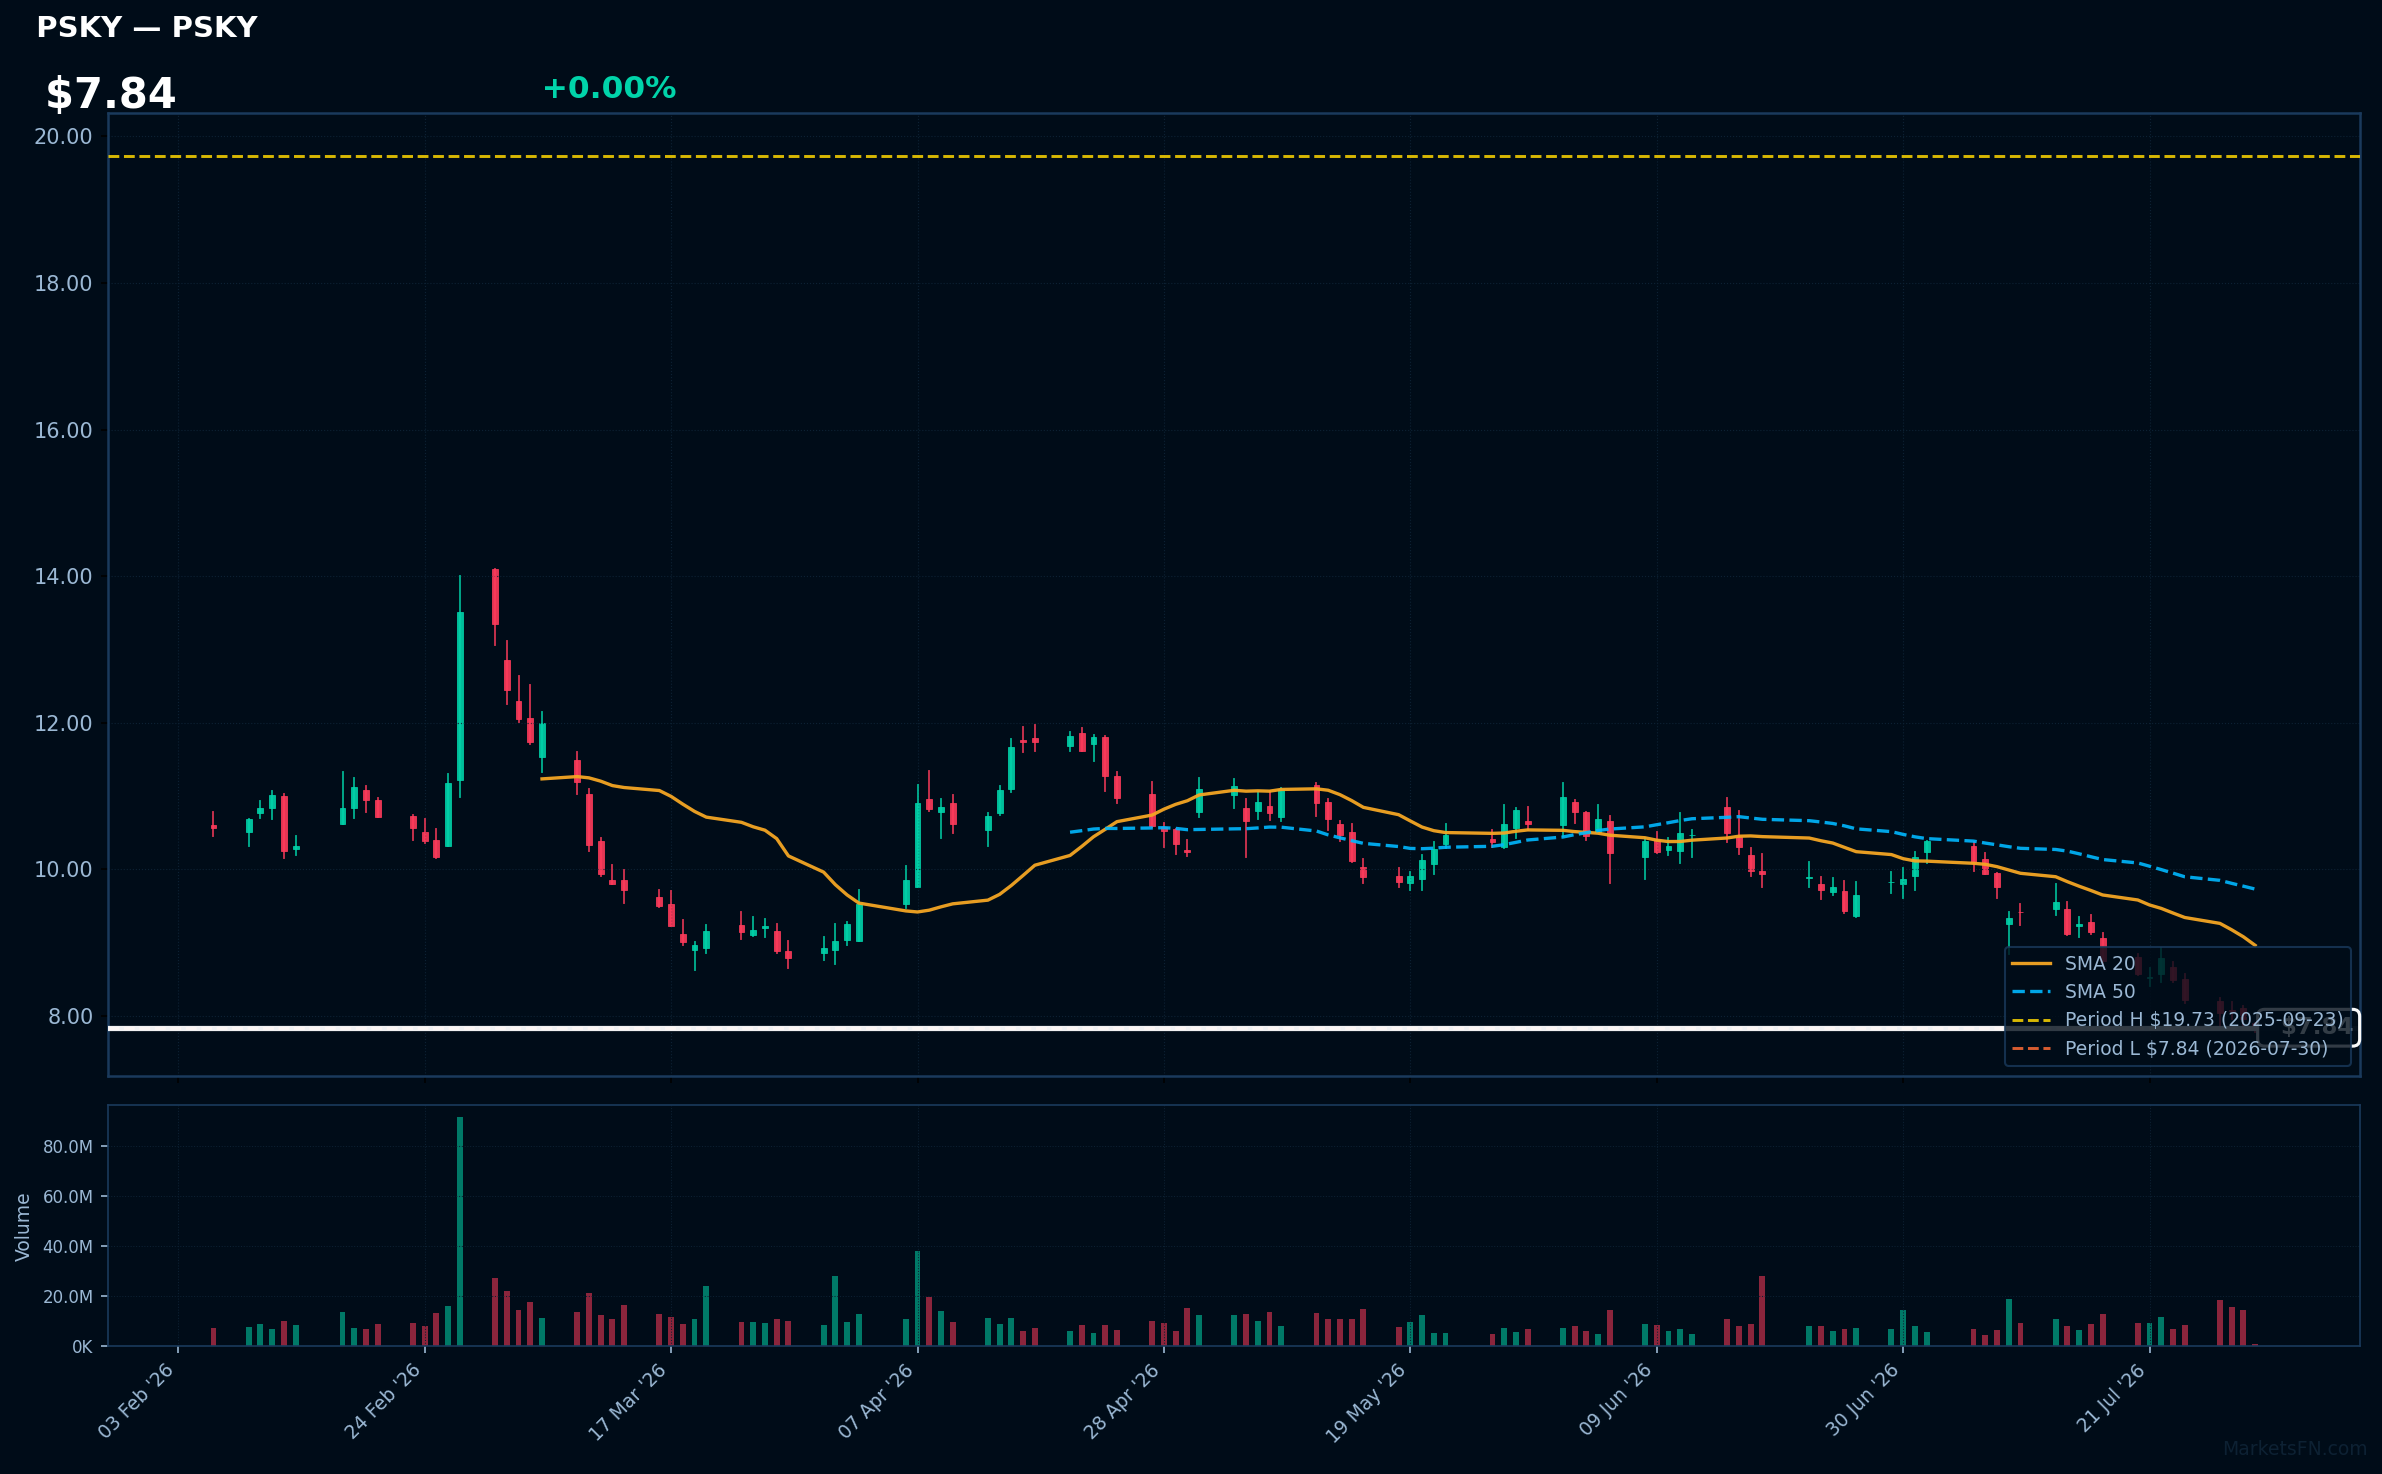
PSKY | Paramount Skydance Corp | Communication Services | Price Last: $7.84 | % Realized: -41.09% | RSI: 26.0 | % above MA200: -33.6% | Trend: Below MA20, MA50, MA200
Paramount Skydance Corp is not described in the data provided, making it impossible to determine its business activities or investor relevance.
The stock exhibits a sustained downtrend with price ($7.84) below MA20, MA50, and MA200. RSI(14) is 26.0, near oversold territory. The stock is at its 52-Week low, indicating potential support testing, with a 52-Week return of -41.1%.
Related headlines
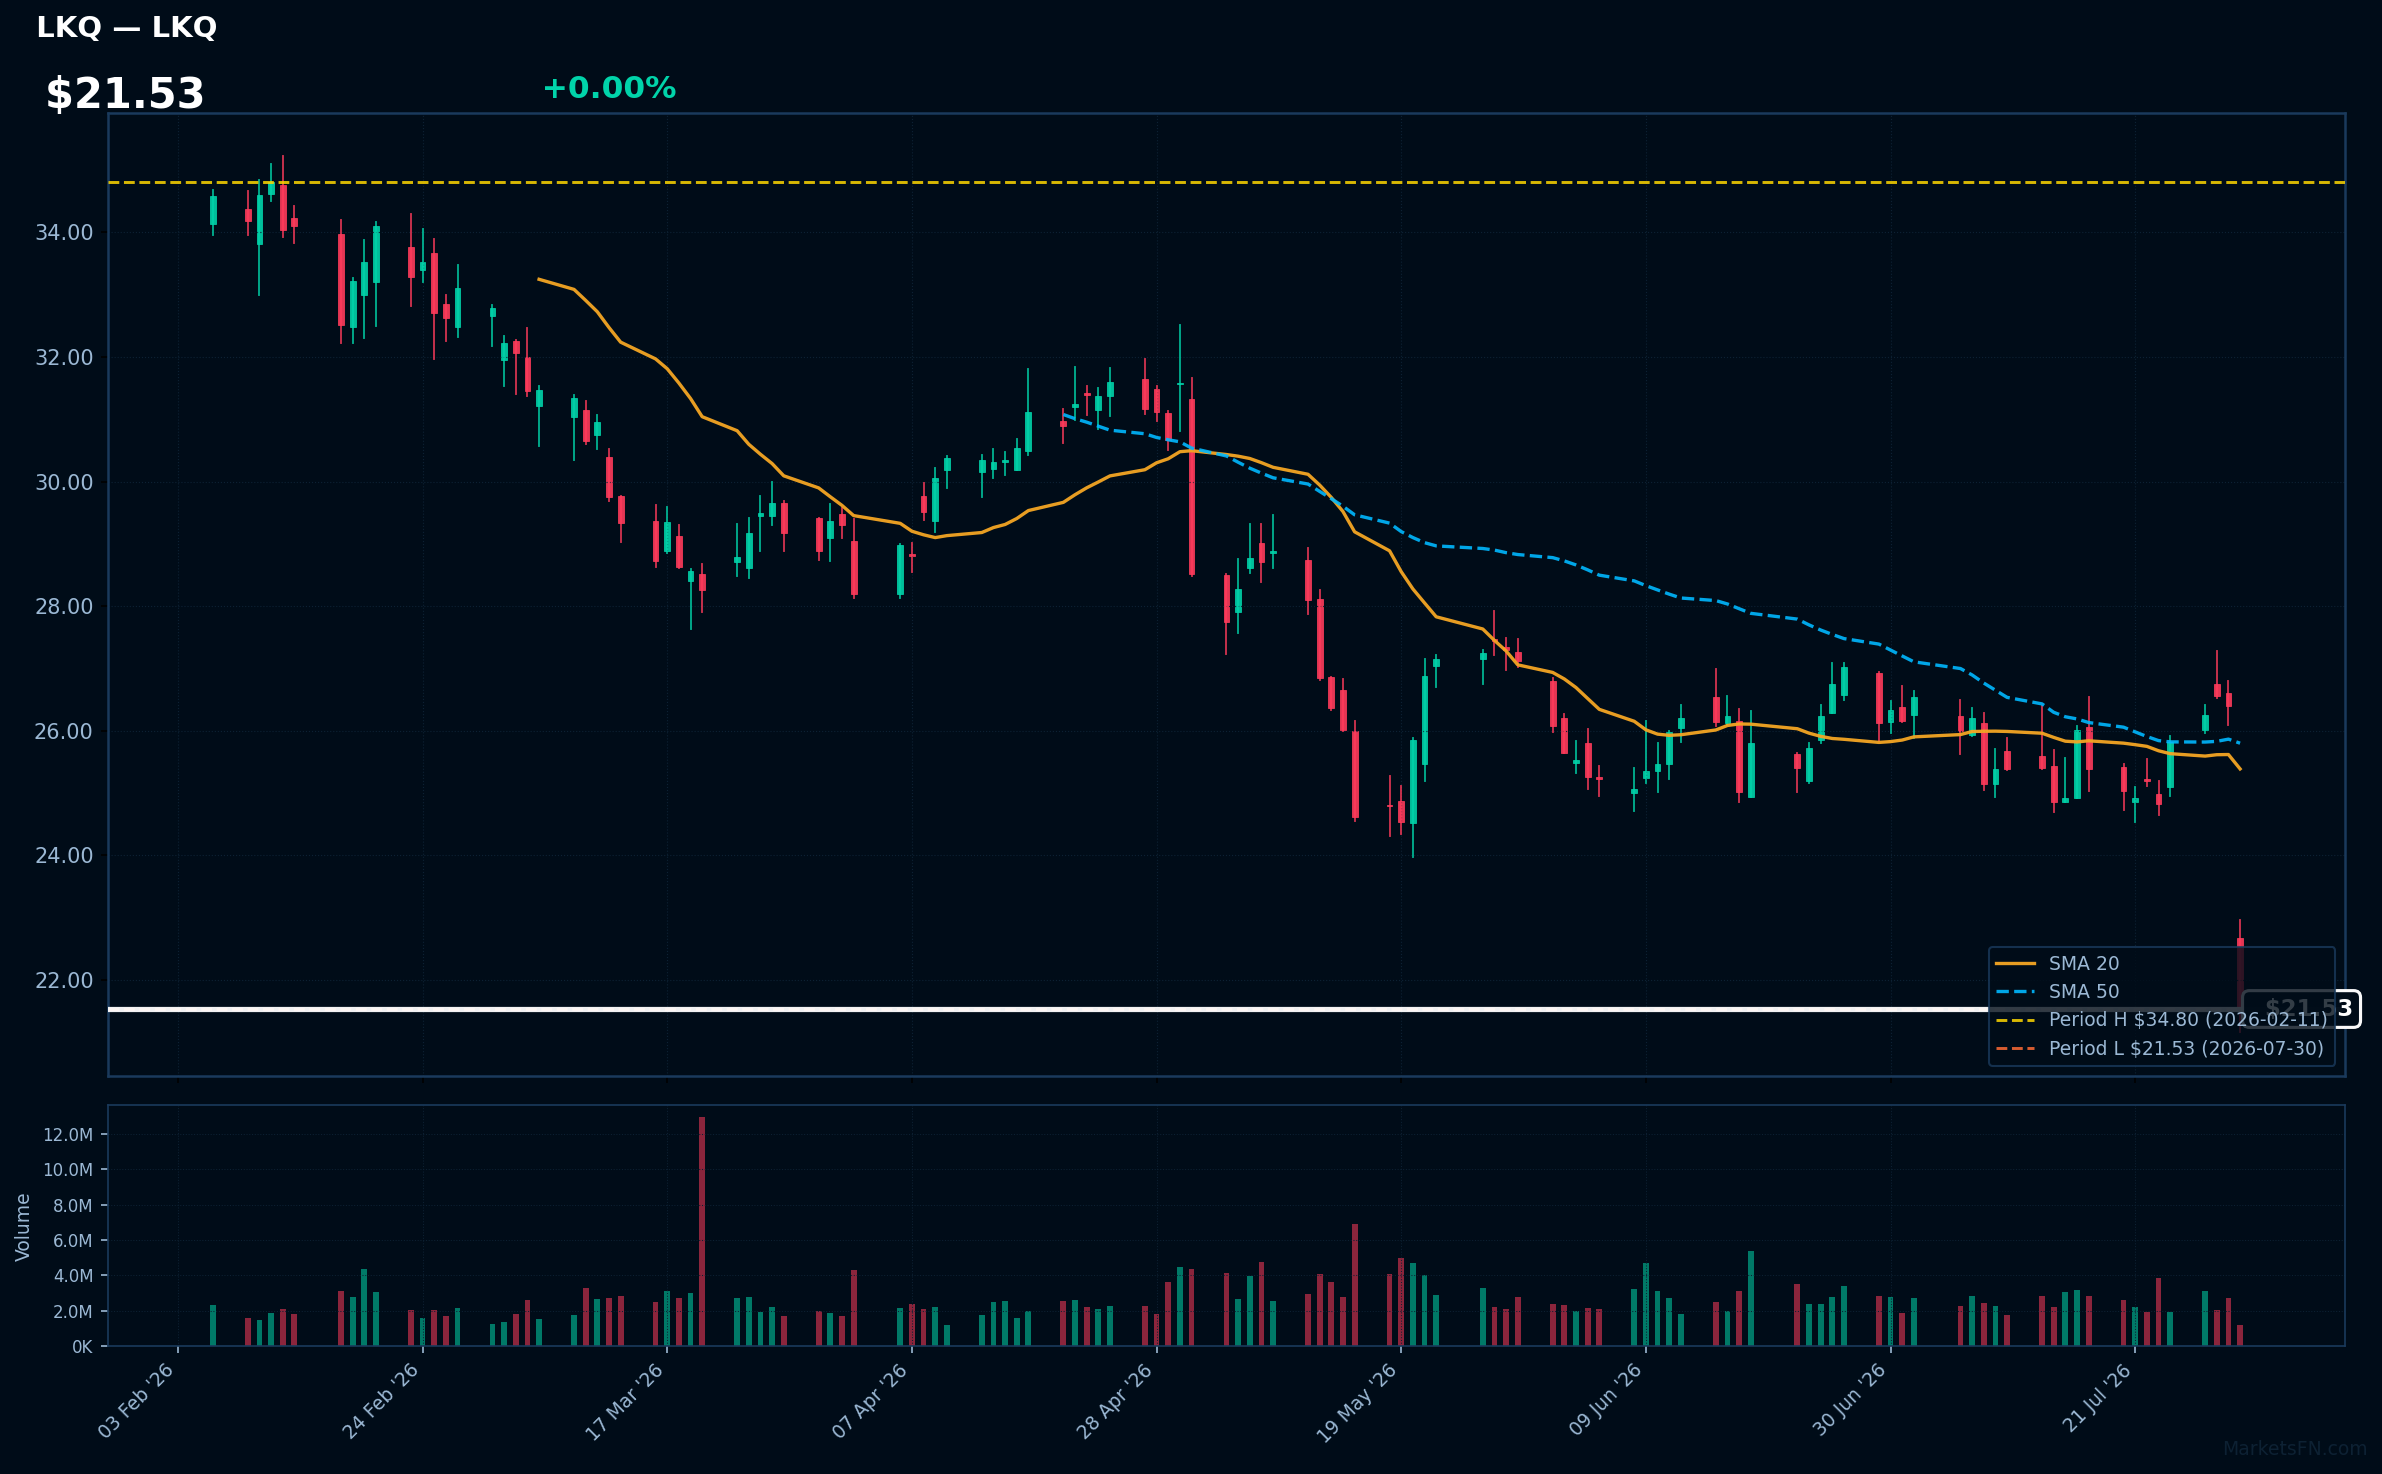
LKQ | LKQ Corp | Consumer Cyclical | Price Last: $21.53 | % Realized: -28.50% | RSI: 29.1 | % above MA200: -27.0% | Trend: Below MA20, MA50, MA200
LKQ Corp is a leading provider of alternative and specialty parts to repair and accessorize automobiles and other vehicles. Investors should care because its performance reflects demand for aftermarket auto parts, indicating consumer spending and repair activity trends.
LKQ Corp's technicals indicate a sustained downtrend with price at $21.53 below all key MAs (MA20, MA50, MA200) and RSI(14) at 29.1, nearing oversold territory, with the stock at its 52-Week low, signaling a potential warning sign.
Related headlines
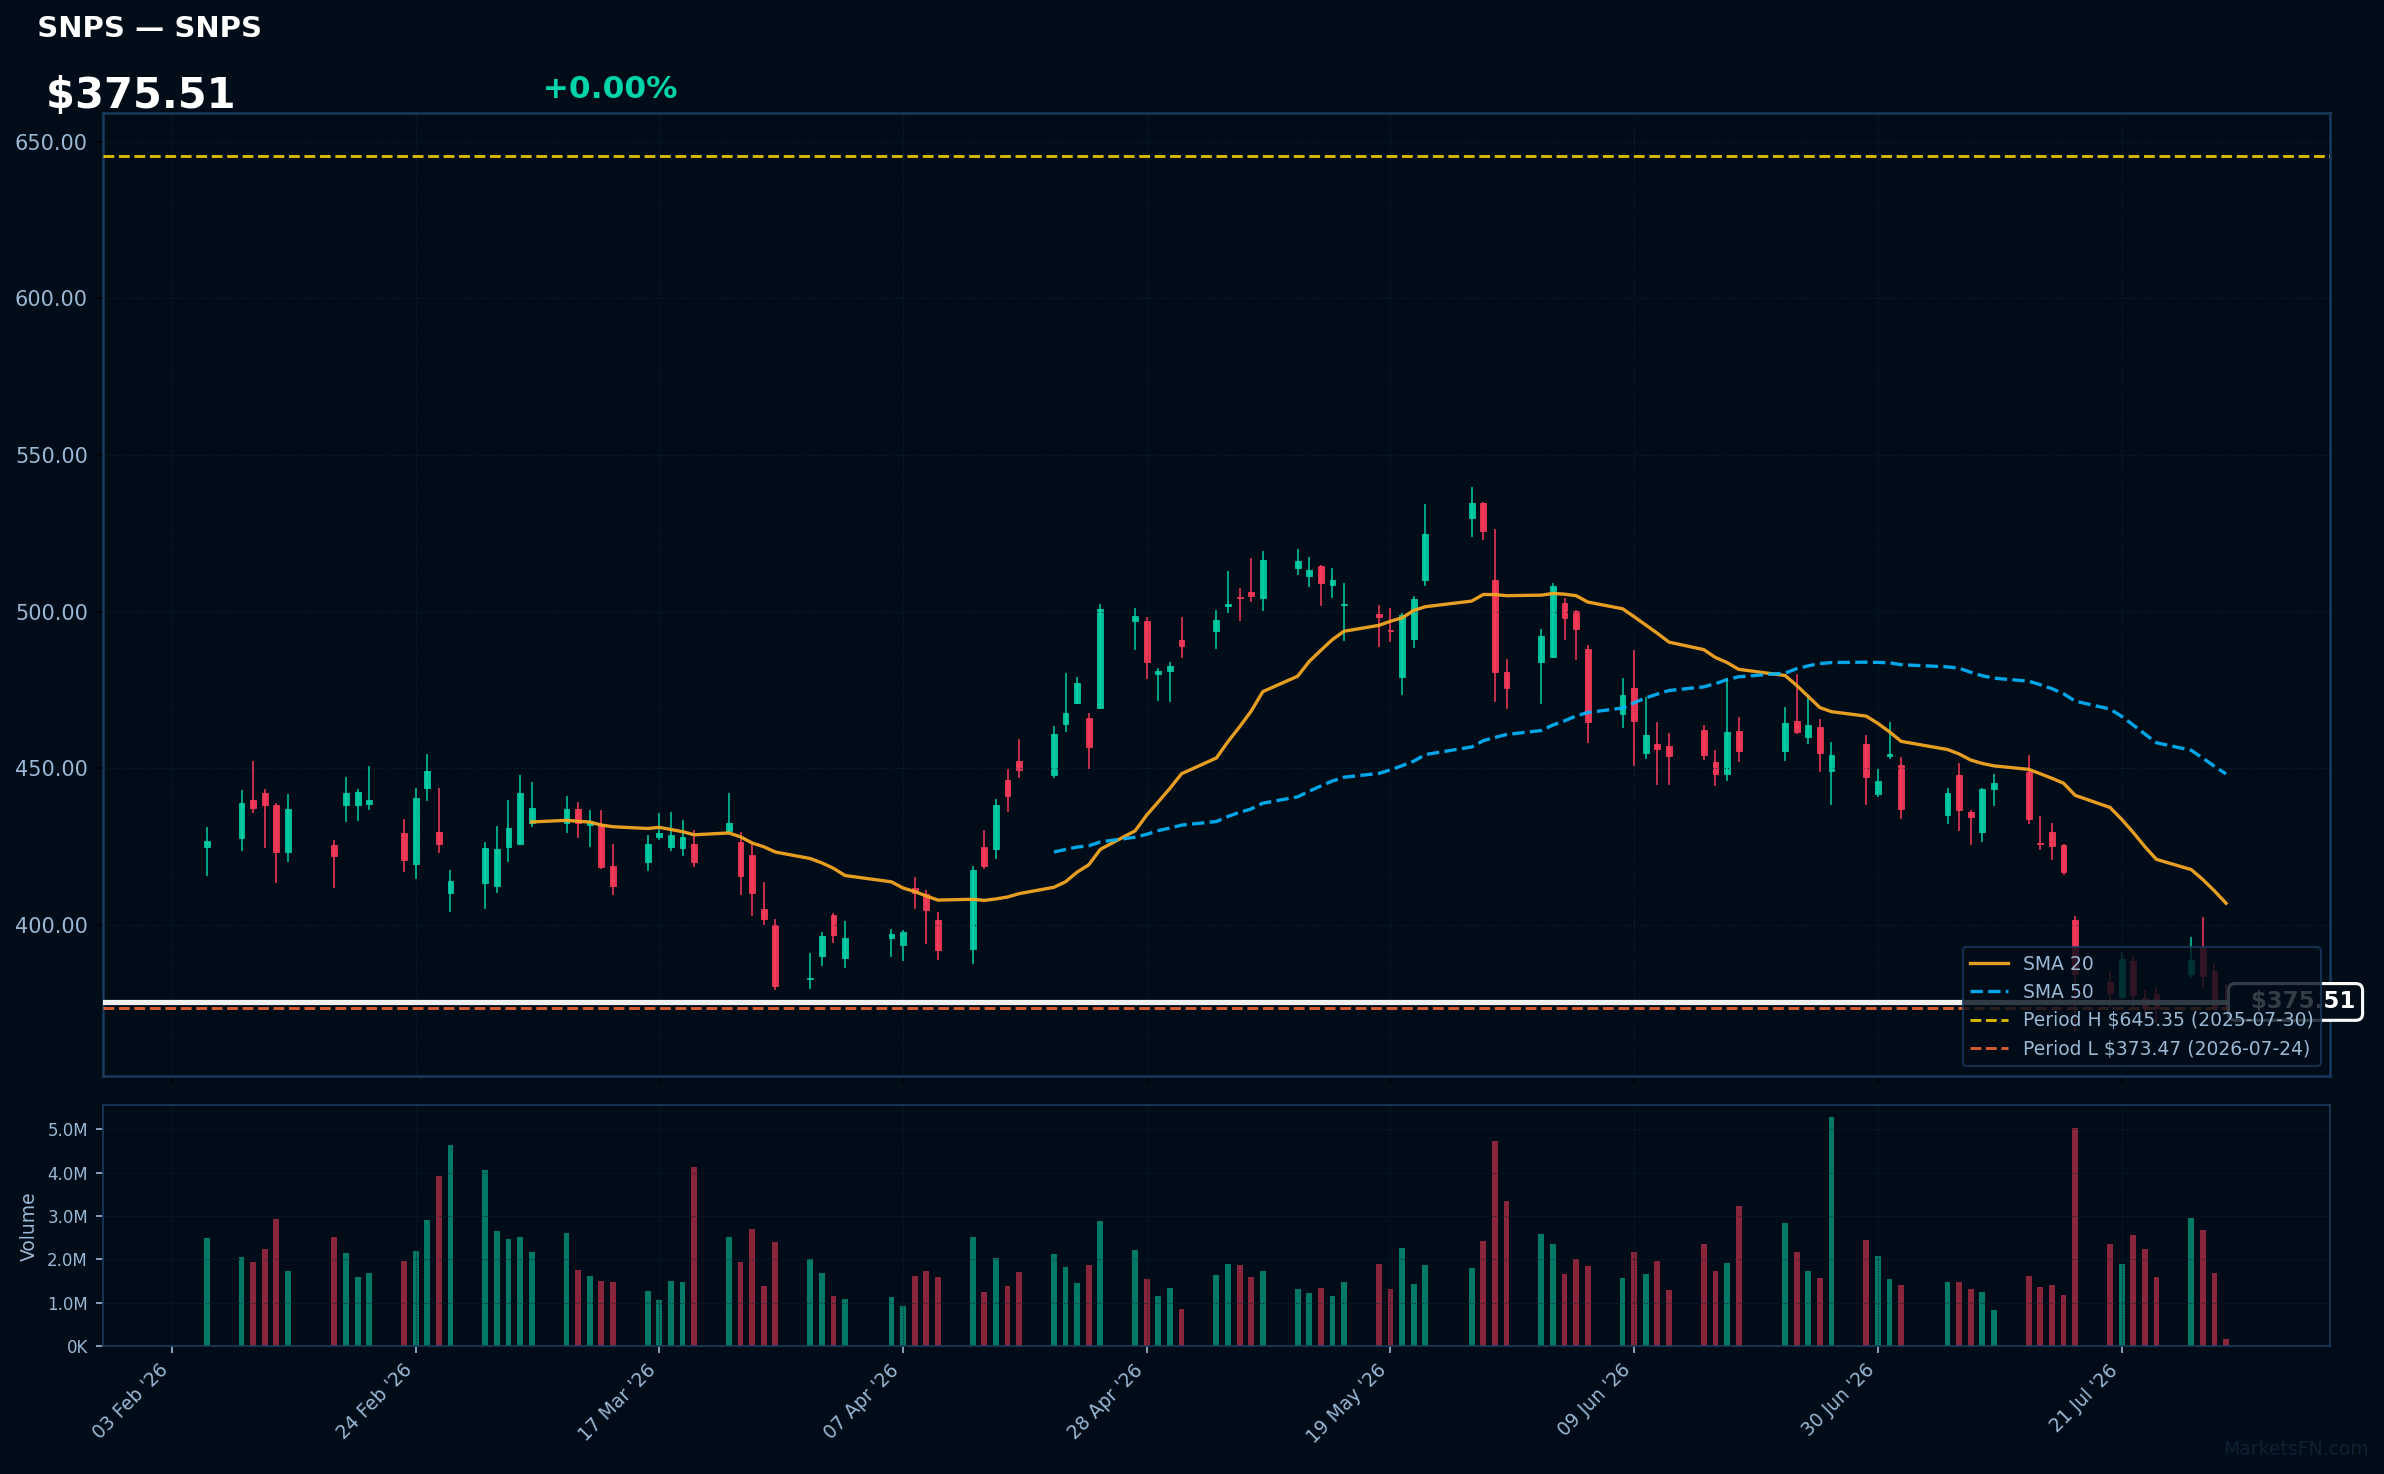
SNPS | Synopsys, Inc | Technology | Price Last: $374.72 | % Realized: -41.94% | RSI: 32.1 | % above MA200: -16.7% | Trend: Below MA20, MA50, MA200
Synopsys, Inc is a software company that provides electronic design automation (EDA) tools and semiconductor intellectual property (IP) used in the design and verification of complex integrated circuits, crucial for the development of advanced technologies like AI and 5G.
Synopsys' current technical situation is bearish, with an RSI(14) of 32.1 indicating oversold conditions, price ($375.51) below all key MAs (MA20, MA50, MA200), and a 52-Week low proximity of 0.3%, warning of potential further downside in a sustained downtrend.
Related headlines
- Synopsys unveils autonomous chip design workflows with Microsoft and AMD collaboration
- Synopsys and Intel Foundry Fast-Track Customer Readiness from Silicon to Systems on Intel 14A
- Synopsys Advances Agentic AI Chip Design with AMD and Microsoft
- Synopsys Showcases Comprehensive Autonomous Engineering Workflows from Silicon to Systems, Developed with NVIDIA Technology
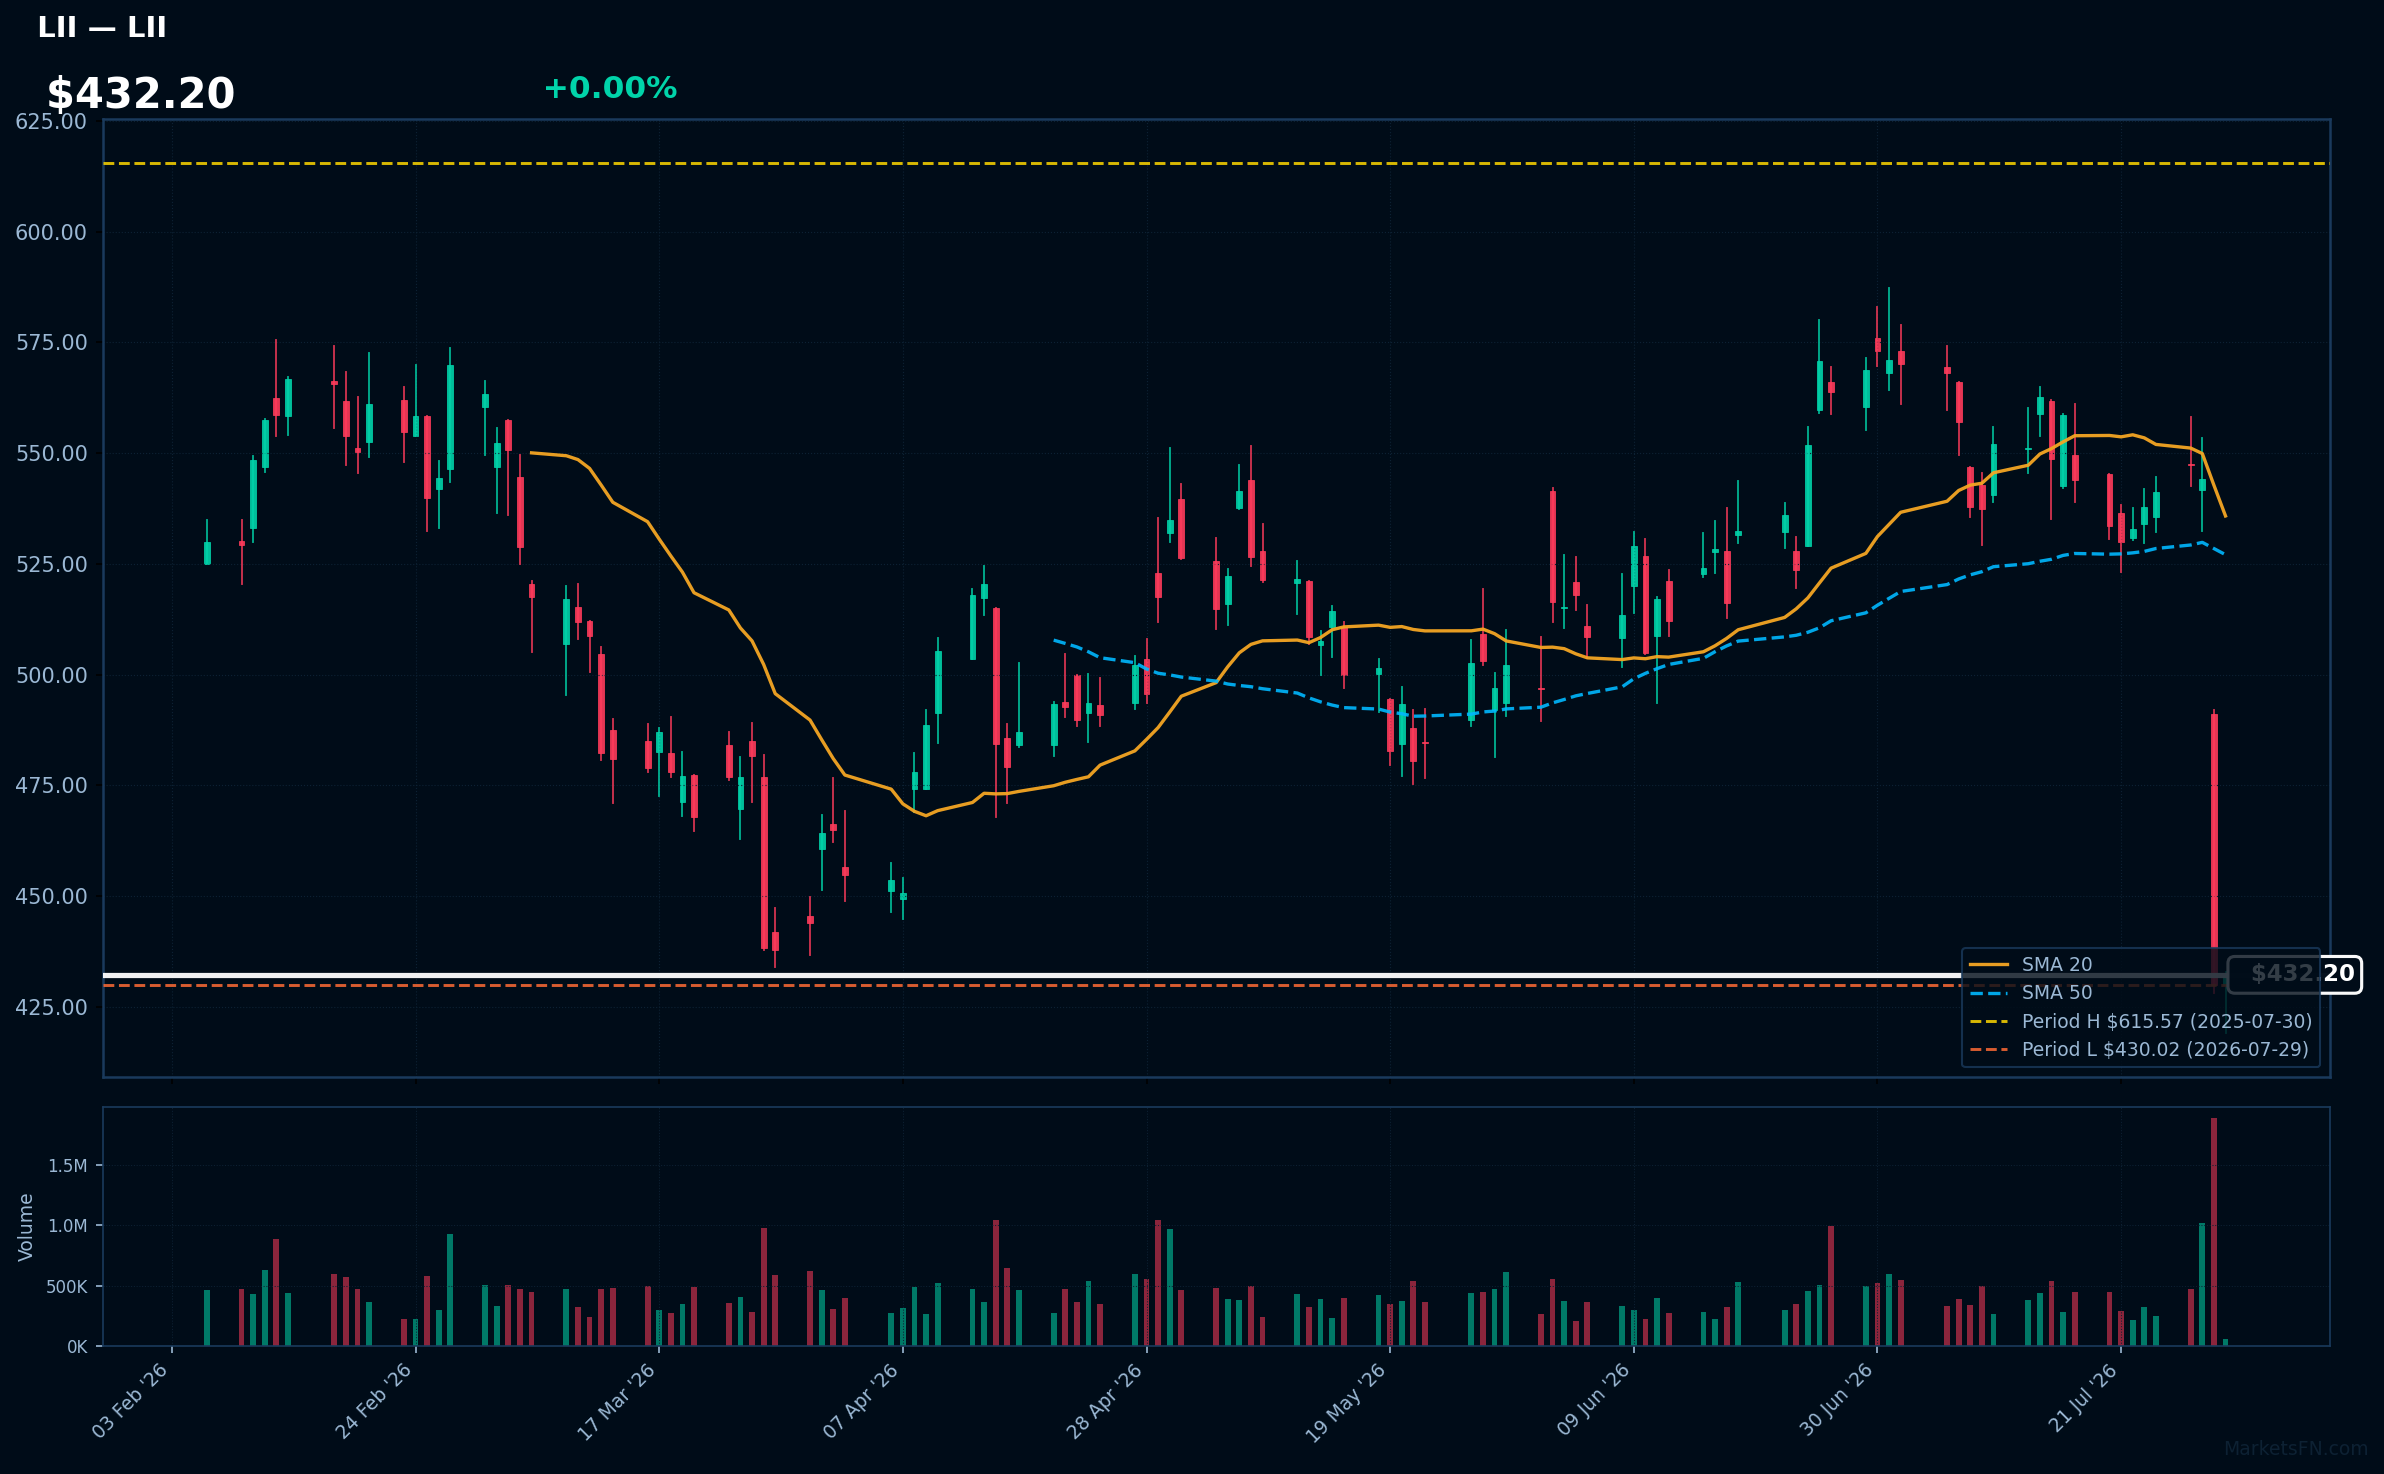
LII | Lennox International Inc | Industrials | Price Last: $432.20 | % Realized: -29.79% | RSI: 24.7 | % above MA200: -15.2% | Trend: Below MA20, MA50, MA200
Lennox International Inc is a climate control solutions provider, manufacturing HVAC equipment for residential and commercial markets. Investors should care about its performance as it reflects demand for energy-efficient heating and cooling systems, a key indicator of construction activity and energy consumption trends.
Lennox International Inc's current technical situation is bearish, with an RSI(14) of 24.7 indicating oversold conditions, and the stock price below MA20, MA50, and MA200, showing a downtrend. It's 0.5% above its 52-Week low, testing major support.
Related headlines
Market Commentary
The S&P 500 stocks listed near 52-week extremes indicate a significant price movement, with some stocks reaching new highs and others hitting lows. The stocks at 52-week highs include BMY, BAX, IEX, TECH, and PFG, all within 0.1% of their highs. Conversely, ROL, PSKY, LKQ, SNPS, and LII are near their 52-week lows, with the latter four stocks slightly above their lows.
The presence of stocks like BMY and BAX near 52-week highs may suggest sector rotation into healthcare and industrials. Meanwhile, the stocks near 52-week lows, such as LKQ and LII, are from various sectors, including industrials and technology. This mixed signal may indicate a complex macroeconomic environment with diverse drivers.
Key levels to watch include the 52-week highs and lows for these stocks. Potential catalysts could be earnings reports, macroeconomic data releases, or sector-specific news. For instance, BMY's proximity to its 52-week high may be influenced by its pharmaceutical pipeline, while LKQ's low may be related to industry trends in automotive parts.
Methodology: All 503 S&P 500 constituents screened. 52-week high = highest daily close over the past 252 trading days (approx. 1 year). 52-week low = lowest daily close over the same period. Distance = (current price / extreme − 1) × 100. Technical indicators computed on up to 1 year of daily OHLCV data.
Disclaimer: For informational purposes only. Not investment advice. Past performance is not indicative of future results.

