S&P 500 52-Week Highs & Lows Radar: Johnson & Johnson (JNJ), Nike, (NKE) and more
MarketsFN Team

S&P 500 52-Week Highs & Lows Radar: Johnson & Johnson (JNJ), Nike, (NKE) and more
Screening all 503 S&P 500 constituents for stocks nearest to their 52-week high and their 52-week low. Data as of August 18, 2026. % Realized = 52-week total return.
Legend: RSI > 70 = overbought · RSI < 30 = oversold · Green % Realized = positive 52W return · Red = negative.
📈 Nearest to 52-Week High
Sectors represented: Healthcare (4), Financial (1)
| Ticker | Company | Sector | Price Last | % Realized | 52-Week High Date | RSI | % above MA200 | Trend |
|---|---|---|---|---|---|---|---|---|
| JNJ | Johnson & Johnson | Healthcare | $270.39 | +53.42% | 2026-08-18 | 65.7 | +17.5% | Above MA20, MA50, MA200 |
| MRK | Merck & Co Inc | Healthcare | $137.76 | +63.58% | 2026-08-18 | 71.7 | +20.8% | Above MA20, MA50, MA200 |
| SCHW | Charles Schwab Corp | Financial | $111.58 | +16.02% | 2026-08-18 | 76.6 | +15.8% | Above MA20, MA50, MA200 |
| AMGN | AMGEN Inc | Healthcare | $424.94 | +45.22% | 2026-08-18 | 74.2 | +21.4% | Above MA20, MA50, MA200 |
| BMY | Bristol-Myers Squibb Co | Healthcare | $66.21 | +37.39% | 2026-08-18 | 64.6 | +16.7% | Above MA20, MA50, MA200 |
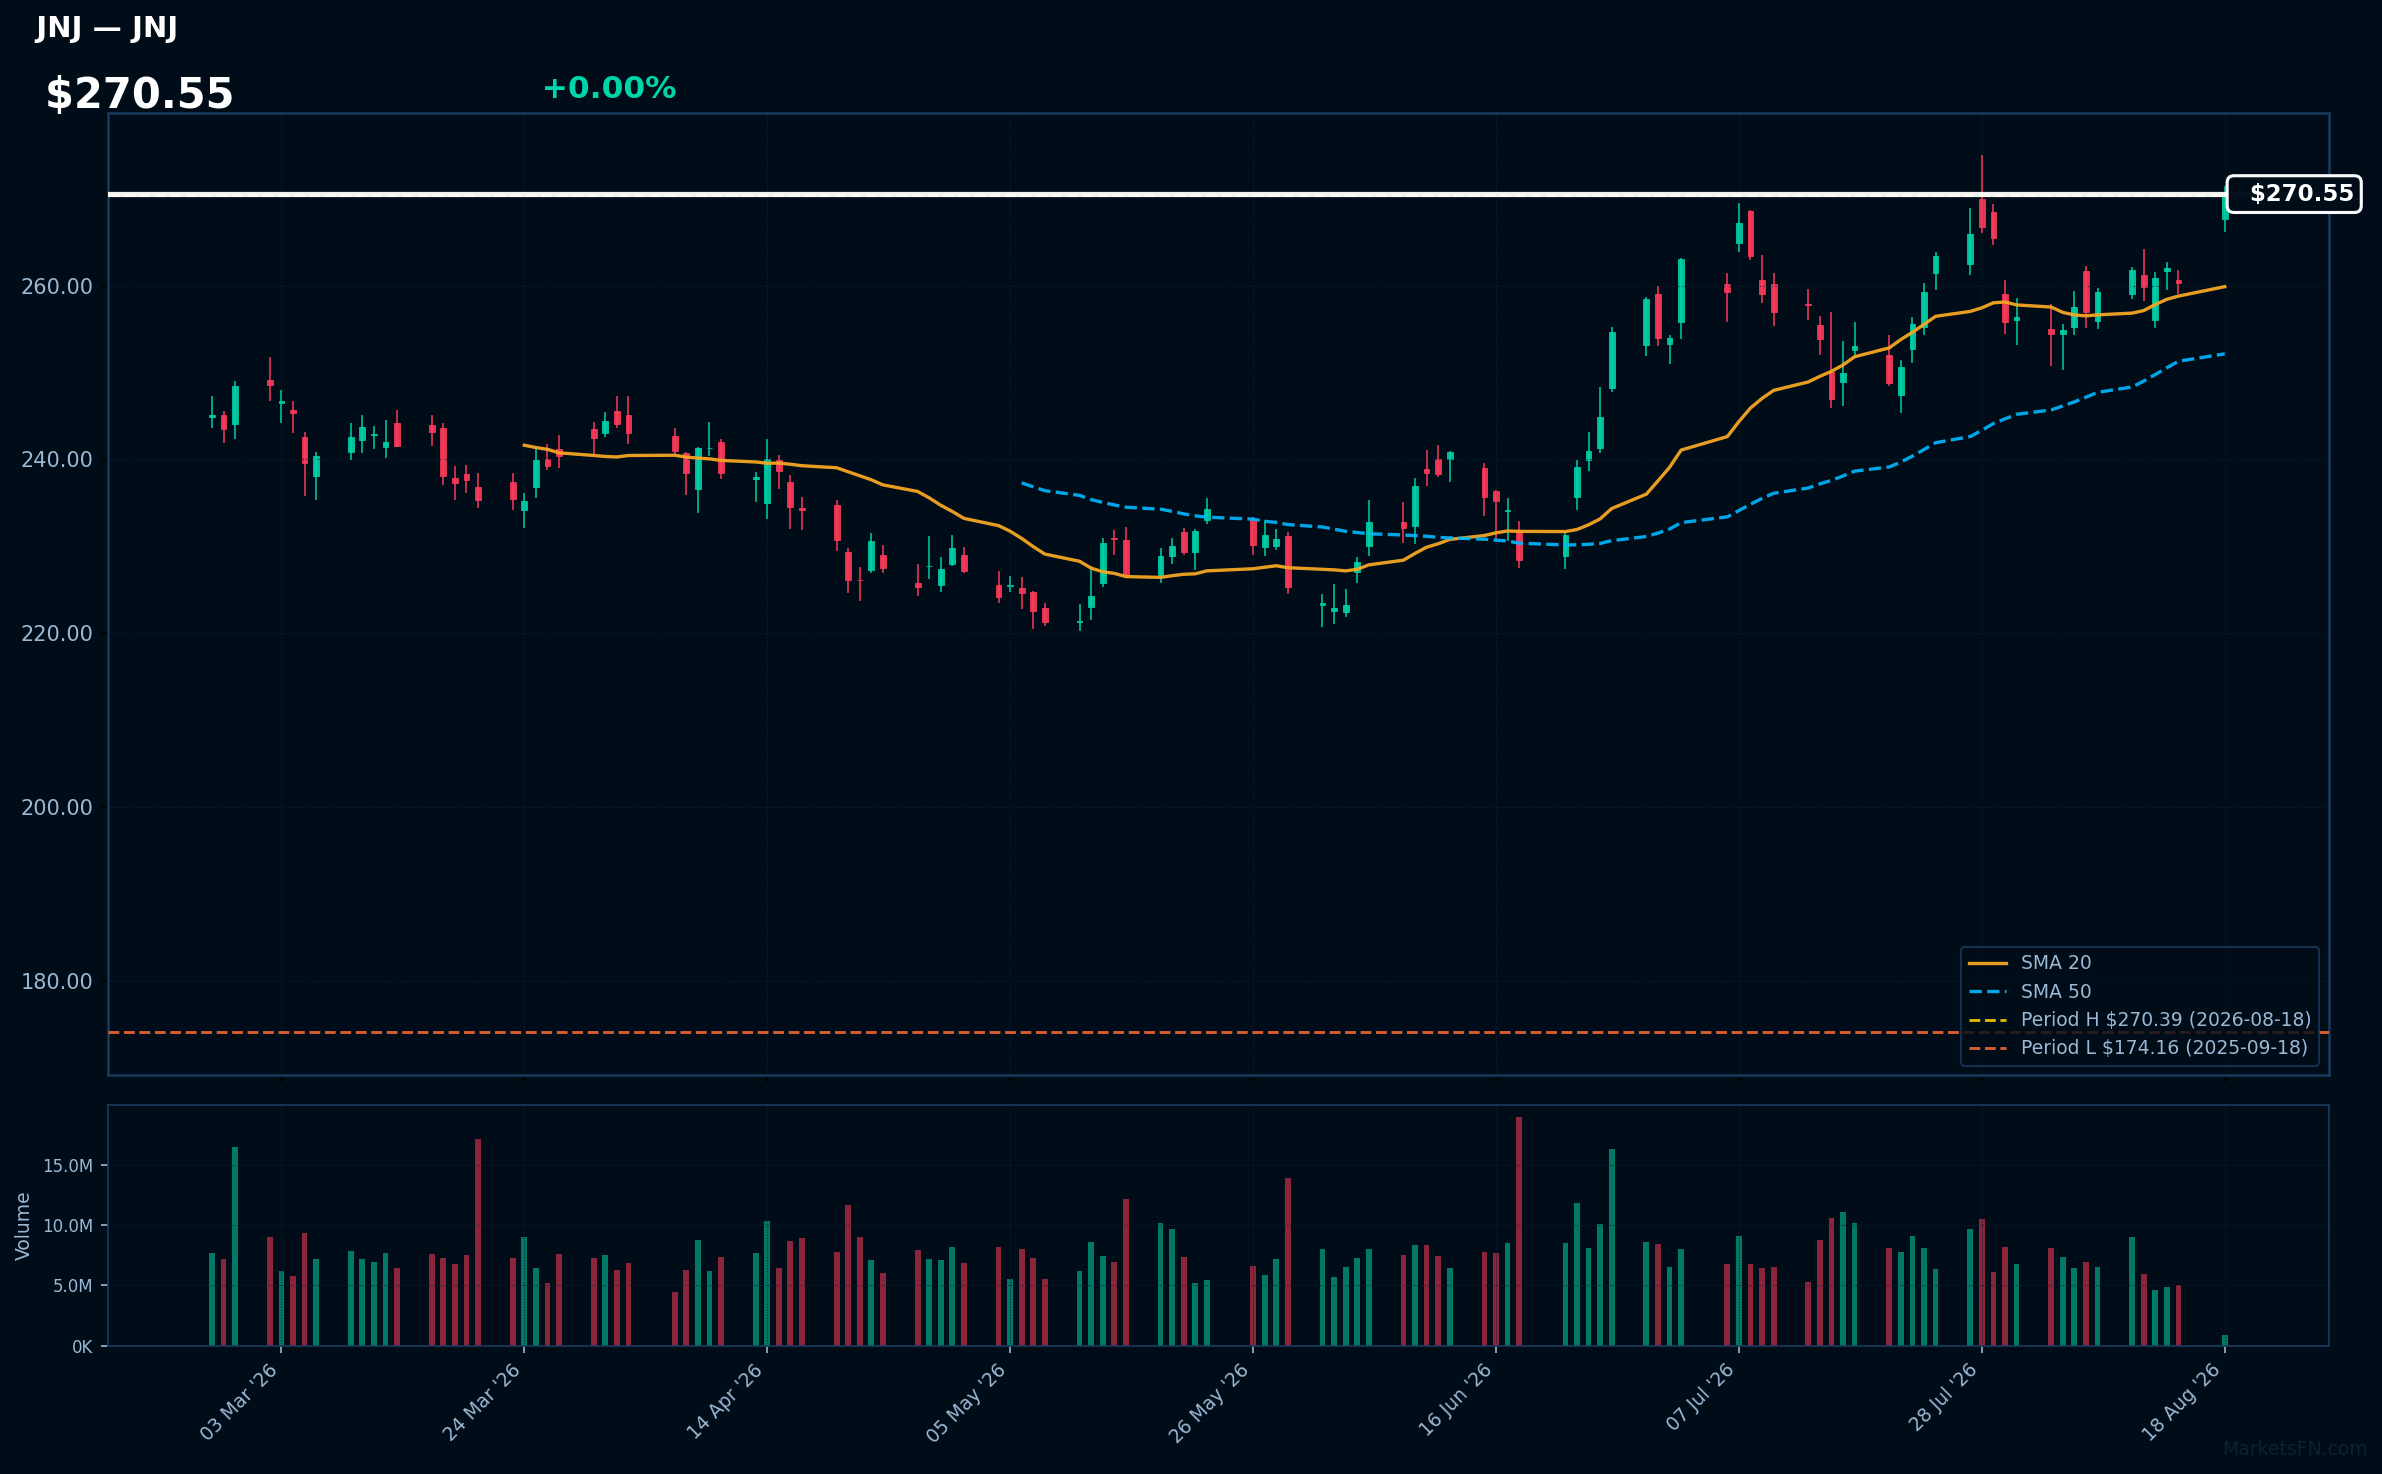
JNJ | Johnson & Johnson | Healthcare | Price Last: $270.39 | % Realized: +53.42% | RSI: 65.7 | % above MA200: +17.5% | Trend: Above MA20, MA50, MA200
Johnson & Johnson develops medical devices, pharmaceuticals, and consumer health products. Its diverse portfolio, including vaccines and surgical equipment, positions it as a leader in healthcare, making it attractive for investors seeking stability and growth in a resilient sector.
The current technical situation shows bullish momentum with an RSI(14) of 65.7 and a strong MA alignment: price > MA20 > MA50 > MA200, indicating a sustained uptrend and proximity to a breakout level.
Related headlines

MRK | Merck & Co Inc | Healthcare | Price Last: $137.76 | % Realized: +63.58% | RSI: 71.7 | % above MA200: +20.8% | Trend: Above MA20, MA50, MA200
Merck & Co Inc develops innovative pharmaceuticals and vaccines, focusing on areas like oncology, infectious diseases, and vaccines. Investors should care due to its strong pipeline and market position, which can drive future growth and profitability.
The current technical situation shows bullish momentum with an RSI(14) of 71.7 and a bullish MA alignment: price > MA20 > MA50 > MA200, indicating a sustained uptrend.
Related headlines
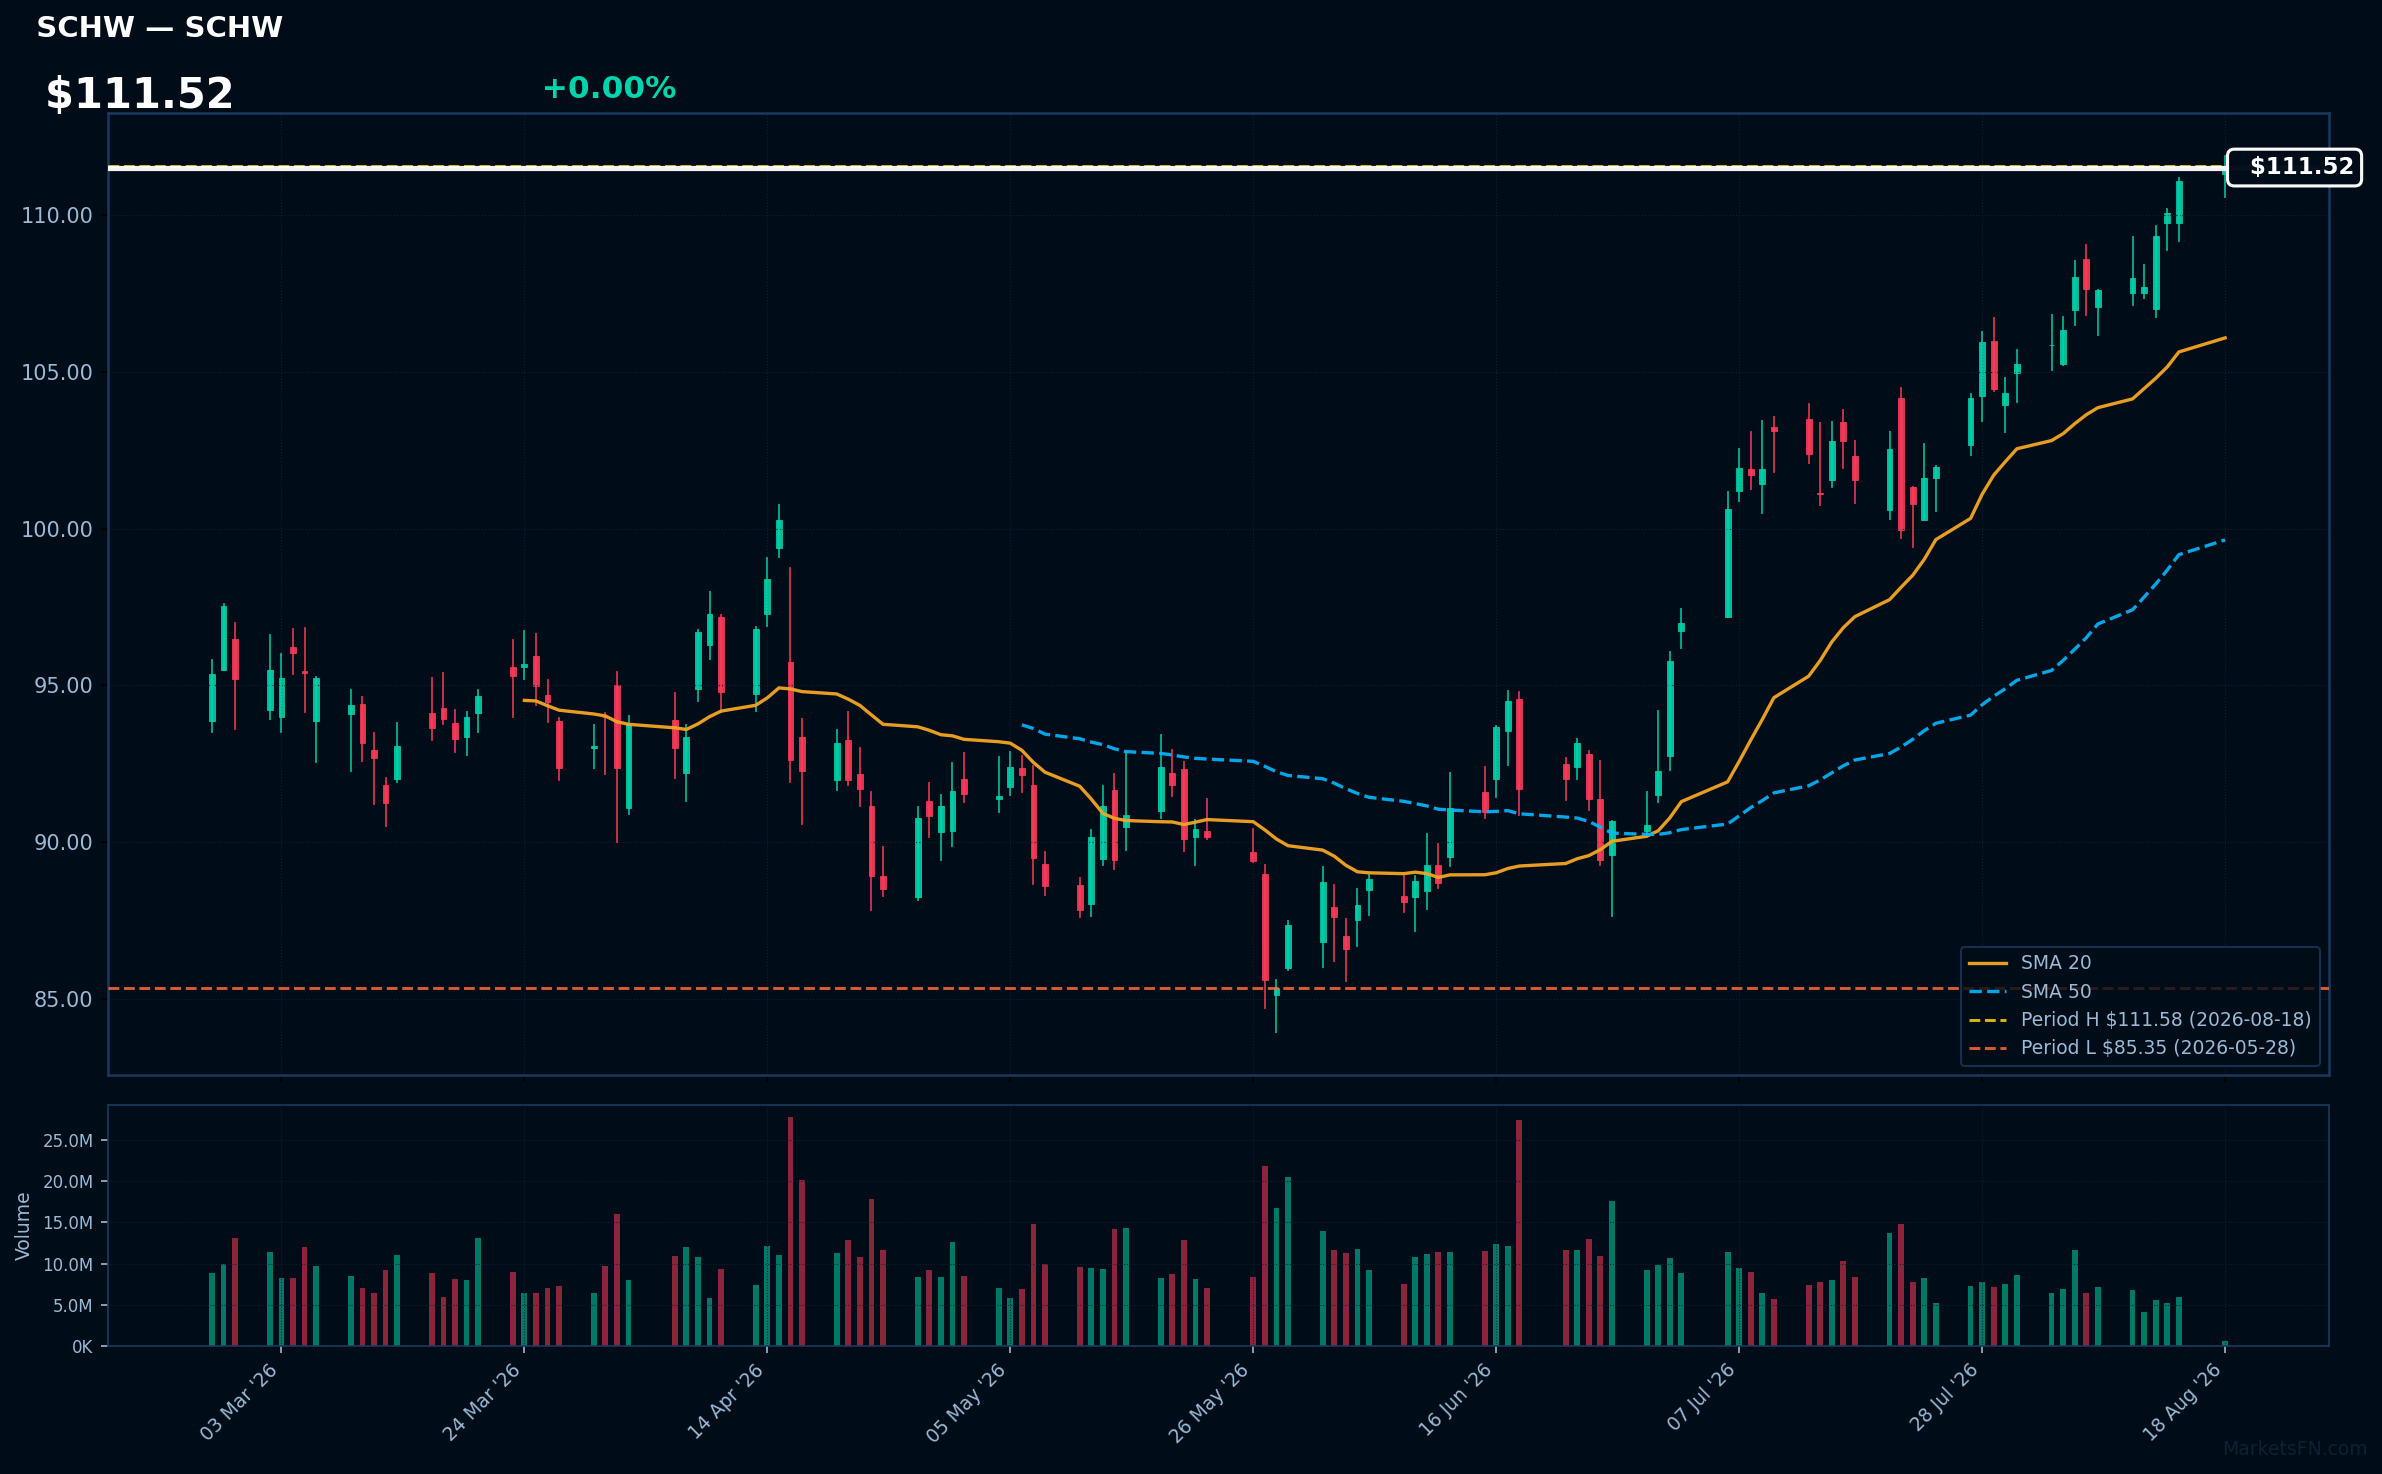
SCHW | Charles Schwab Corp | Financial | Price Last: $111.58 | % Realized: +16.02% | RSI: 76.6 | % above MA200: +15.8% | Trend: Above MA20, MA50, MA200
Charles Schwab Corp provides brokerage and banking services, focusing on investment management and financial planning. Investors should care due to its significant market position and innovative technology, which enhance customer experience and drive growth in a competitive financial landscape.
The current technical situation indicates strong momentum, with an RSI(14) of 76.6 and a bullish MA alignment: price > MA20 > MA50 > MA200. The stock is also 0.0% below its 52-Week high, signaling a potential breakout.
Related headlines
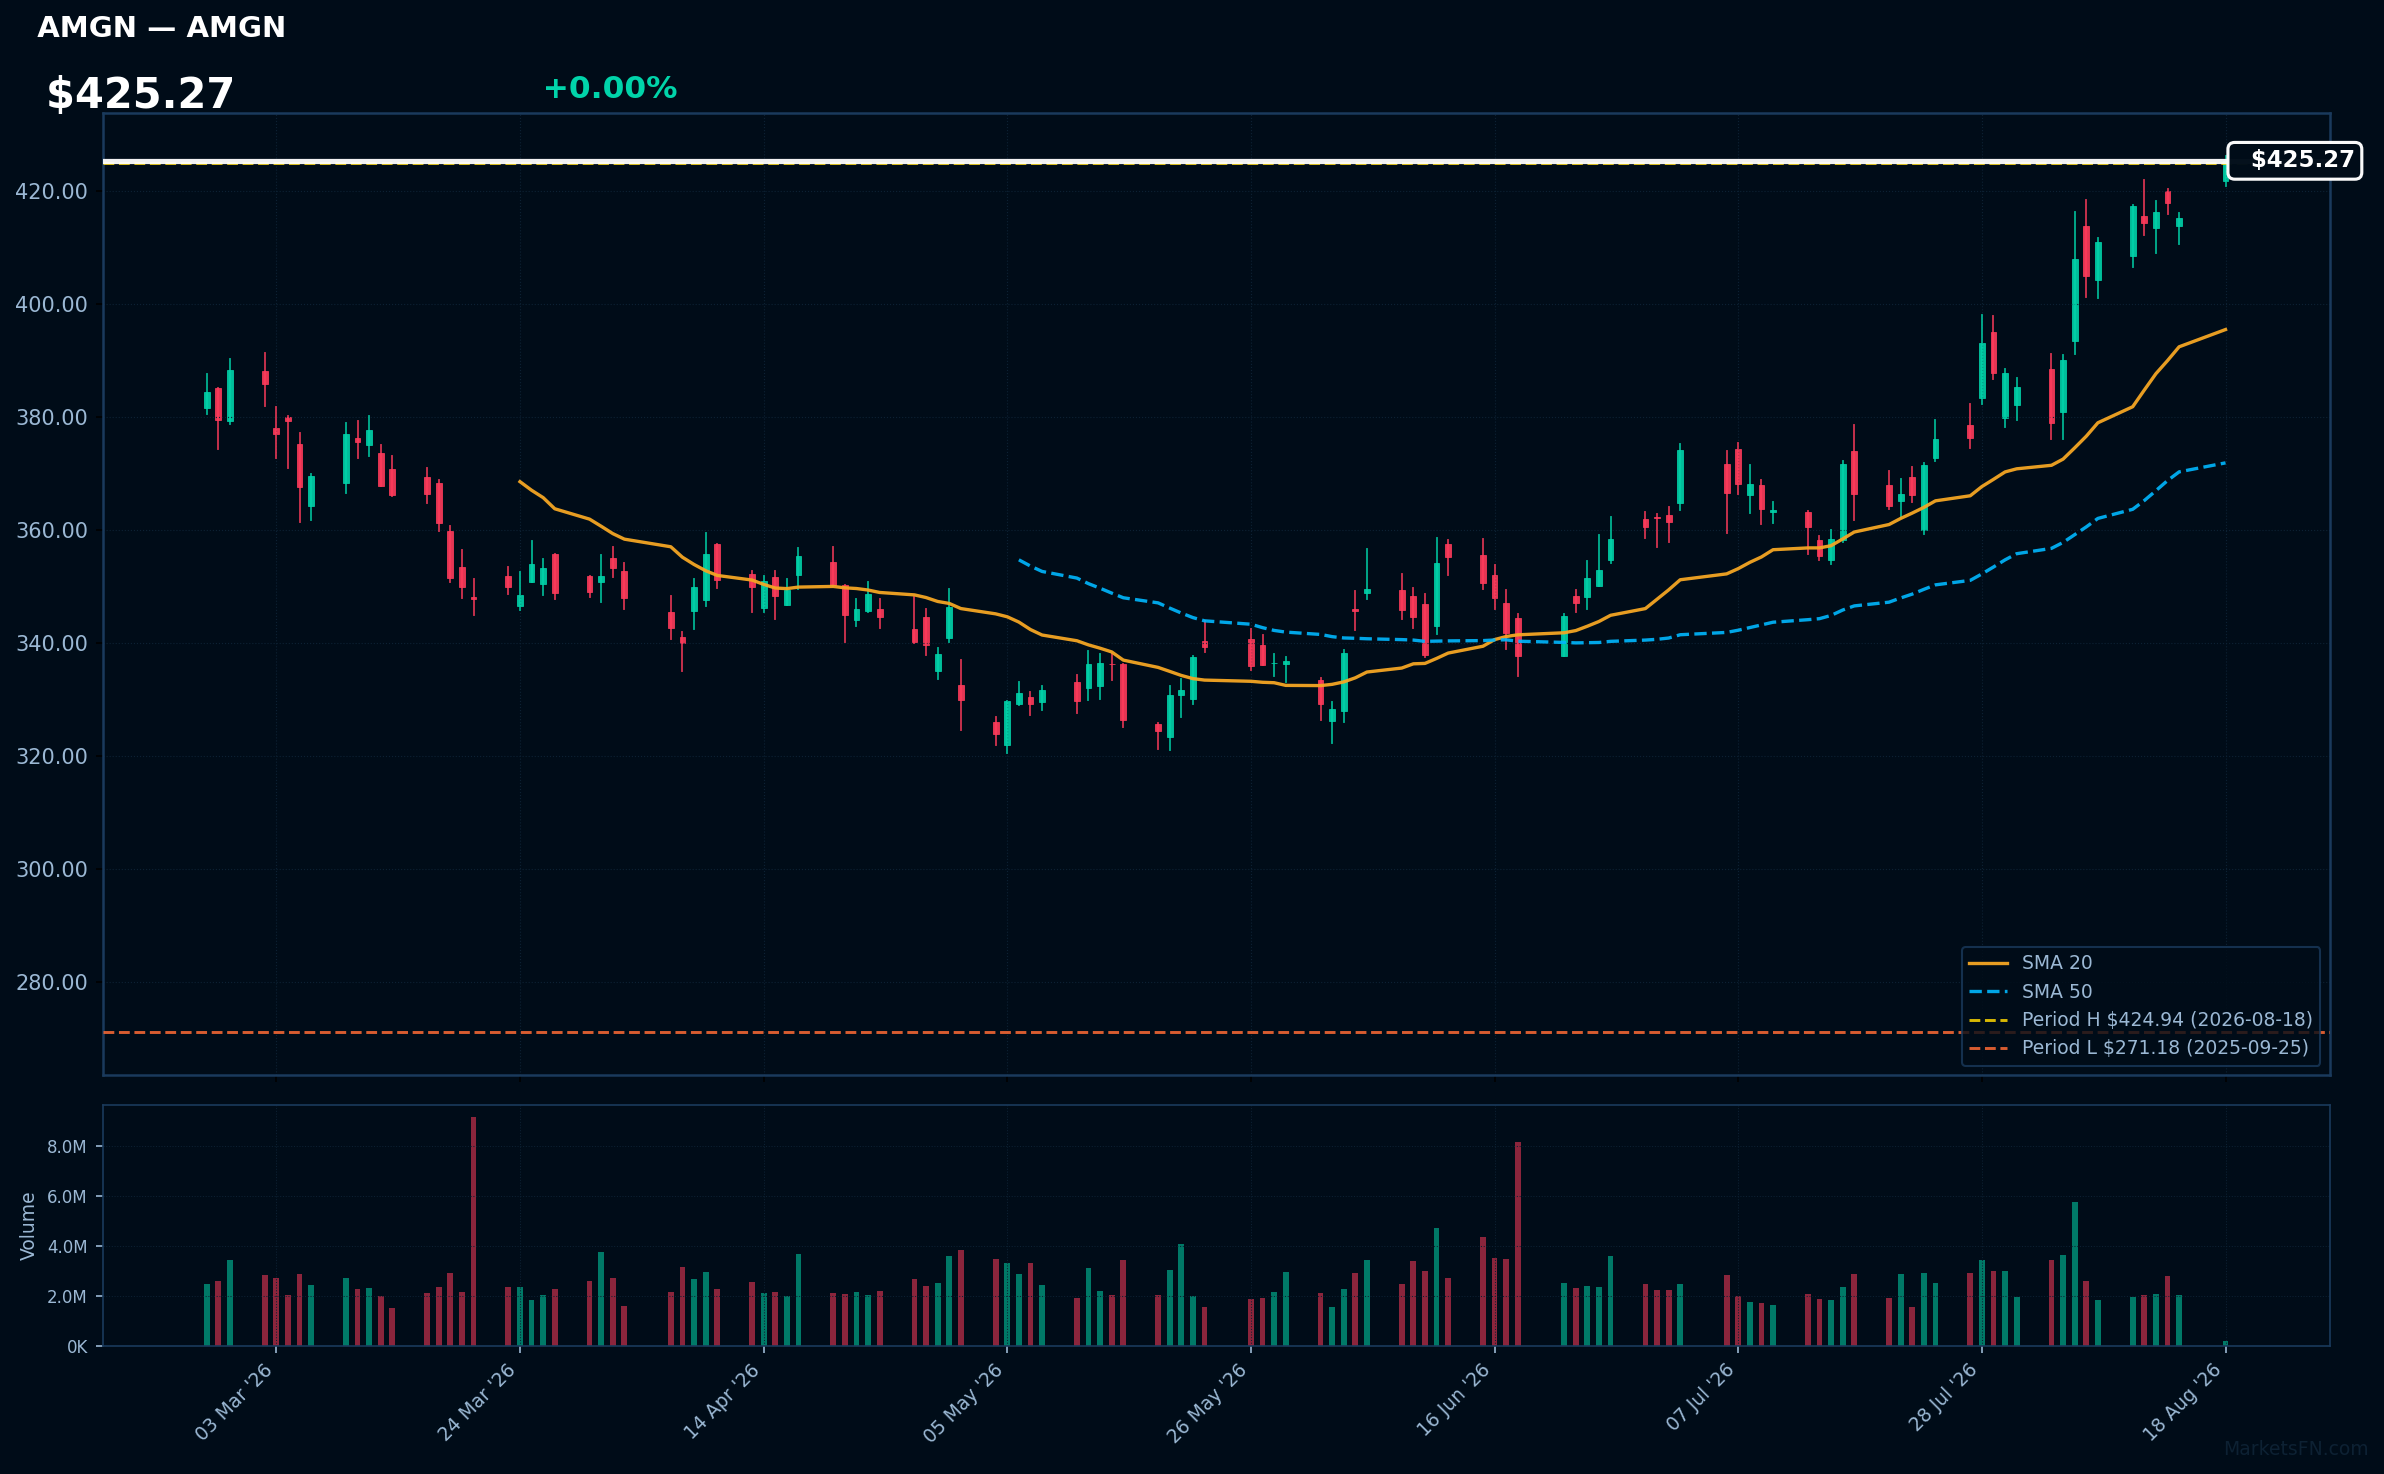
AMGN | AMGEN Inc | Healthcare | Price Last: $424.94 | % Realized: +45.22% | RSI: 74.2 | % above MA200: +21.4% | Trend: Above MA20, MA50, MA200
AMGEN Inc (AMGN) is a biotechnology company that develops innovative therapies for serious illnesses, focusing on areas like oncology and cardiovascular disease. Investors should care due to its strong pipeline and market position, which can drive future growth and profitability.
AMGN shows bullish momentum with an RSI(14) of 74.2 and a strong MA alignment: price > MA20 > MA50 > MA200. The stock is 0.0% below its 52-Week high, indicating a potential breakout level.
Related headlines
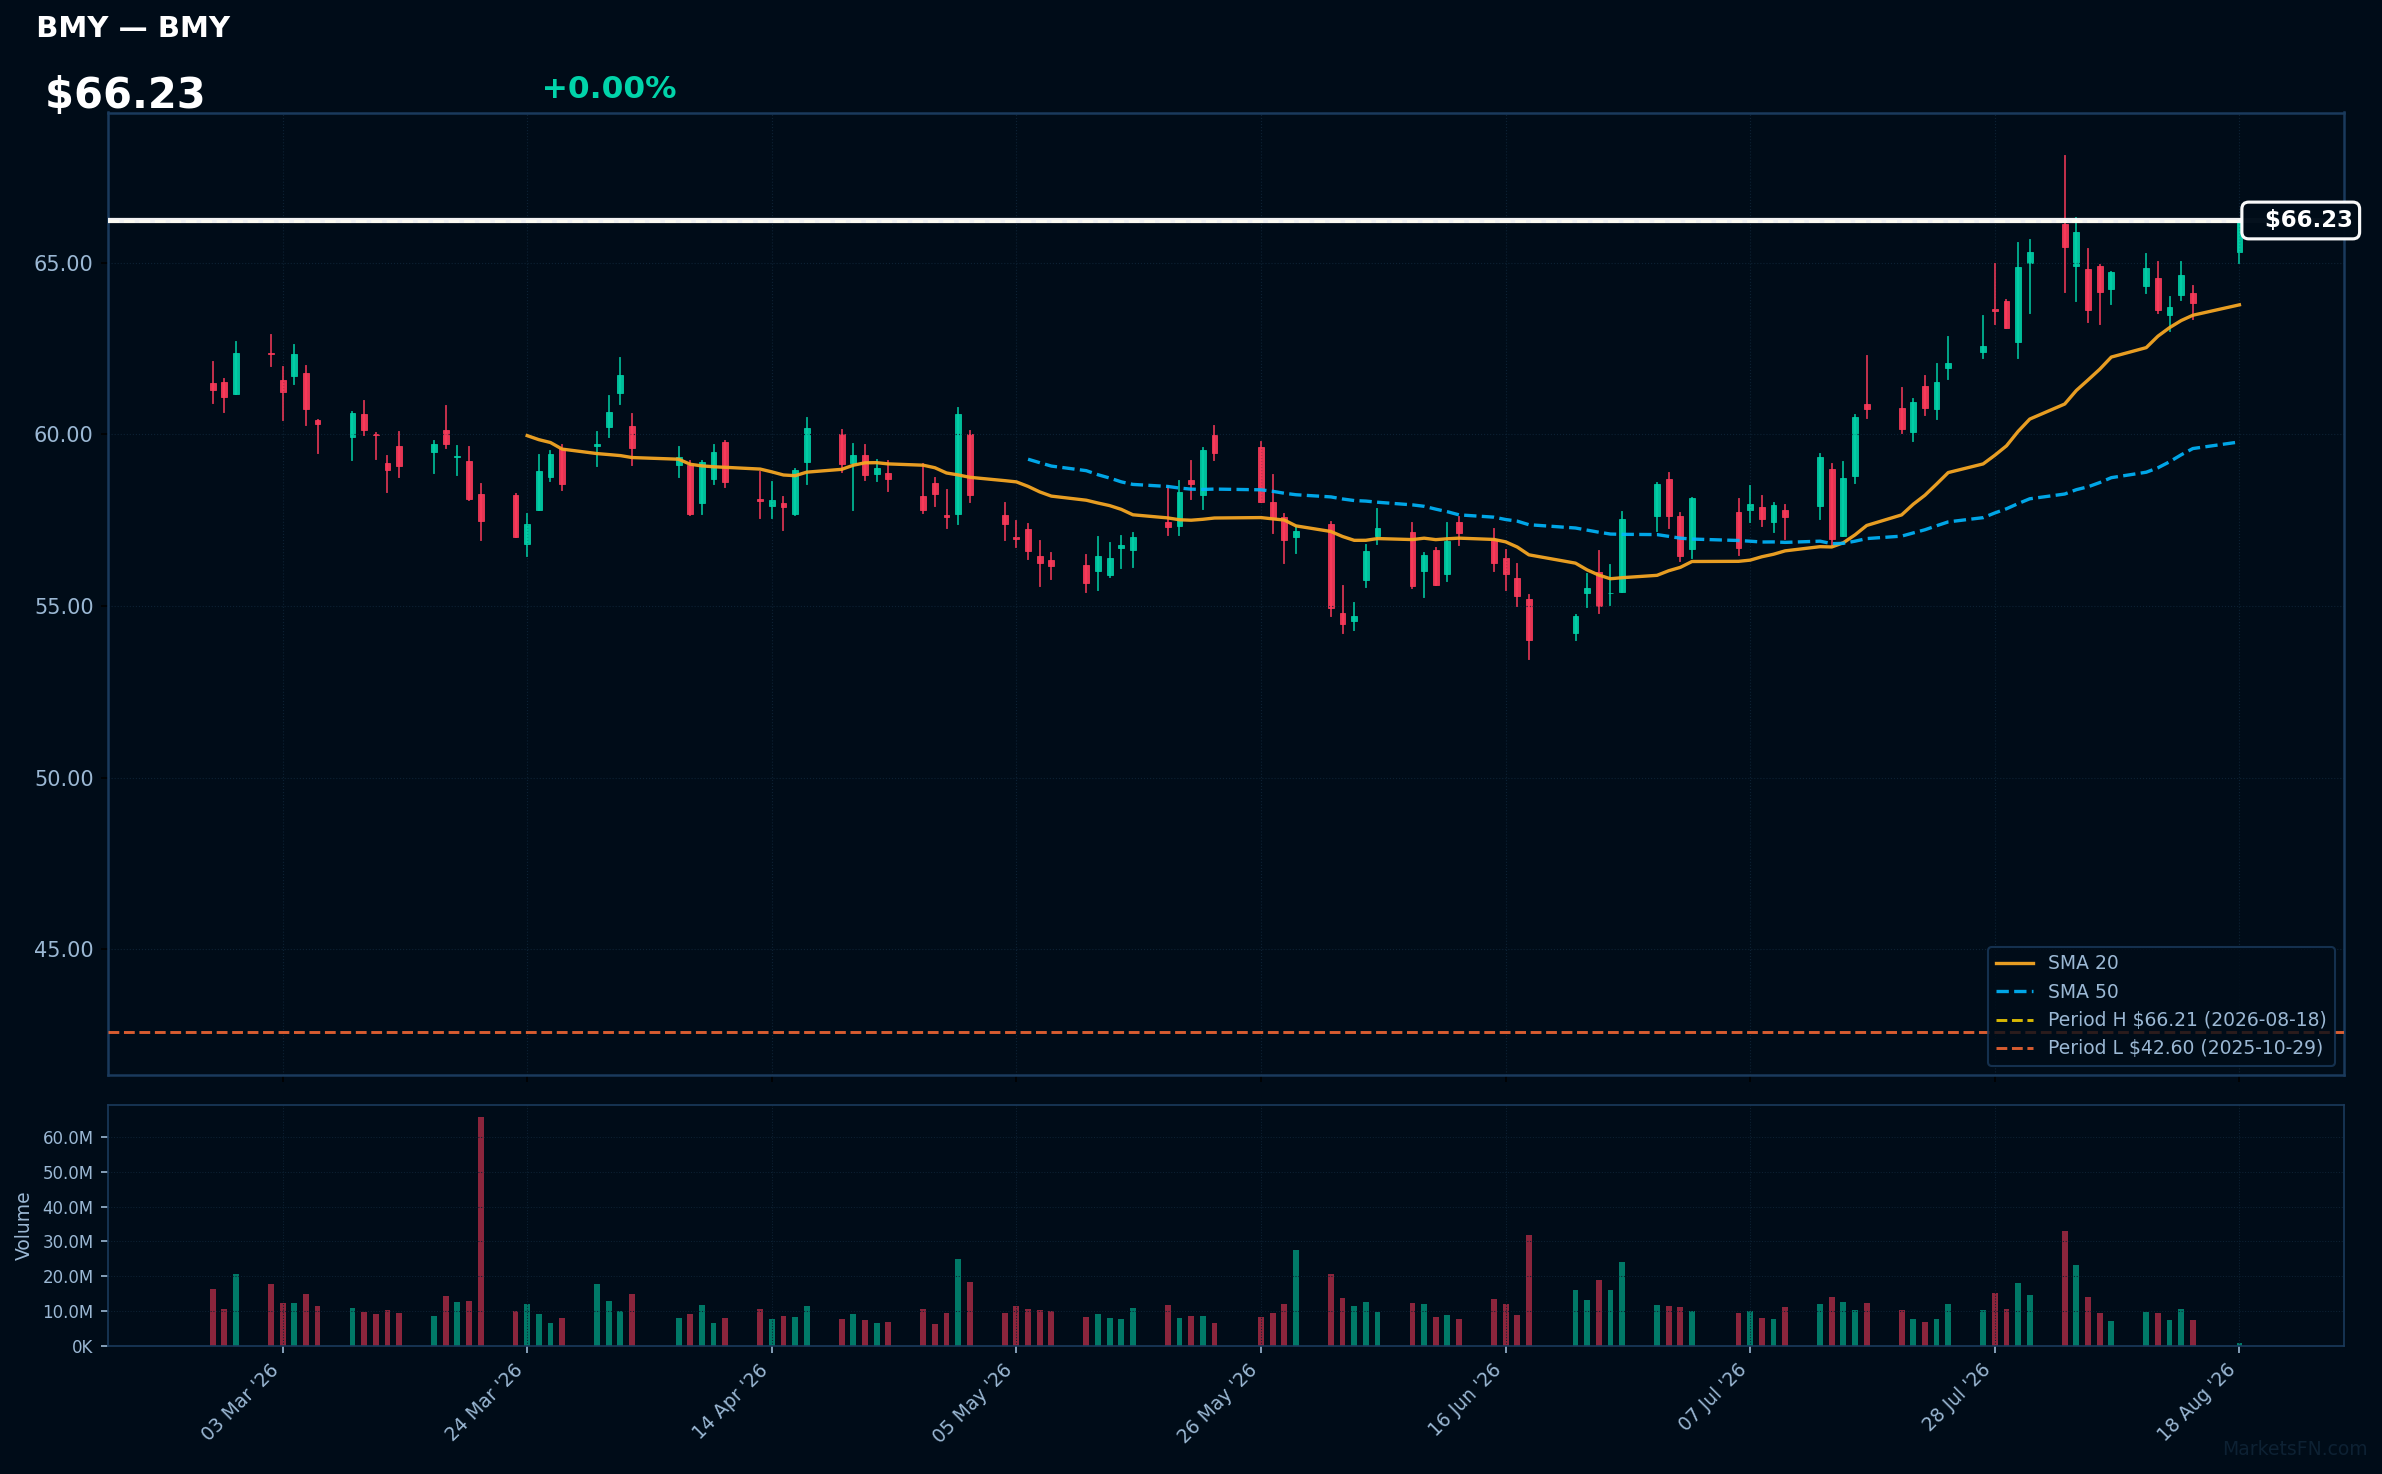
BMY | Bristol-Myers Squibb Co | Healthcare | Price Last: $66.21 | % Realized: +37.39% | RSI: 64.6 | % above MA200: +16.7% | Trend: Above MA20, MA50, MA200
Bristol-Myers Squibb Co develops innovative pharmaceuticals, focusing on oncology, immunology, and cardiovascular diseases. Investors should care due to its strong pipeline and market position, which can drive future growth and profitability.
The current technical situation shows bullish momentum with an RSI(14) of 64.6 and a bullish MA alignment: price > MA20 > MA50 > MA200, indicating a sustained uptrend.
Related headlines
- Why Did AMZN, SNOW, BMY Stocks Surge To 52-Week Highs Today?
- MRNA, LNTH, BMY, CAPR, RARE Stocks In Focus These FDA Decisions Could Shape August Trading
- Bristol-Myers Squibb and AstraZeneca said to discuss megamerger - can it happen?
- AstraZeneca tie-up talks with Bristol-Myers Squibb are moving stocks. Analysts are puzzled.
📉 Nearest to 52-Week Low
Sectors represented: Consumer Cyclical (2), Industrials (1), Communication Services (1), Real Estate (1)
| Ticker | Company | Sector | Price Last | % Realized | 52-Week Low Date | RSI | % above MA200 | Trend |
|---|---|---|---|---|---|---|---|---|
| NKE | Nike, Inc | Consumer Cyclical | $39.41 | -49.10% | 2026-08-18 | 36.9 | -25.8% | Below MA20, MA50, MA200 |
| ROL | Rollins, Inc | Consumer Cyclical | $36.03 | -36.89% | 2026-08-18 | 25.7 | -33.0% | Below MA20, MA50, MA200 |
| LII | Lennox International Inc | Industrials | $411.48 | -31.43% | 2026-08-18 | 30.3 | -18.4% | Below MA20, MA50, MA200 |
| EA | Electronic Arts, Inc | Communication Services | $209.70 | +0.38% | 2026-07-17 | — | — | — |
| VICI | VICI Properties Inc | Real Estate | $26.23 | -18.54% | 2026-07-09 | 45.1 | -6.8% | Below MA20, MA50, MA200 |
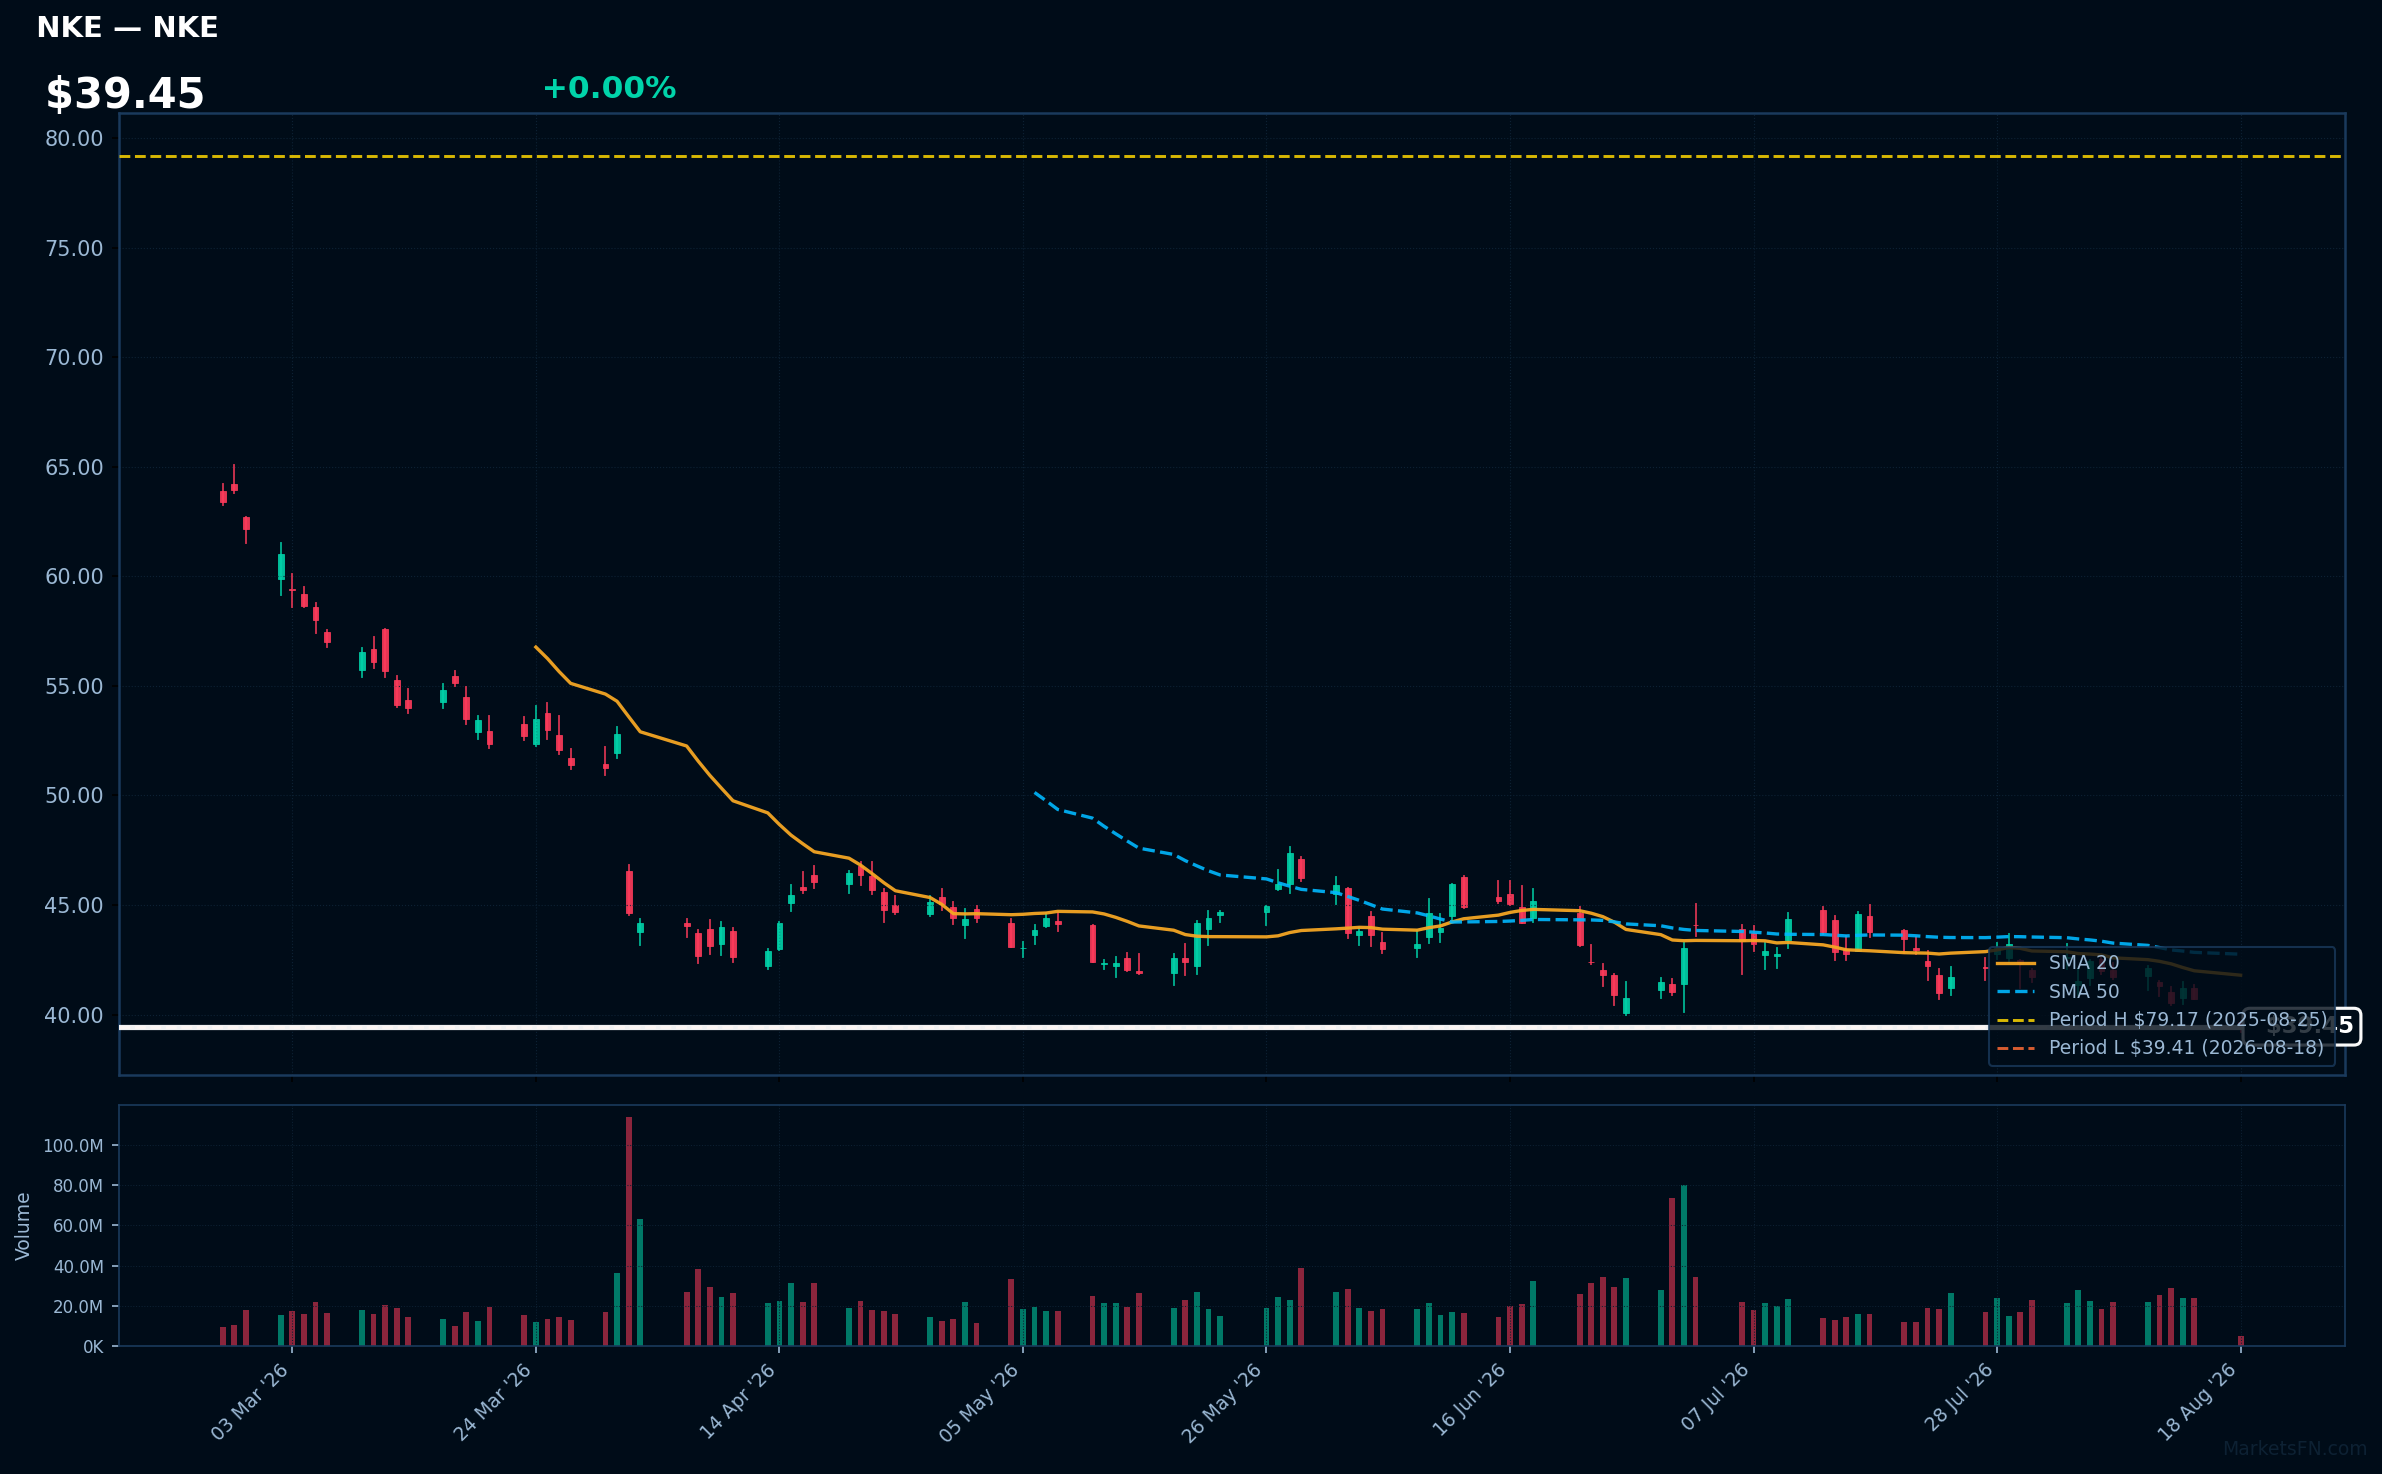
NKE | Nike, Inc | Consumer Cyclical | Price Last: $39.41 | % Realized: -49.10% | RSI: 36.9 | % above MA200: -25.8% | Trend: Below MA20, MA50, MA200
Nike, Inc. designs, develops, and markets athletic footwear, apparel, and equipment. Investors should care due to its strong brand presence and innovation in sportswear, which drive consumer demand and market share in a competitive industry.
The current technical situation indicates a bearish trend with an RSI(14) of 36.9 and a MA alignment of price < MA20 < MA50 < MA200, signaling potential weakness and testing major support just 0.0% above its 52-Week low.
Related headlines
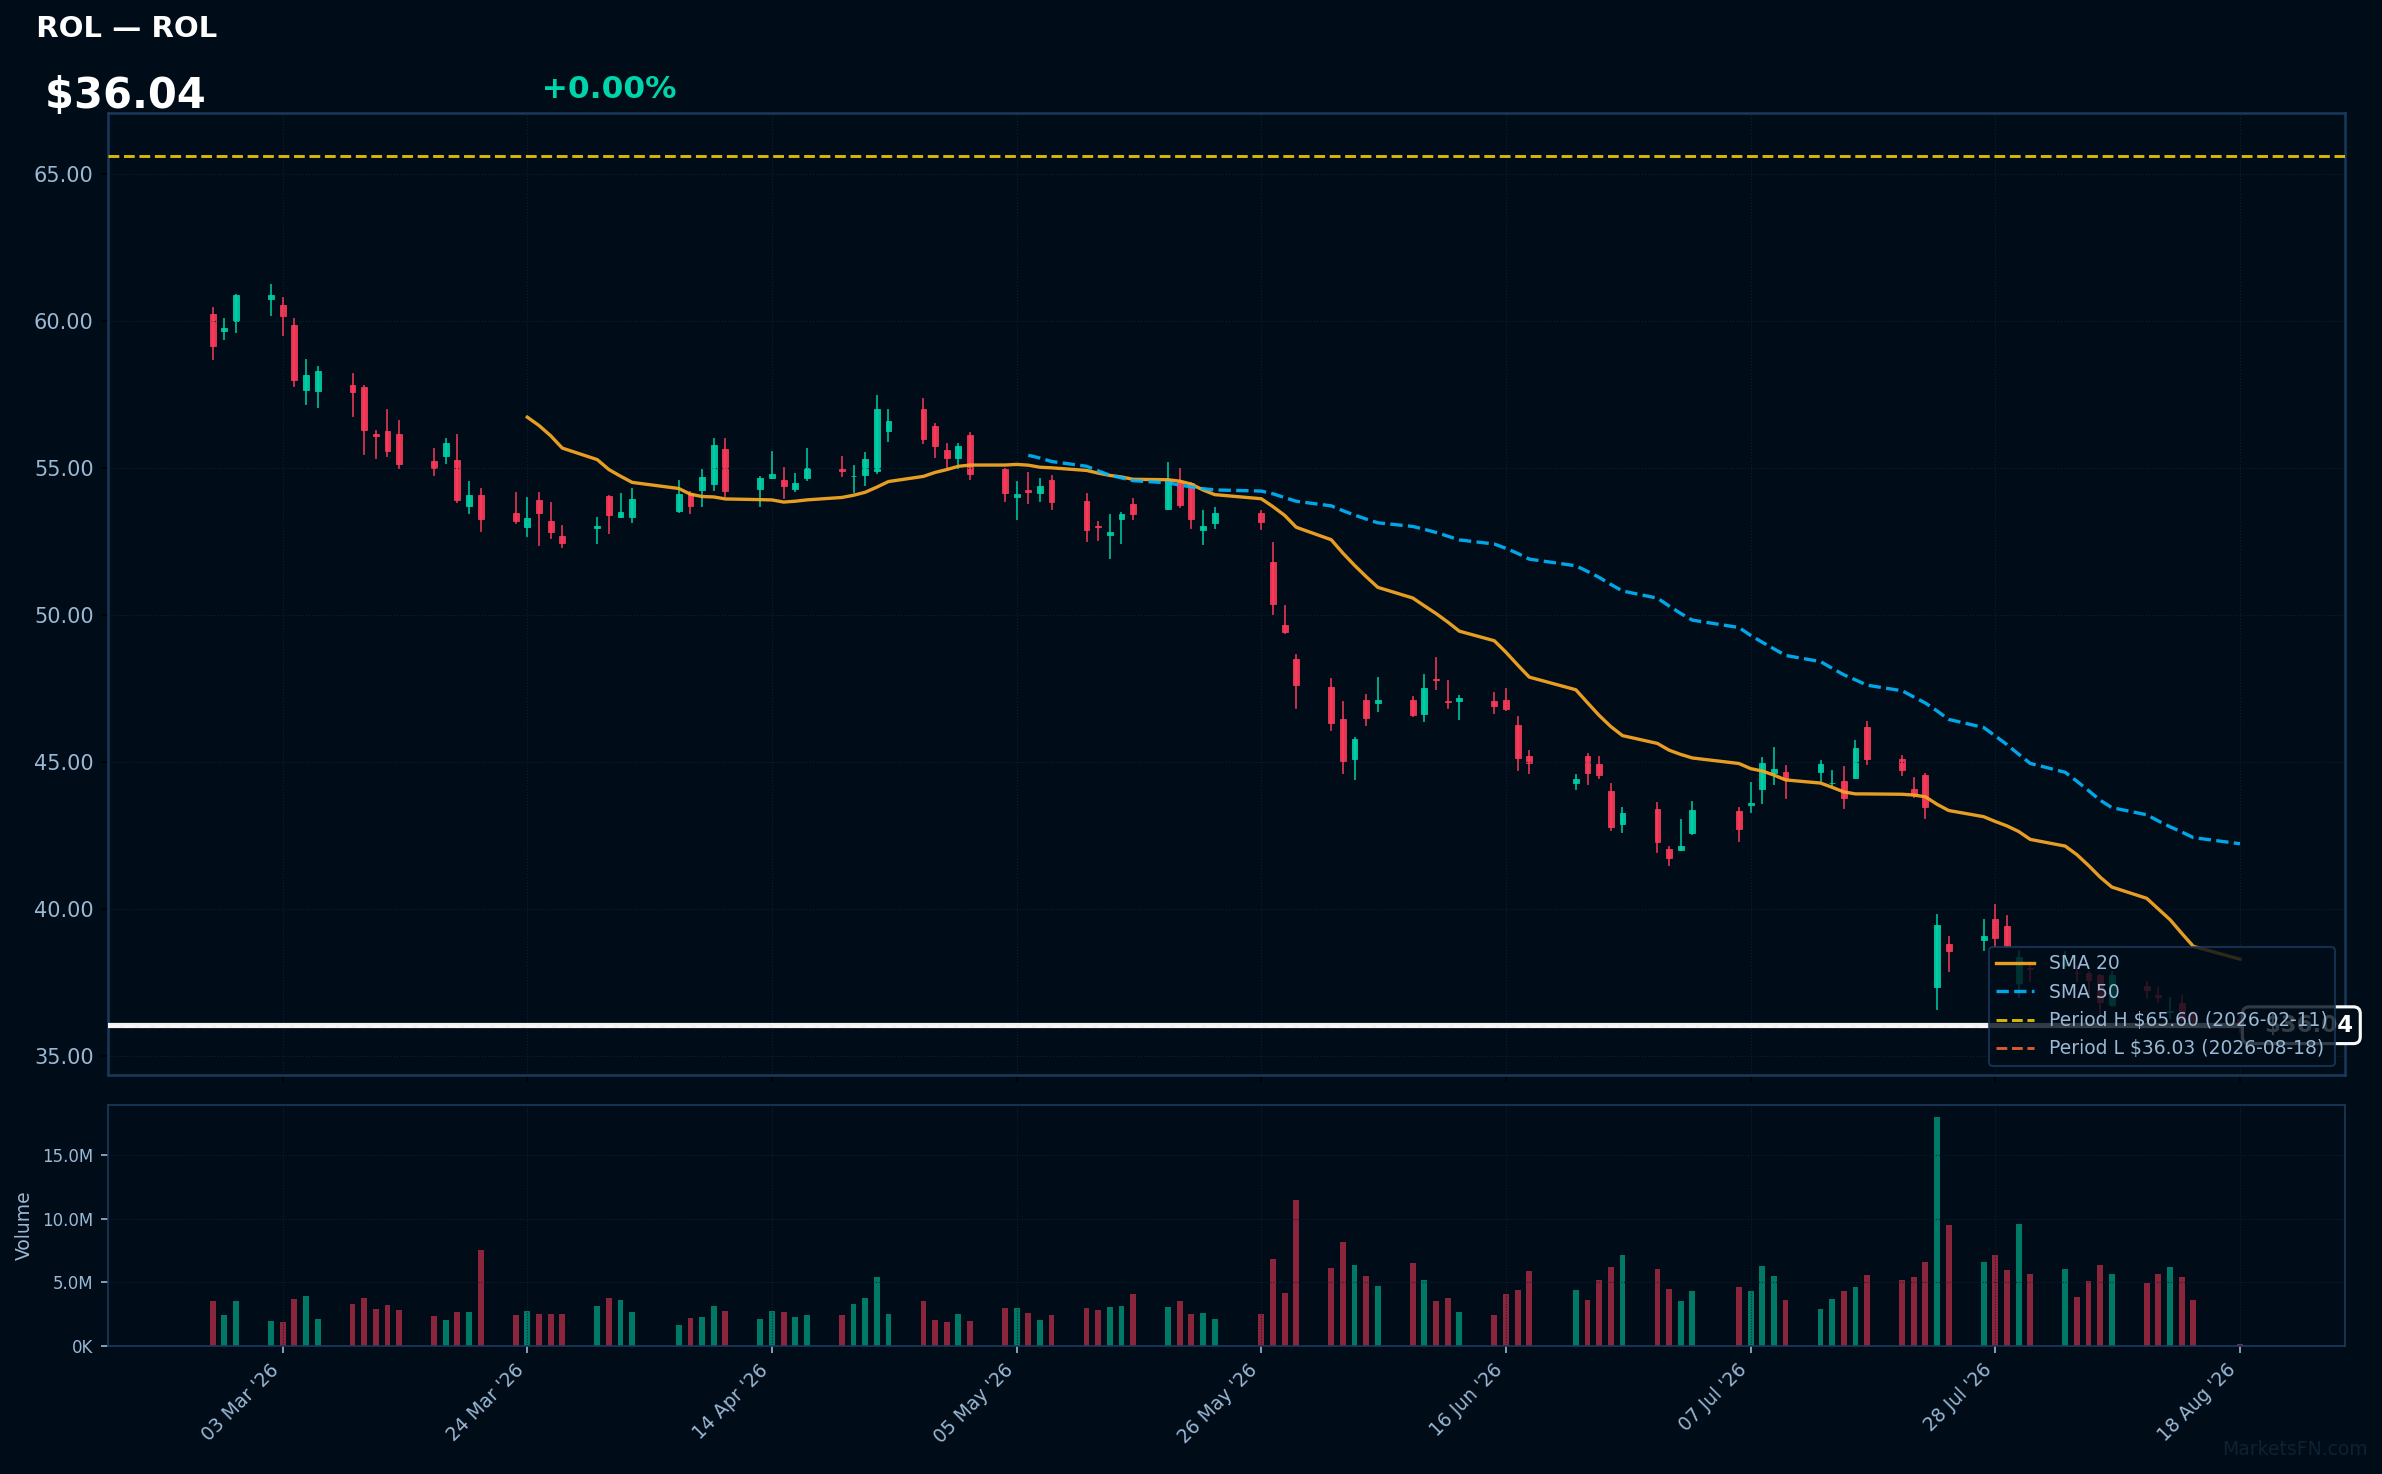
ROL | Rollins, Inc | Consumer Cyclical | Price Last: $36.03 | % Realized: -36.89% | RSI: 25.7 | % above MA200: -33.0% | Trend: Below MA20, MA50, MA200
Rollins, Inc. provides pest control services and products, operating through subsidiaries like Orkin. Investors should care due to its significant market presence and potential for growth in the pest management industry, which is essential for both residential and commercial sectors.
The current technical situation indicates a warning sign, with an RSI of 25.7 and a bearish MA alignment: price < MA20 < MA50 < MA200, suggesting a sustained downtrend and testing major support just 0.0% above its 52-Week low.
Related headlines
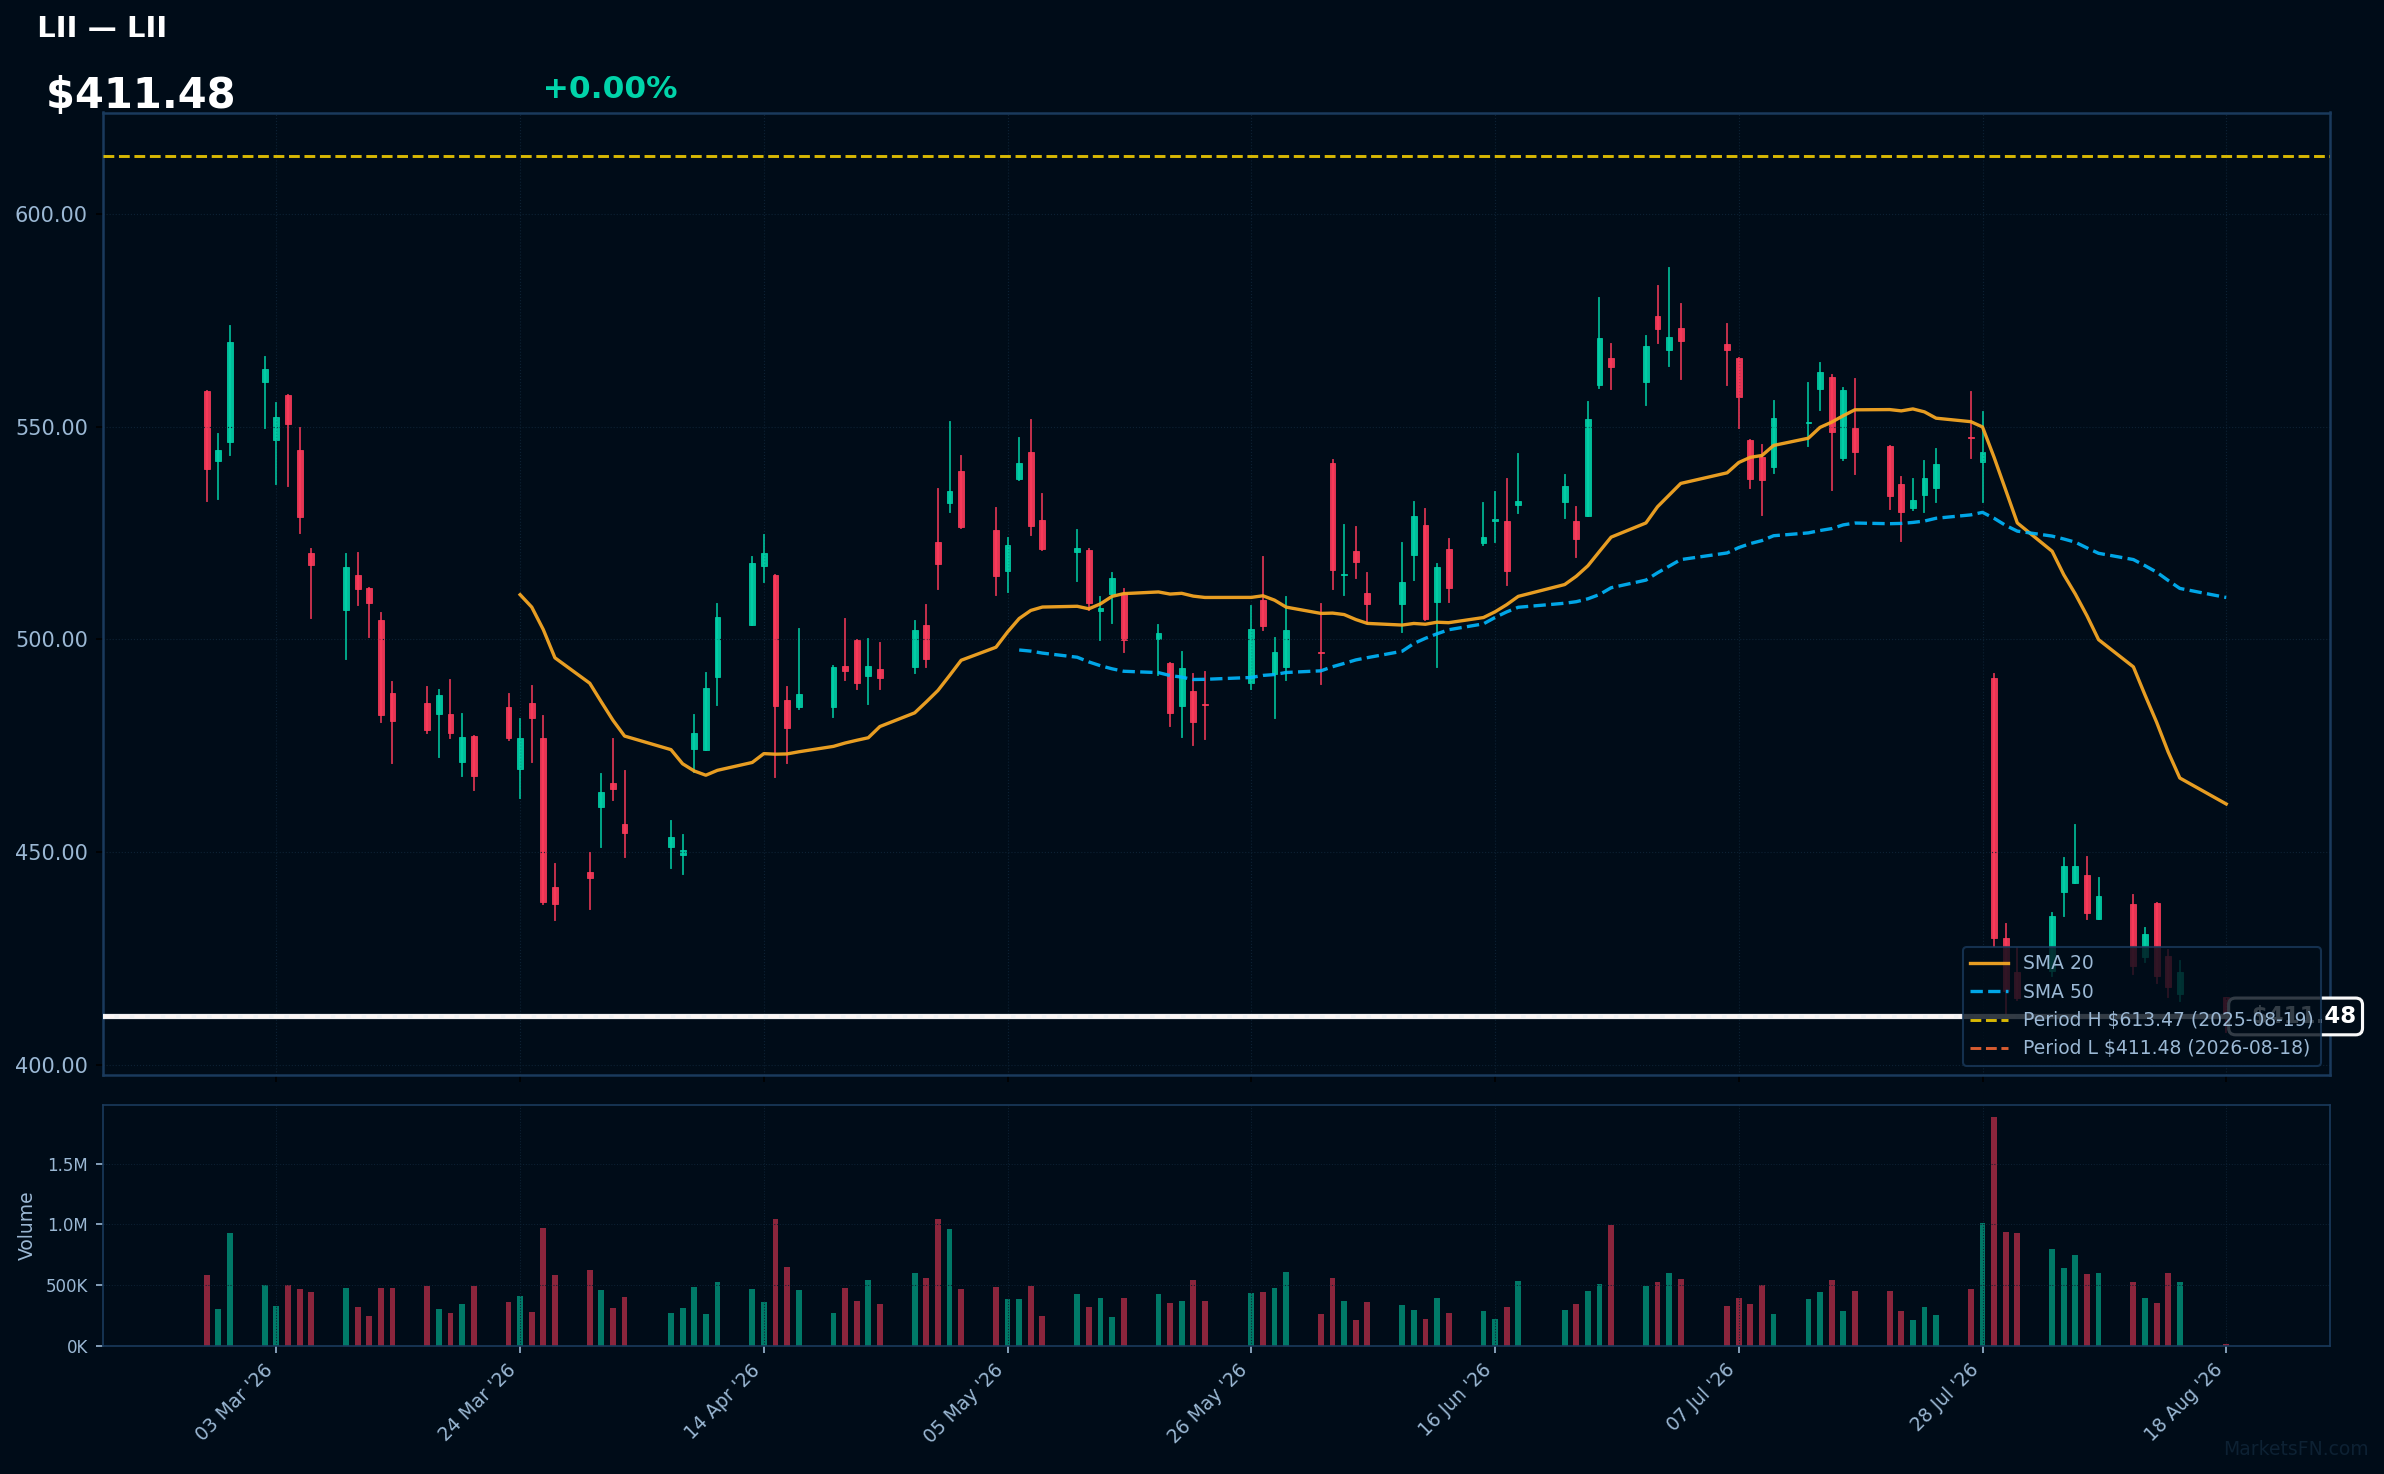
LII | Lennox International Inc | Industrials | Price Last: $411.48 | % Realized: -31.43% | RSI: 30.3 | % above MA200: -18.4% | Trend: Below MA20, MA50, MA200
Lennox International Inc designs and manufactures heating, ventilation, air conditioning, and refrigeration systems. Investors should care due to its significant role in the HVAC market, which is critical for energy efficiency and climate control, especially amid rising demand for sustainable solutions.
The current technical situation shows mixed signals with an RSI(14) of 30.3, indicating potential oversold conditions. The stock is below MA20/MA50/MA200 and is only 0.0% above its 52-Week low, testing major support.
Related headlines
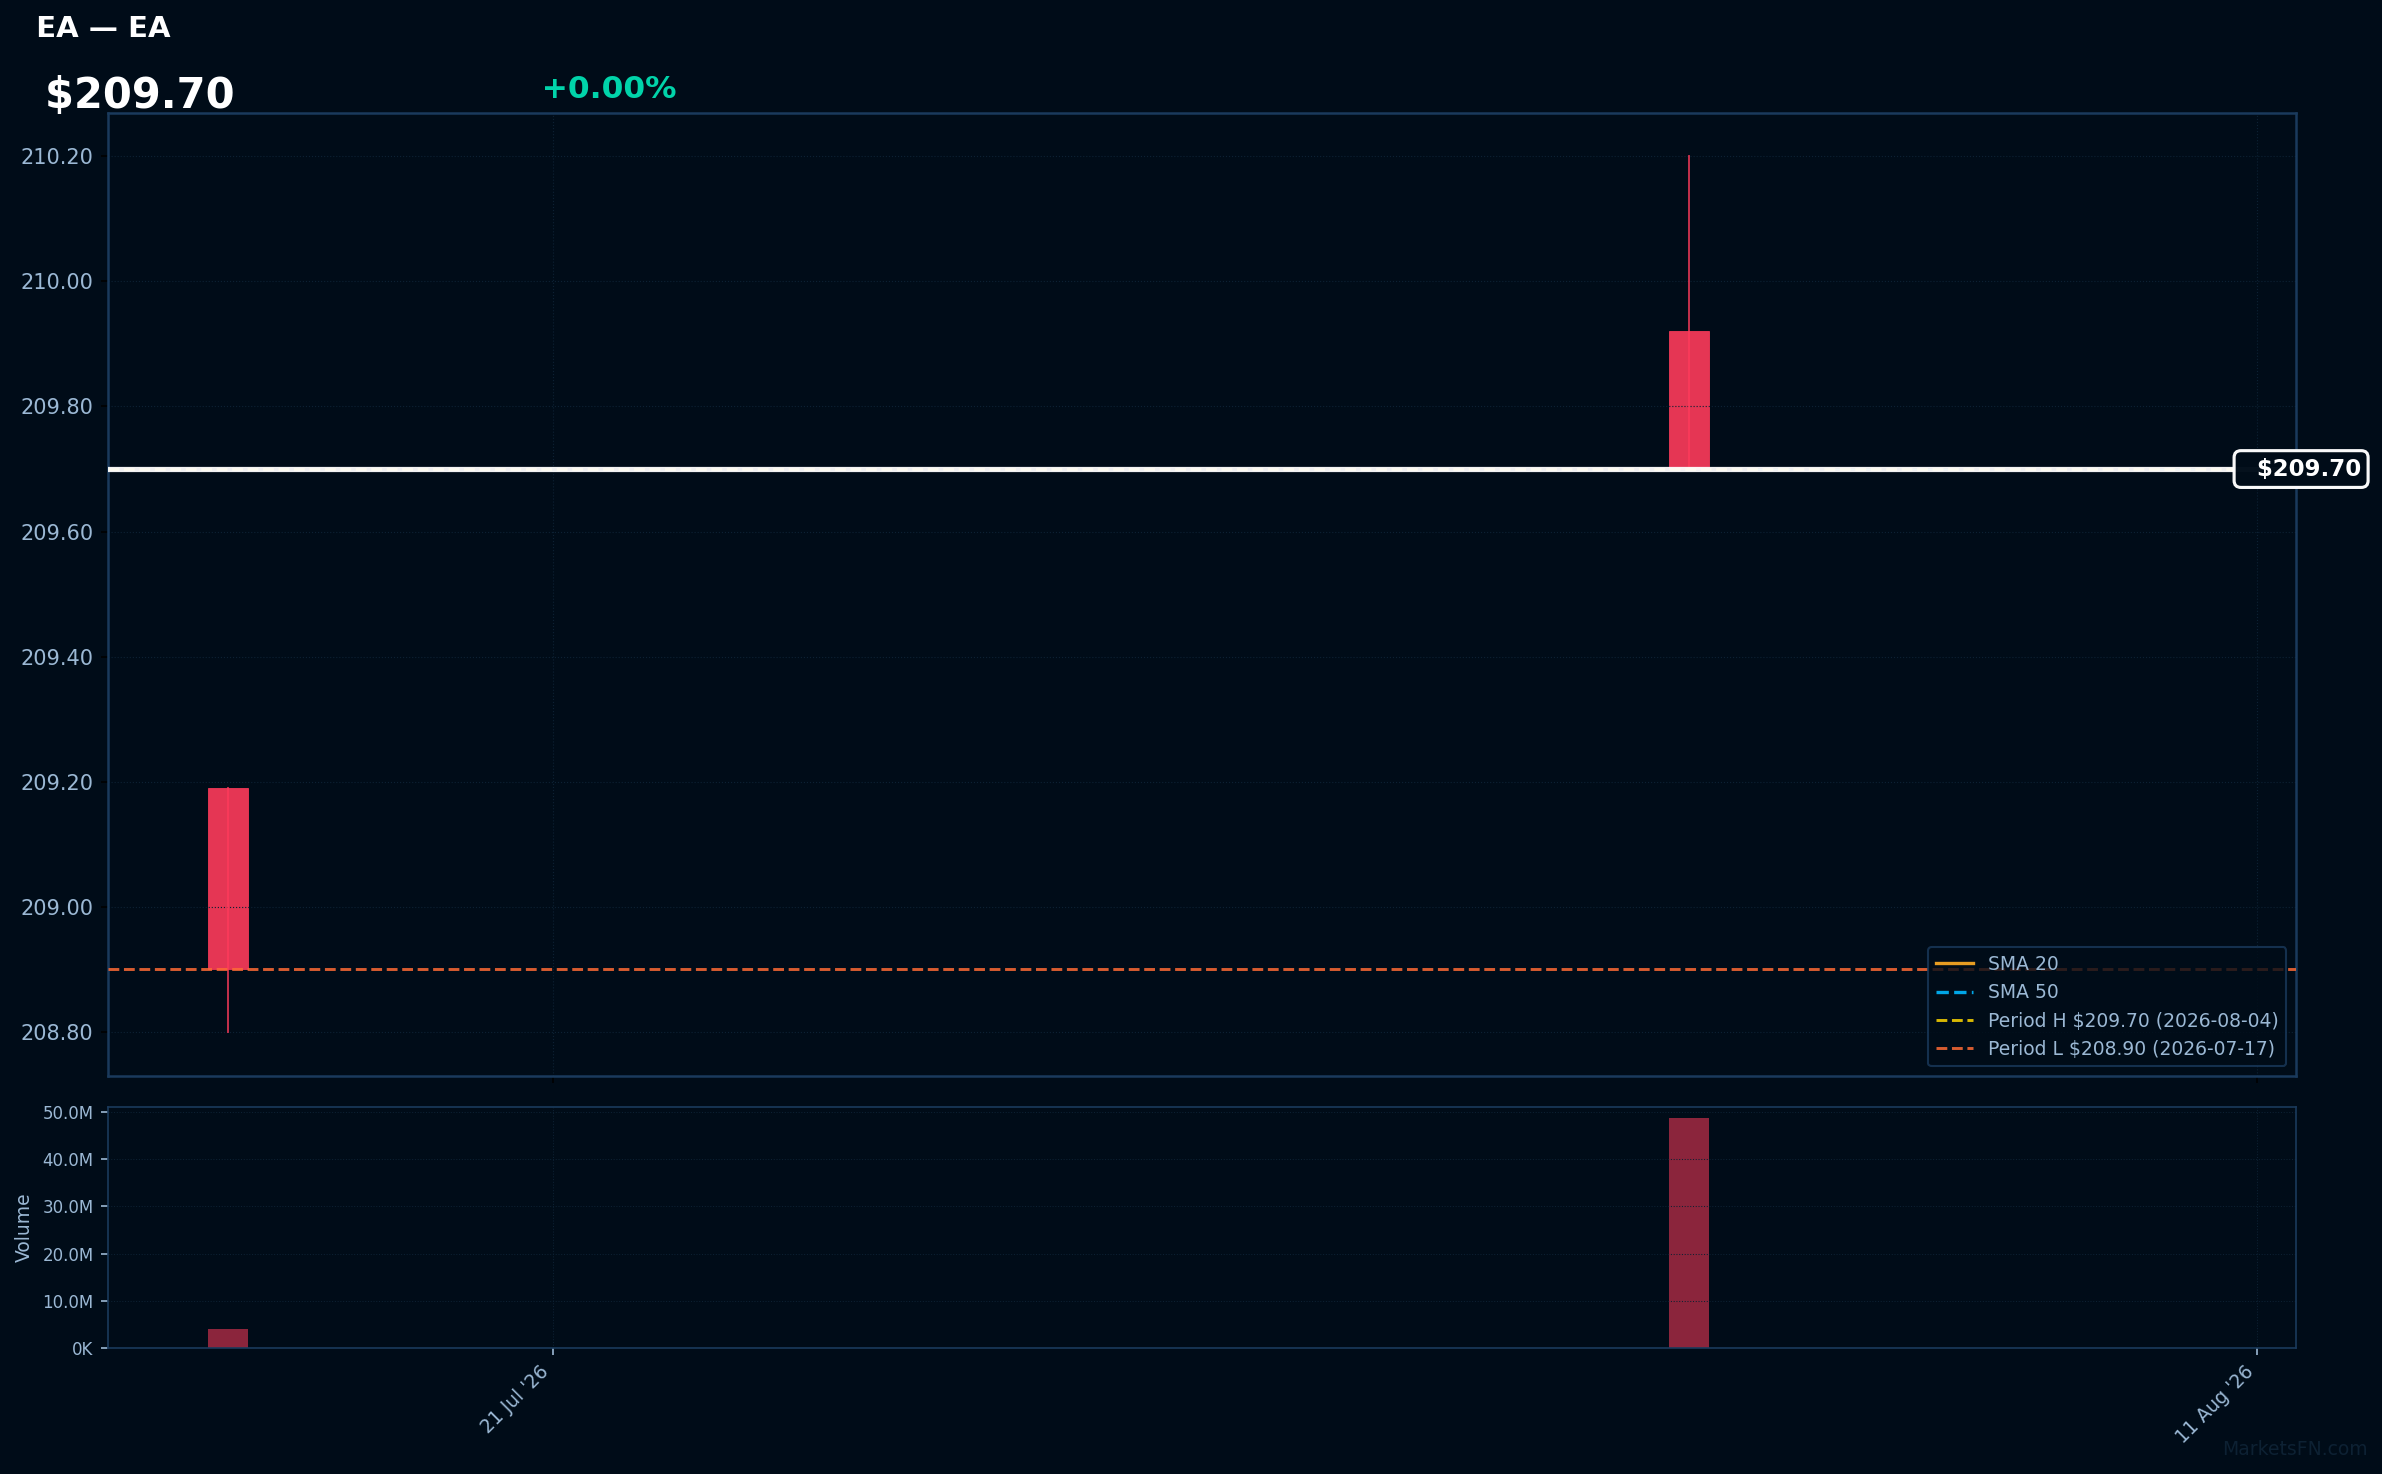
EA | Electronic Arts, Inc | Communication Services | Price Last: $209.70 | % Realized: +0.38% | RSI: — | % above MA200: — | Trend: —
Electronic Arts, Inc. develops and publishes interactive software and video games, including popular franchises like FIFA and The Sims. Investors should care due to its strong market position and potential for growth in the gaming industry, which continues to expand globally.
The stock is currently 0.0% below its 52-Week high, indicating a potential breakout level. However, RSI(14) data is N/A and MA data is incomplete, limiting technical analysis.
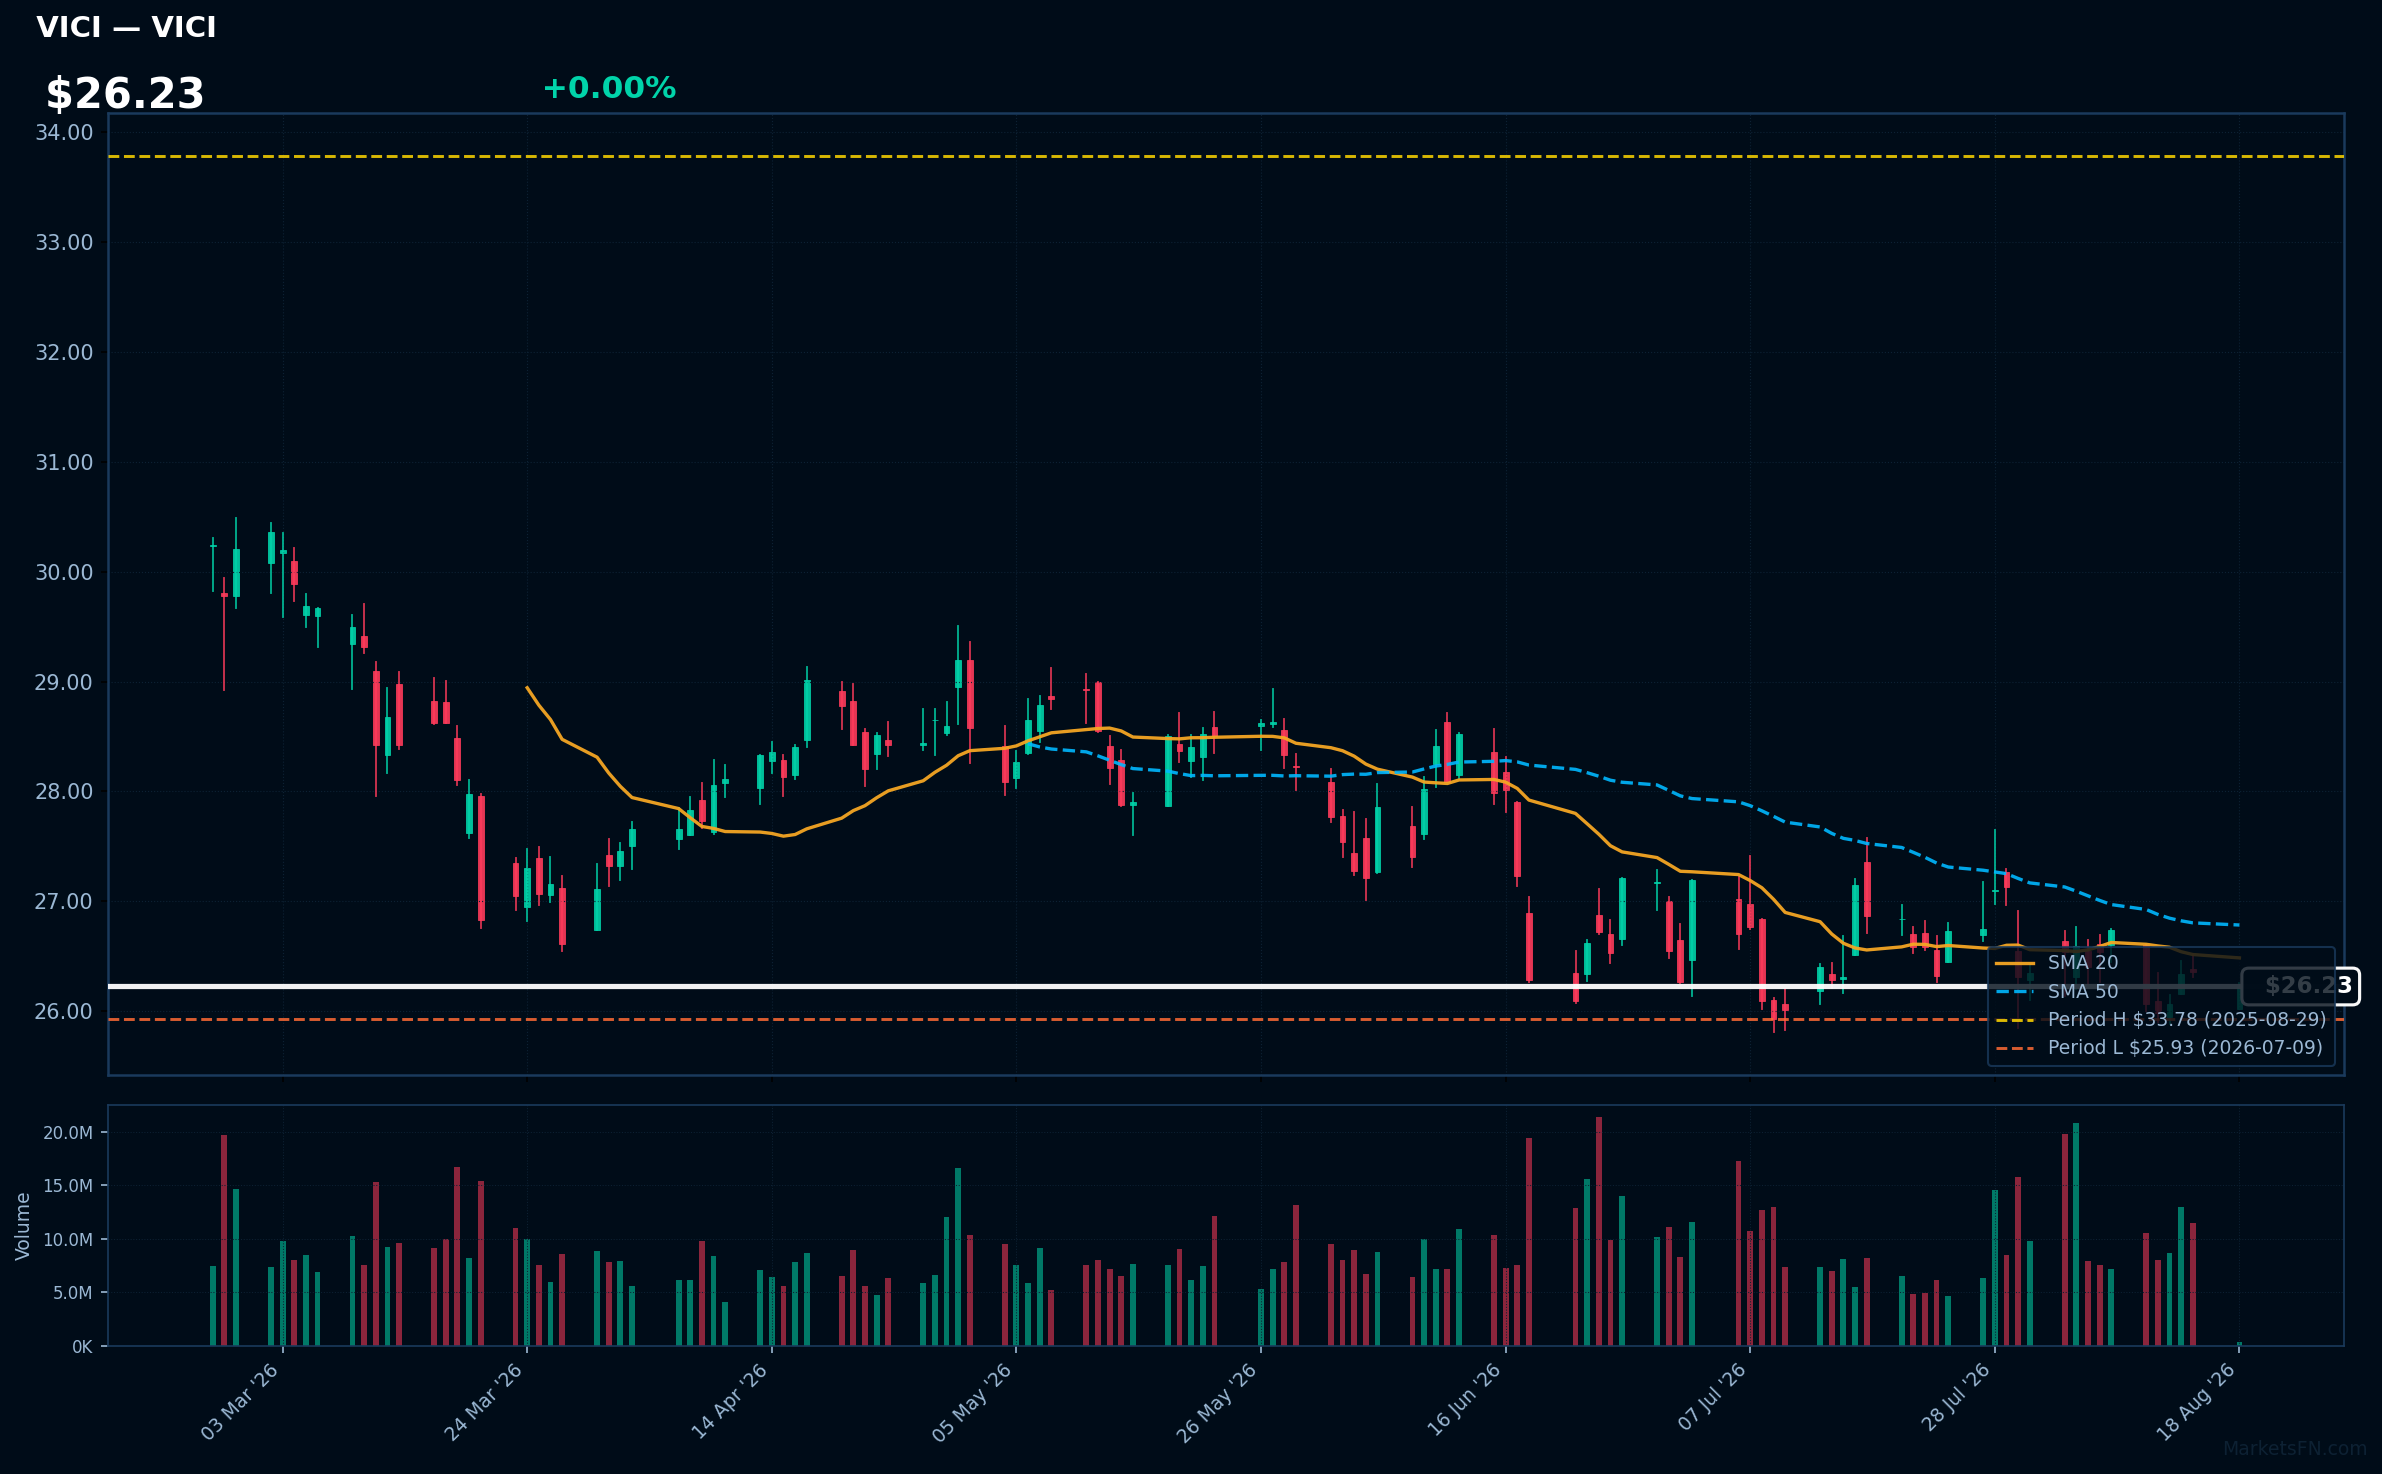
VICI | VICI Properties Inc | Real Estate | Price Last: $26.23 | % Realized: -18.54% | RSI: 45.1 | % above MA200: -6.8% | Trend: Below MA20, MA50, MA200
VICI Properties Inc is a real estate investment trust (REIT) that specializes in acquiring and managing gaming, hospitality, and entertainment properties. Investors should care due to its focus on a niche market with potential for stable cash flows and growth in a recovering economy.
The current technical situation indicates a bearish trend, with an RSI(14) of 45.1 and a MA alignment of price < MA20 < MA50 < MA200, suggesting sustained downtrend and testing major support just 1.2% above its 52-week low.
Related headlines
- VICI Properties Announces Closing of $1.75 Billion Senior Unsecured Notes Offering
- VICI Properties Announces Pricing of Public Offering of $1.75 Billion of Senior Unsecured Notes
- Vici Properties Eyes Las Vegas NBA Arena Expansion
- VICI Properties Inc (VICI) (Q2 2026) Earnings Call Highlights: AFFO Growth, Portfolio ...
Market Commentary
The presence of S&P 500 stocks near 52-week extremes indicates a significant divergence in market sentiment. Stocks like Johnson & Johnson, Merck & Co Inc, and Charles Schwab Corp are at their 52-week highs, suggesting strong investor confidence and potential bullish momentum. Conversely, companies such as Nike, Inc and Rollins, Inc are hovering near their 52-week lows, reflecting bearish sentiment and possible underlying challenges within those sectors.
This divergence may be influenced by sector rotation, where investors shift their focus from growth-oriented stocks to more defensive or value-oriented sectors. The healthcare sector, represented by stocks like AMGEN and Bristol-Myers Squibb, appears to be benefiting from macroeconomic themes such as increased demand for healthcare services and products. In contrast, consumer discretionary stocks like Nike may be facing headwinds from changing consumer behavior and economic uncertainties.
Key levels to watch include the 52-week highs for the outperforming stocks, which could serve as resistance if they attempt to push higher. For the underperformers, the 52-week lows may act as support levels. Potential catalysts include upcoming earnings reports, economic data releases, and shifts in monetary policy that could impact investor sentiment and sector performance.
Methodology: All 503 S&P 500 constituents screened. 52-week high = highest daily close over the past 252 trading days (approx. 1 year). 52-week low = lowest daily close over the same period. Distance = (current price / extreme − 1) × 100. Technical indicators computed on up to 1 year of daily OHLCV data.
Disclaimer: For informational purposes only. Not investment advice. Past performance is not indicative of future results.

