S&P 500 52-Week Highs & Lows Radar: JPMorgan Chase & (JPM), Rollins, (ROL) and more
MarketsFN Team

S&P 500 52-Week Highs & Lows Radar: JPMorgan Chase & (JPM), Rollins, (ROL) and more
Screening all 503 S&P 500 constituents for stocks nearest to their 52-week high and their 52-week low. Data as of August 14, 2026. % Realized = 52-week total return.
Legend: RSI > 70 = overbought · RSI < 30 = oversold · Green % Realized = positive 52W return · Red = negative.
📈 Nearest to 52-Week High
Sectors represented: Financial (4), Consumer Cyclical (1)
| Ticker | Company | Sector | Price Last | % Realized | 52-Week High Date | RSI | % above MA200 | Trend |
|---|---|---|---|---|---|---|---|---|
| JPM | JPMorgan Chase & Co | Financial | $365.61 | +24.29% | 2026-08-14 | 67.3 | +16.1% | Above MA20, MA50, MA200 |
| SCHW | Charles Schwab Corp | Financial | $110.07 | +12.57% | 2026-08-14 | 73.8 | +14.4% | Above MA20, MA50, MA200 |
| PNC | PNC Financial Services Group Inc | Financial | $257.38 | +32.28% | 2026-08-14 | 63.7 | +16.9% | Above MA20, MA50, MA200 |
| ABNB | Airbnb Inc | Consumer Cyclical | $185.20 | +48.59% | 2026-08-14 | 76.6 | +37.4% | Above MA20, MA50, MA200 |
| USB | U.S. Bancorp | Financial | $65.47 | +39.80% | 2026-08-14 | 66.2 | +17.9% | Above MA20, MA50, MA200 |
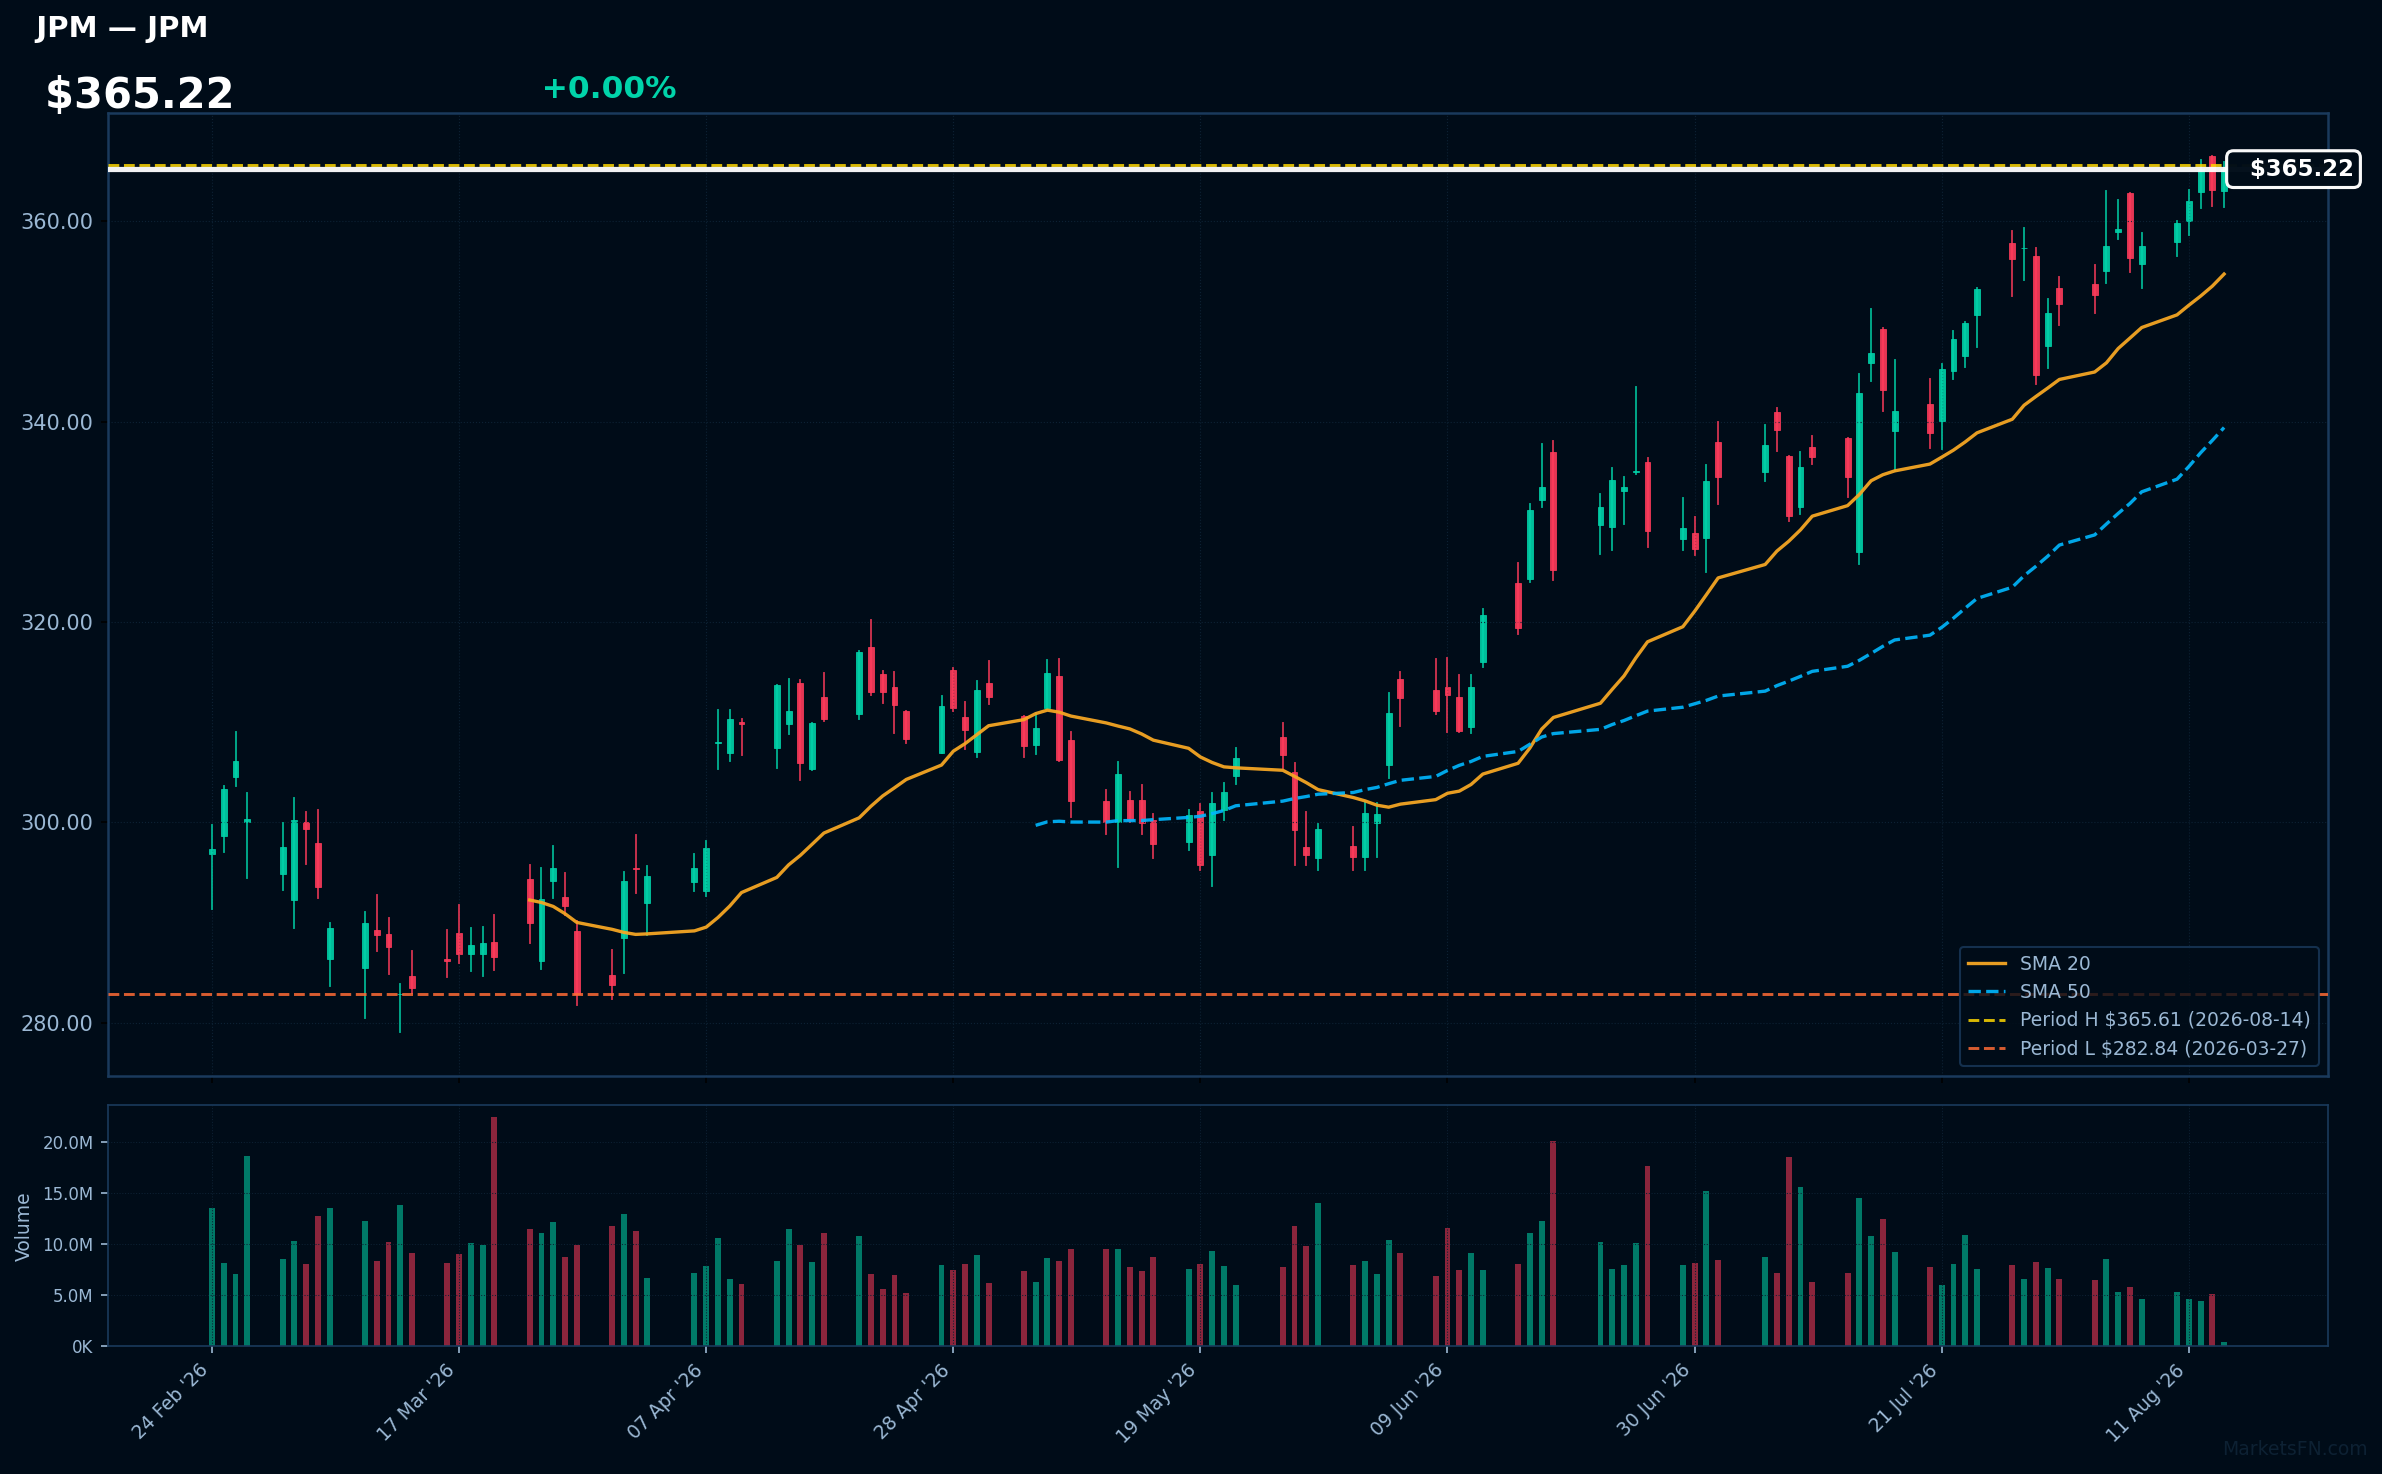
JPM | JPMorgan Chase & Co | Financial | Price Last: $365.61 | % Realized: +24.29% | RSI: 67.3 | % above MA200: +16.1% | Trend: Above MA20, MA50, MA200
JPMorgan Chase & Co is a leading global financial services firm, providing investment banking, financial services, and asset management. Investors should care due to its significant market position and ability to navigate economic cycles effectively, impacting overall market stability and growth.
The current technical situation shows bullish momentum with an RSI(14) of 67.3 and a strong MA alignment: price > MA20 > MA50 > MA200. The stock is 0.0% below its 52-Week high, indicating potential for a breakout.
Related headlines
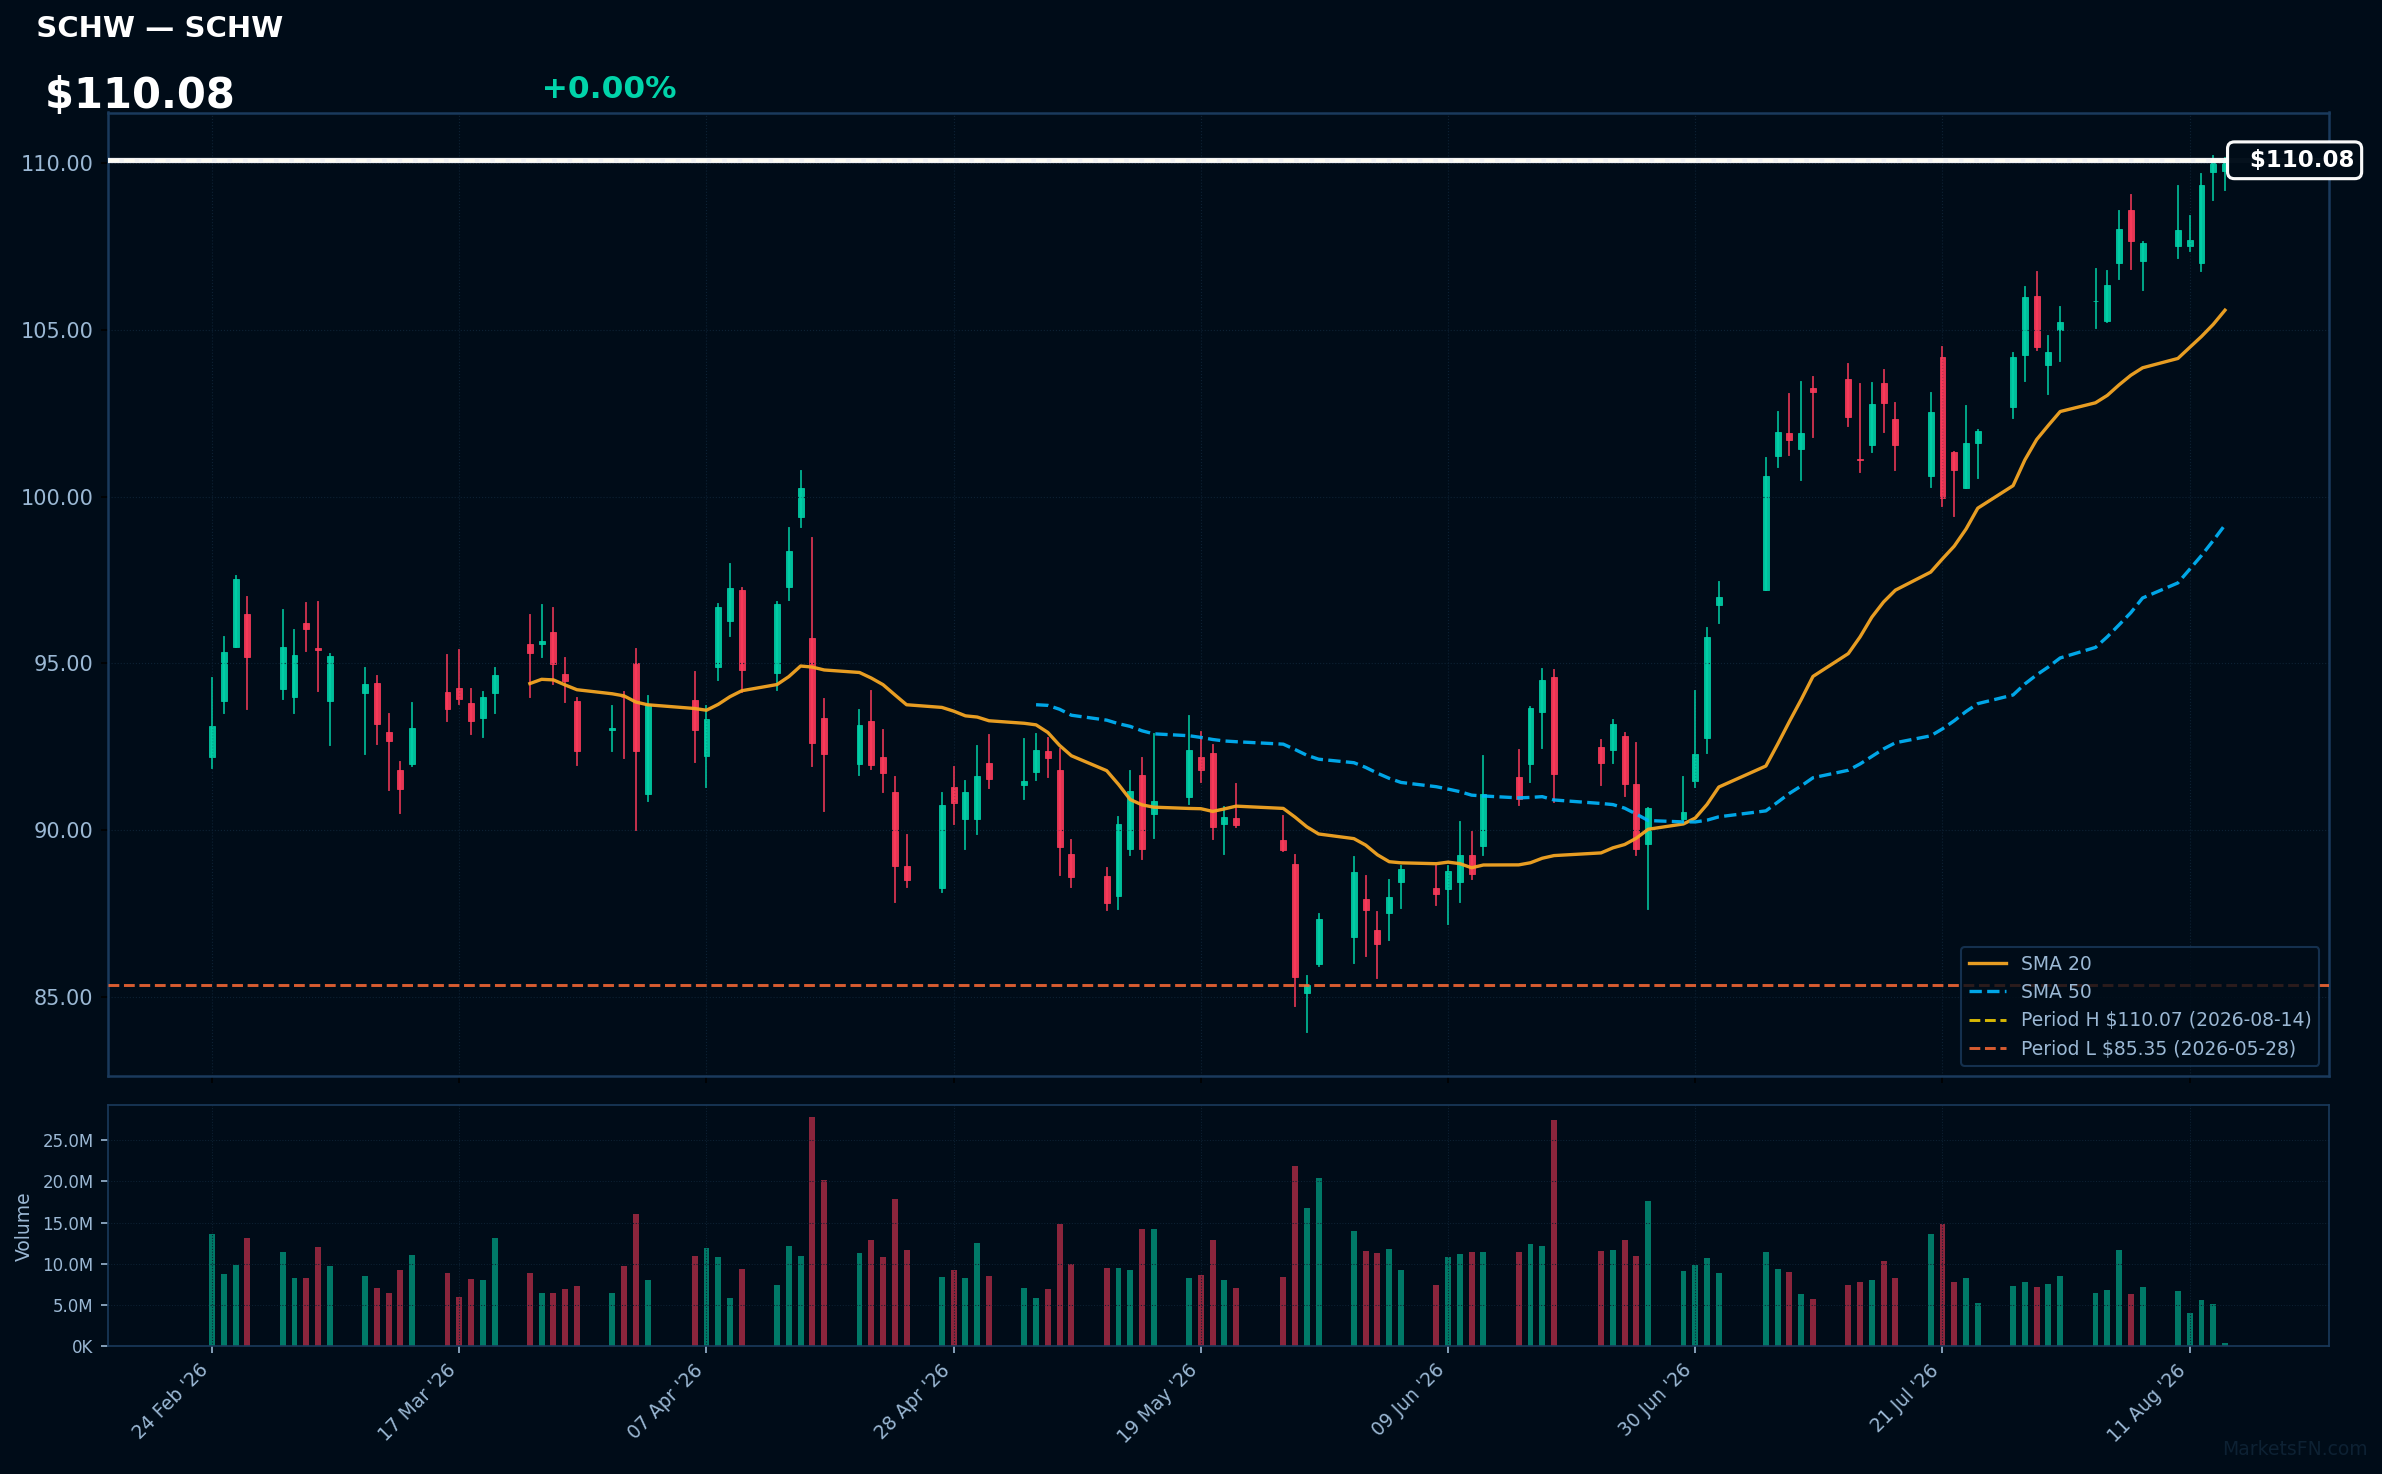
SCHW | Charles Schwab Corp | Financial | Price Last: $110.07 | % Realized: +12.57% | RSI: 73.8 | % above MA200: +14.4% | Trend: Above MA20, MA50, MA200
Charles Schwab Corp provides brokerage and banking services, focusing on investment management and financial advisory. Investors should care due to its strong market position and innovative technology, which enhance customer experience and drive growth in a competitive financial services landscape.
Technically, SCHW shows bullish momentum with an RSI(14) of 73.8 and a strong MA alignment: price > MA20 > MA50 > MA200. It is 0.0% below its 52-Week high, indicating potential for a breakout.
Related headlines
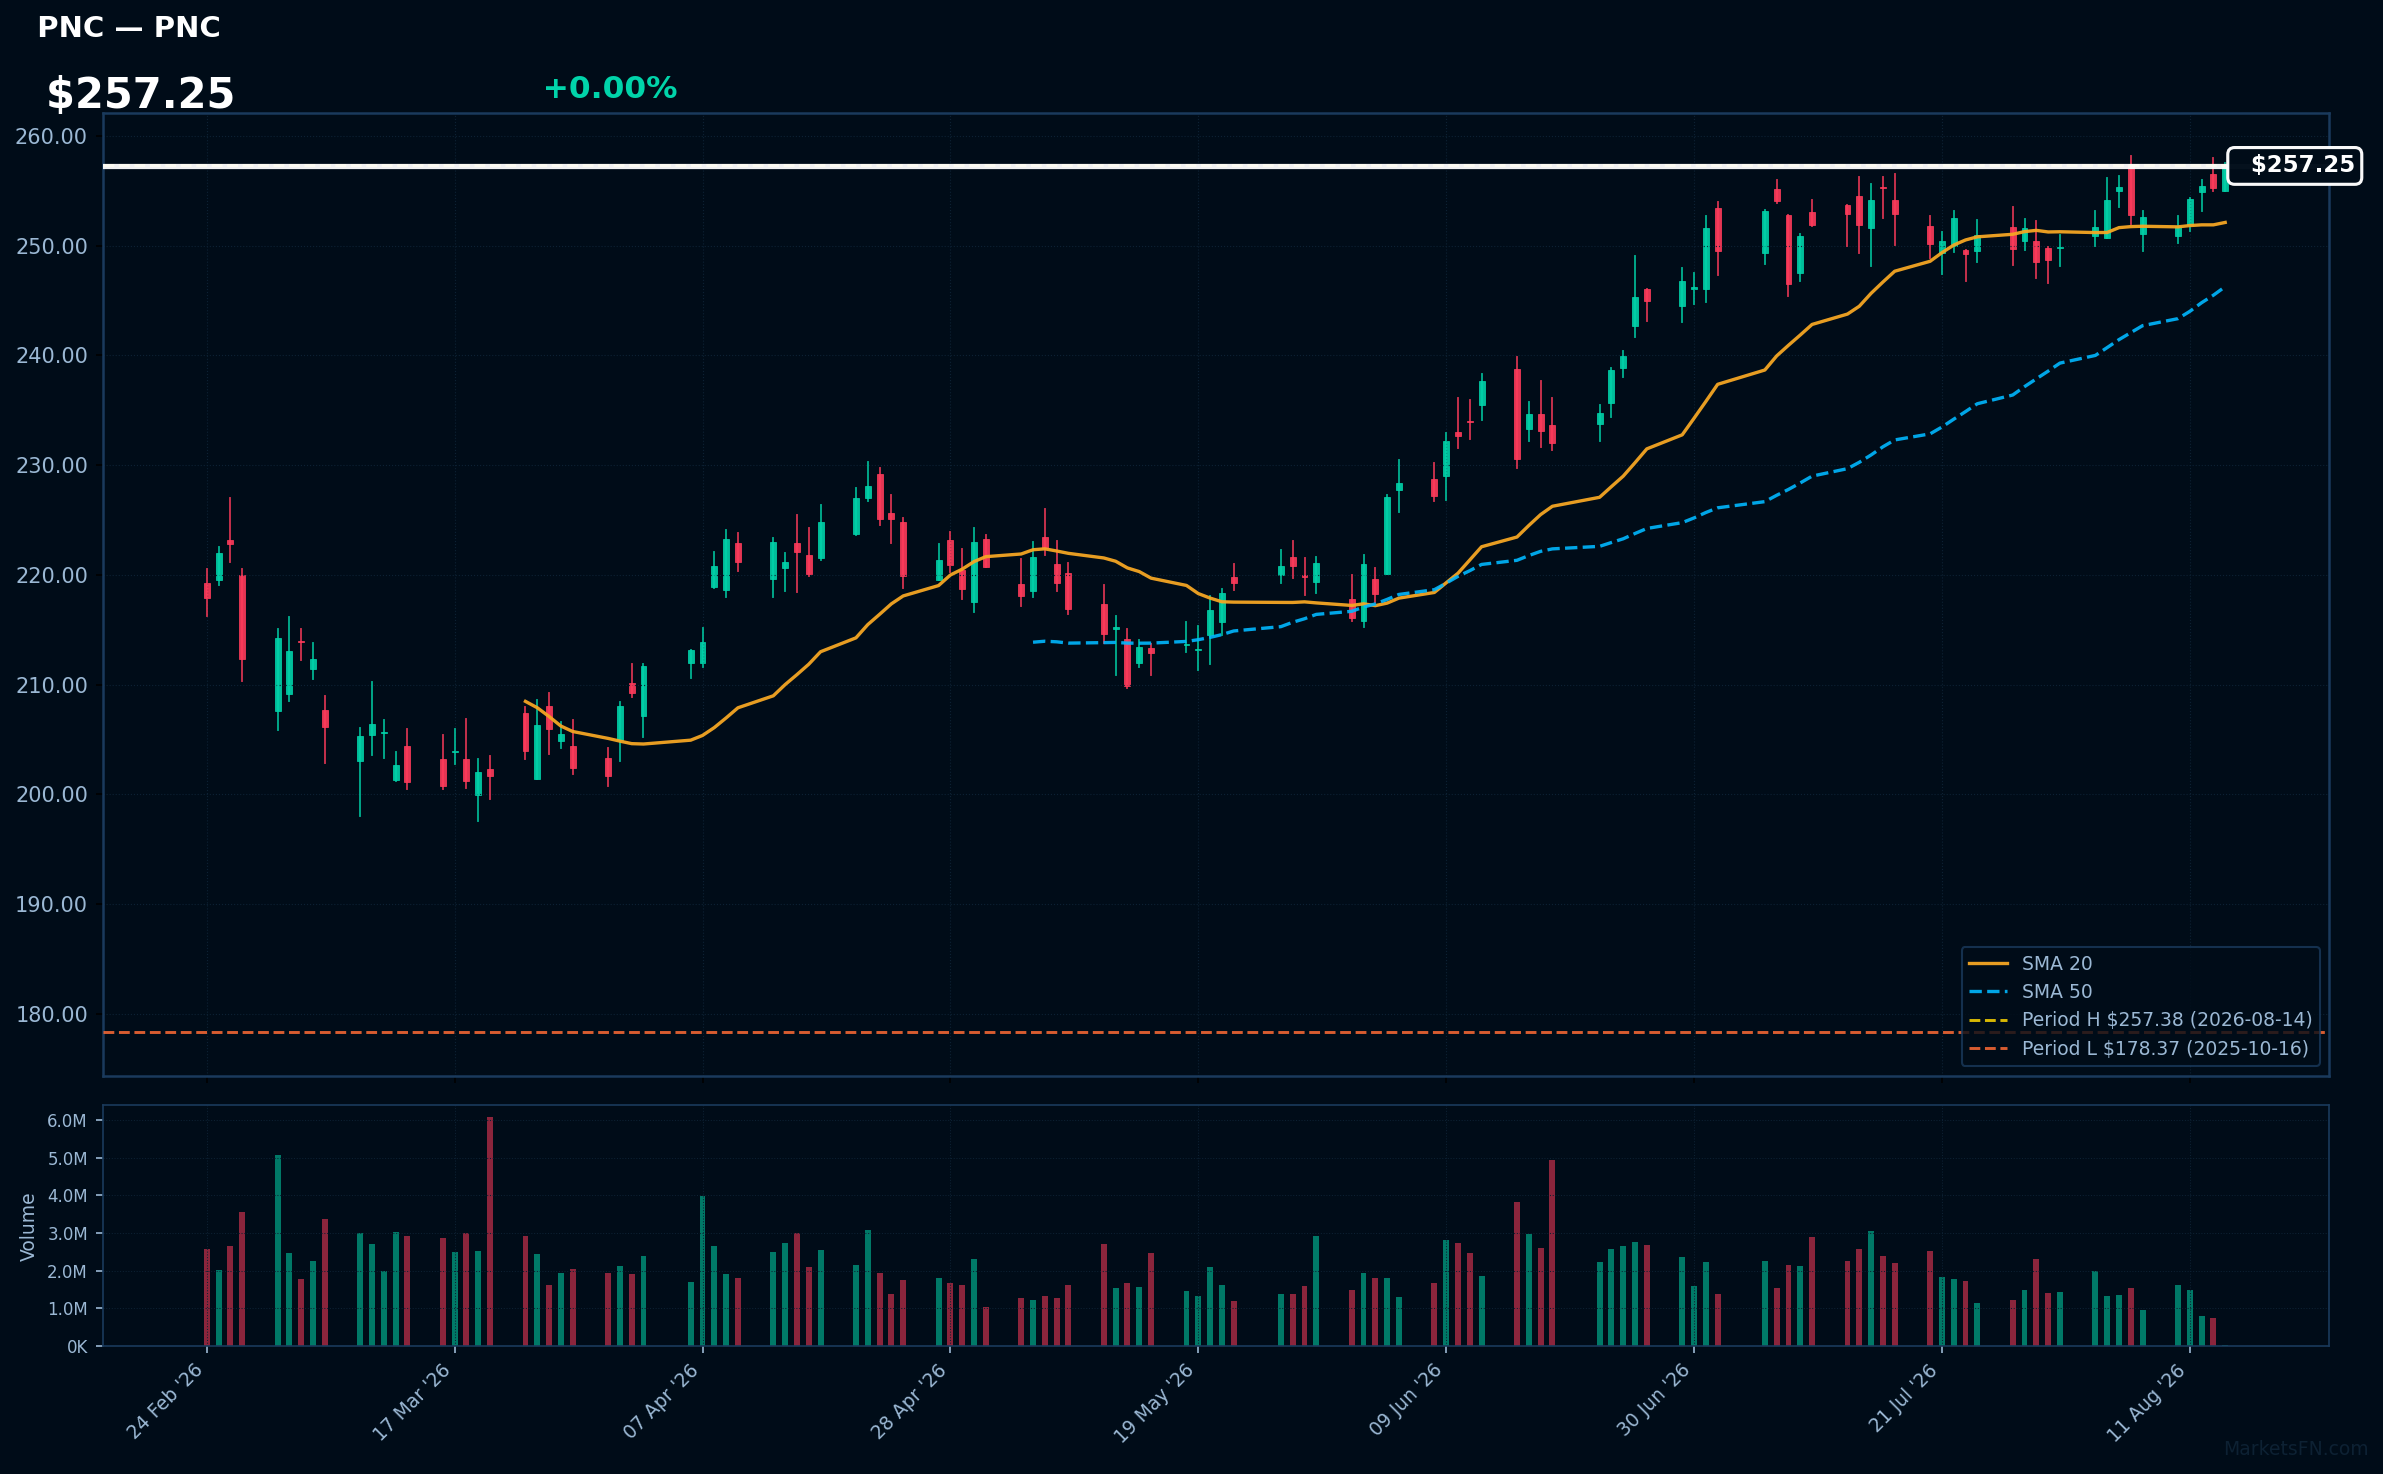
PNC | PNC Financial Services Group Inc | Financial | Price Last: $257.38 | % Realized: +32.28% | RSI: 63.7 | % above MA200: +16.9% | Trend: Above MA20, MA50, MA200
PNC Financial Services Group Inc provides diversified financial services, including retail banking, corporate banking, and investment management. Investors should care due to its strong market position and consistent performance, which can drive growth and shareholder value.
The current technical situation shows bullish momentum with an RSI(14) of 63.7 and a bullish MA alignment: price > MA20 > MA50 > MA200. The stock is 0.0% below its 52-Week high, indicating a potential breakout.
Related headlines
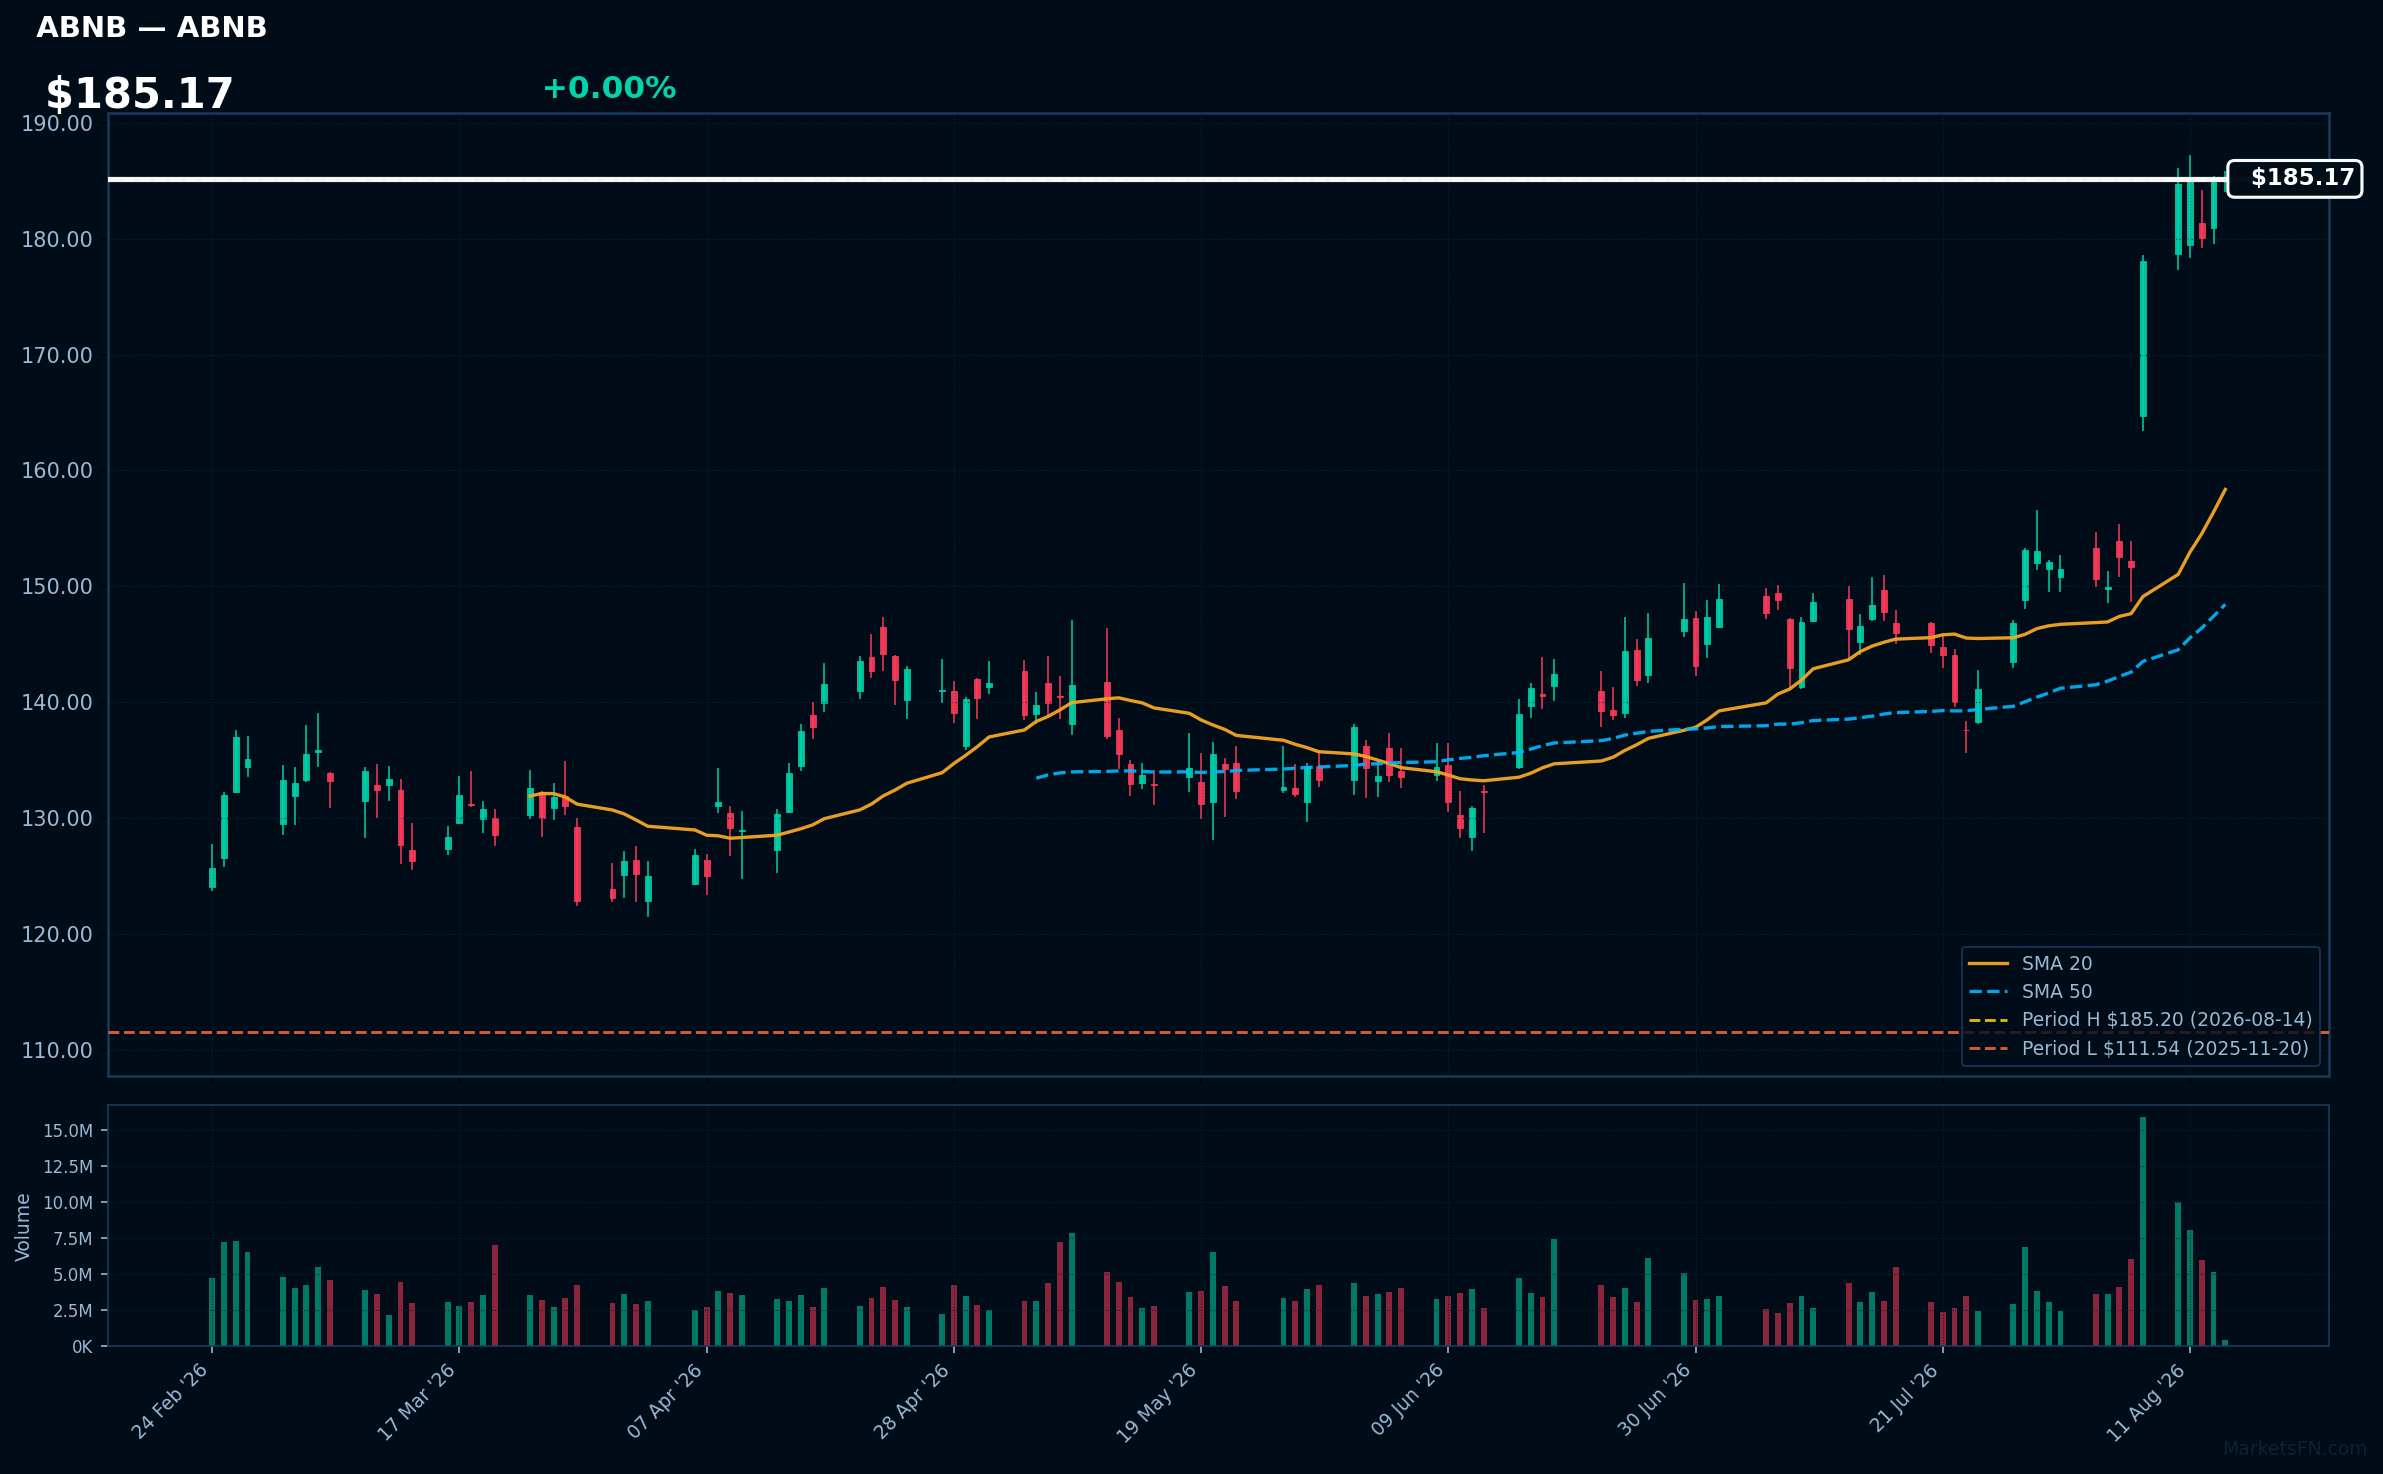
ABNB | Airbnb Inc | Consumer Cyclical | Price Last: $185.20 | % Realized: +48.59% | RSI: 76.6 | % above MA200: +37.4% | Trend: Above MA20, MA50, MA200
Airbnb Inc operates an online marketplace for lodging, primarily short-term rentals. Investors should care due to its innovative business model, which capitalizes on the growing trend of alternative accommodations, appealing to both travelers and property owners seeking additional income.
Currently, Airbnb shows strong momentum with an RSI(14) of 76.6 and a bullish MA alignment: price > MA20 > MA50 > MA200. The stock is 0.0% below its 52-Week high, indicating potential for a breakout.
Related headlines
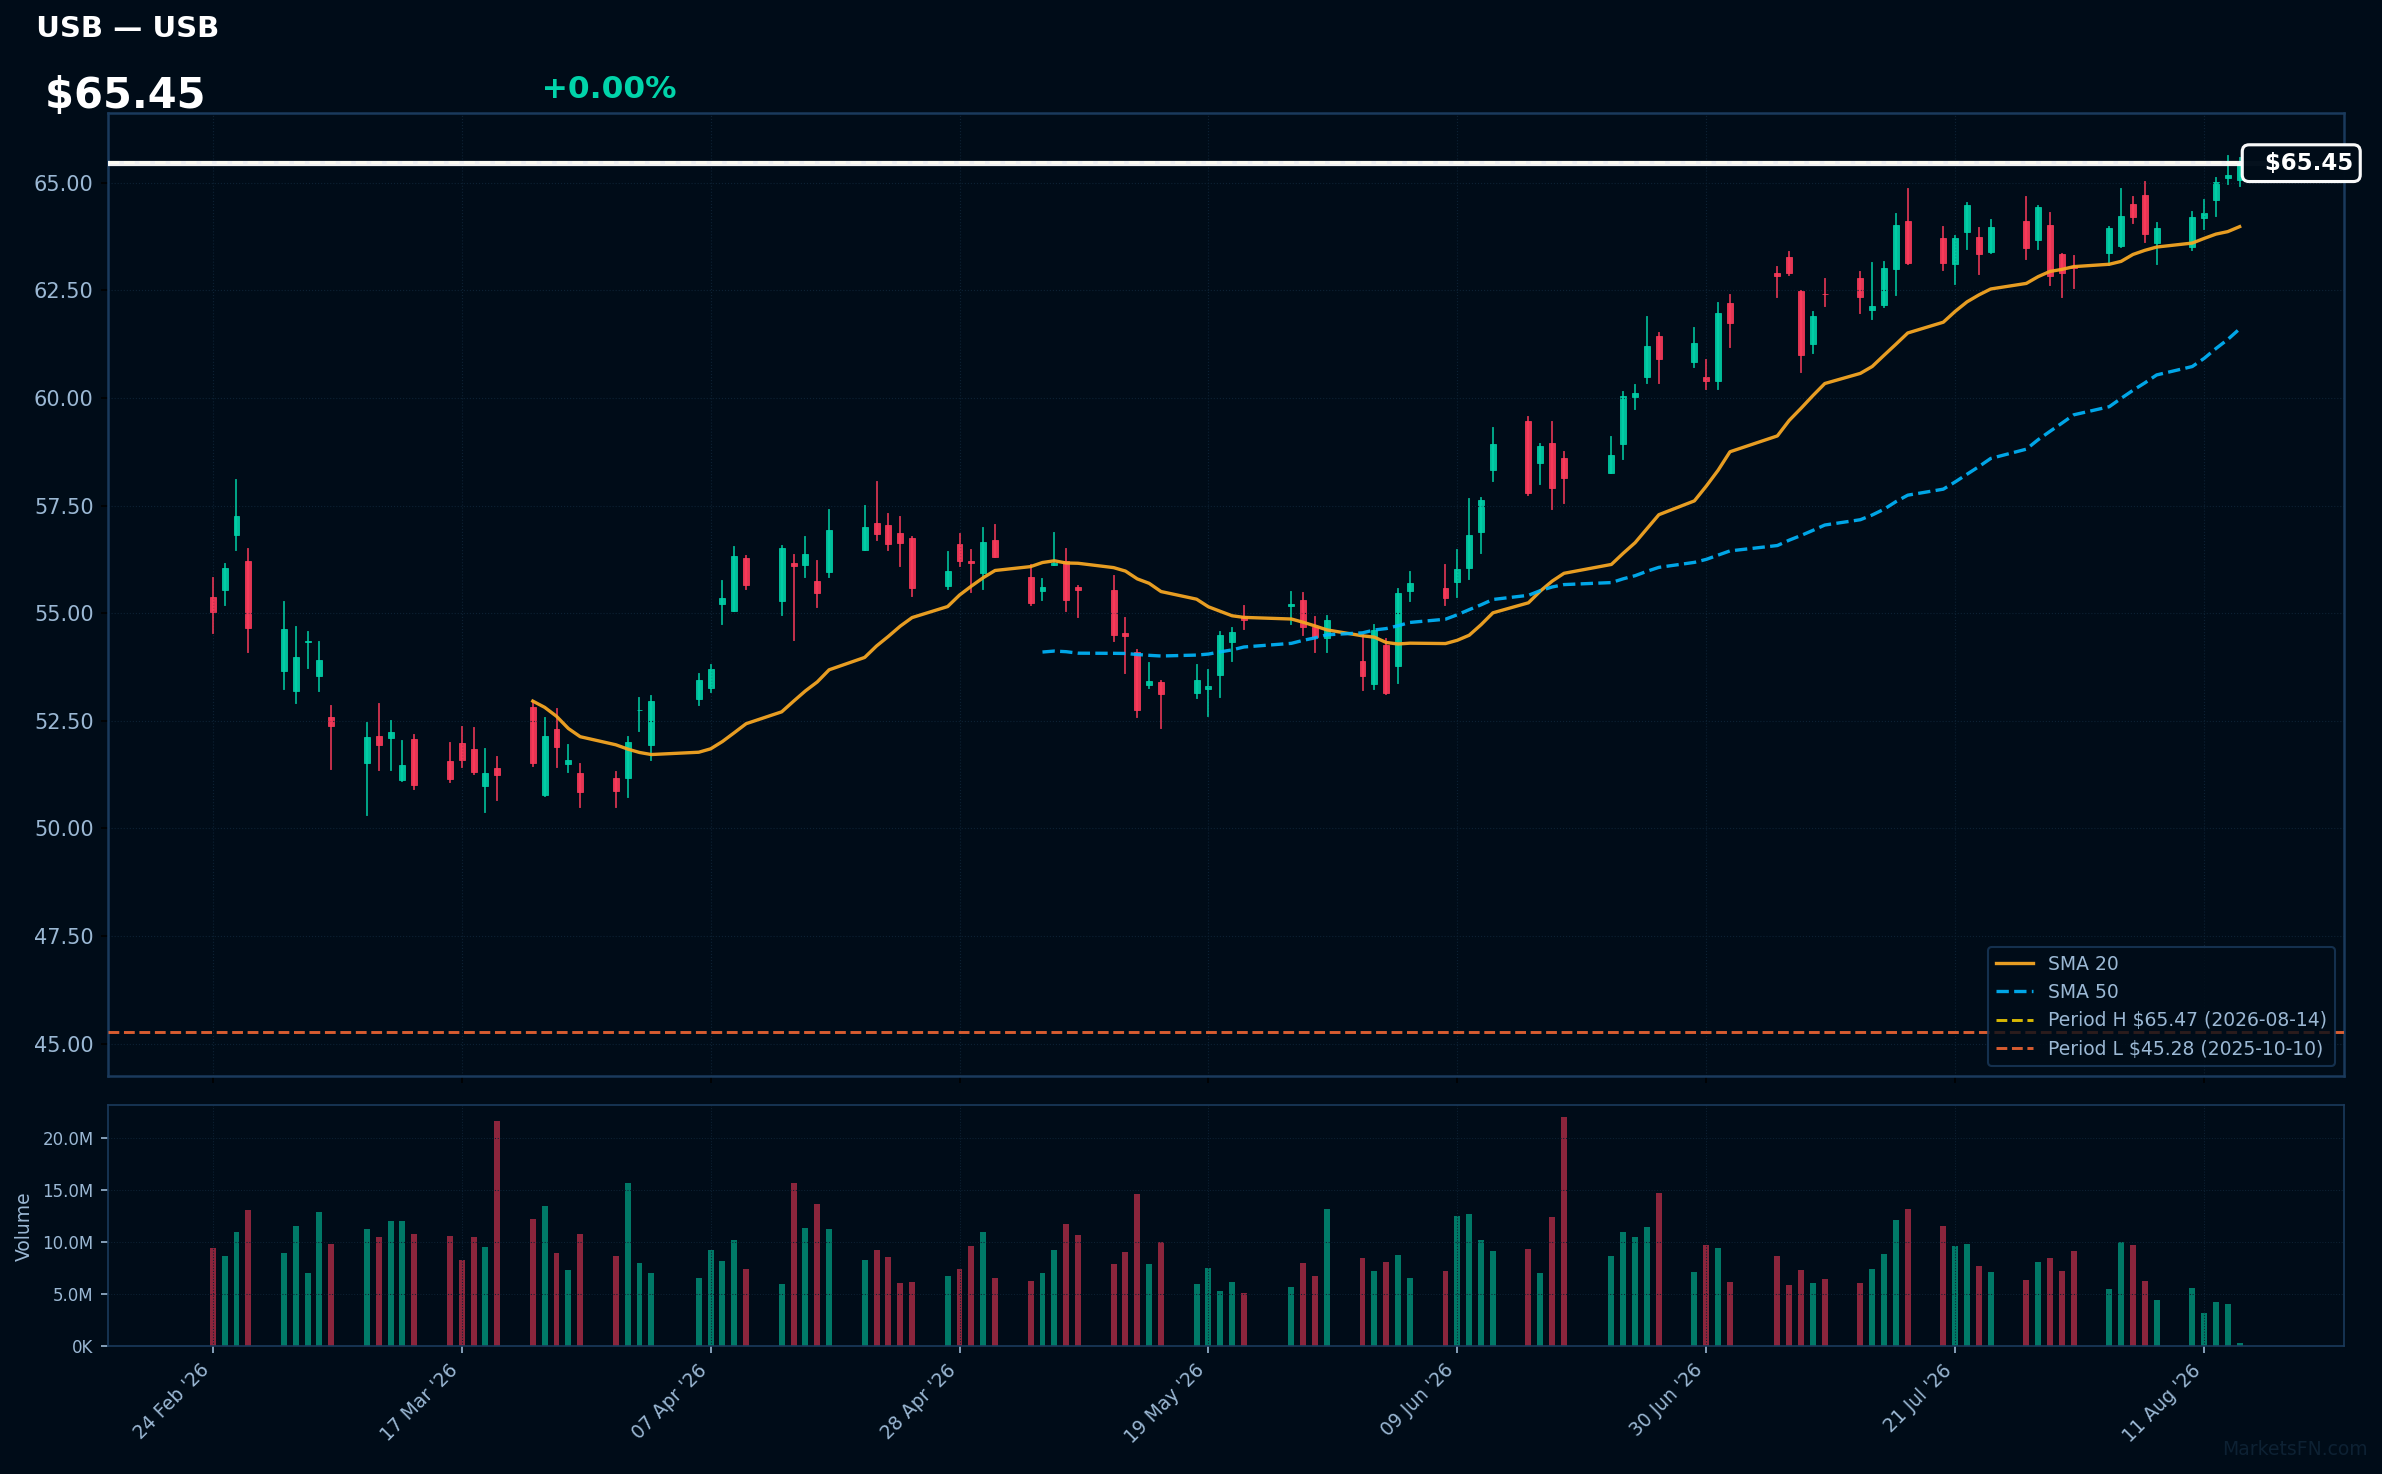
USB | U.S. Bancorp | Financial | Price Last: $65.47 | % Realized: +39.80% | RSI: 66.2 | % above MA200: +17.9% | Trend: Above MA20, MA50, MA200
U.S. Bancorp (USB) is a financial services holding company, providing banking, investment, mortgage, trust, and payment services. Investors should care due to its strong market position and consistent performance, which can lead to stable returns and growth opportunities in a competitive banking landscape.
The current technical situation indicates bullish momentum, with an RSI(14) of 66.2 and a bullish MA alignment: price > MA20 > MA50 > MA200. The stock is also 0.0% below its 52-Week high, suggesting a potential breakout.
Related headlines
📉 Nearest to 52-Week Low
Sectors represented: Consumer Cyclical (2), Industrials (1), Real Estate (1), Utilities (1)
| Ticker | Company | Sector | Price Last | % Realized | 52-Week Low Date | RSI | % above MA200 | Trend |
|---|---|---|---|---|---|---|---|---|
| ROL | Rollins, Inc | Consumer Cyclical | $36.25 | -36.87% | 2026-08-13 | 26.3 | -32.7% | Below MA20, MA50, MA200 |
| LII | Lennox International Inc | Industrials | $419.85 | -29.93% | 2026-07-31 | 31.4 | -16.9% | Below MA20, MA50, MA200 |
| NKE | Nike, Inc | Consumer Cyclical | $40.98 | -46.35% | 2026-08-12 | 43.1 | -23.0% | Below MA20, MA50, MA200 |
| VICI | VICI Properties Inc | Real Estate | $26.40 | -19.04% | 2026-07-09 | 47.8 | -6.3% | Below MA20, MA50, MA200 |
| PEG | Public Service Enterprise Group Inc | Utilities | $76.10 | -12.33% | 2026-08-10 | 41.3 | -5.5% | Below MA20, MA50, MA200 |
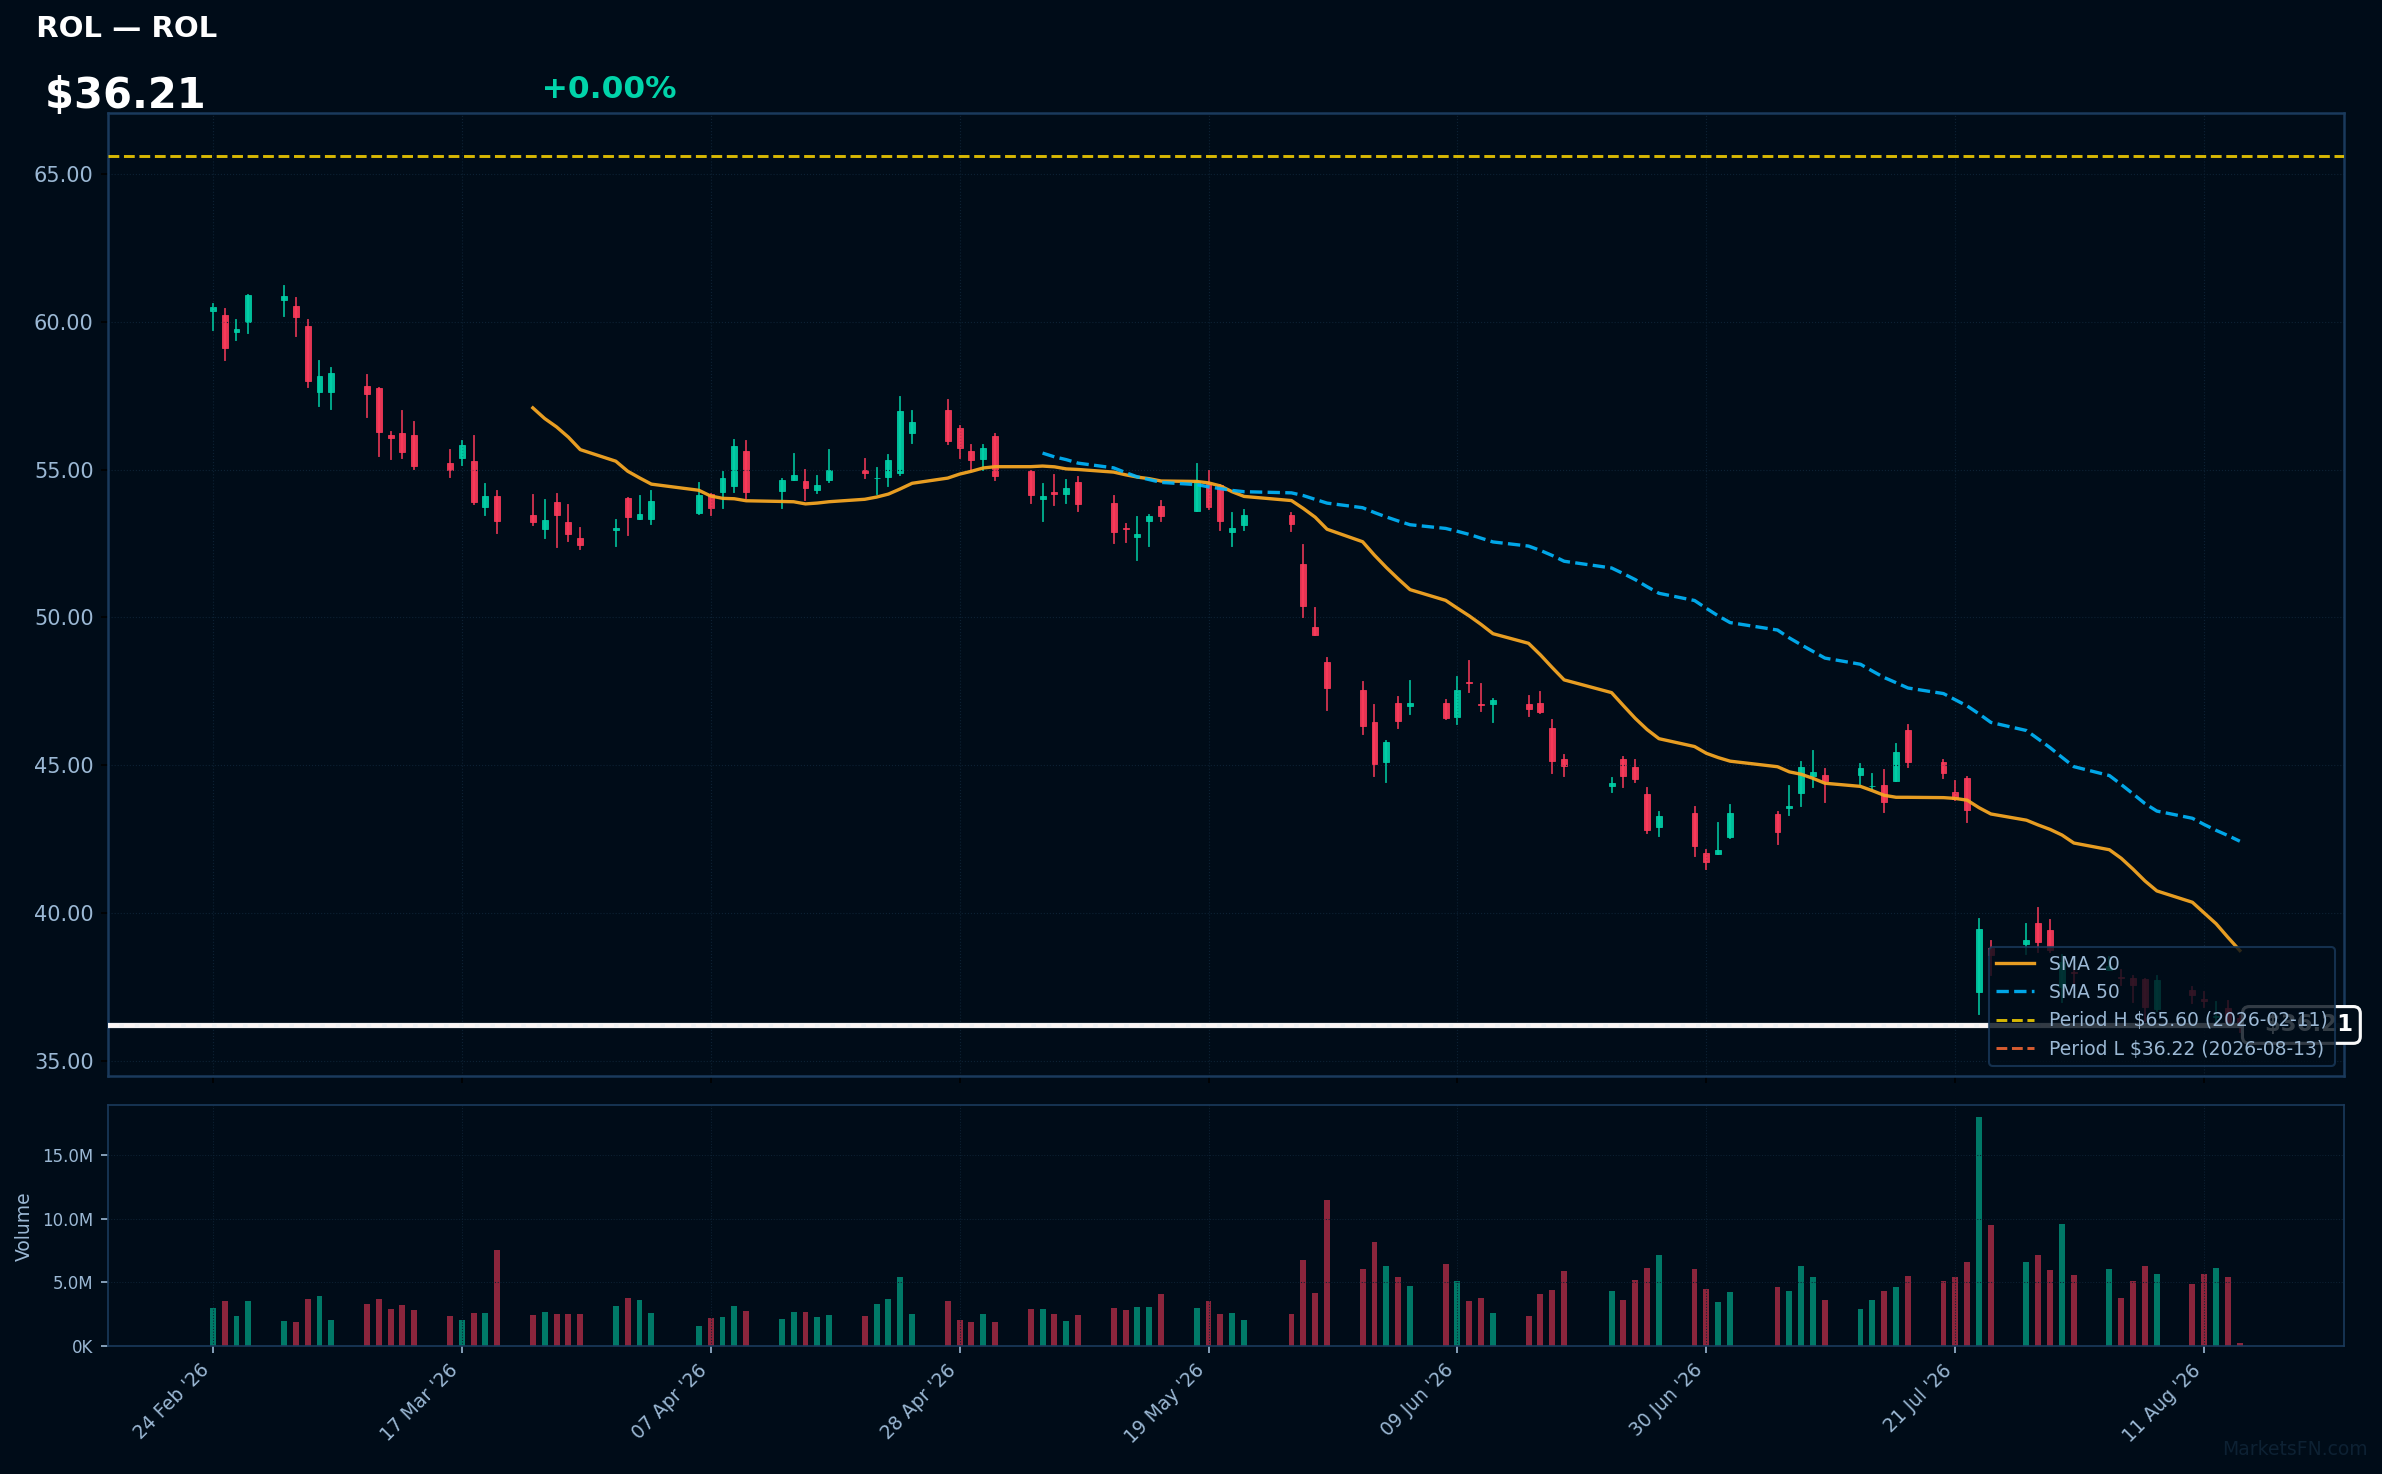
ROL | Rollins, Inc | Consumer Cyclical | Price Last: $36.25 | % Realized: -36.87% | RSI: 26.3 | % above MA200: -32.7% | Trend: Below MA20, MA50, MA200
Rollins, Inc. provides pest control services through subsidiaries like Orkin. Investors should care due to its significant market presence and potential for growth in a sector that remains essential, especially in urban areas where pest issues persist.
The current technical situation indicates a warning sign, with an RSI(14) of 26.3 and a bearish MA alignment: price < MA20 < MA50 < MA200, suggesting a sustained downtrend.
Related headlines
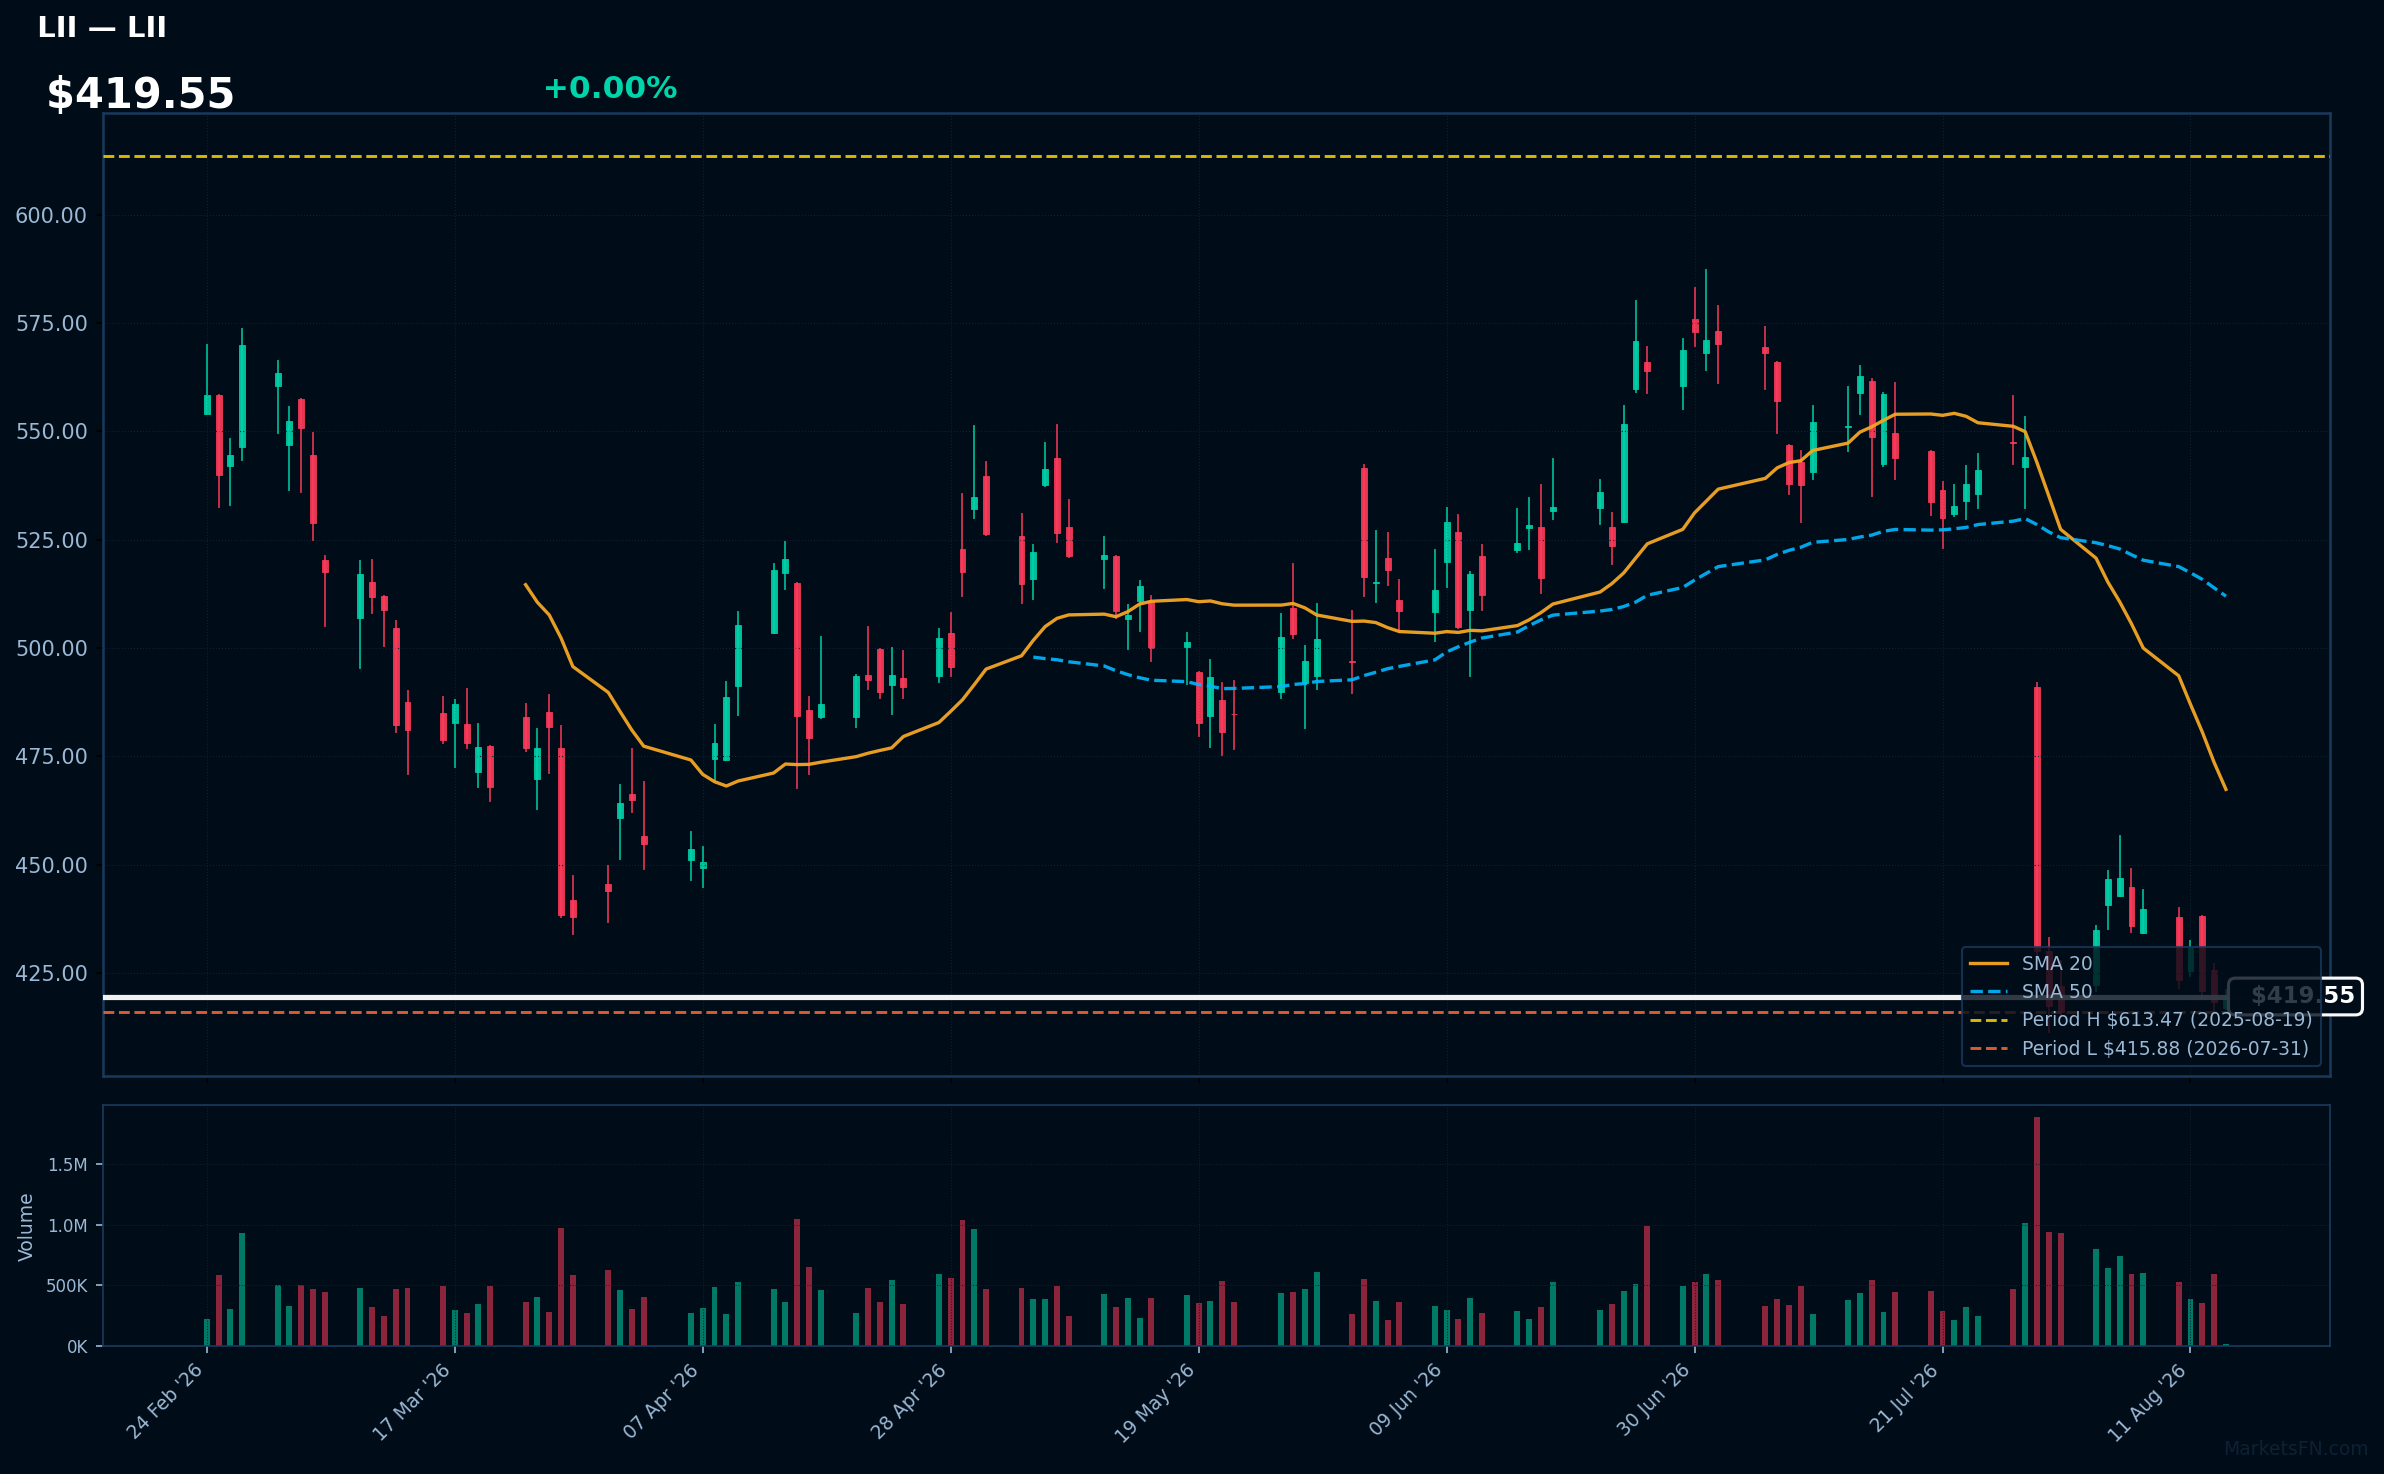
LII | Lennox International Inc | Industrials | Price Last: $419.85 | % Realized: -29.93% | RSI: 31.4 | % above MA200: -16.9% | Trend: Below MA20, MA50, MA200
Lennox International Inc (LII) designs and manufactures heating, ventilation, and air conditioning (HVAC) systems. Investors should care due to its significant role in the energy-efficient HVAC market, which is increasingly important amid rising energy costs and environmental regulations.
The current technical situation shows mixed signals with an RSI(14) of 31.4, indicating potential oversold conditions. The stock is below MA20/MA50/MA200, testing major support just 1.0% above its 52-Week low, suggesting caution.
Related headlines
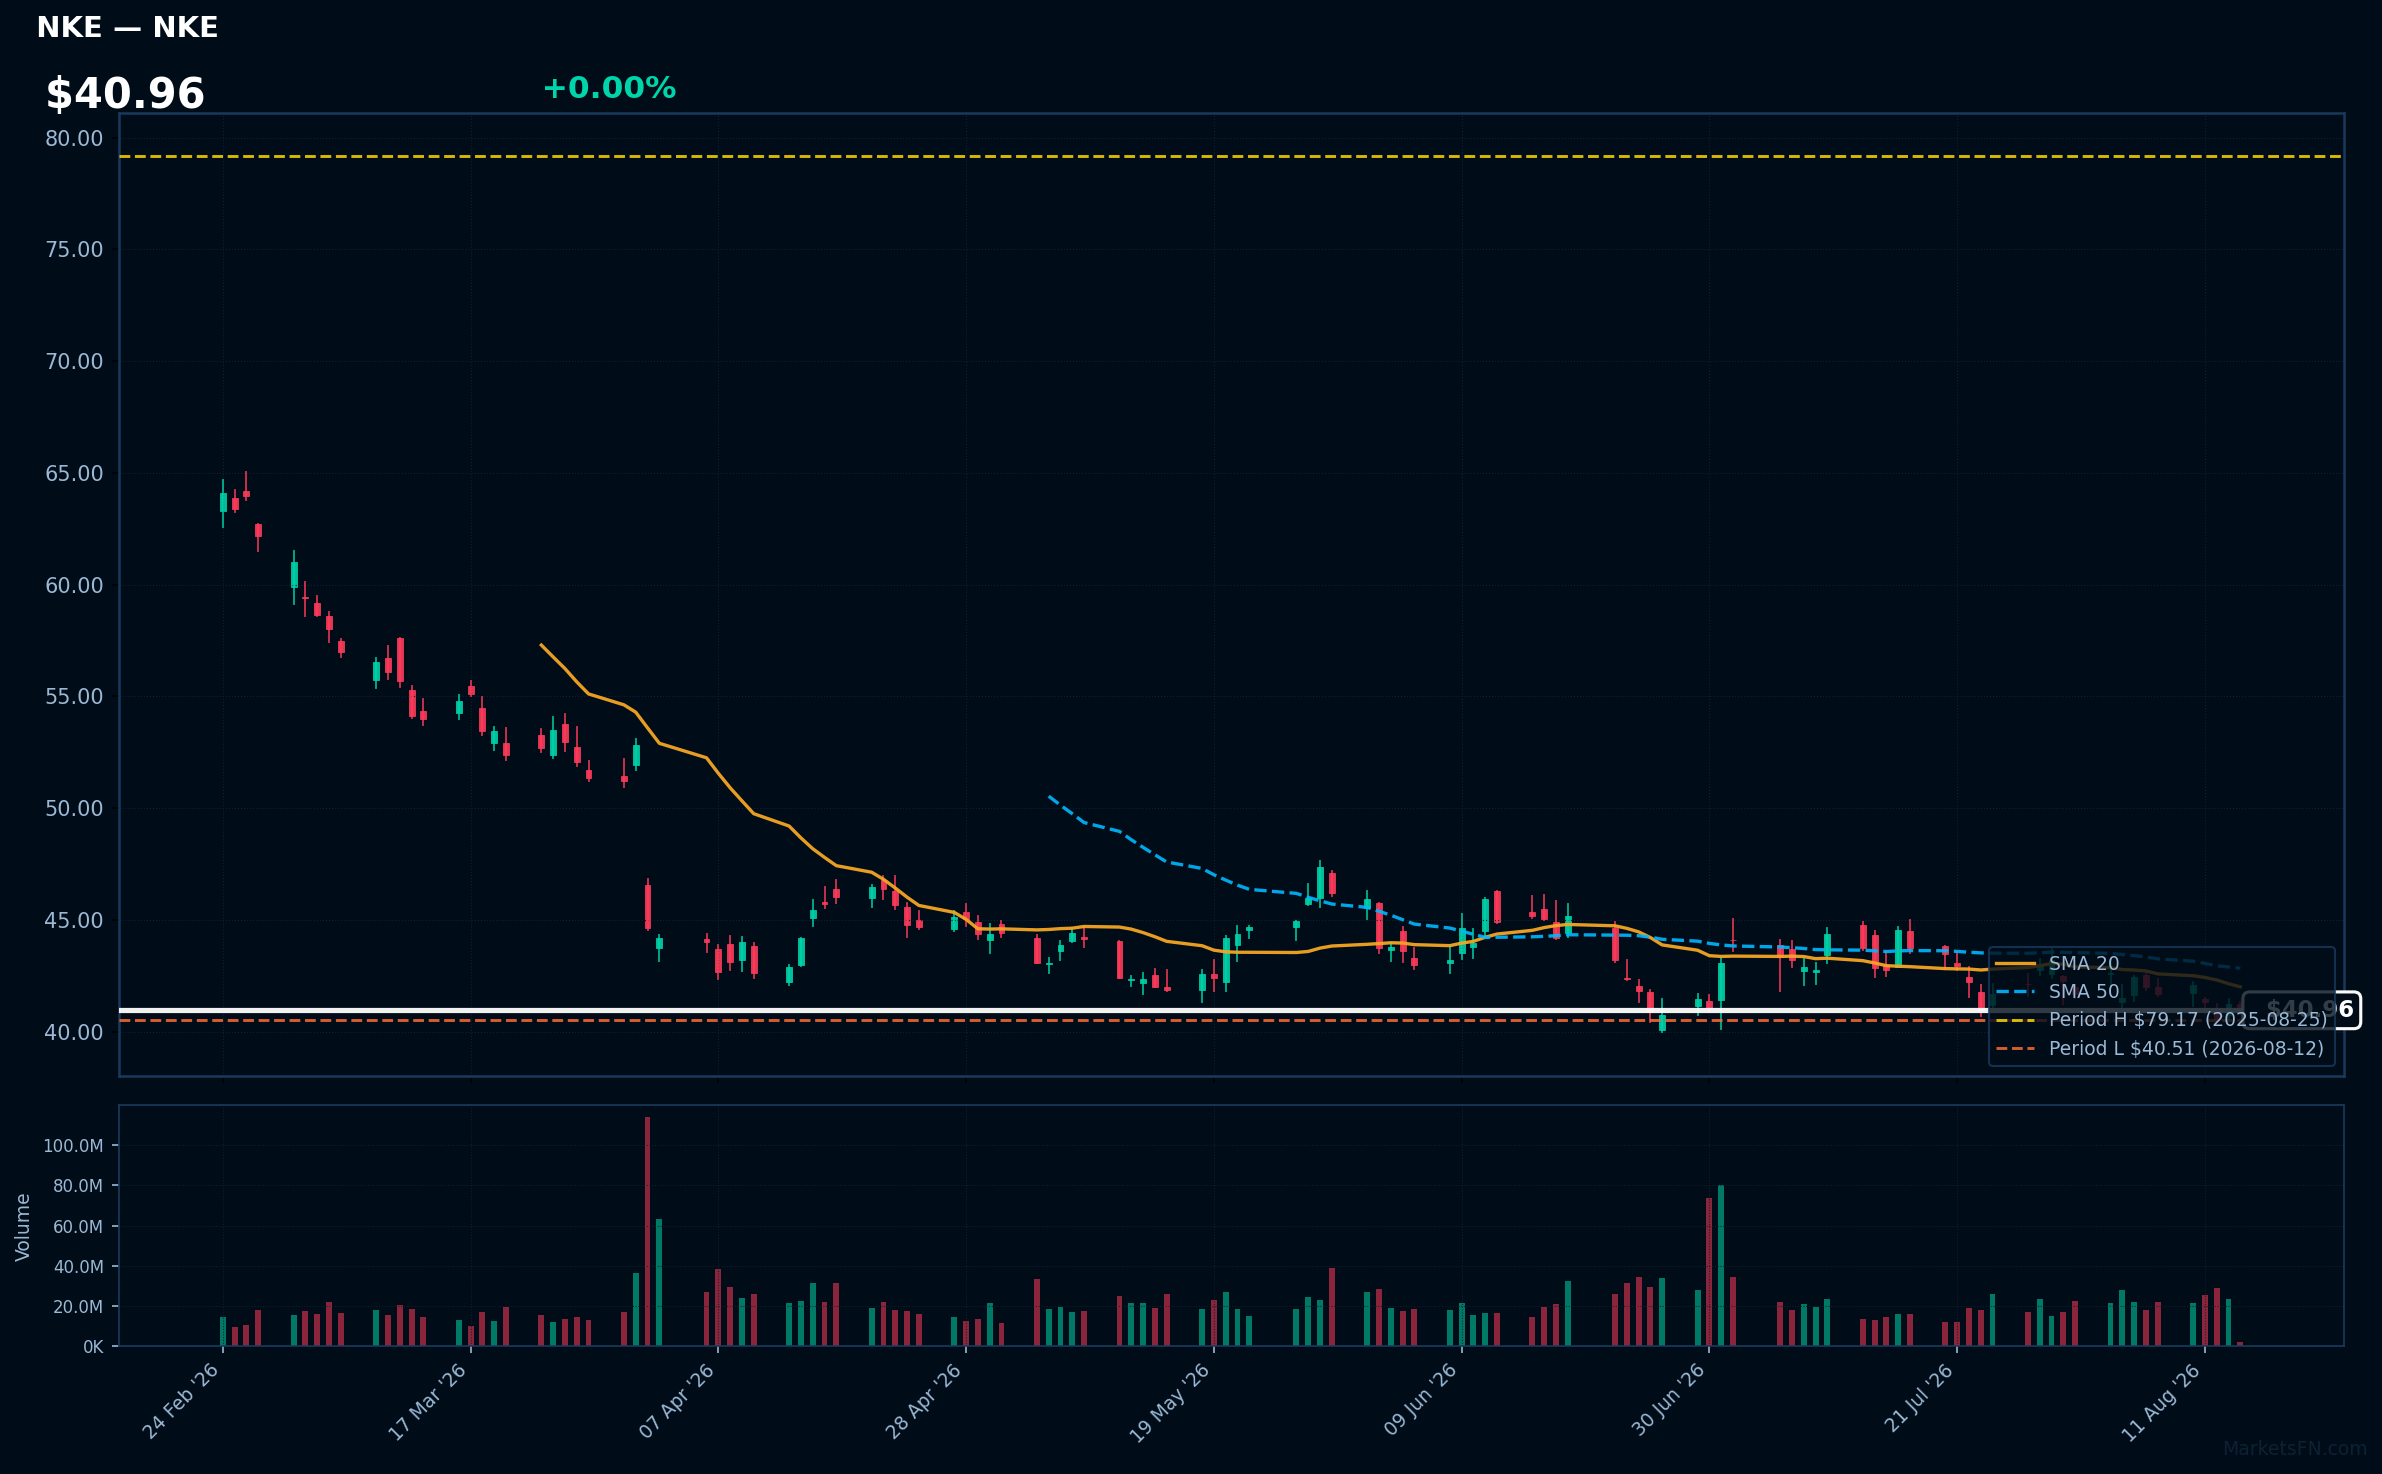
NKE | Nike, Inc | Consumer Cyclical | Price Last: $40.98 | % Realized: -46.35% | RSI: 43.1 | % above MA200: -23.0% | Trend: Below MA20, MA50, MA200
Nike, Inc. designs, develops, and markets athletic footwear, apparel, and equipment. Investors should care due to its strong brand presence and innovation in sportswear, which can drive consumer demand and market share.
The current technical situation indicates a bearish trend with an RSI(14) of 43.1 and a MA alignment of price < MA20 < MA50 < MA200, signaling potential weakness.
Related headlines
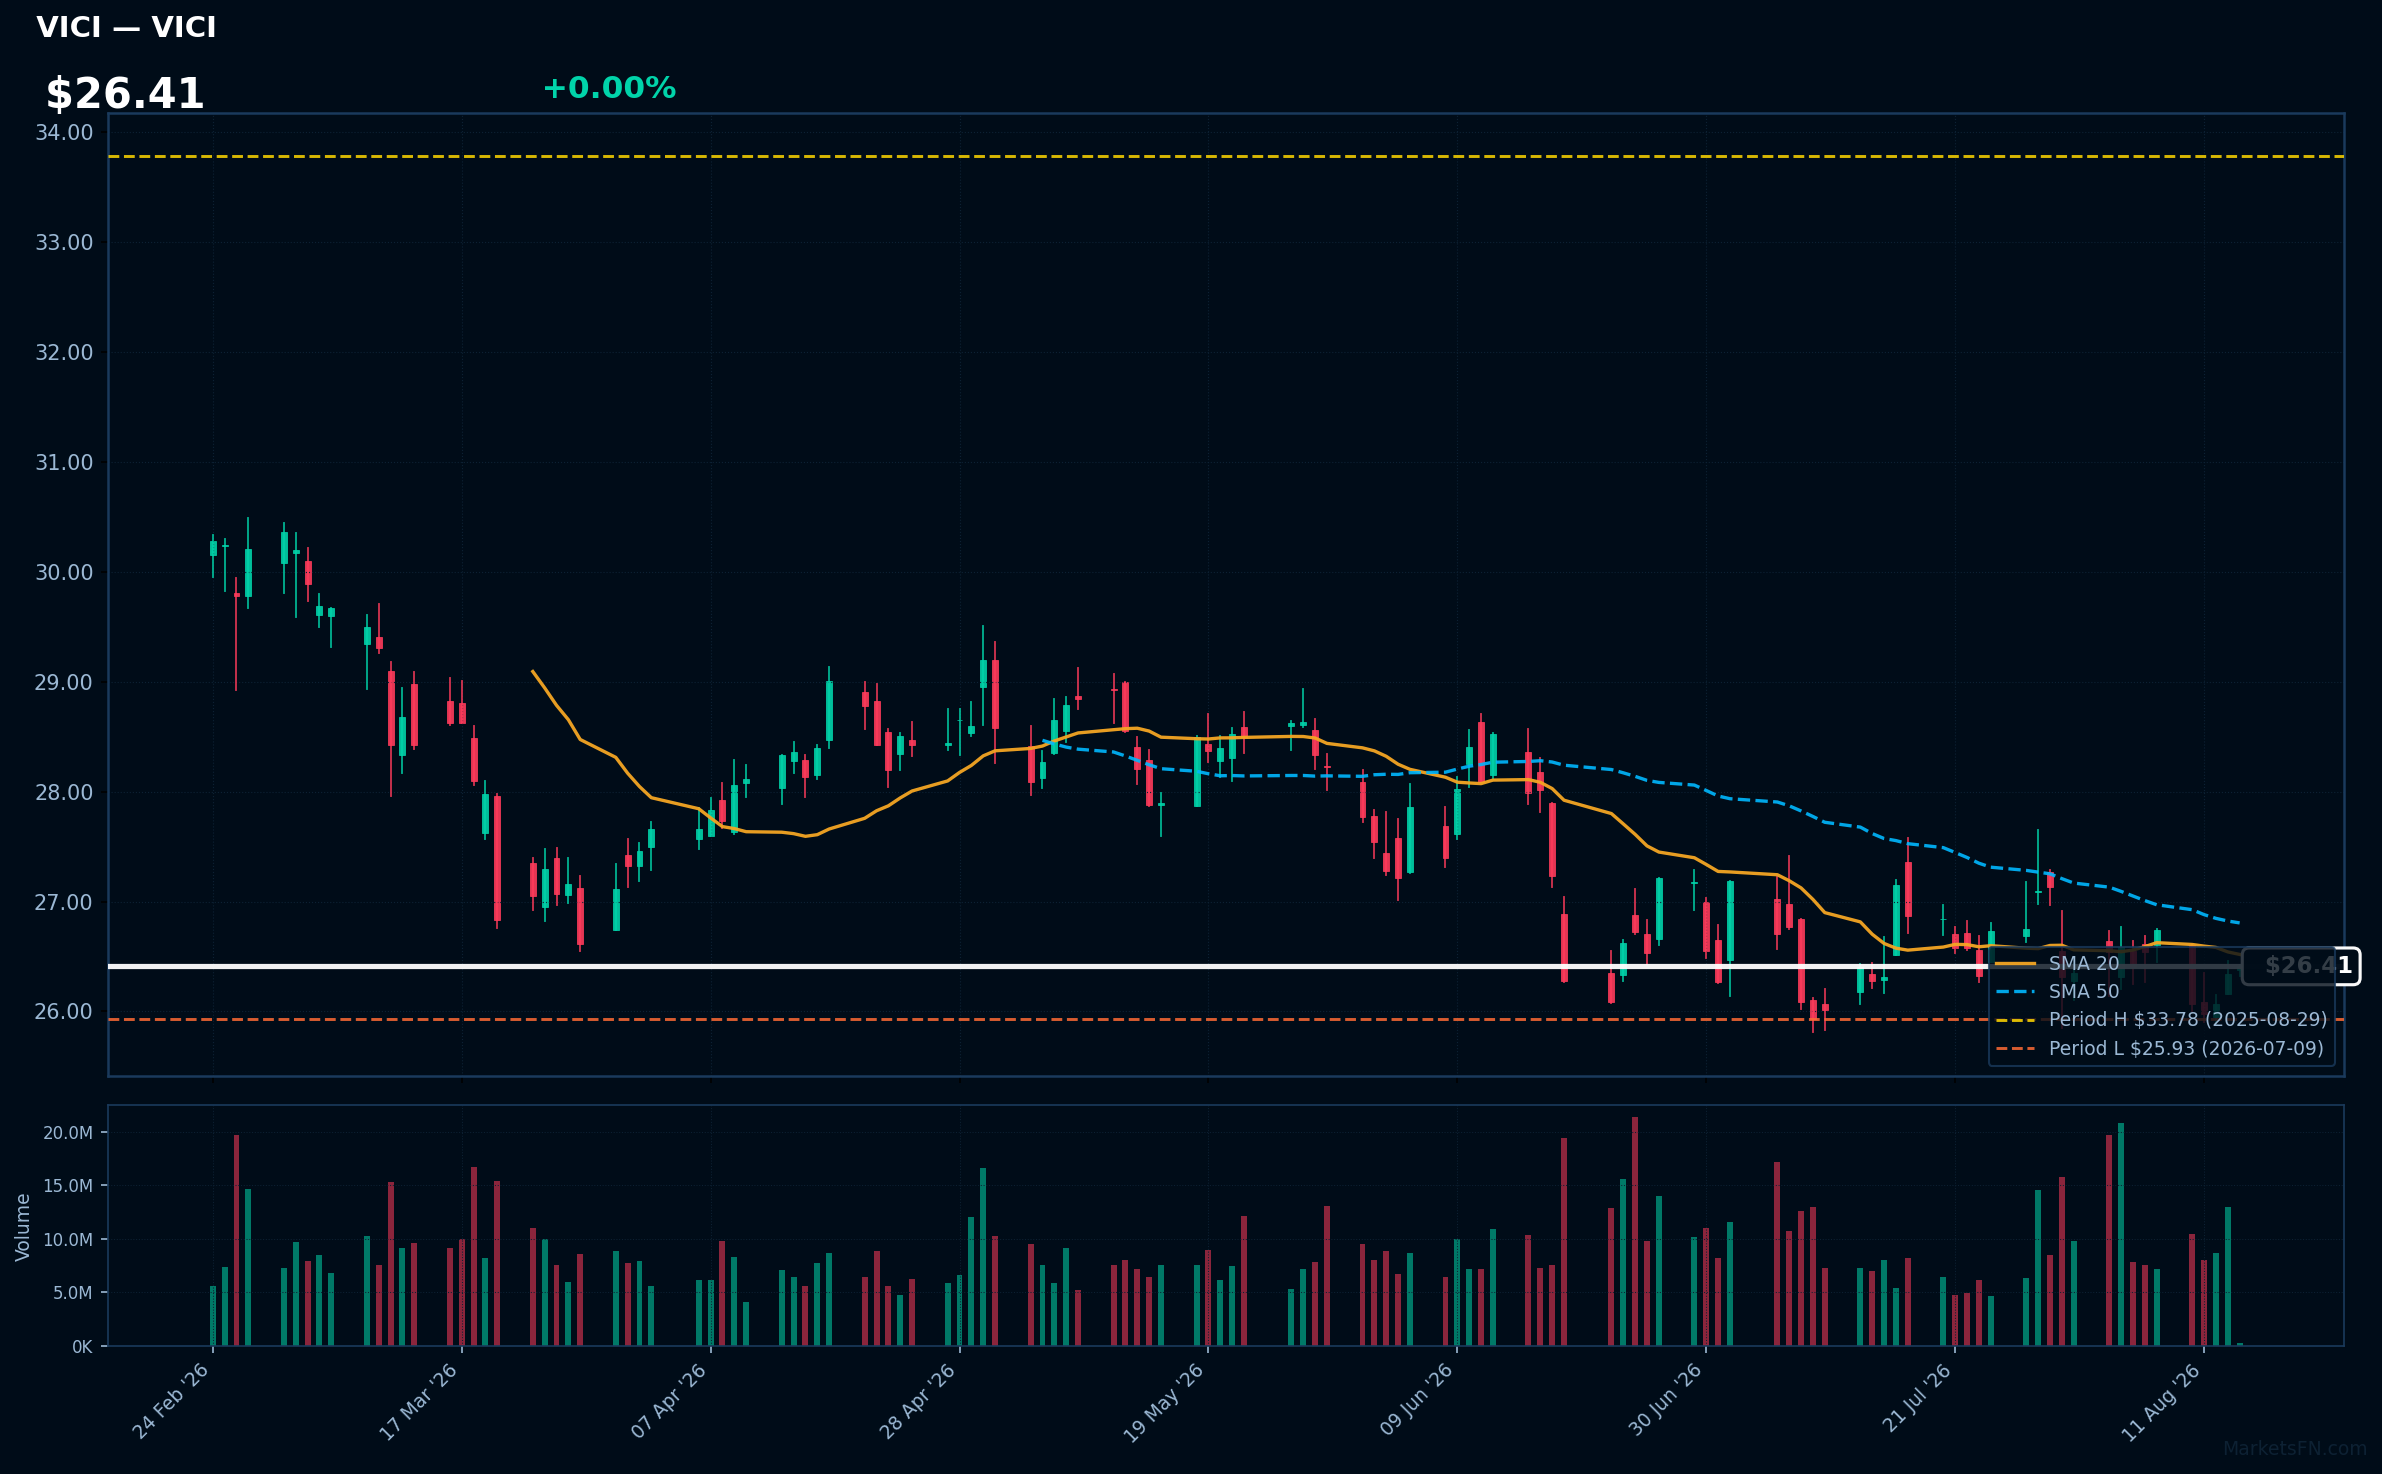
VICI | VICI Properties Inc | Real Estate | Price Last: $26.40 | % Realized: -19.04% | RSI: 47.8 | % above MA200: -6.3% | Trend: Below MA20, MA50, MA200
VICI Properties Inc is a real estate investment trust (REIT) that owns and leases gaming, hospitality, and entertainment properties. Investors should care due to its focus on high-demand sectors, providing potential for stable income and growth through long-term leases with established operators.
The current technical situation indicates a bearish trend, with an RSI(14) of 47.8 and a MA alignment of price < MA20 < MA50 < MA200, suggesting sustained downtrend and testing major support, as the stock is only 1.8% above its 52-Week low.
Related headlines
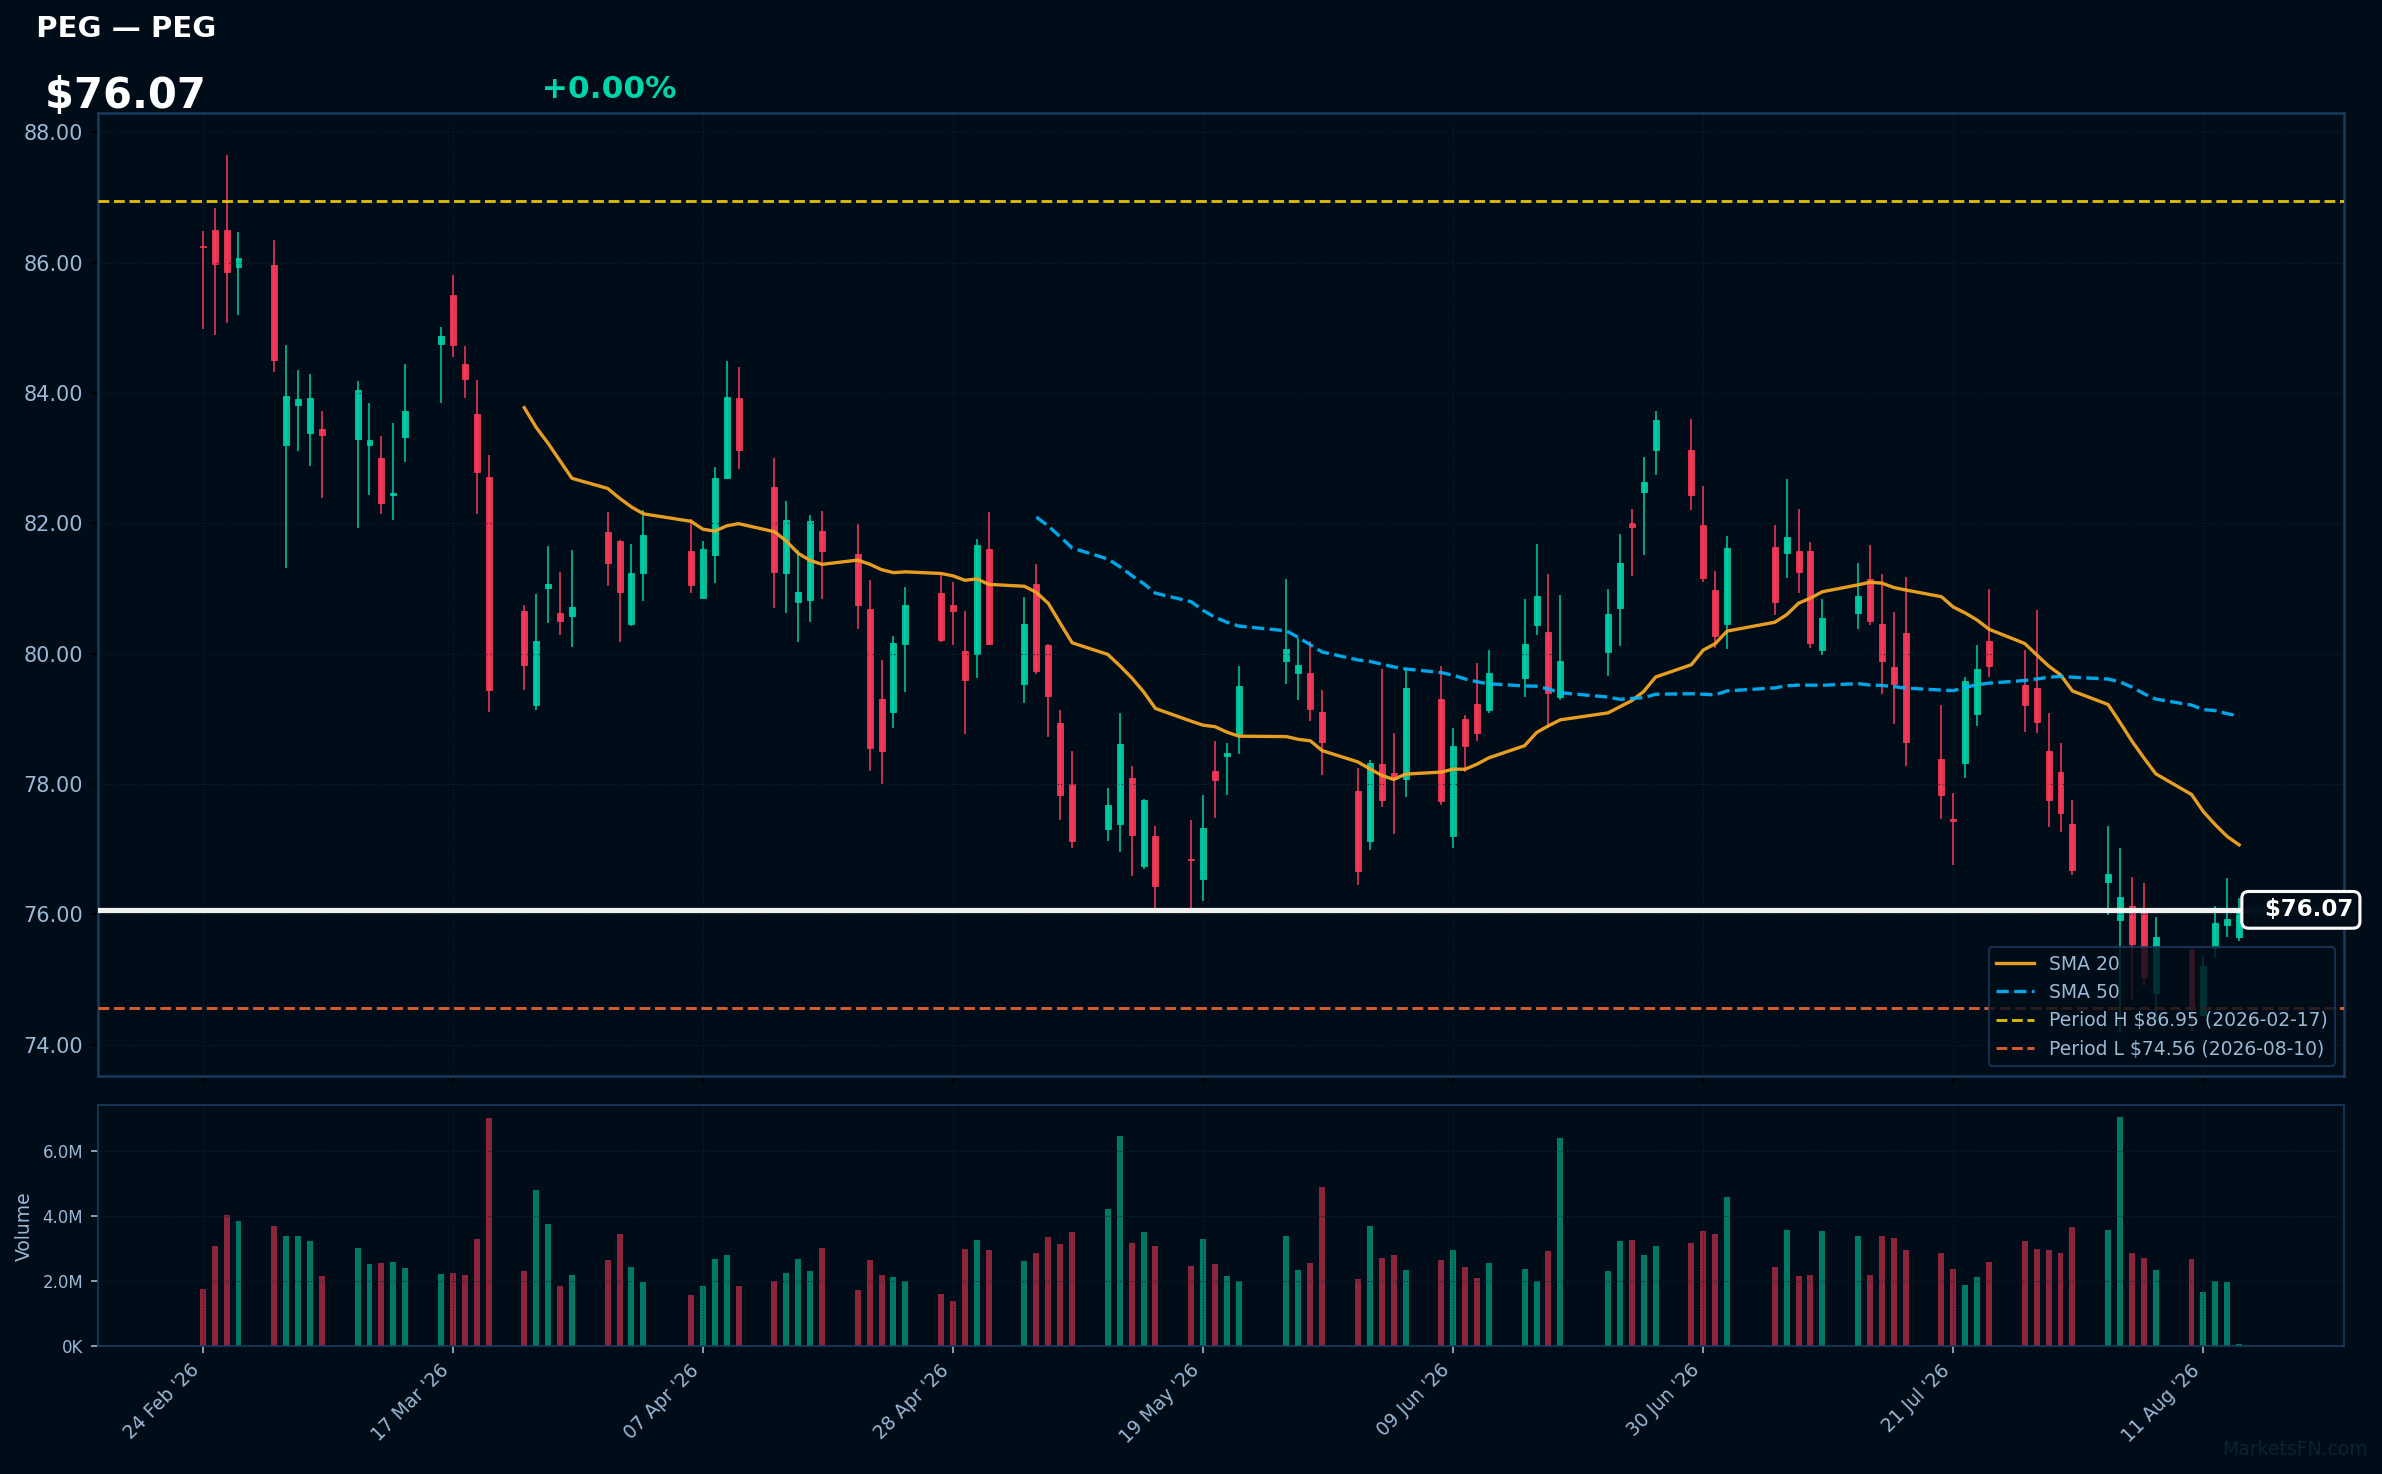
PEG | Public Service Enterprise Group Inc | Utilities | Price Last: $76.10 | % Realized: -12.33% | RSI: 41.3 | % above MA200: -5.5% | Trend: Below MA20, MA50, MA200
Public Service Enterprise Group Inc (PEG) is a utility holding company that provides electricity and natural gas services. Investors should care due to its critical role in energy infrastructure and regulatory environment, impacting revenue stability and growth potential amid evolving energy demands.
The current technical situation indicates a bearish trend, with an RSI(14) of 41.3 and a MA alignment of price < MA20 < MA50 < MA200, suggesting sustained downtrend and potential warning signs as the stock is 2.1% above its 52-Week low.
Related headlines
- Public Service Enterprise Group Inc (PEG) (Q2 2026) Earnings Call Highlights: Reaffirms ...
- Public Service Enterprise Group Incorporated Q2 2026 Earnings Call Summary
- Public Service Enterprise Group Incorporated Q1 2026 Earnings Call Summary
- Is Public Service Enterprise Stock Underperforming the Nasdaq?
Market Commentary
The presence of several S&P 500 stocks near their 52-week highs, including JPMorgan Chase & Co, Charles Schwab Corp, and Airbnb Inc, signals strong investor confidence and bullish sentiment in the market. These stocks are currently at 0.0% from their respective 52-week highs, indicating robust performance and potential upward momentum. Conversely, stocks like Rollins, Inc and Nike, Inc are hovering near their 52-week lows, suggesting caution among investors and potential challenges in their respective sectors.
This divergence may reflect broader sector rotation trends, where investors shift focus from growth-oriented stocks to value stocks or vice versa, influenced by macroeconomic themes such as interest rate changes and inflation concerns. The financial sector, represented by firms like PNC Financial Services Group Inc and U.S. Bancorp, appears to be benefiting from rising rates, while consumer discretionary stocks like Nike may be facing headwinds due to changing consumer spending patterns.
Key levels to watch include the 52-week highs for the stocks nearing these extremes, as breaking through these levels could signal further bullish trends. For those near their lows, any significant recovery could indicate a potential turnaround. Catalysts such as upcoming earnings reports or economic data releases could also impact these stocks' trajectories, making it essential for investors to stay informed on market developments.
Methodology: All 503 S&P 500 constituents screened. 52-week high = highest daily close over the past 252 trading days (approx. 1 year). 52-week low = lowest daily close over the same period. Distance = (current price / extreme − 1) × 100. Technical indicators computed on up to 1 year of daily OHLCV data.
Disclaimer: For informational purposes only. Not investment advice. Past performance is not indicative of future results.

