S&P 500 52-Week Highs & Lows Radar: Philip Morris (PM), International Business Machines (IBM) and more
MarketsFN Team

S&P 500 52-Week Highs & Lows Radar: Philip Morris (PM), International Business Machines (IBM) and more
Screening all 503 S&P 500 constituents for stocks nearest to their 52-week high and their 52-week low. Data as of July 22, 2026. % Realized = 52-week total return.
Legend: RSI > 70 = overbought · RSI < 30 = oversold · Green % Realized = positive 52W return · Red = negative.
📈 Nearest to 52-Week High
Sectors represented: Energy (2), Consumer Defensive (1), Industrials (1), Basic Materials (1)
| Ticker | Company | Sector | Price Last | % Realized | 52-Week High Date | RSI | % above MA200 | Trend |
|---|---|---|---|---|---|---|---|---|
| PM | Philip Morris International Inc | Consumer Defensive | $193.98 | +17.37% | 2026-07-22 | 61.3 | +15.0% | Above MA20, MA50, MA200 |
| MPC | Marathon Petroleum Corp | Energy | $323.54 | +84.62% | 2026-07-22 | 80.9 | +48.7% | Above MA20, MA50, MA200 |
| PSX | Phillips 66 | Energy | $214.40 | +69.94% | 2026-07-22 | 76.8 | +36.2% | Above MA20, MA50, MA200 |
| PCAR | Paccar Inc | Industrials | $129.48 | +31.35% | 2026-02-11 | 64.6 | +13.0% | Above MA20, MA50, MA200 |
| CTVA | Corteva Inc | Basic Materials | $88.14 | +19.51% | 2026-07-22 | 66.9 | +18.5% | Above MA20, MA50, MA200 |
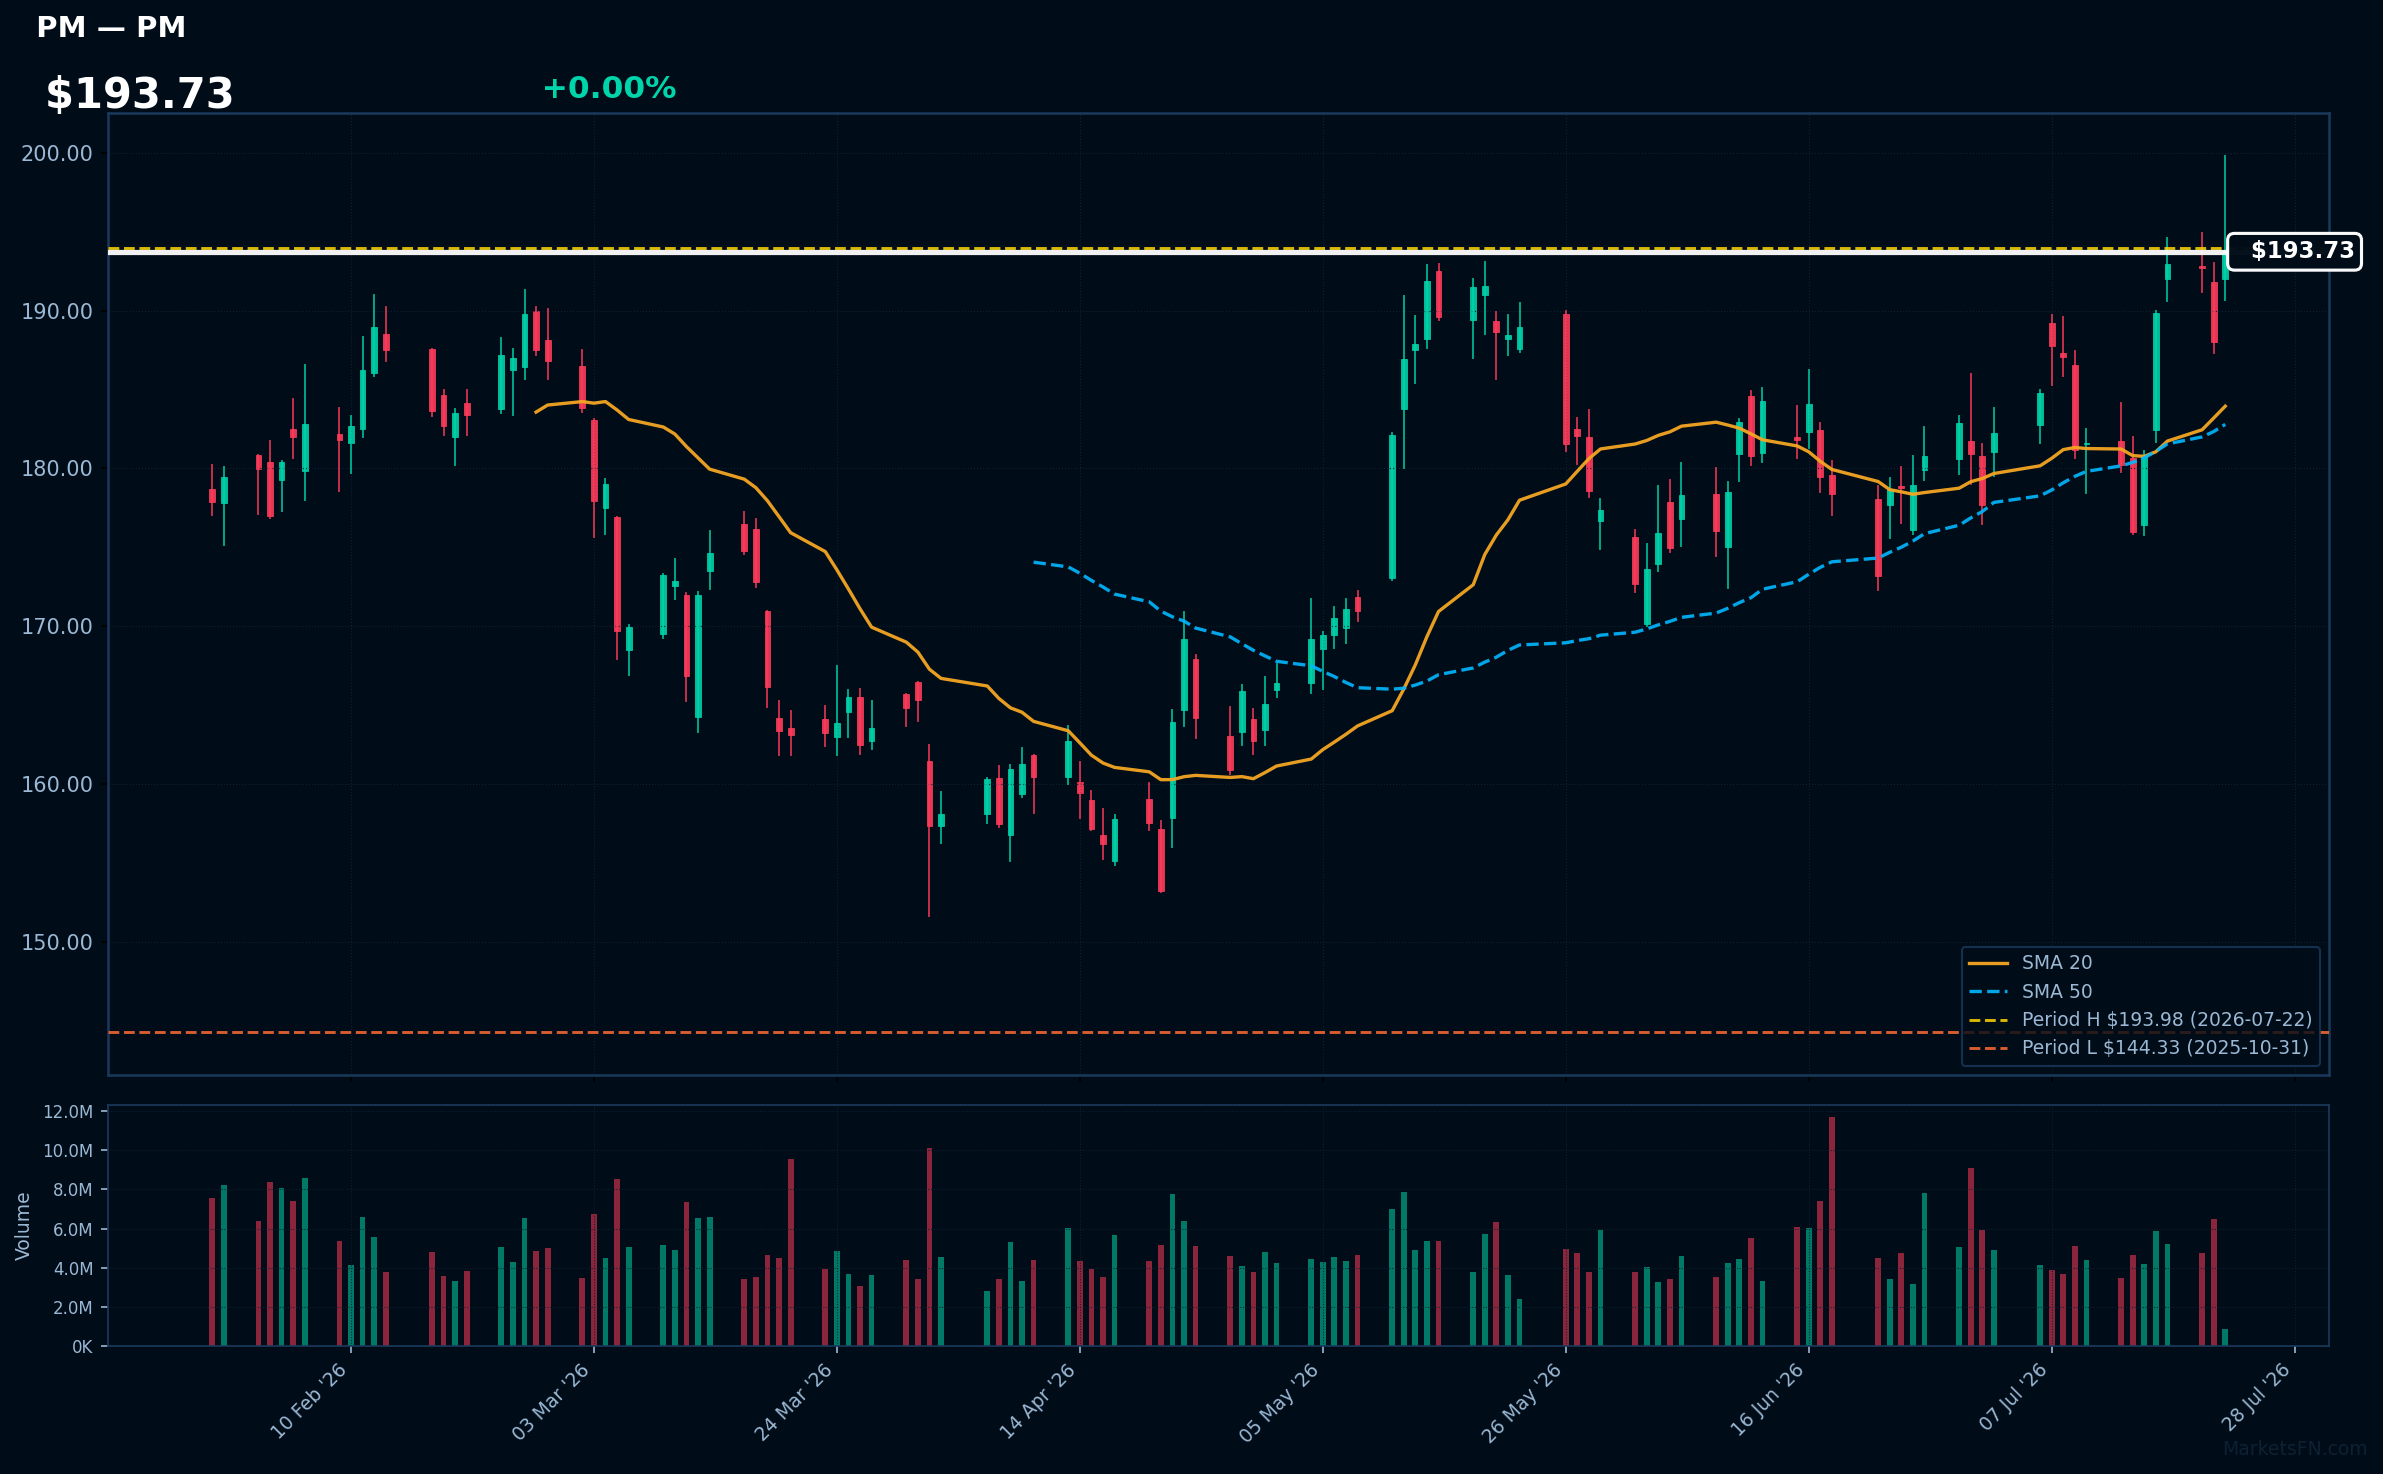
PM | Philip Morris International Inc | Consumer Defensive | Price Last: $193.98 | % Realized: +17.37% | RSI: 61.3 | % above MA200: +15.0% | Trend: Above MA20, MA50, MA200
Philip Morris International Inc is a leading tobacco company with a portfolio of iconic cigarette brands. Investors should care about its ability to navigate regulatory pressures and drive sales growth through heated tobacco and next-generation products.
The stock shows bullish MA alignment with price > MA20 > MA50 > MA200 and RSI(14) at 61.3, indicating sustained uptrend momentum. Near its 52-Week high, it's poised for a potential breakout.
Related headlines
- Philip Morris shares edge lower despite second-quarter earnings beat and record revenue (NYSE:PM)
- Philip Morris Stock Falls After It Cuts Guidance, but There Is One Bright Spot
- Philip Morris beats on earnings but stock edges lower on weak guidance
- Philip Morris Sales Boosted by Growth in International Business
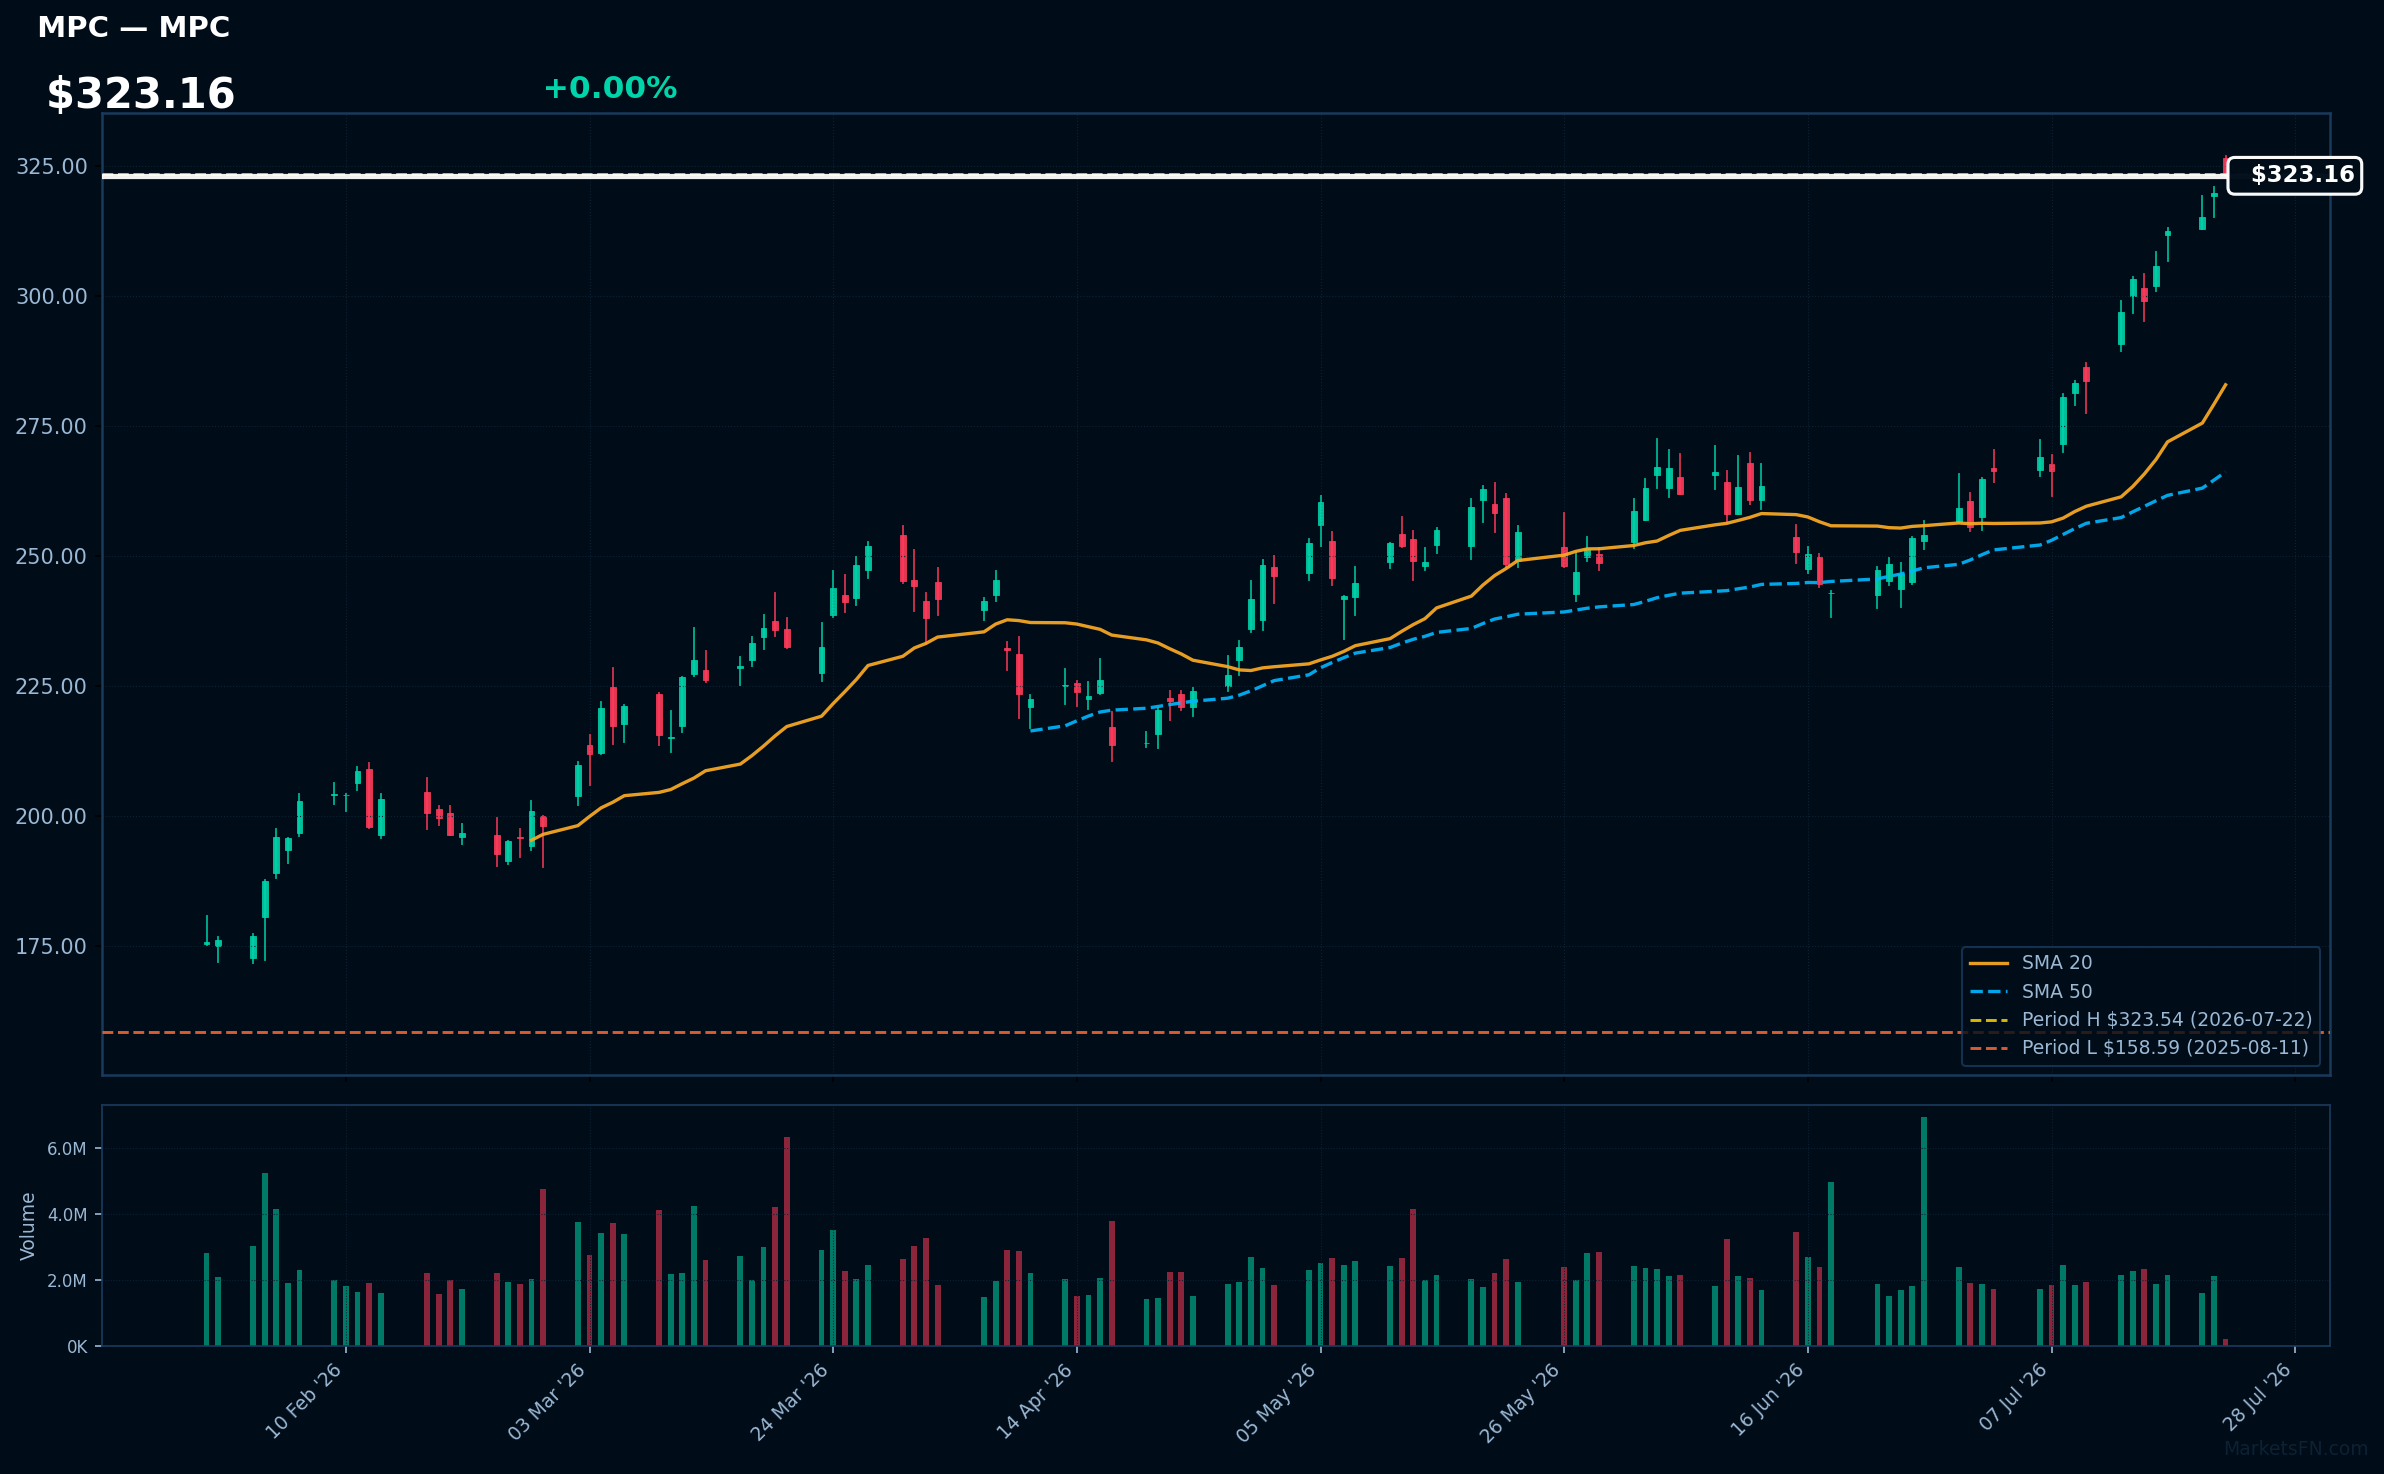
MPC | Marathon Petroleum Corp | Energy | Price Last: $323.54 | % Realized: +84.62% | RSI: 80.9 | % above MA200: +48.7% | Trend: Above MA20, MA50, MA200
Marathon Petroleum Corp is an energy company that refines, markets, and transports petroleum products. Investors should care about its refining capacity, logistics network, and market share, as these drive revenue and profitability in the energy sector.
The stock exhibits strong bullish momentum with RSI(14) at 80.9, indicating overbought conditions. MA alignment is bullish (price > MA20 > MA50 > MA200), and the stock is 0.0% below its 52-Week high, suggesting a potential breakout.
Related headlines
- BP, Marathon, 7-Eleven, Walmart sued for allegedly using AI to boost California gas prices
- Marathon Petroleum Corp. to Report Second-Quarter Financial Results on August 4, 2026
- Marathon Petroleum Corp. names Brian Worthington vice president, Investor Relations; Kristina Kazarian to become vice president, Finance and Treasurer
- MPC- A US Refiner Benefitting from Tighter Jet Fuel Market
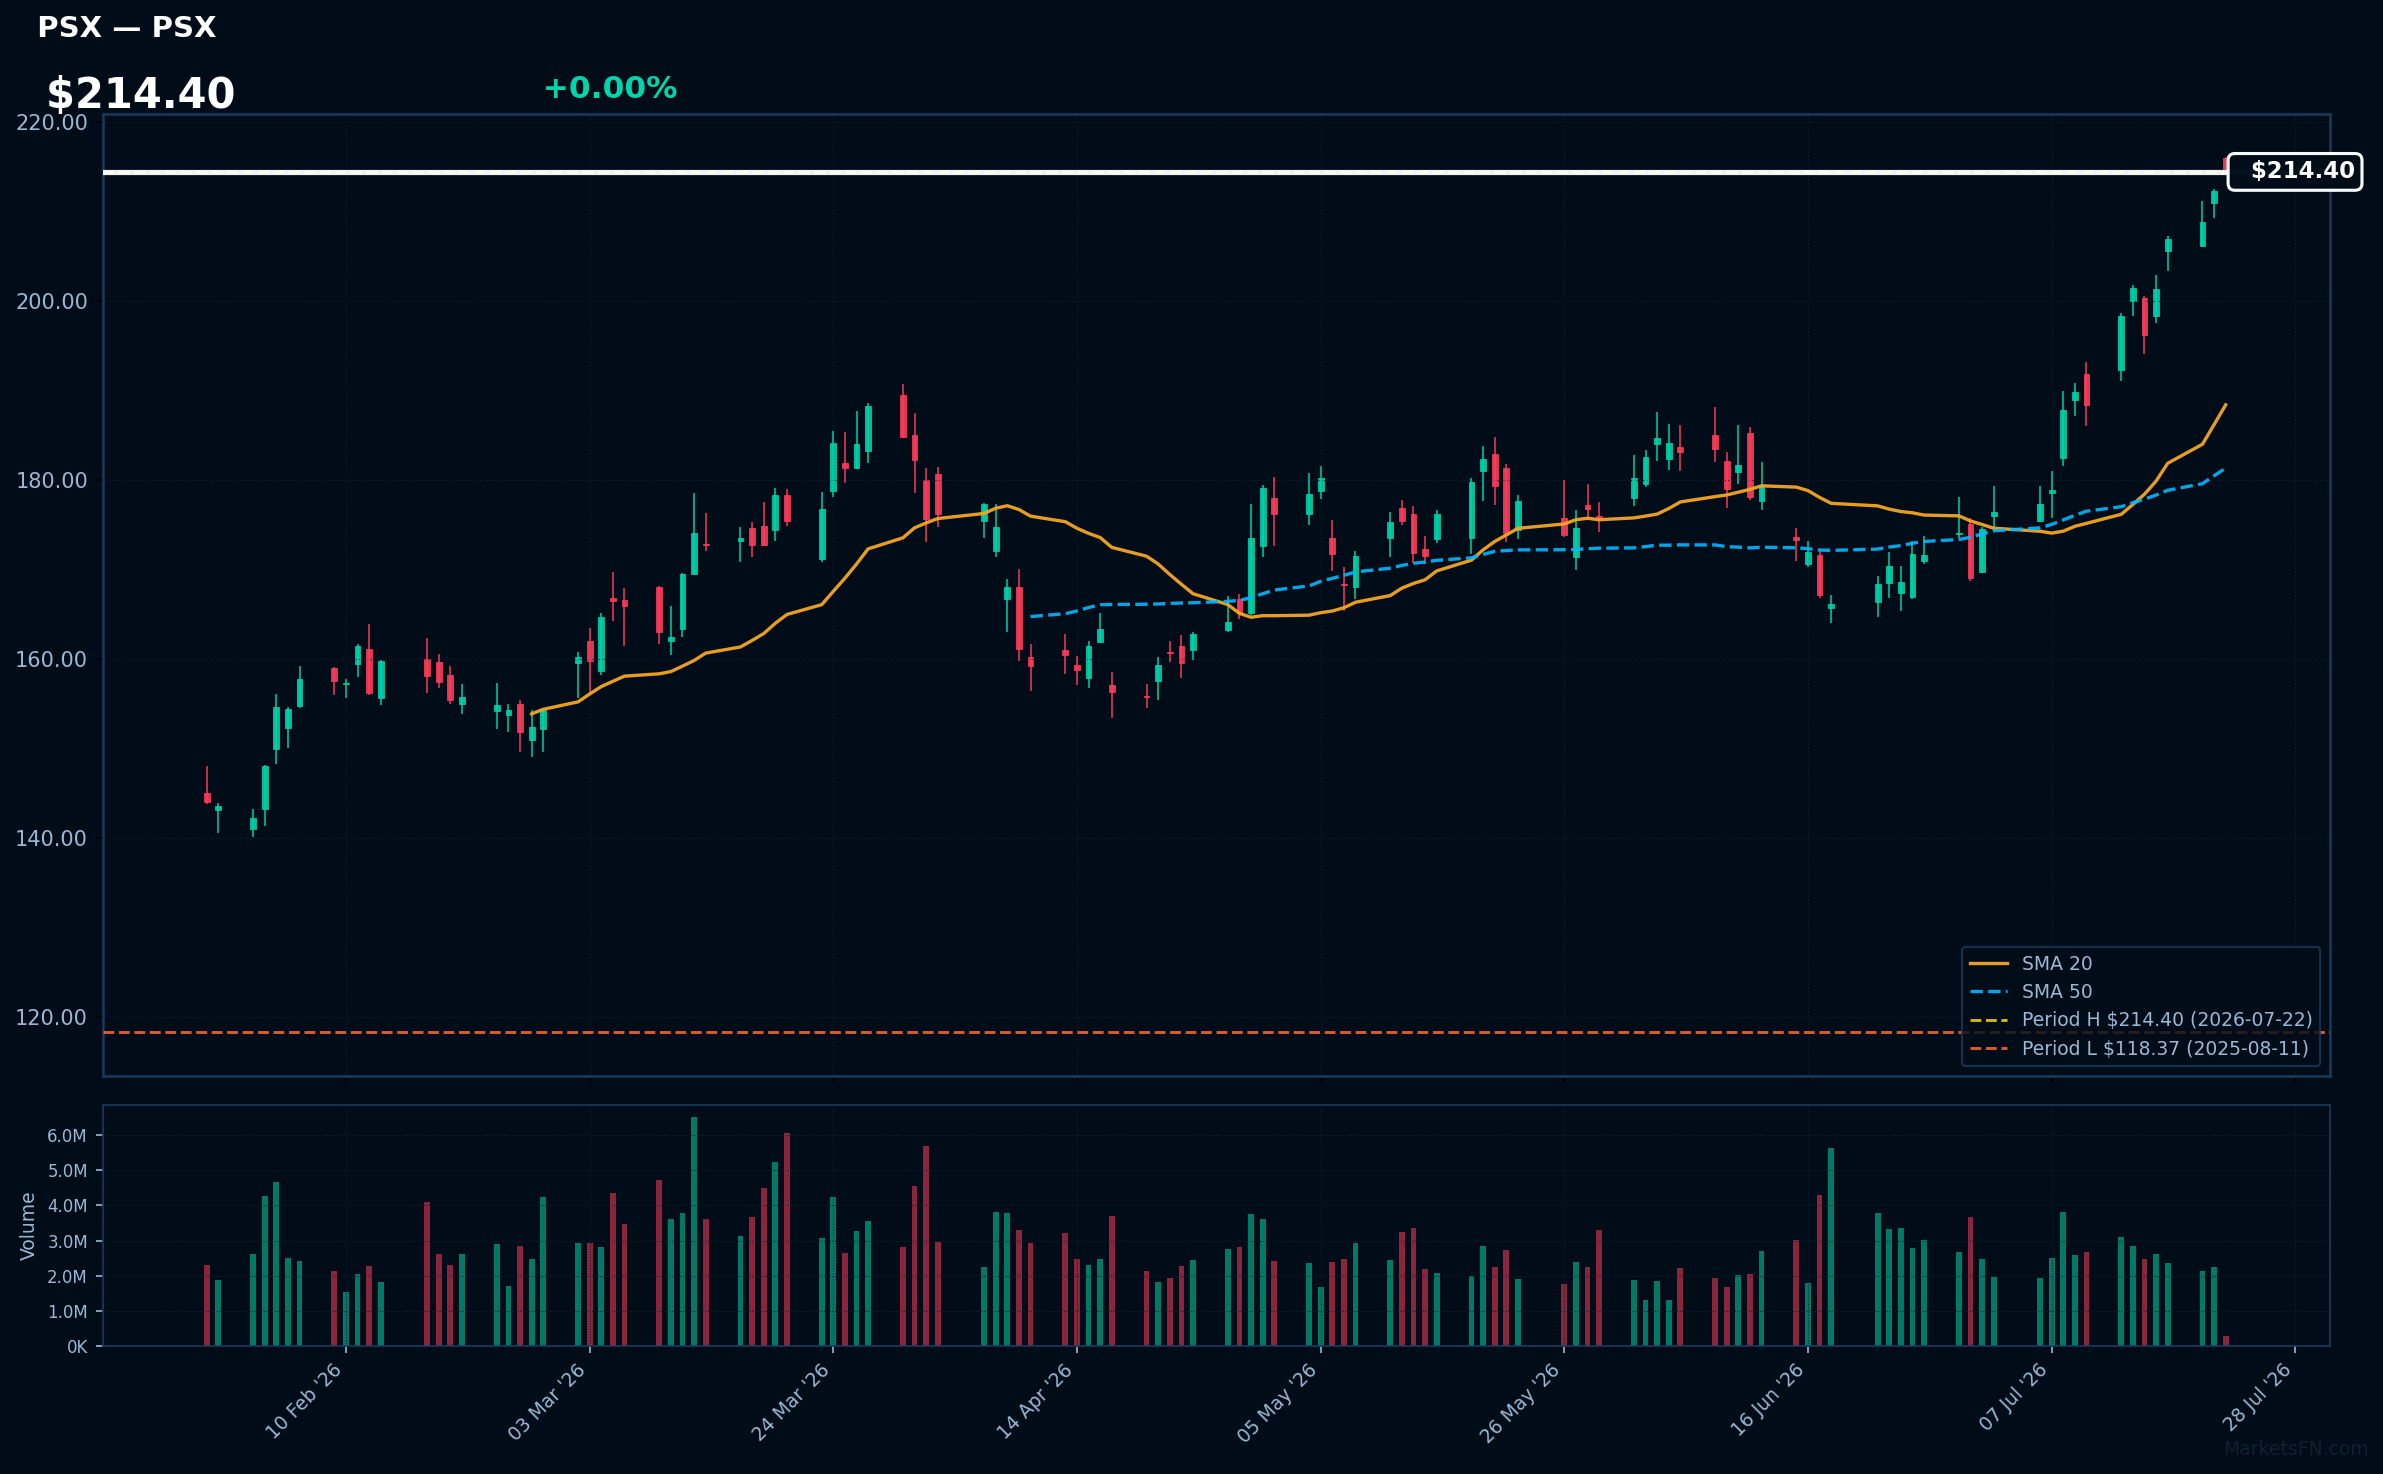
PSX | Phillips 66 | Energy | Price Last: $214.40 | % Realized: +69.94% | RSI: 76.8 | % above MA200: +36.2% | Trend: Above MA20, MA50, MA200
Phillips 66 is a diversified energy company with midstream, chemicals, refining, and marketing segments. Investors should care about its refining margins, pipeline throughput, and chemical production, which drive revenue and profitability.
Phillips 66's RSI(14) is 76.8, indicating strong momentum with price > MA20 > MA50 > MA200, a sustained uptrend. At 0.0% below its 52-Week high, it nears a potential breakout, with a 69.9% 52-Week return, suggesting continued upward pressure.
Related headlines
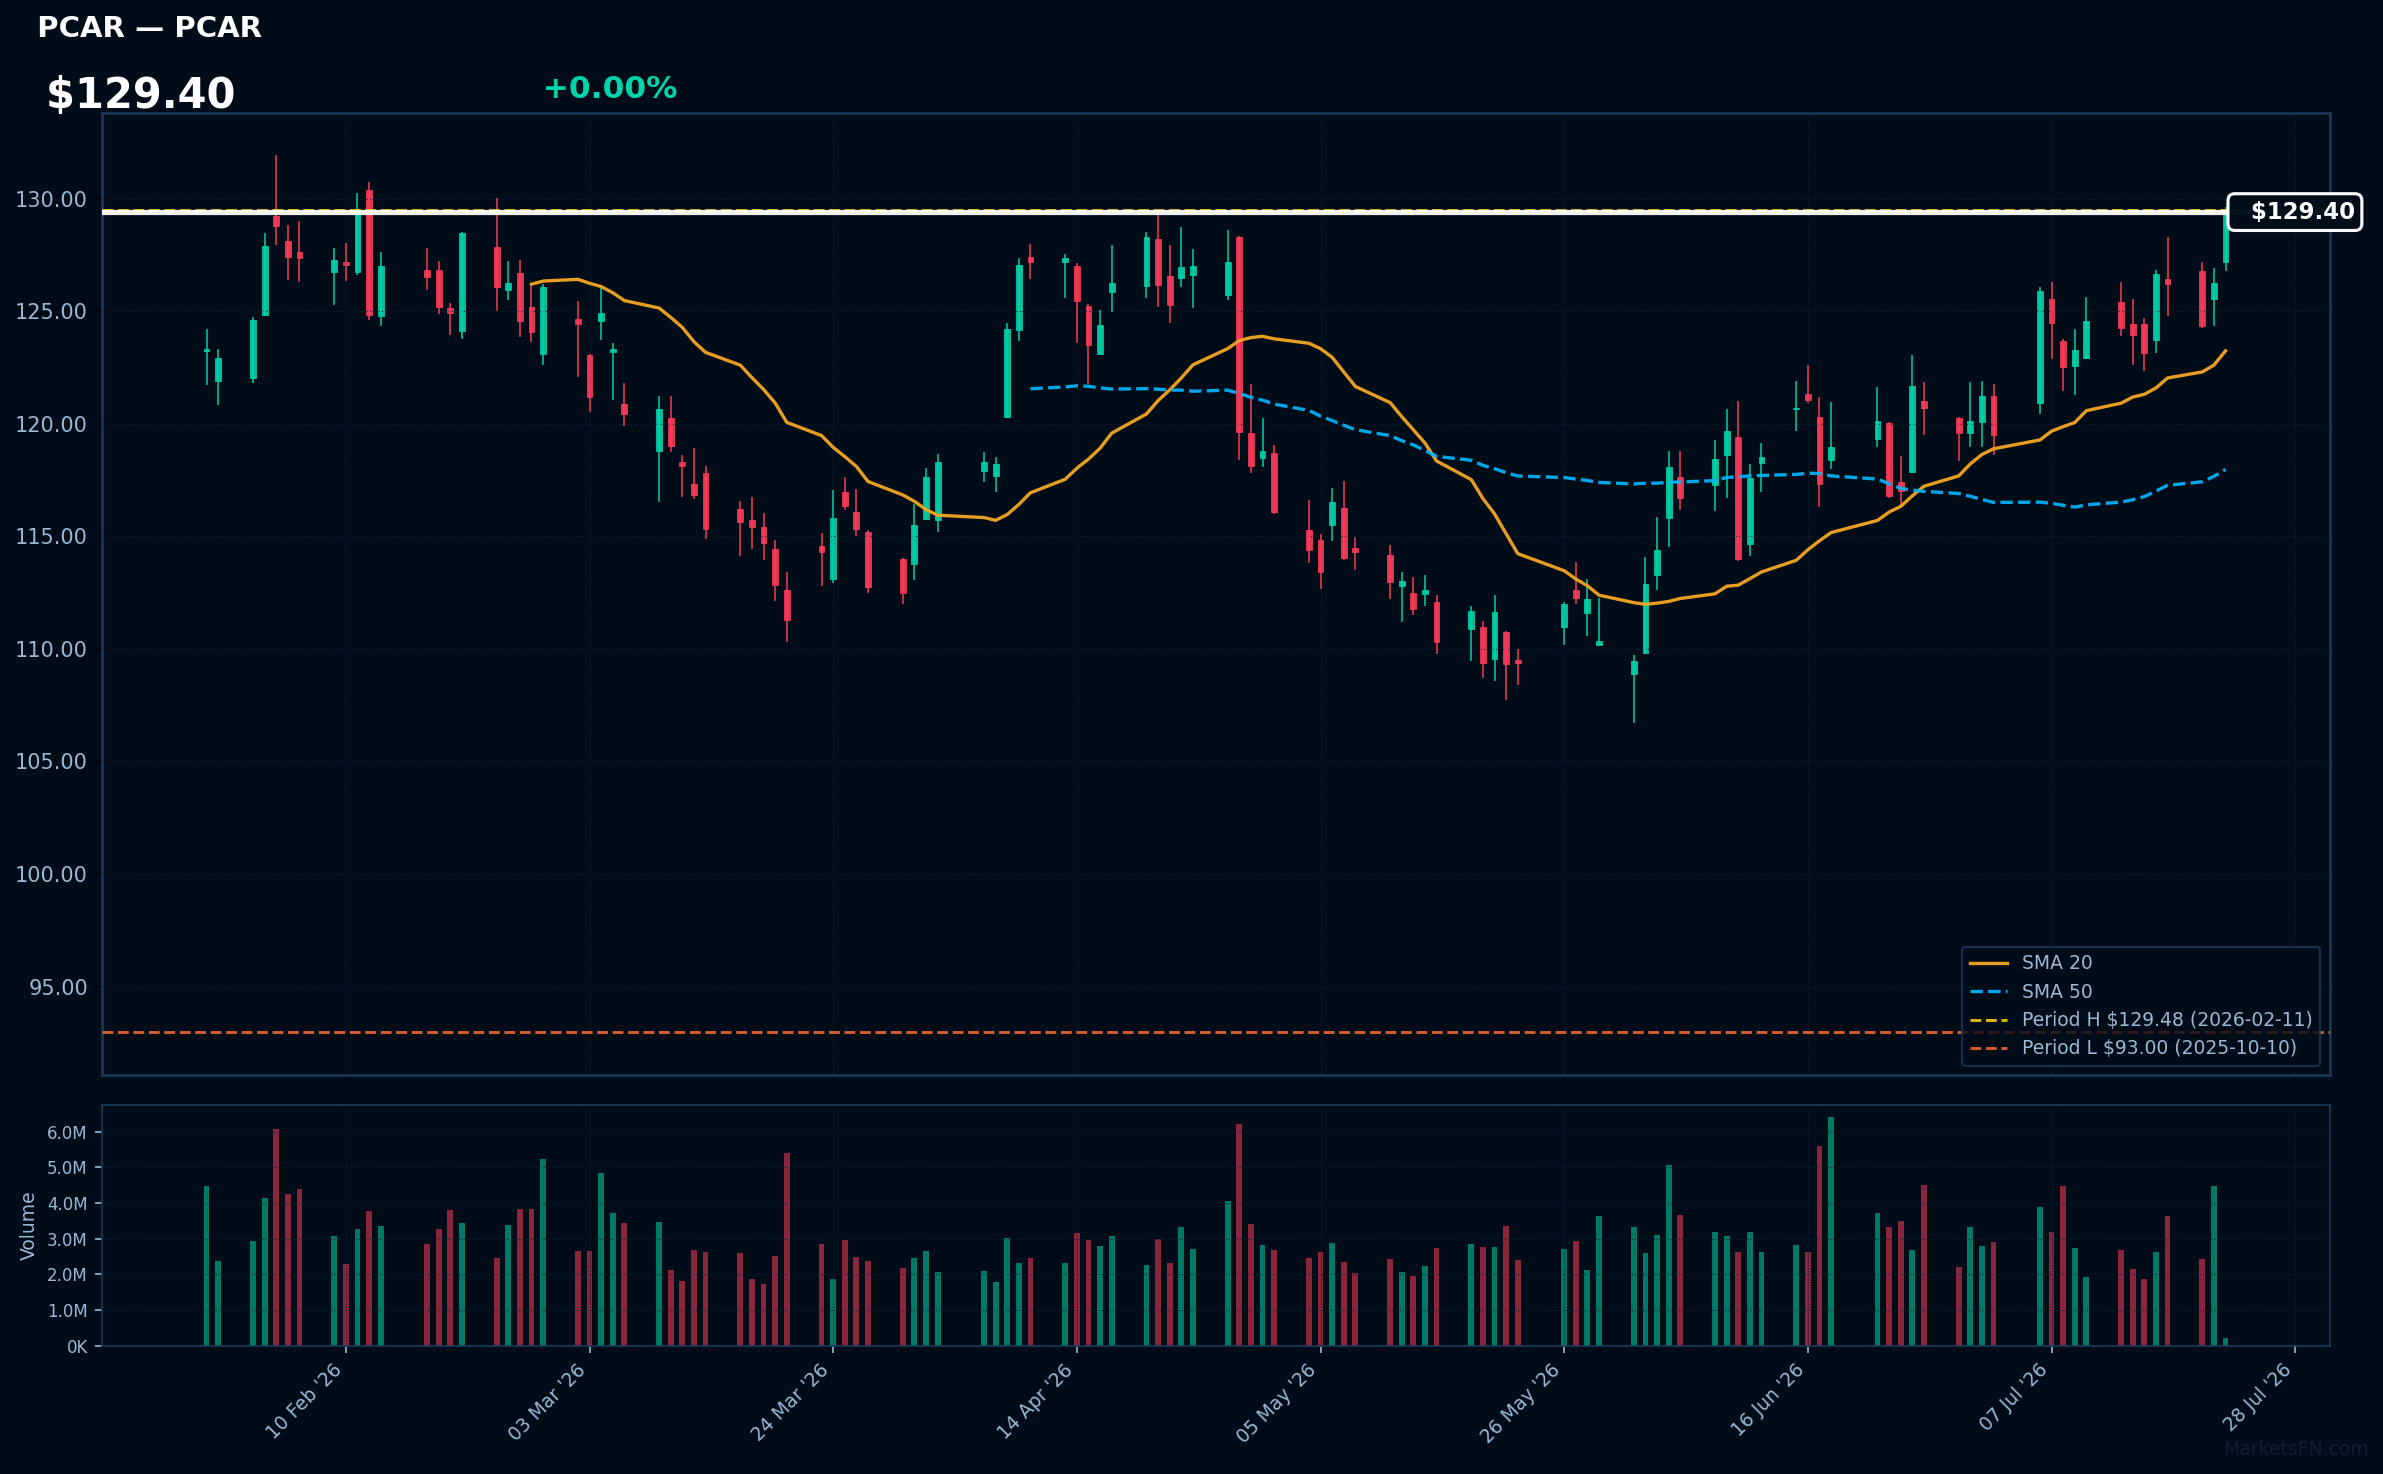
PCAR | Paccar Inc | Industrials | Price Last: $129.48 | % Realized: +31.35% | RSI: 64.6 | % above MA200: +13.0% | Trend: Above MA20, MA50, MA200
Paccar Inc designs and manufactures light-, medium-, and heavy-duty trucks under brands like Kenworth and Peterbilt. Investors should care because the company's truck sales are sensitive to economic cycles, making its performance a bellwether for the overall economy.
Paccar Inc's RSI is 64.6, indicating rising momentum. The stock is in a sustained uptrend with price > MA20 > MA50 > MA200, and is 0.0% below its 52-Week high, suggesting a potential breakout.
Related headlines
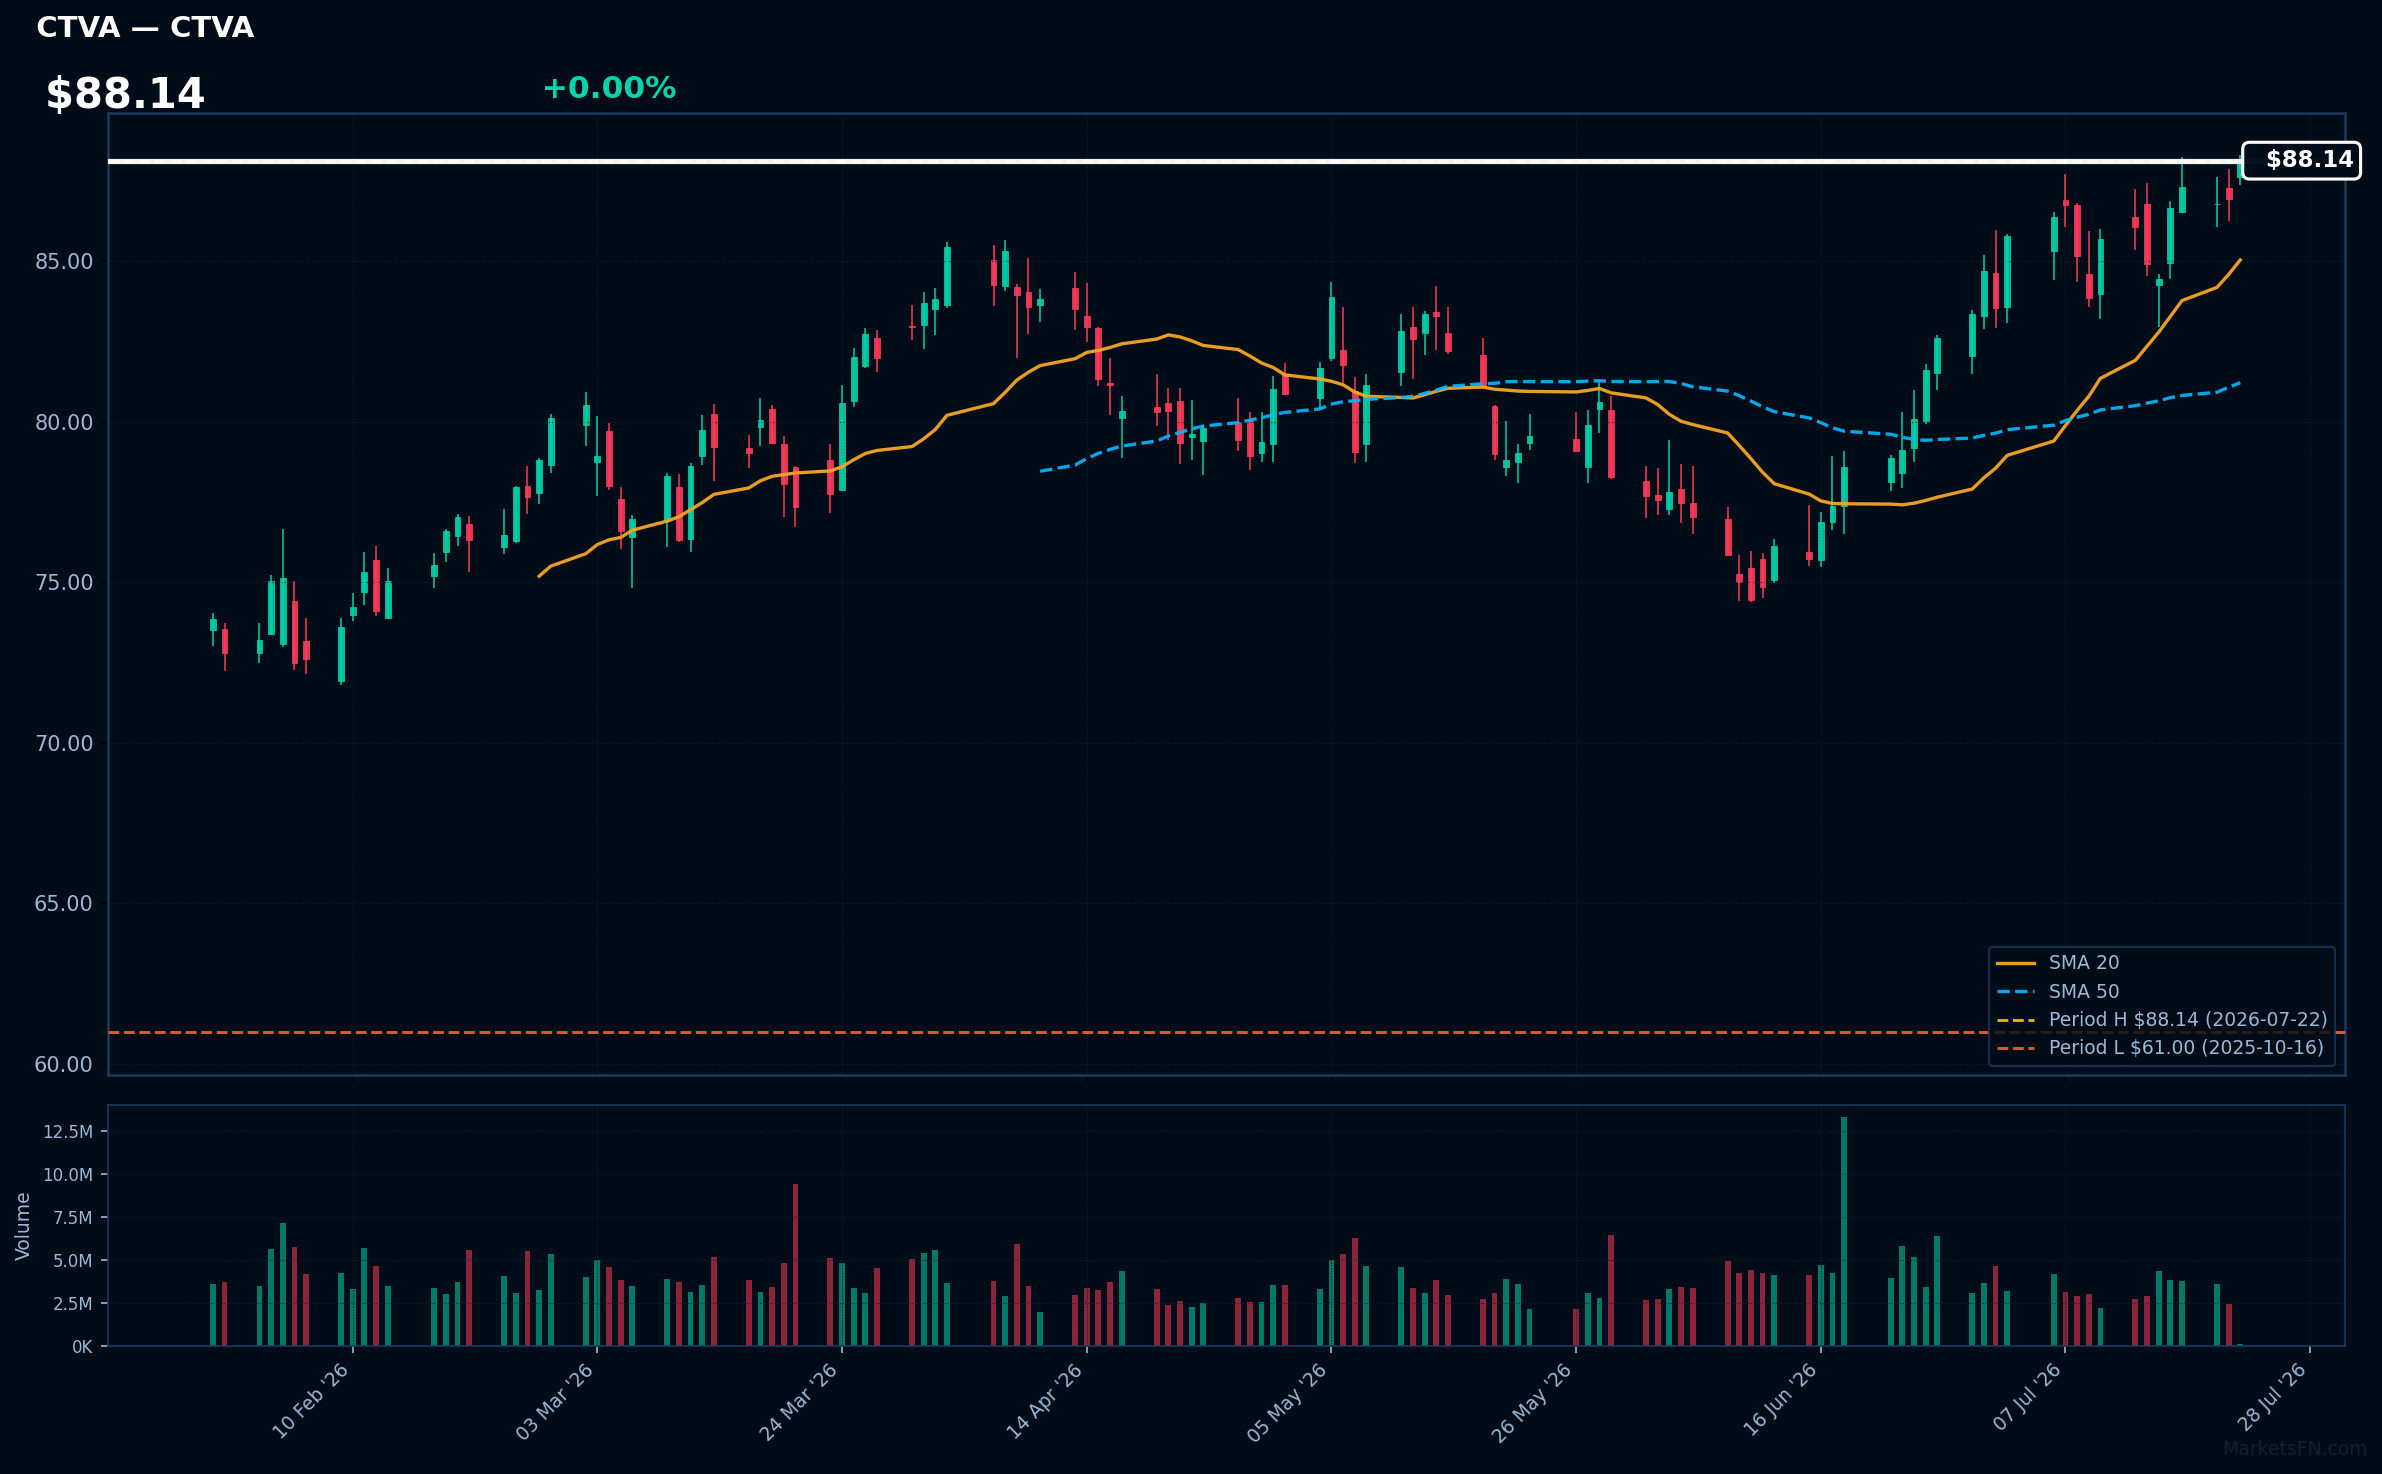
CTVA | Corteva Inc | Basic Materials | Price Last: $88.14 | % Realized: +19.51% | RSI: 66.9 | % above MA200: +18.5% | Trend: Above MA20, MA50, MA200
Corteva Inc is a leading global player in the agriculture sector, providing crop protection and seed solutions. Investors should care due to its significant presence in the essential agricultural inputs market, driven by demand for food security and sustainable farming practices.
Corteva's current technical situation indicates momentum, with an RSI(14) of 66.9 and a bullish MA alignment (price > MA20 > MA50 > MA200). The stock is 0.0% below its 52-Week high, nearing a potential breakout.
Related headlines
- Corteva Announces Board of Directors for Future Crop Protection Company
- Corteva Announces Board of Directors for Advanced Seed and Genetics Spin-Off Vylor
- FMC Corporation and Corteva Expand Access to Breakthrough Rimisoxafen Herbicide Technology
- Corteva to Participate in Wolfe's Materials of the Future Conference
📉 Nearest to 52-Week Low
Sectors represented: Consumer Cyclical (2), Technology (1), Real Estate (1), Communication Services (1)
| Ticker | Company | Sector | Price Last | % Realized | 52-Week Low Date | RSI | % above MA200 | Trend |
|---|---|---|---|---|---|---|---|---|
| IBM | International Business Machines Corp | Technology | $210.27 | -25.42% | 2026-07-22 | 30.9 | -22.9% | Below MA20, MA50, MA200 |
| MCD | McDonald's Corp | Consumer Cyclical | $263.91 | -11.79% | 2026-07-21 | 39.6 | -12.5% | Below MA20, MA50, MA200 |
| CSGP | Costar Group, Inc | Real Estate | $27.67 | -67.51% | 2026-07-22 | 39.8 | -45.3% | Below MA20, MA50, MA200 |
| PSKY | Paramount Skydance Corp | Communication Services | $8.52 | -35.01% | 2026-07-22 | 29.4 | -29.6% | Below MA20, MA50, MA200 |
| WYNN | Wynn Resorts Ltd | Consumer Cyclical | $94.09 | -12.65% | 2026-07-22 | 36.7 | -15.1% | Below MA20, MA50, MA200 |
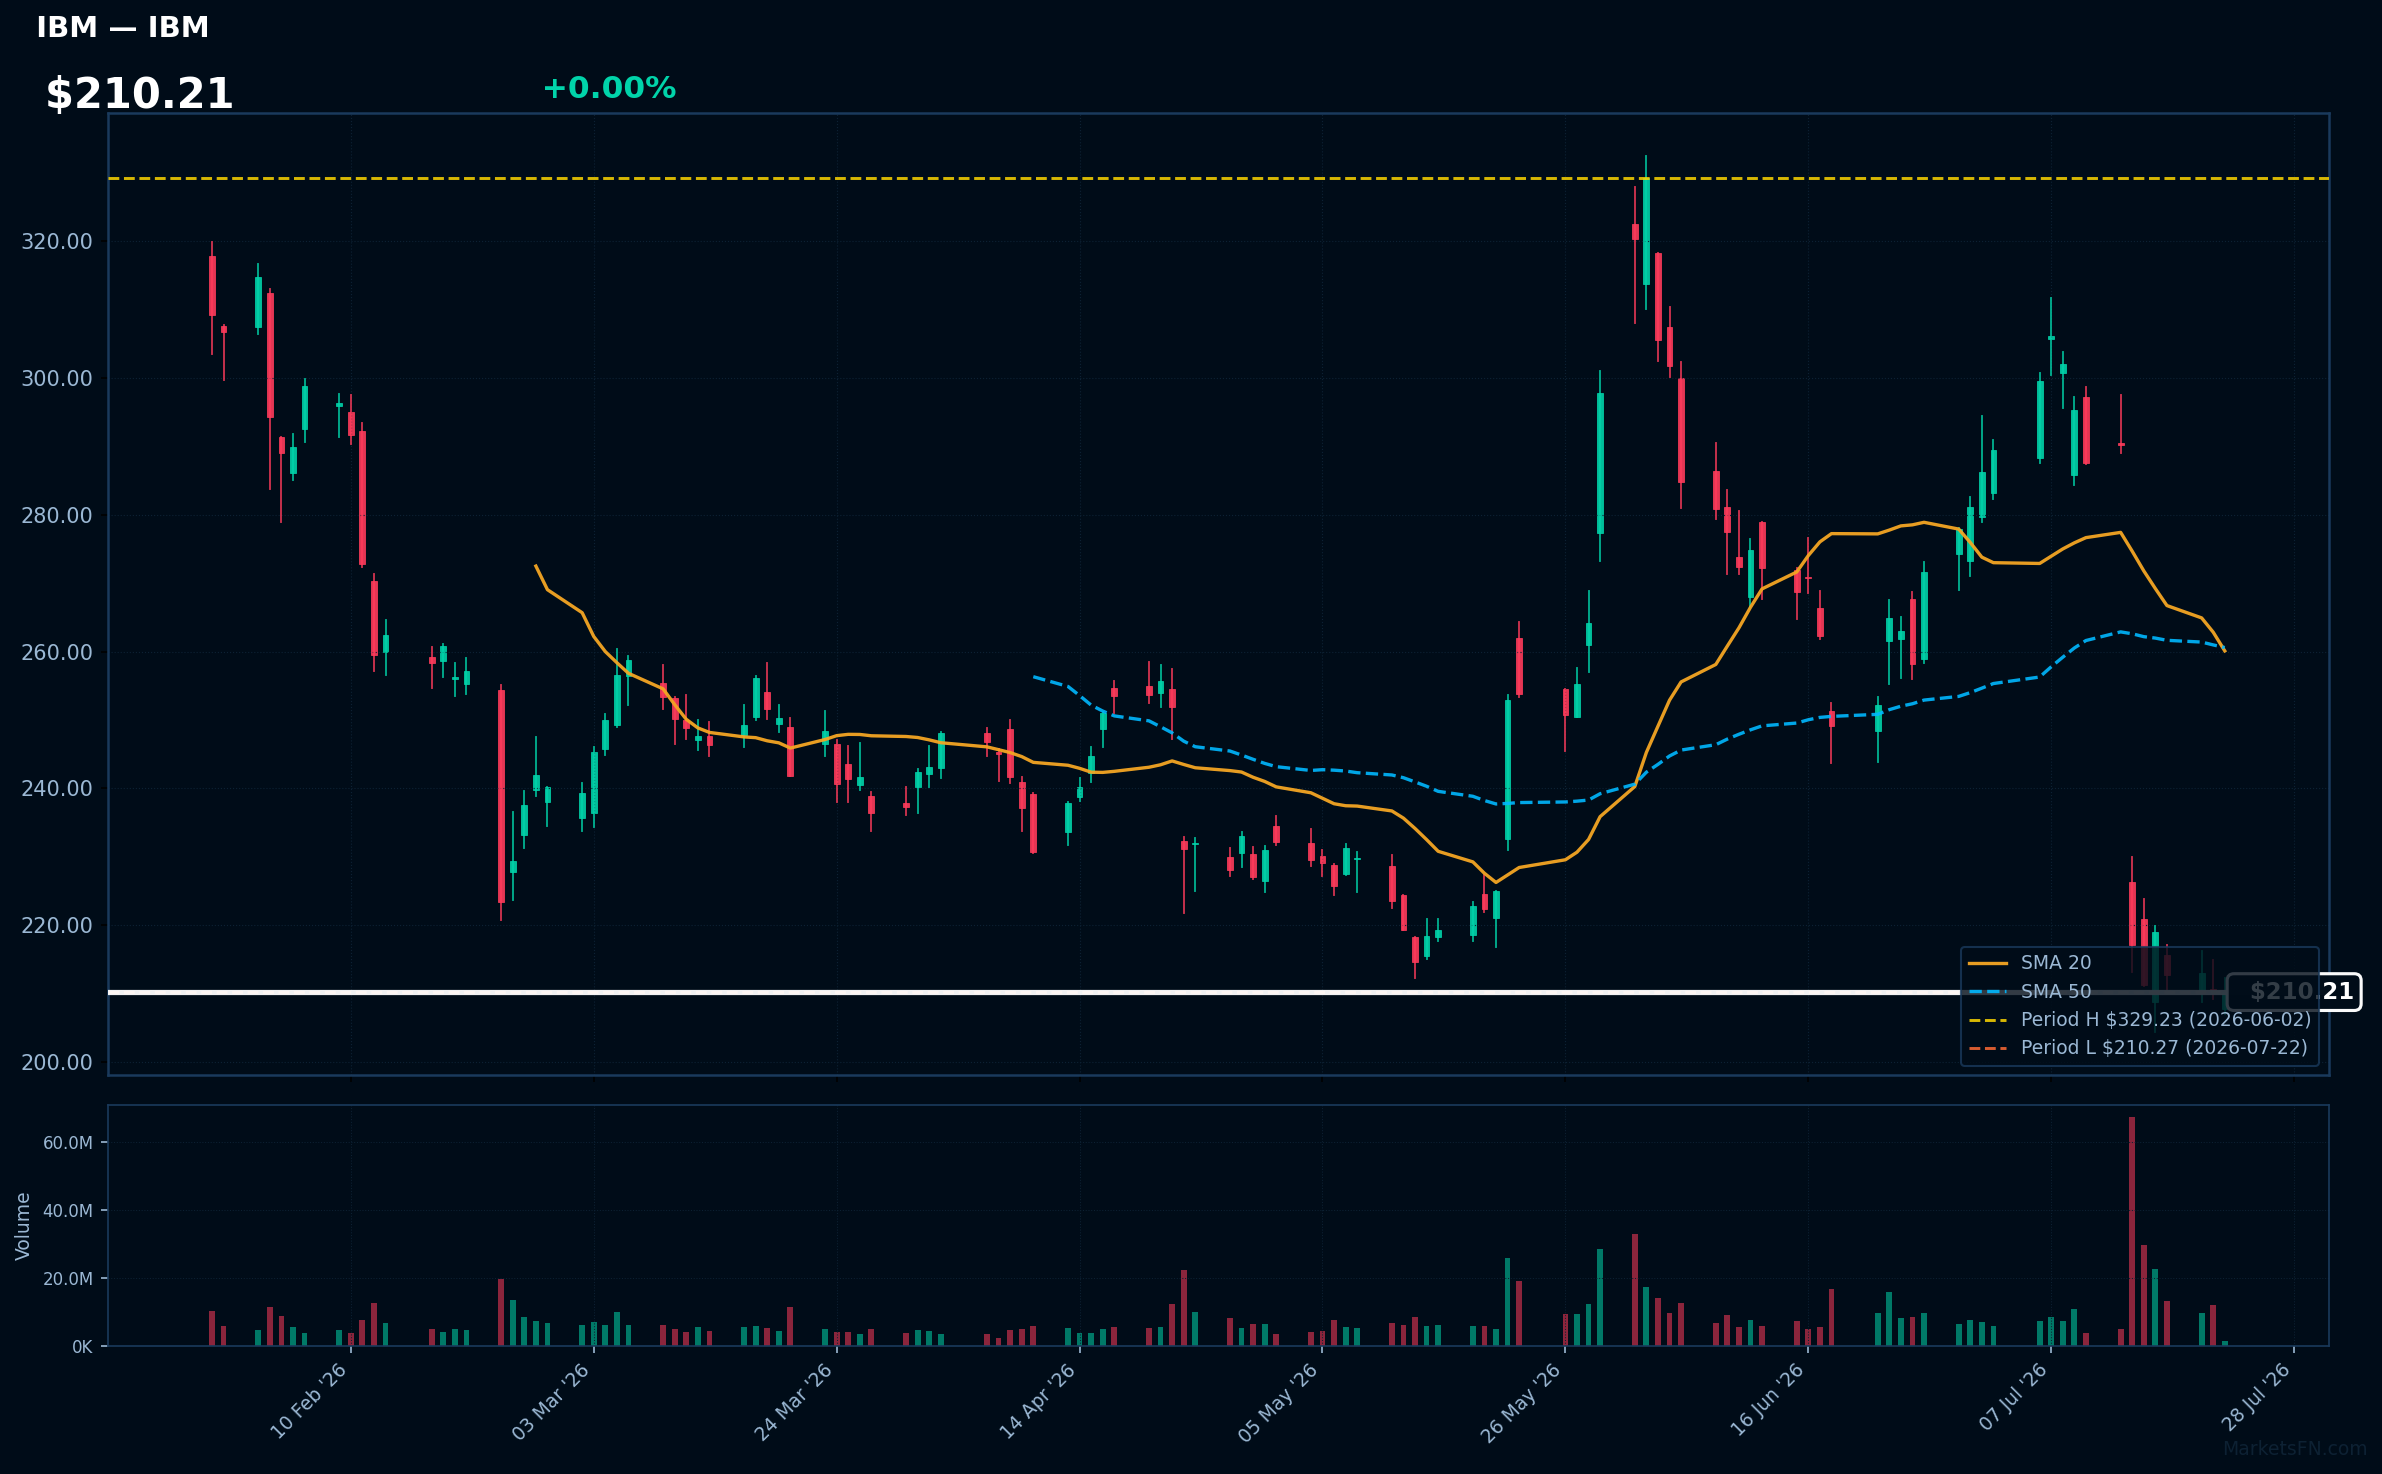
IBM | International Business Machines Corp | Technology | Price Last: $210.27 | % Realized: -25.42% | RSI: 30.9 | % above MA200: -22.9% | Trend: Below MA20, MA50, MA200
International Business Machines Corp (IBM) is a technology company that provides hardware, software, and services, including cloud computing, AI, and IT consulting. Investors care about its transition to high-growth areas like hybrid cloud and AI.
IBM's technical situation is bearish, with an RSI(14) of 30.9, indicating oversold conditions, and a sustained downtrend as price ($210.21) remains below MA20, MA50, and MA200, with the stock testing its 52-Week low.
Related headlines
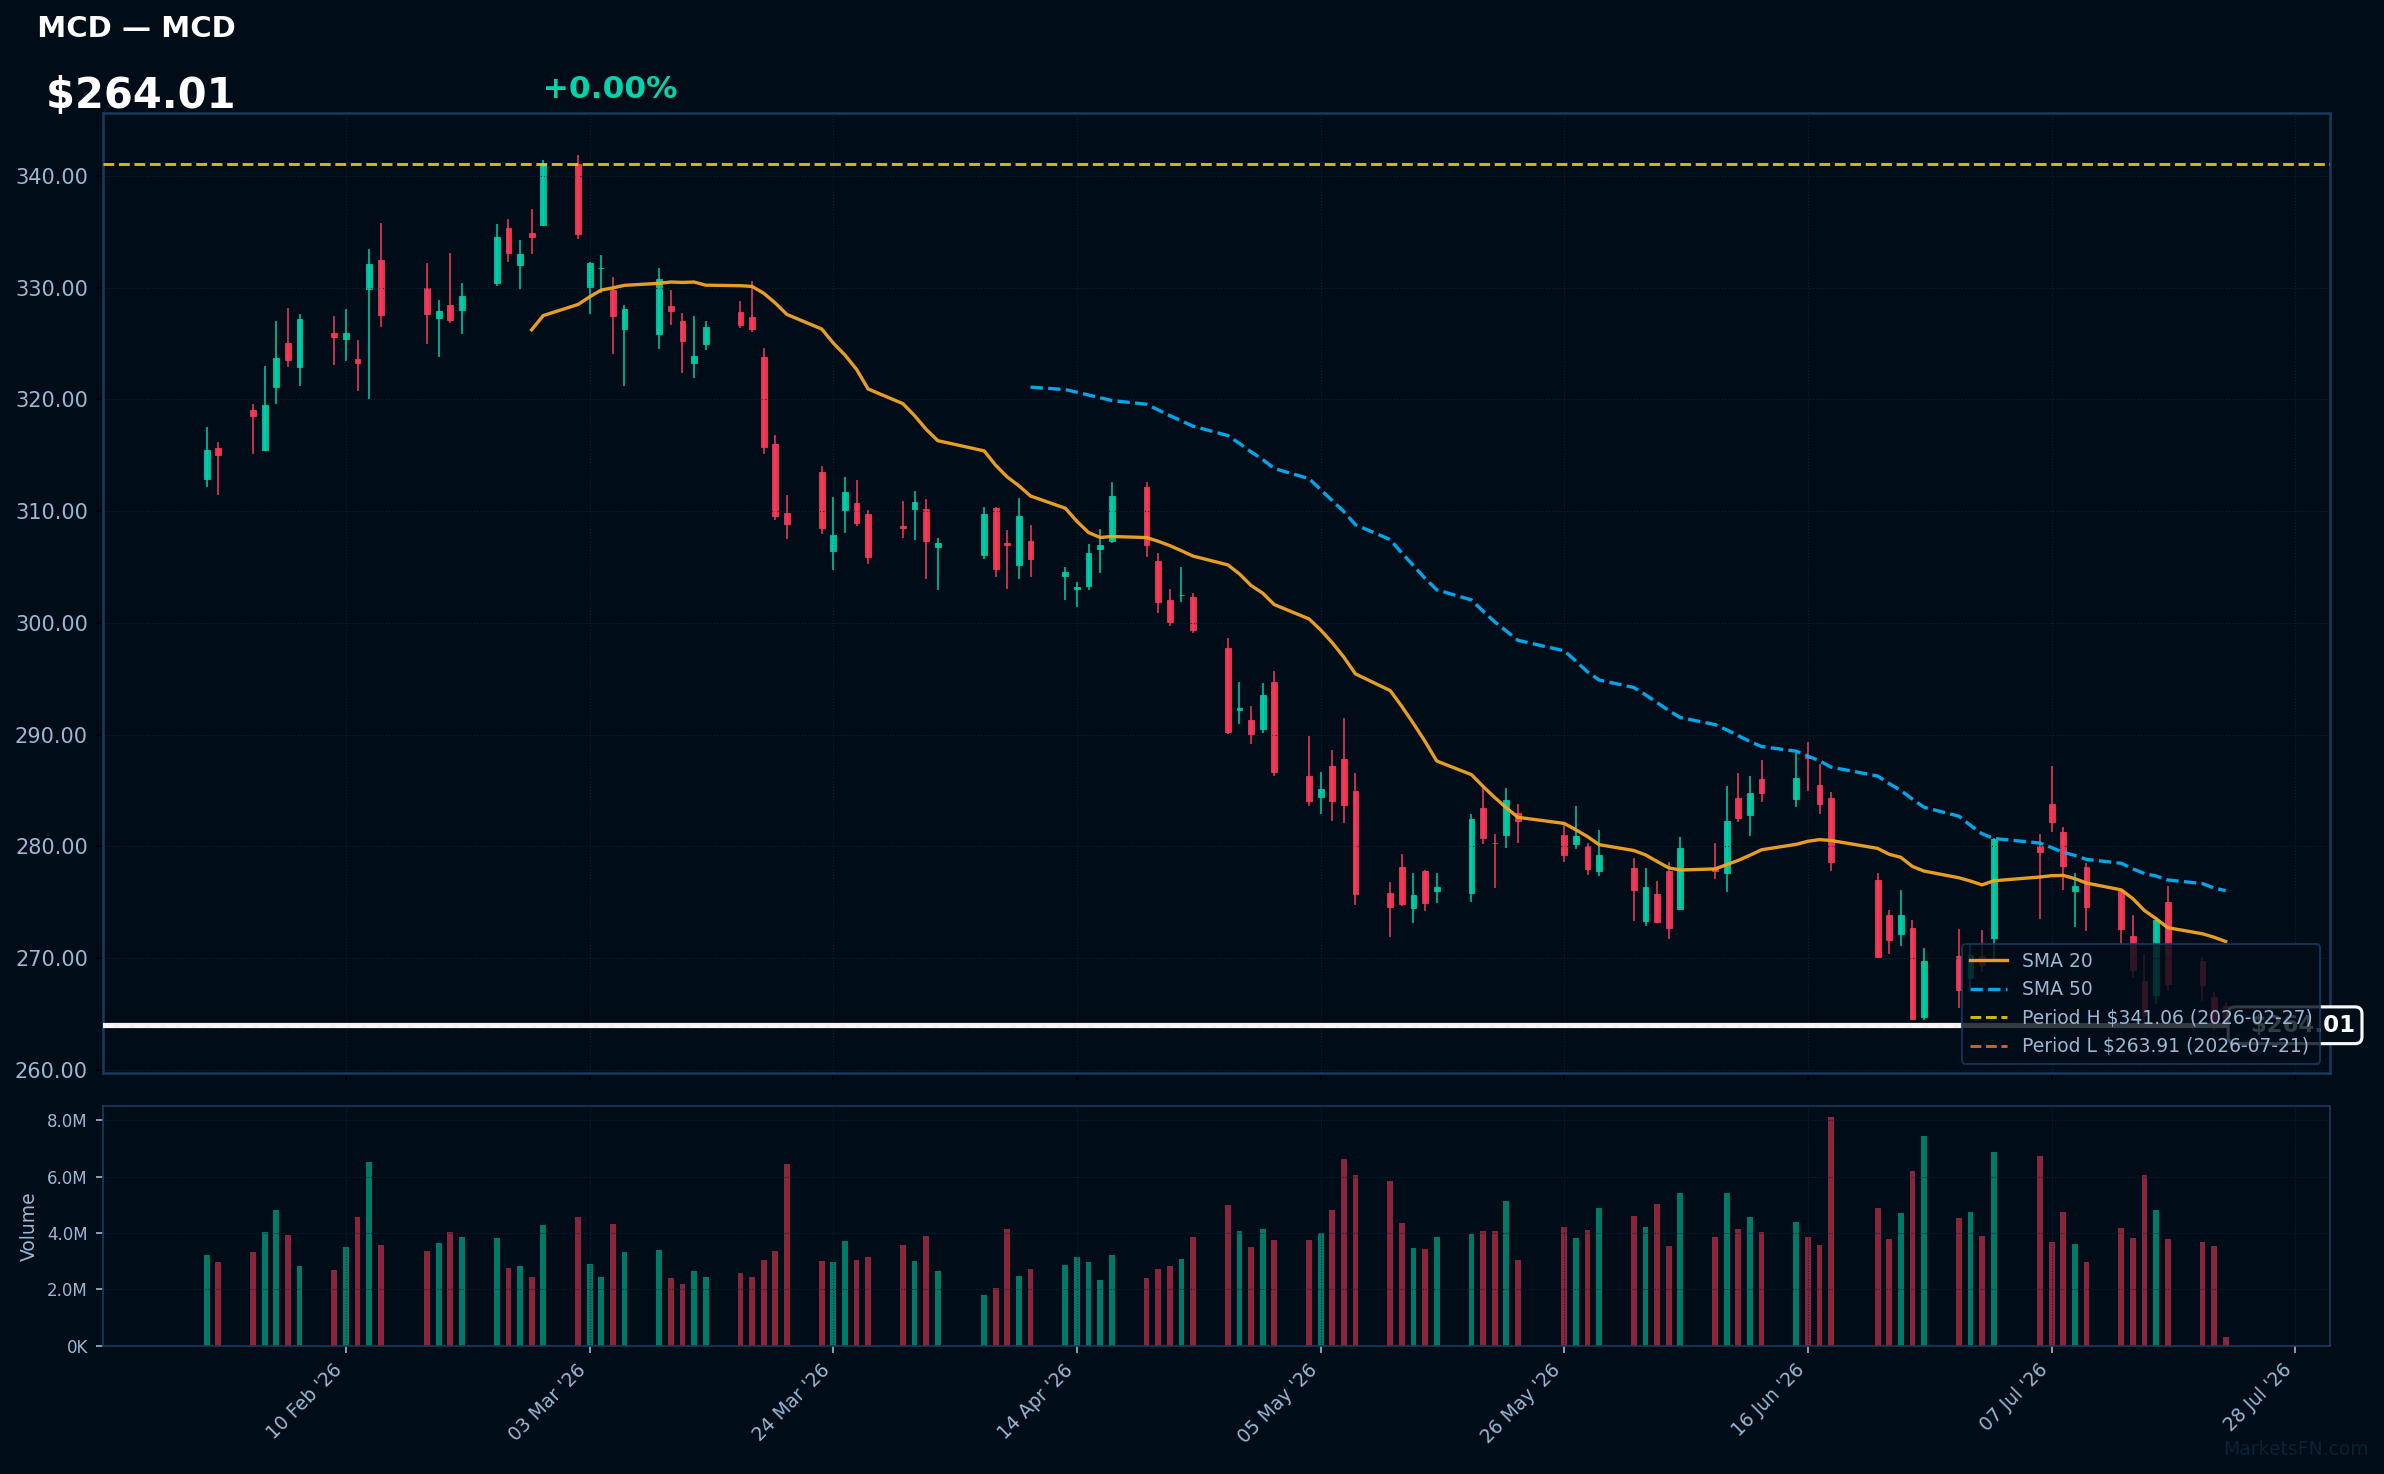
MCD | McDonald's Corp | Consumer Cyclical | Price Last: $263.91 | % Realized: -11.79% | RSI: 39.6 | % above MA200: -12.5% | Trend: Below MA20, MA50, MA200
McDonald's Corp operates quick-service restaurants, serving burgers, fries, and beverages globally. Investors should care about its brand strength, global footprint, and operational efficiency, as these factors influence revenue growth and profitability.
McDonald's Corp is testing major support with its price 0.0% above its 52-Week low. The RSI(14) is 39.6, indicating bearish momentum, and the MA alignment is bearish with price < $270.41 (MA20) < $274.92 (MA50) < $291.19 (MA200), signaling a sustained downtrend.
Related headlines
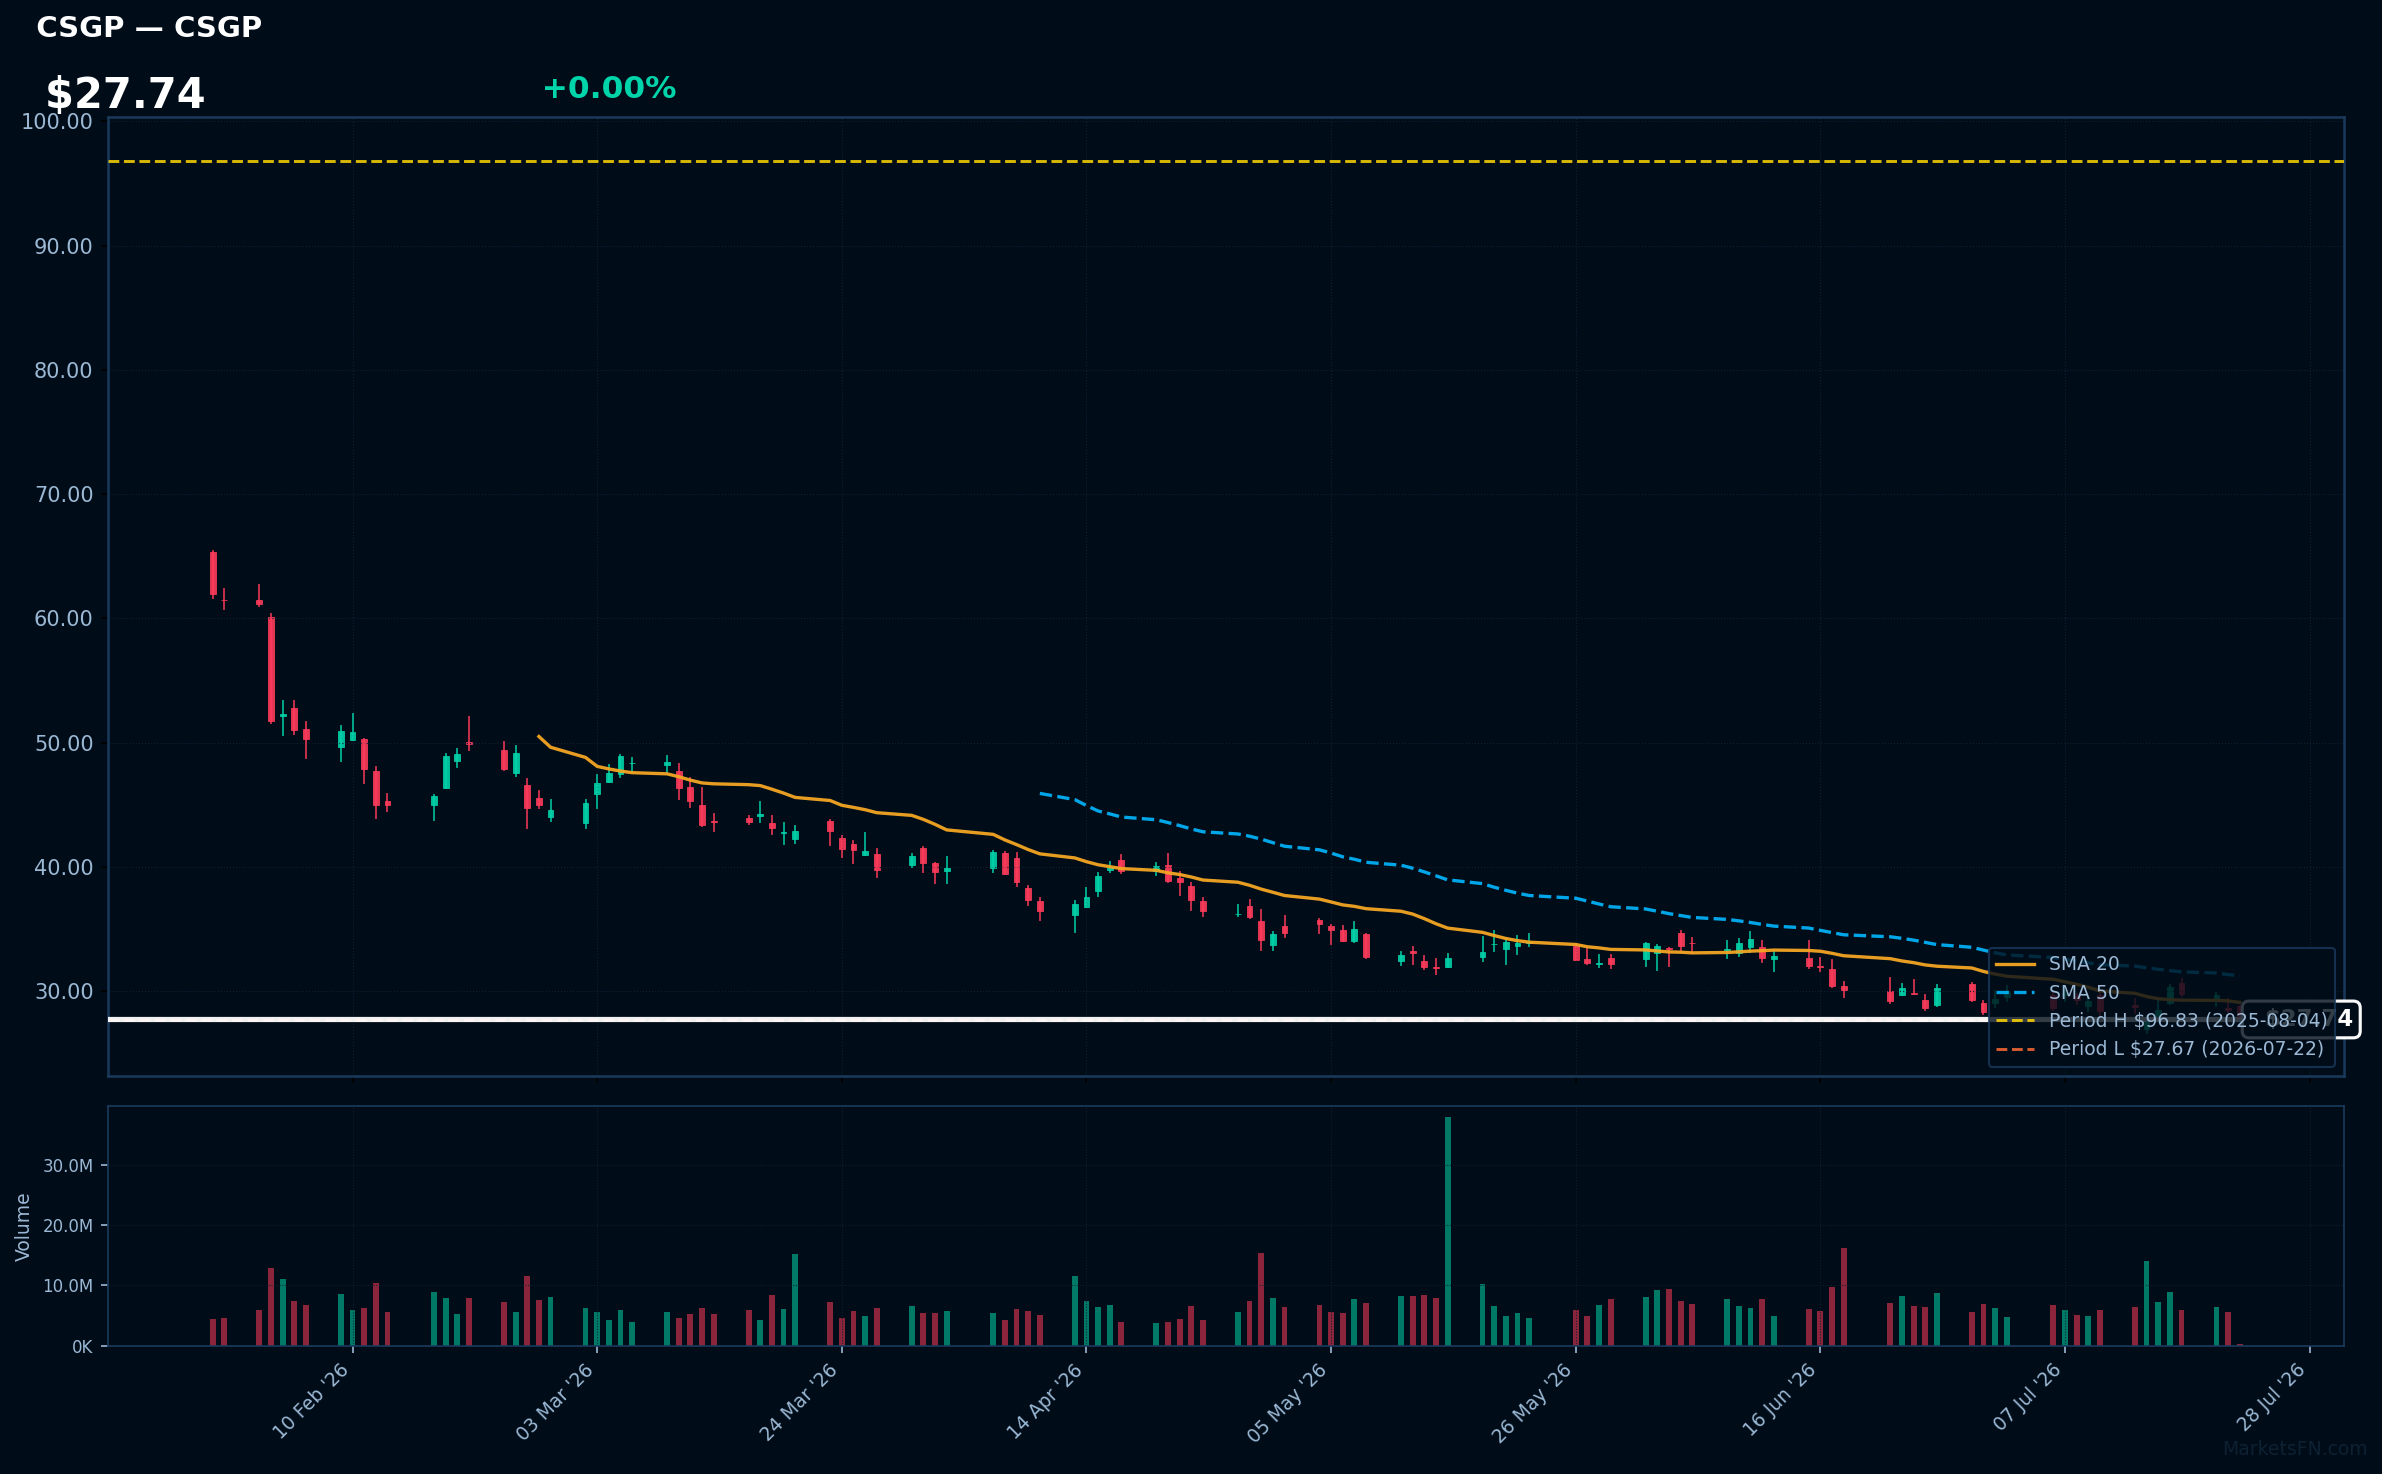
CSGP | Costar Group, Inc | Real Estate | Price Last: $27.67 | % Realized: -67.51% | RSI: 39.8 | % above MA200: -45.3% | Trend: Below MA20, MA50, MA200
Costar Group, Inc provides commercial real estate information, analytics, and online marketplaces, enabling investors to assess market trends and make informed decisions. Its data-driven platform is crucial for investors to navigate the commercial real estate market.
The stock is in a sustained downtrend with price ($27.74) below MA20, MA50, and MA200. RSI(14) is 39.8, nearing oversold territory, and the stock is 0.0% above its 52-Week low, indicating a potential support test, warning of further downside risk.
Related headlines
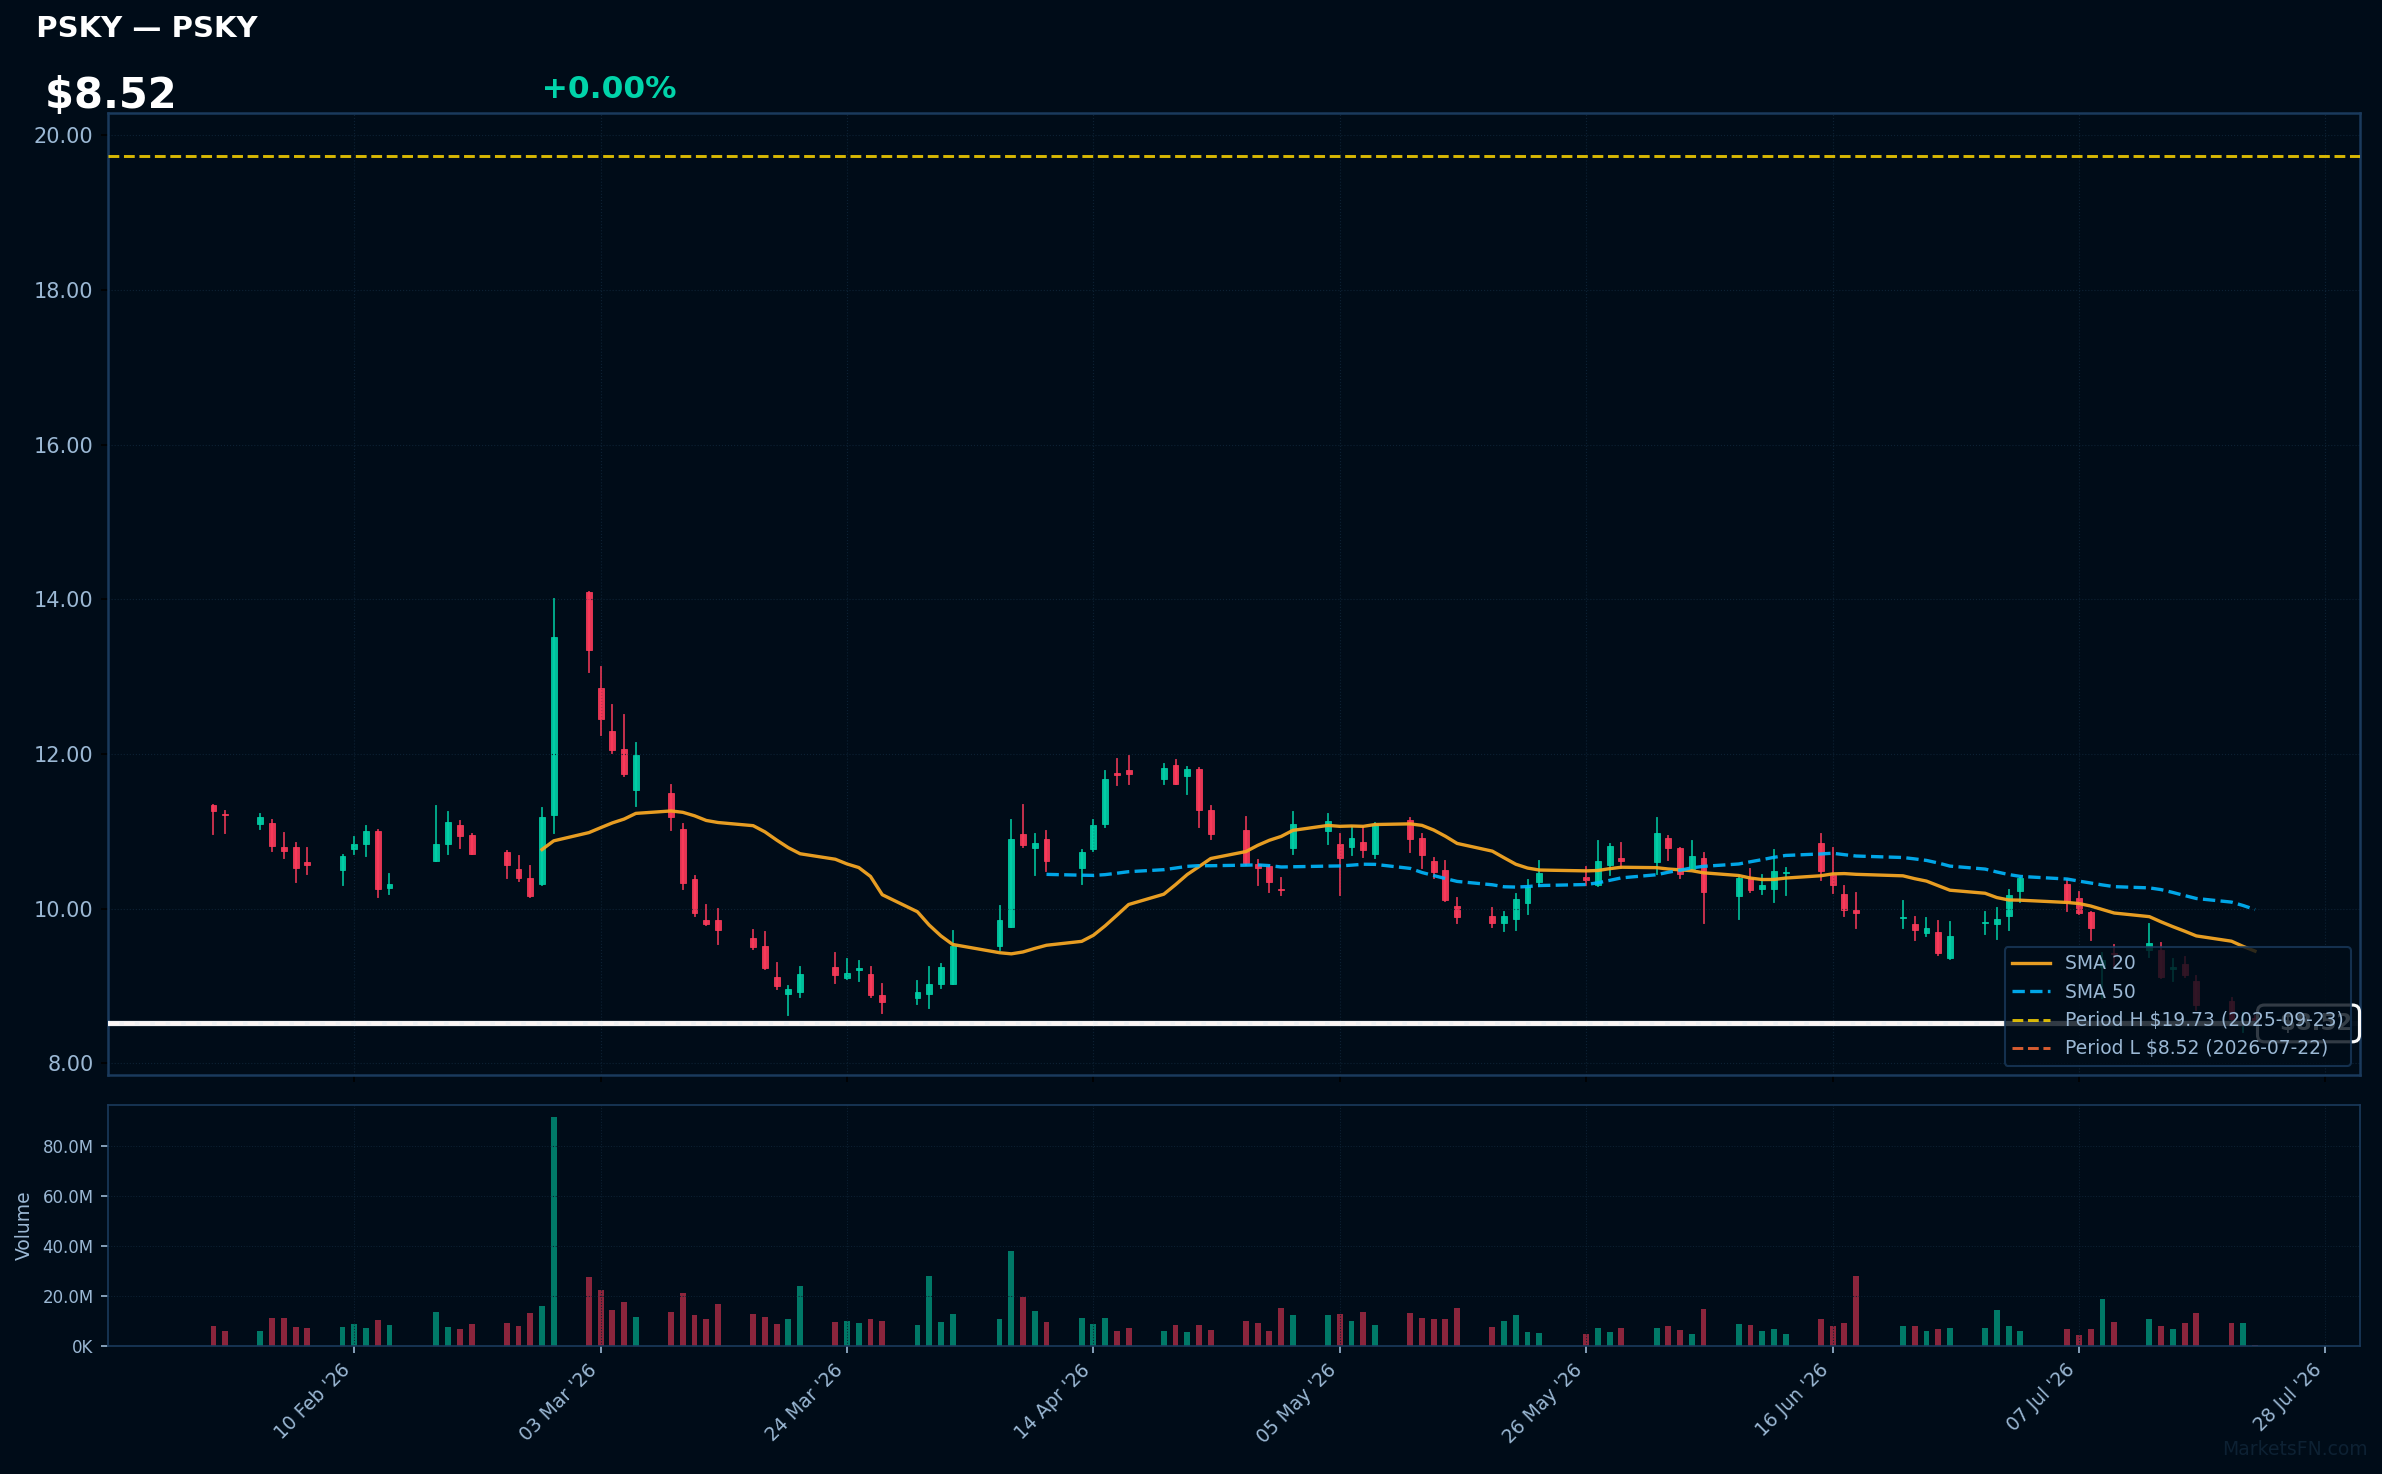
PSKY | Paramount Skydance Corp | Communication Services | Price Last: $8.52 | % Realized: -35.01% | RSI: 29.4 | % above MA200: -29.6% | Trend: Below MA20, MA50, MA200
Paramount Skydance Corp is not described in the data provided, making it impossible to determine its business activities or specific investor relevance.
The stock exhibits a sustained downtrend with price ($8.52) below MA20, MA50, and MA200. RSI(14) is 29.4, near oversold territory. The stock is at its 52-Week low, having returned -35.0% over the period, indicating significant bearish momentum.
Related headlines
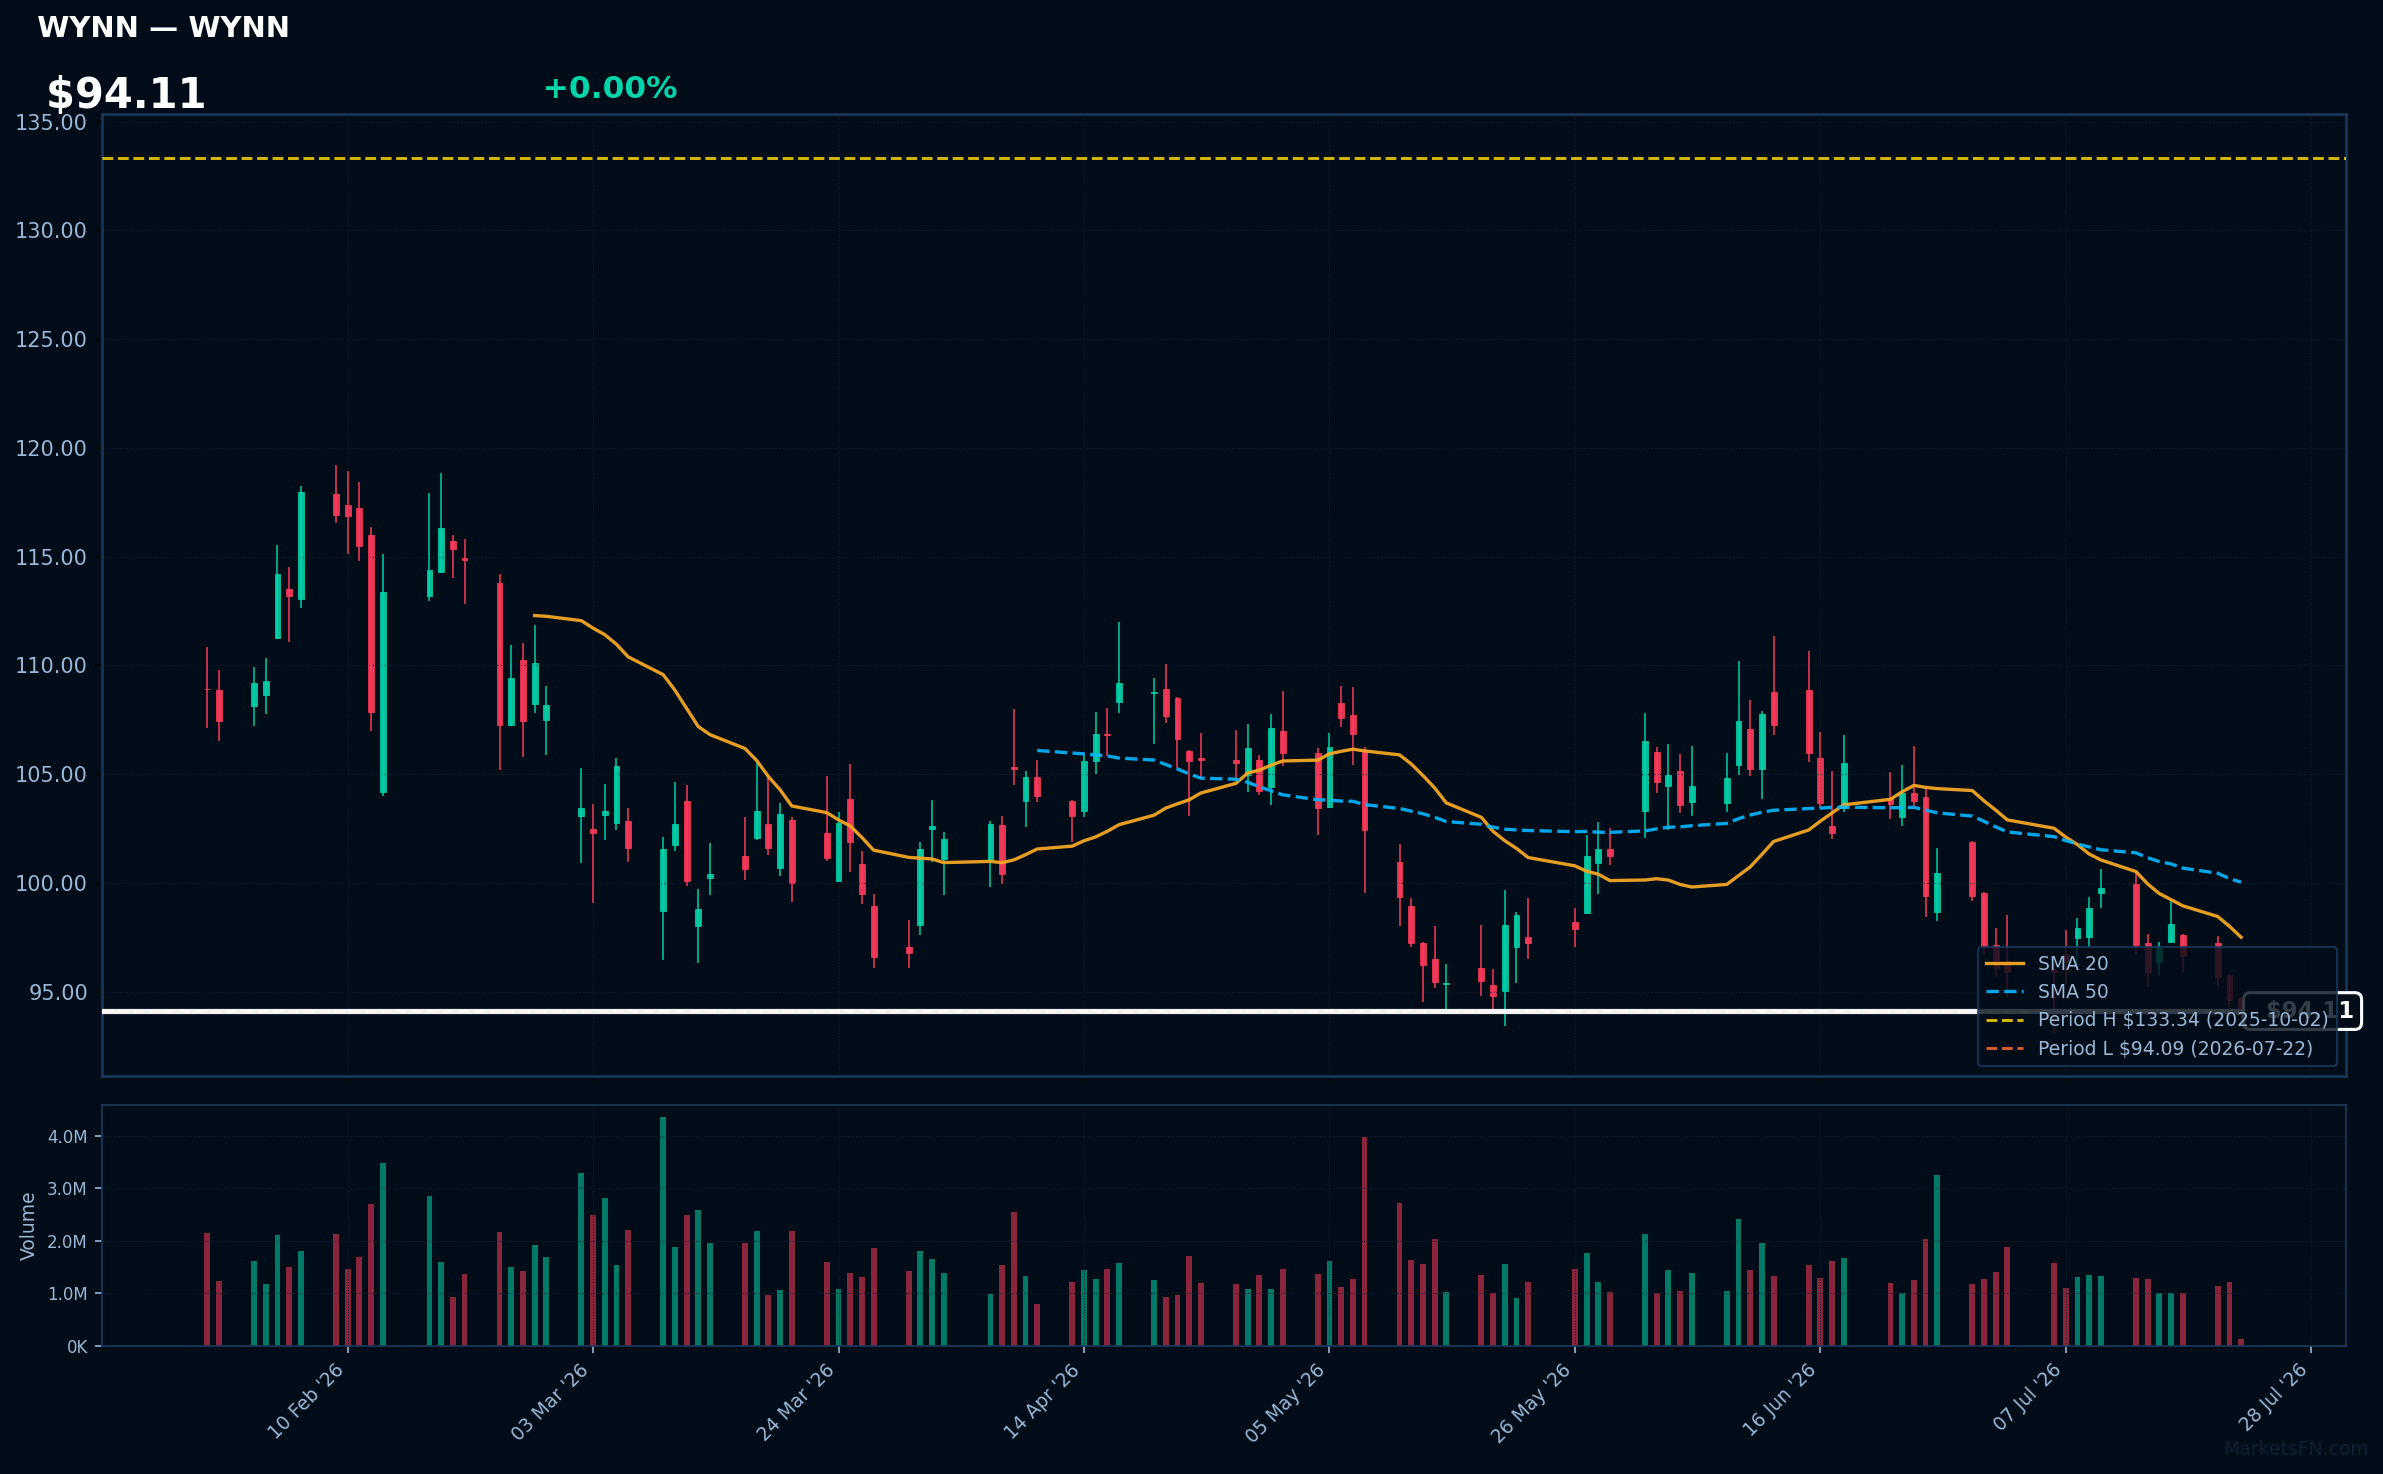
WYNN | Wynn Resorts Ltd | Consumer Cyclical | Price Last: $94.09 | % Realized: -12.65% | RSI: 36.7 | % above MA200: -15.1% | Trend: Below MA20, MA50, MA200
Wynn Resorts Ltd operates luxury casinos and hotels, generating revenue primarily through gaming, hospitality, and entertainment services. Investors should care about its performance as it reflects consumer spending and tourism trends, particularly in key markets like Las Vegas and Macau.
Wynn Resorts Ltd is in a sustained downtrend with price ($94.11) below MA20, MA50, and MA200. The RSI(14) is 36.7, near oversold territory, and the stock is at its 52-Week low, indicating potential major support testing, a technical warning sign.
Related headlines
- WYNN RESORTS EARNS 2026 RECOGNITIONS FROM FORBES TRAVEL GUIDE, FORTUNE, CONDE NAST TRAVELER, MEN'S HEALTH, NEWSWEEK, AND BUSINESS INSIDER
- Wynn Resorts Announces Second Quarter Earnings Release Date
- Wynn Resorts Stock Boasts Long-Term Technical Support
- Wynn Las Vegas and Chef's Table Reveal Culinary Lineup, Participating Chefs, and Ticket Packages for Wynn Revelry
Market Commentary
The S&P 500 stocks listed are currently trading near their 52-week extremes, with some at highs and others at lows. Stocks like Philip Morris International Inc (PM), Marathon Petroleum Corp (MPC), and Phillips 66 (PSX) are at 52-week highs, while International Business Machines Corp (IBM), McDonald's Corp (MCD), and Wynn Resorts Ltd (WYNN) are at 52-week lows. This indicates significant price movements, potentially driven by fundamental factors or market sentiment.
The stocks near 52-week highs are primarily from the energy sector, suggesting a potential macro theme driving this movement. Conversely, the stocks near 52-week lows are from diverse sectors, including technology (IBM), consumer staples (MCD), and consumer discretionary (WYNN). This disparity may indicate sector rotation or differing investor sentiment towards these sectors.
Key levels to watch include the 52-week extremes for these stocks, as breaks above or below these levels could signal further price movements. Potential catalysts for these stocks include earnings reports, industry trends, and broader macroeconomic developments that may impact their respective sectors.
Methodology: All 503 S&P 500 constituents screened. 52-week high = highest daily close over the past 252 trading days (approx. 1 year). 52-week low = lowest daily close over the same period. Distance = (current price / extreme − 1) × 100. Technical indicators computed on up to 1 year of daily OHLCV data.
Disclaimer: For informational purposes only. Not investment advice. Past performance is not indicative of future results.

