S&P 500 52-Week Highs & Lows Radar: Union Pacific (UNP), International Business Machines (IBM) and more
MarketsFN Team

S&P 500 52-Week Highs & Lows Radar: Union Pacific (UNP), International Business Machines (IBM) and more
Screening all 503 S&P 500 constituents for stocks nearest to their 52-week high and their 52-week low. Data as of July 23, 2026. % Realized = 52-week total return.
Legend: RSI > 70 = overbought · RSI < 30 = oversold · Green % Realized = positive 52W return · Red = negative.
📈 Nearest to 52-Week High
Sectors represented: Industrials (4), Real Estate (1)
| Ticker | Company | Sector | Price Last | % Realized | 52-Week High Date | RSI | % above MA200 | Trend |
|---|---|---|---|---|---|---|---|---|
| UNP | Union Pacific Corp | Industrials | $311.40 | +34.81% | 2026-07-23 | 74.8 | +25.2% | Above MA20, MA50, MA200 |
| WELL | Welltower Inc | Real Estate | $246.76 | +52.67% | 2026-07-23 | 70.2 | +22.2% | Above MA20, MA50, MA200 |
| GD | General Dynamics Corp | Industrials | $386.04 | +21.80% | 2026-07-23 | 69.4 | +10.9% | Above MA20, MA50, MA200 |
| HWM | Howmet Aerospace Inc | Industrials | $286.17 | +53.53% | 2026-07-23 | 64.4 | +22.6% | Above MA20, MA50, MA200 |
| NSC | Norfolk Southern Corp | Industrials | $355.00 | +26.66% | 2026-07-23 | 75.1 | +18.1% | Above MA20, MA50, MA200 |
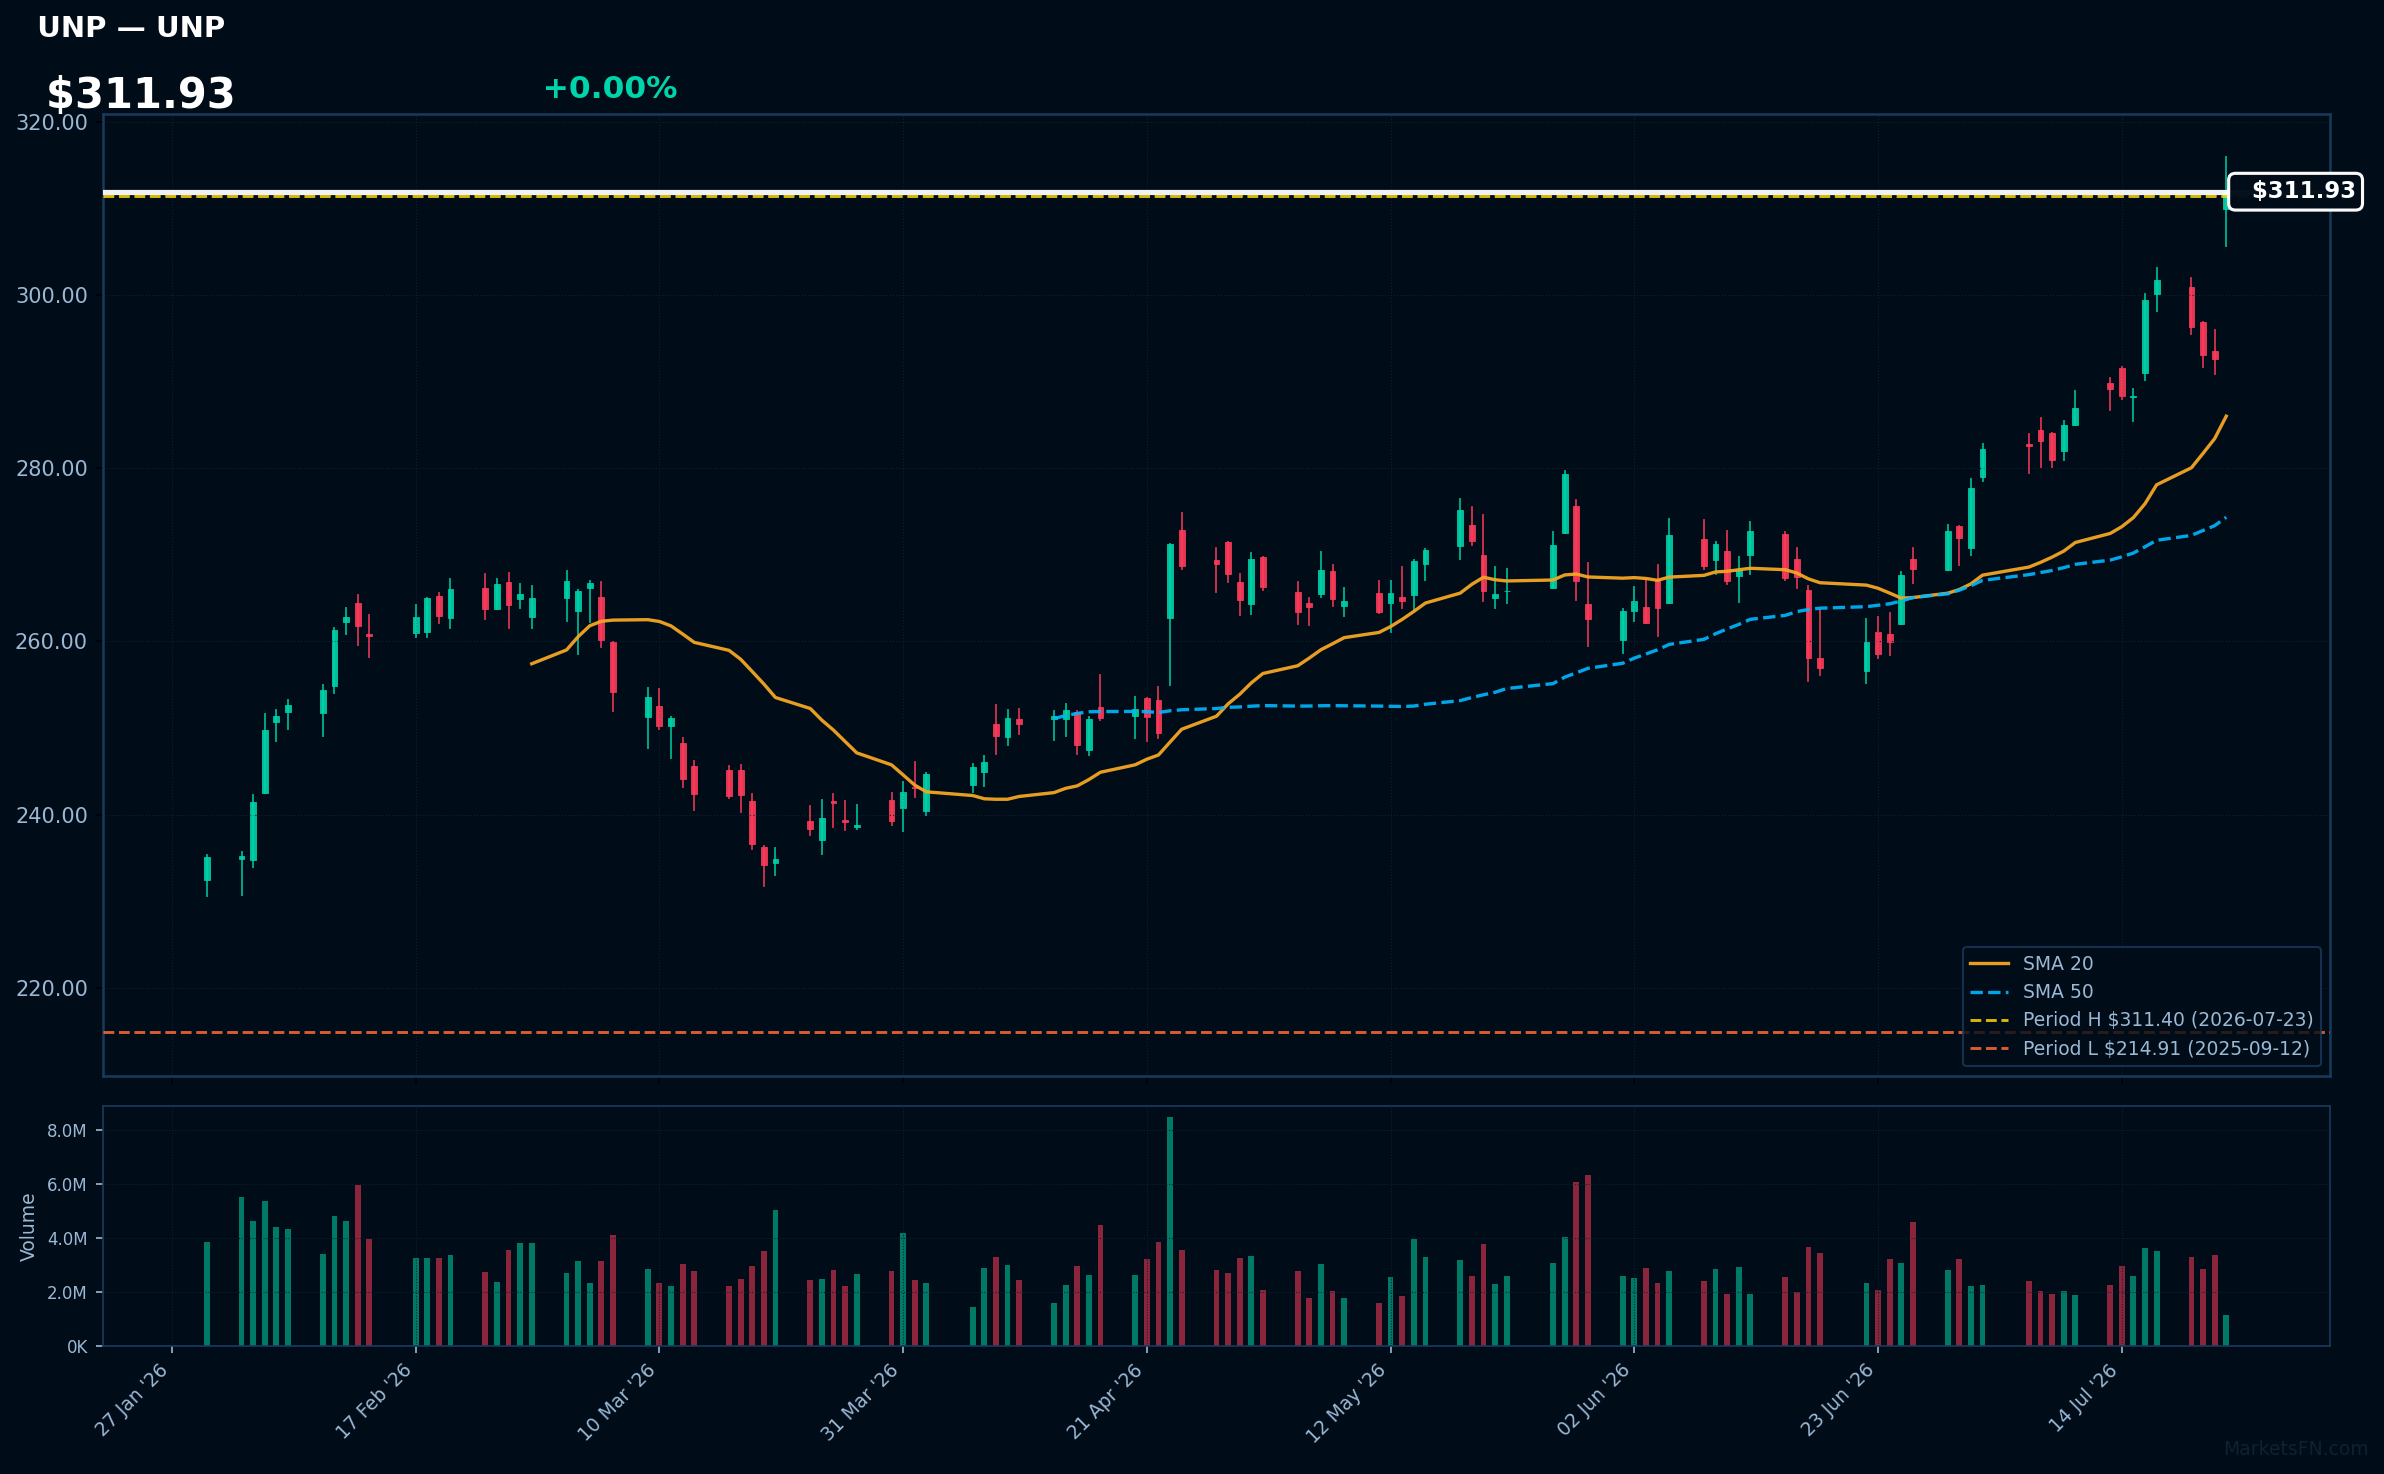
UNP | Union Pacific Corp | Industrials | Price Last: $311.40 | % Realized: +34.81% | RSI: 74.8 | % above MA200: +25.2% | Trend: Above MA20, MA50, MA200
Union Pacific Corp (UNP) operates North America's largest railroad network, transporting goods across various industries. Investors care about its efficiency, capacity, and market share, as these factors impact revenue and profitability.
UNP's RSI(14) is 74.8, nearing overbought territory, with a bullish MA alignment: price ($311.93) > MA20 > MA50 > MA200. The stock is 0.0% below its 52-Week high, indicating potential breakout momentum.
Related headlines
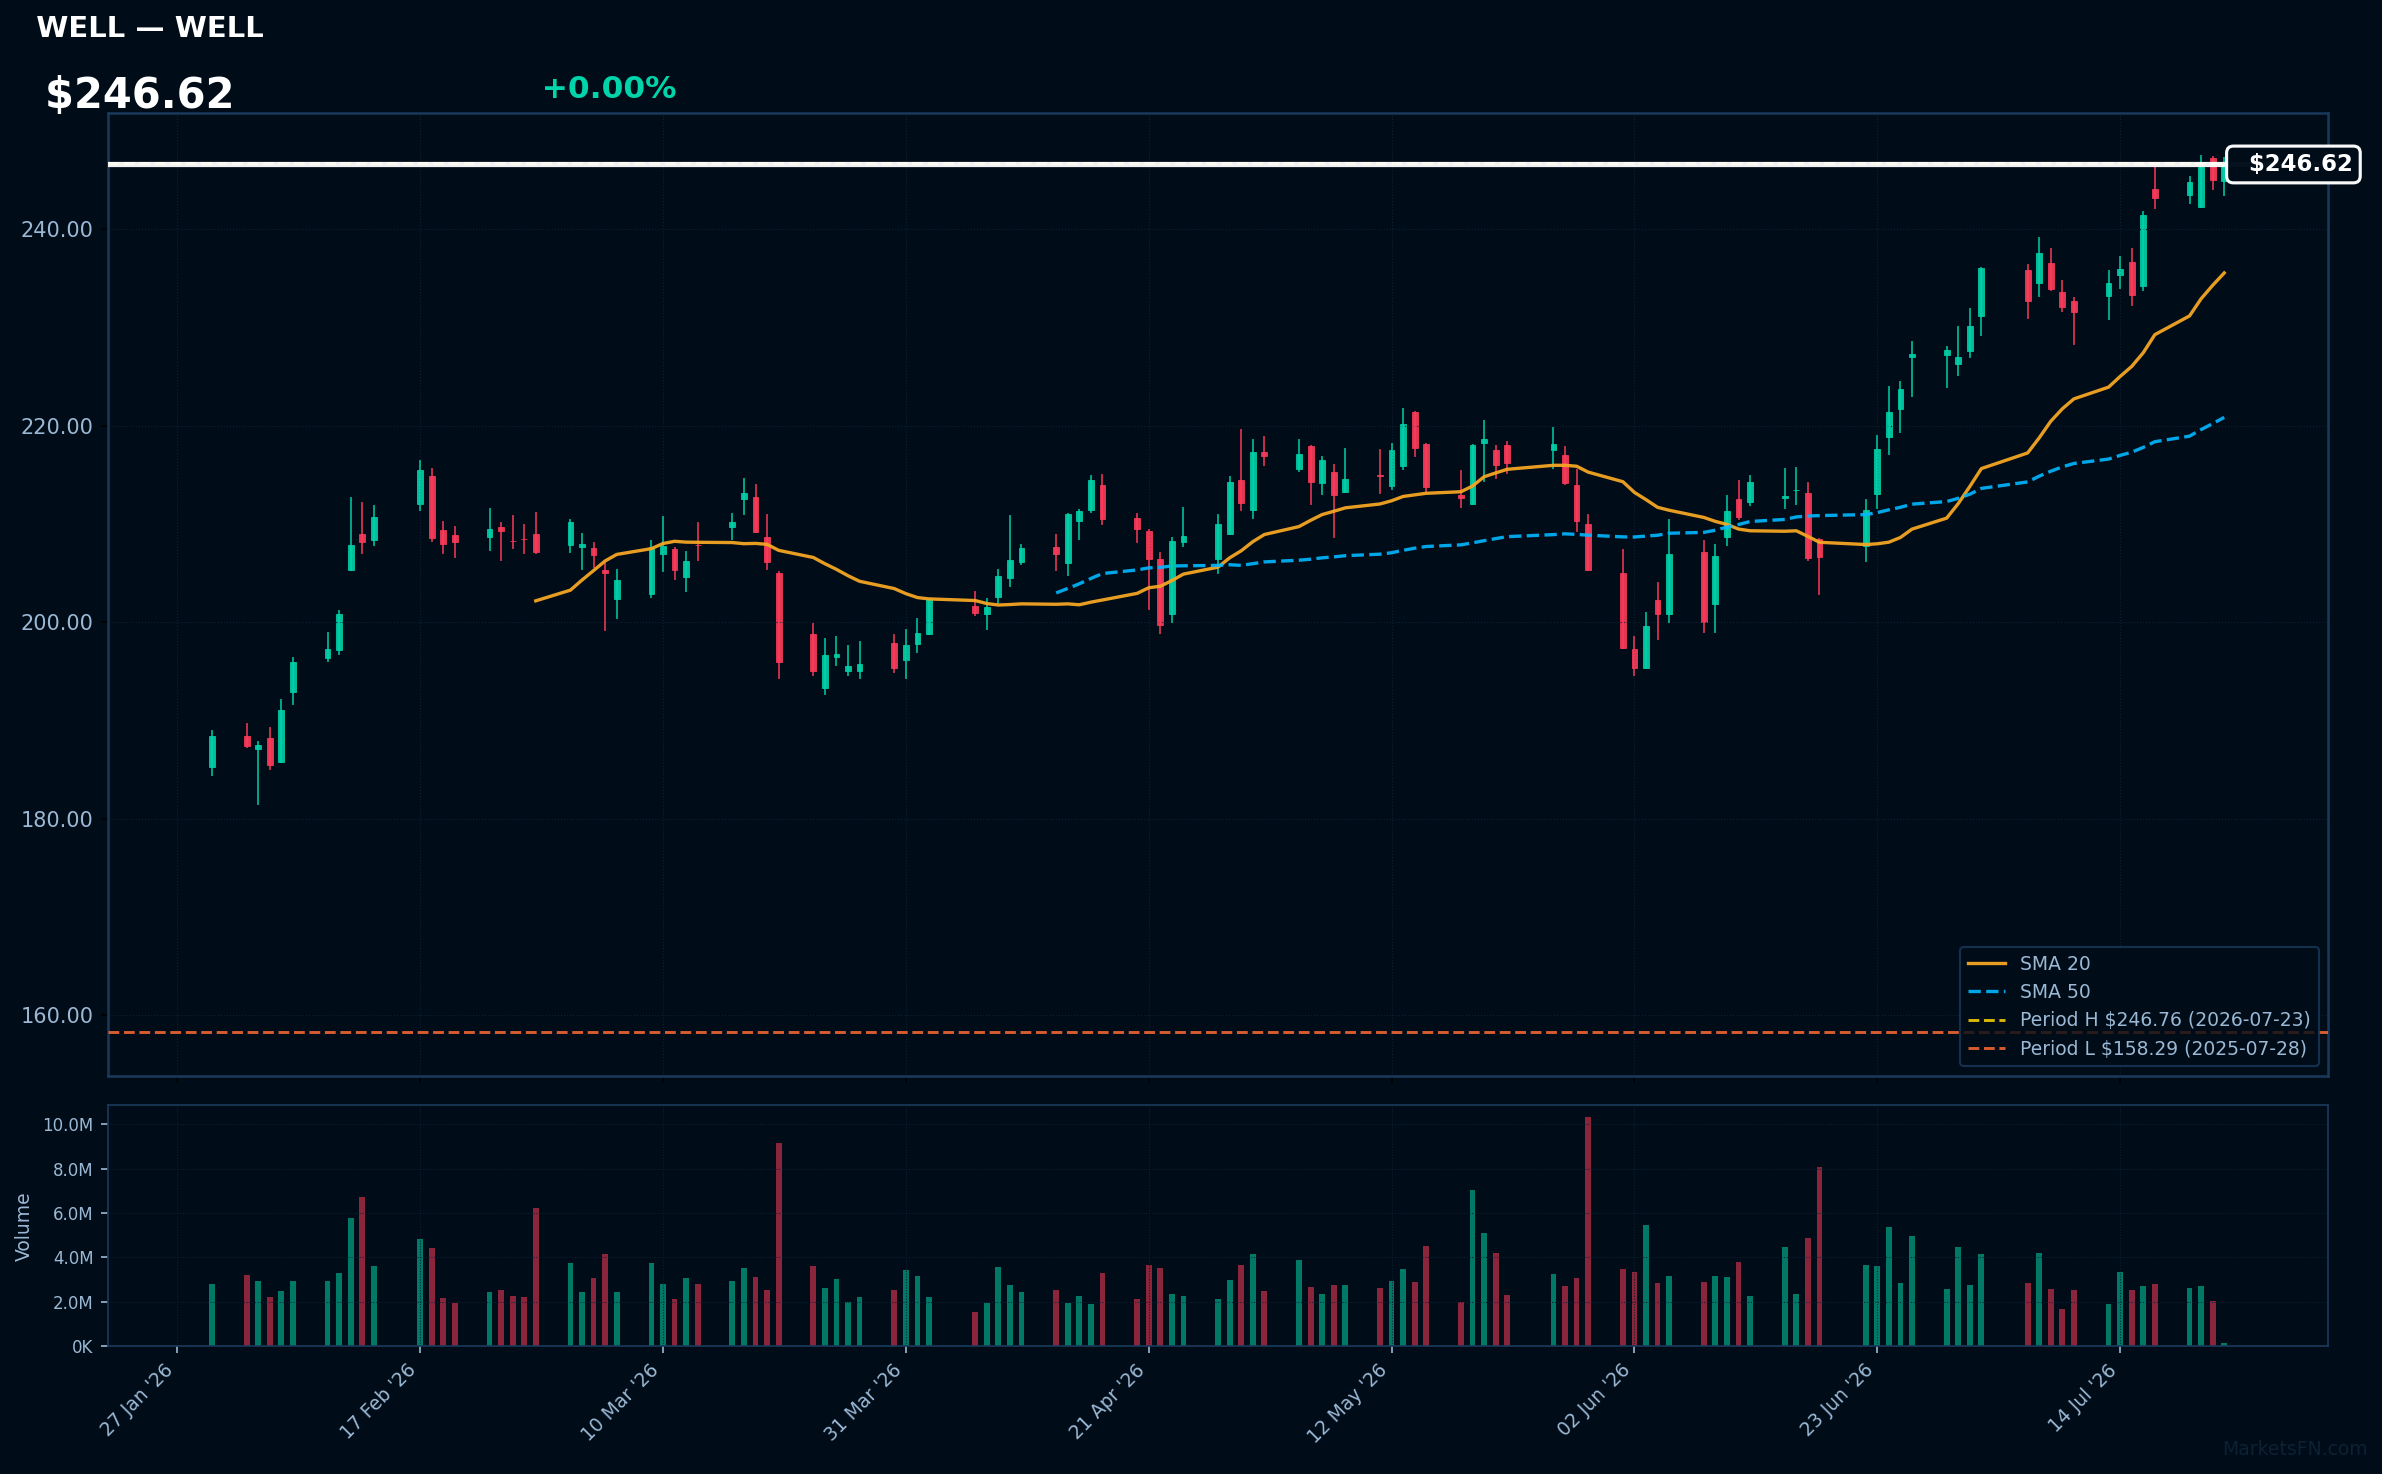
WELL | Welltower Inc | Real Estate | Price Last: $246.76 | % Realized: +52.67% | RSI: 70.2 | % above MA200: +22.2% | Trend: Above MA20, MA50, MA200
Welltower Inc (WELL) is a healthcare real estate investment trust that invests in seniors' housing and healthcare facilities. Investors should care because its performance is tied to the growing demand for healthcare services and seniors' housing.
WELL's RSI(14) is 70.2, indicating strong momentum with price > MA20 > MA50 > MA200, a bullish alignment. The stock is 0.0% below its 52-Week high, suggesting a potential breakout.
Related headlines
- Welltower CFO Timothy McHugh sets U.S. pay record at $167M
- Welltower Announces Date of Second Quarter 2026 Earnings Release, Conference Call and Webcast
- Welltower's Dividend Is Up 15%. Here's What Really Matters.
- Welltower Board of Directors Approves 15% Increase in Quarterly Dividend to $0.85 per Share
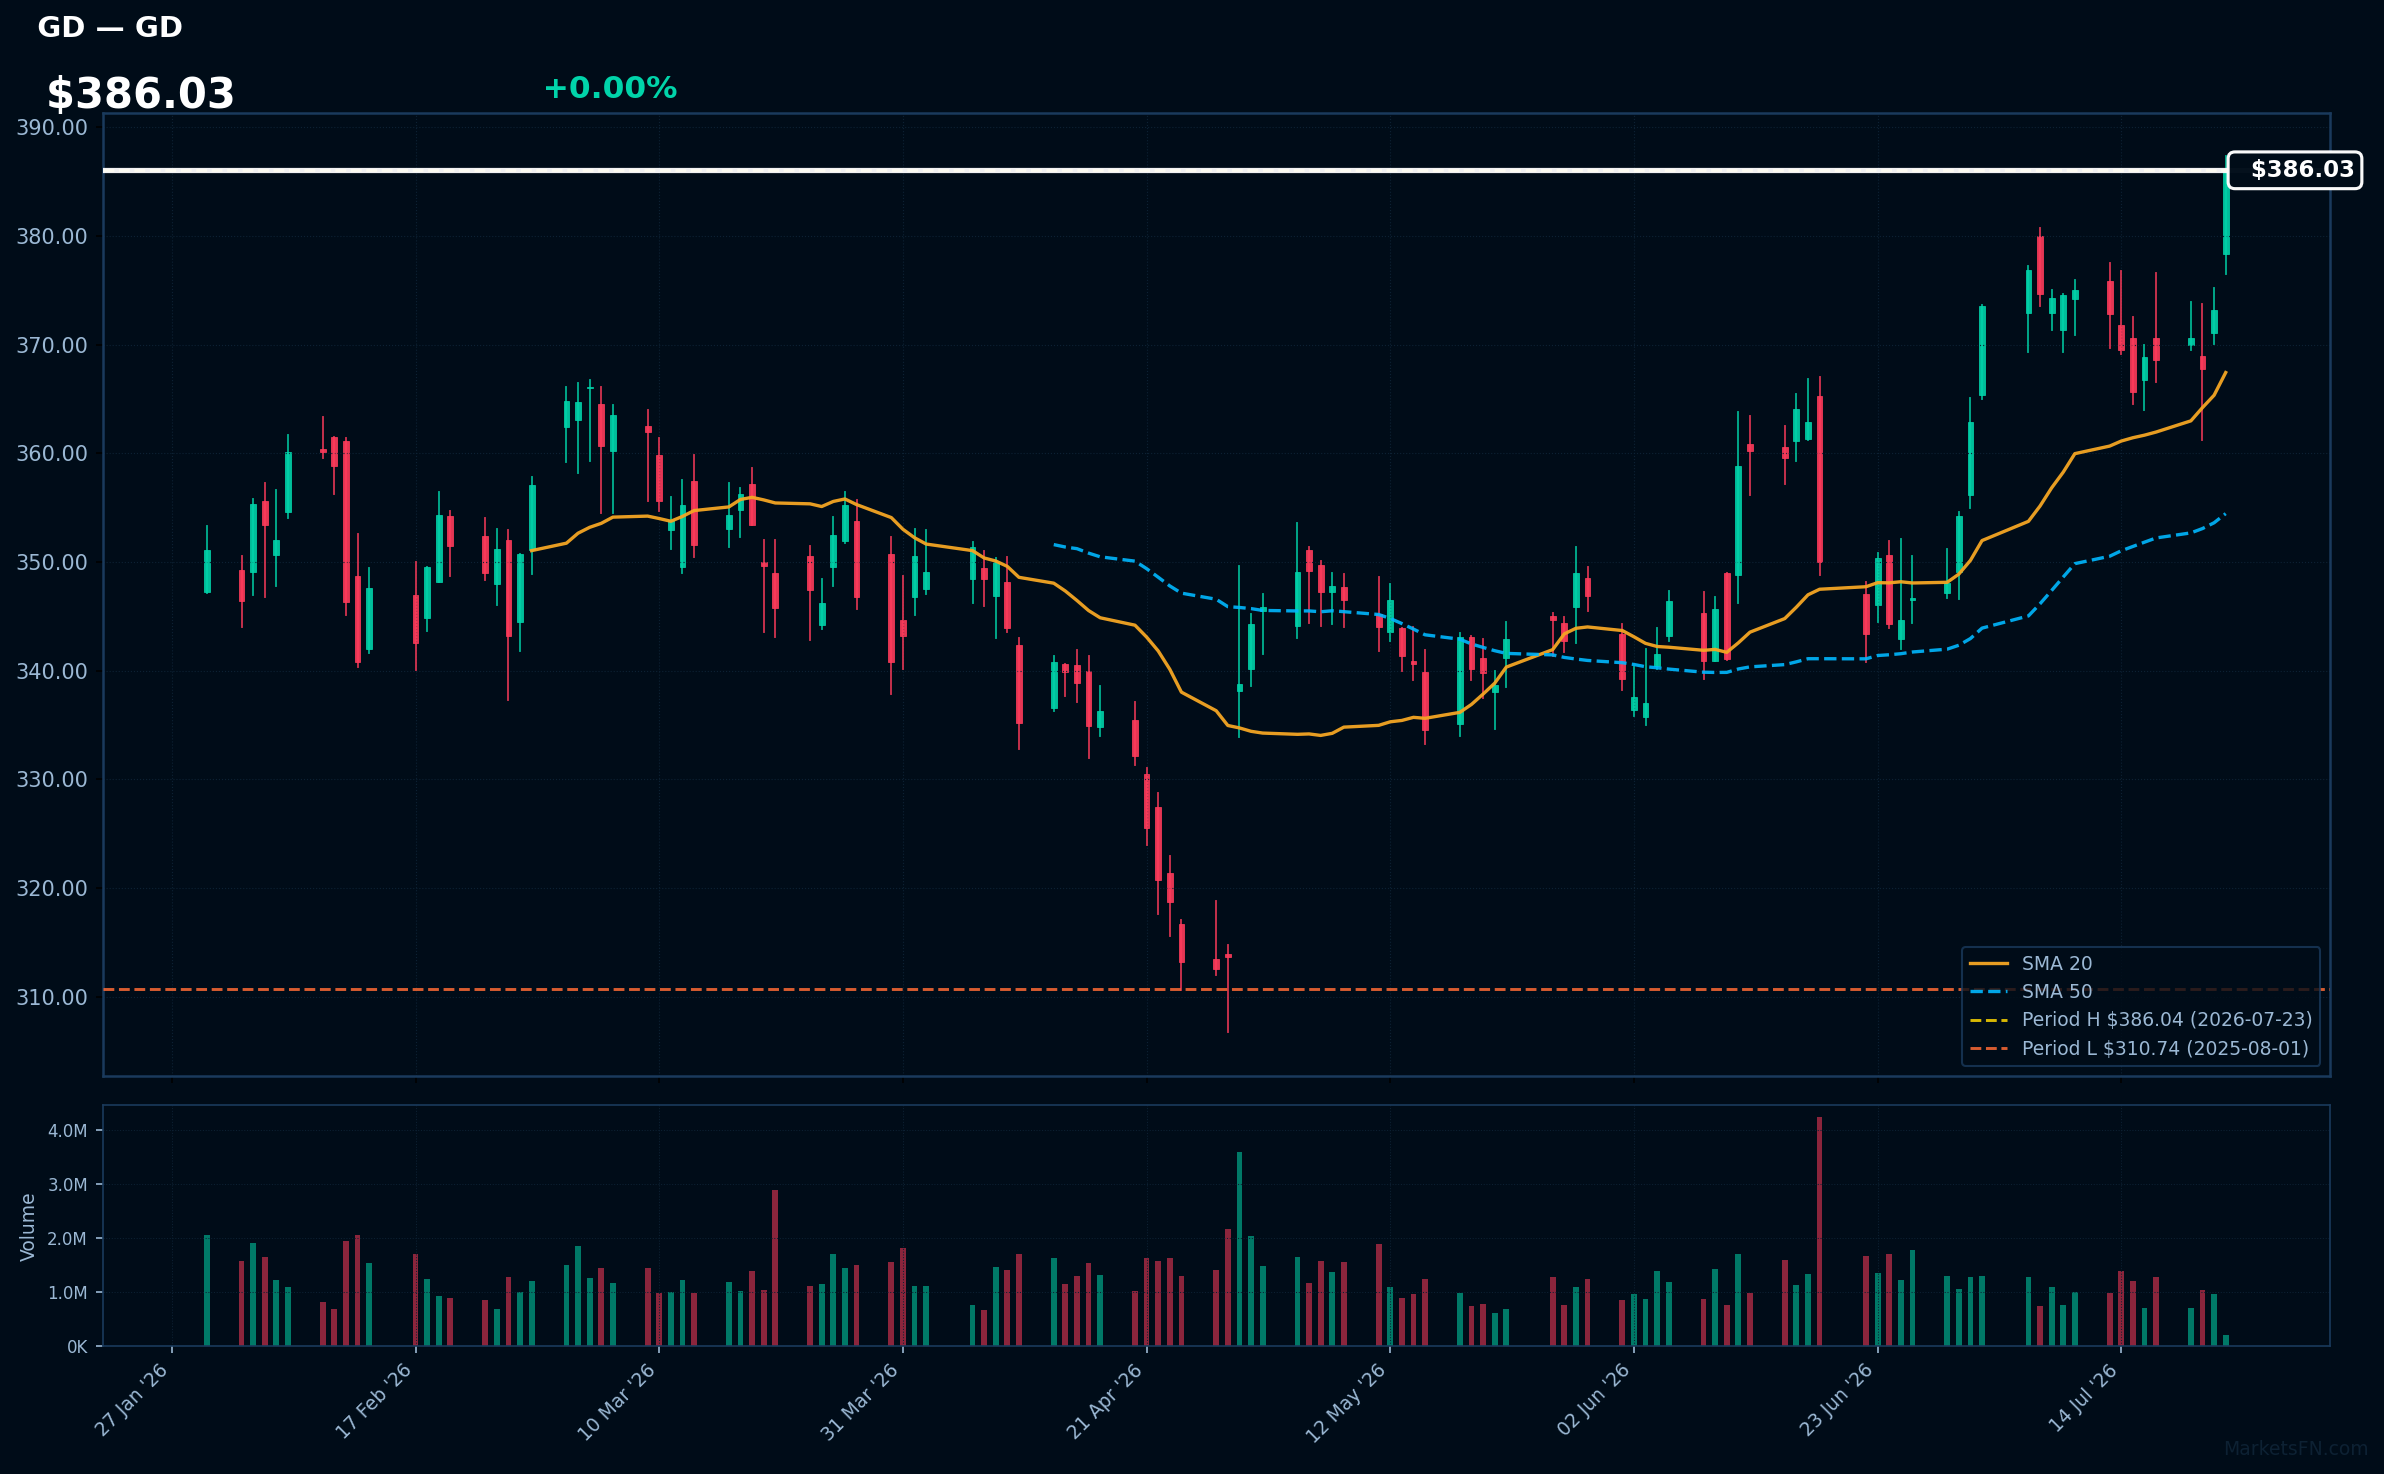
GD | General Dynamics Corp | Industrials | Price Last: $386.04 | % Realized: +21.80% | RSI: 69.4 | % above MA200: +10.9% | Trend: Above MA20, MA50, MA200
General Dynamics Corp is a defense company that produces Gulfstream business jets, armored vehicles, and military equipment. Investors should care because its diverse portfolio provides stable revenue streams amidst geopolitical tensions and defense spending increases.
General Dynamics Corp shows bullish technicals with RSI(14) at 69.4, indicating strong momentum. The MA alignment is bullish (price > MA20 > MA50 > MA200) and is 0.0% below its 52-Week high, suggesting a potential breakout.
Related headlines
- Trump Presses General Dynamics as $1.5 Trillion Defense Budget Advances
- Trump Urges Faster Submarine Production, Singles Out General Dynamics at Summit
- General Dynamics to Webcast 2026 Second-Quarter Financial Results Conference Call
- General Dynamics upgraded to Buy as submarine boom fuels growth outlook
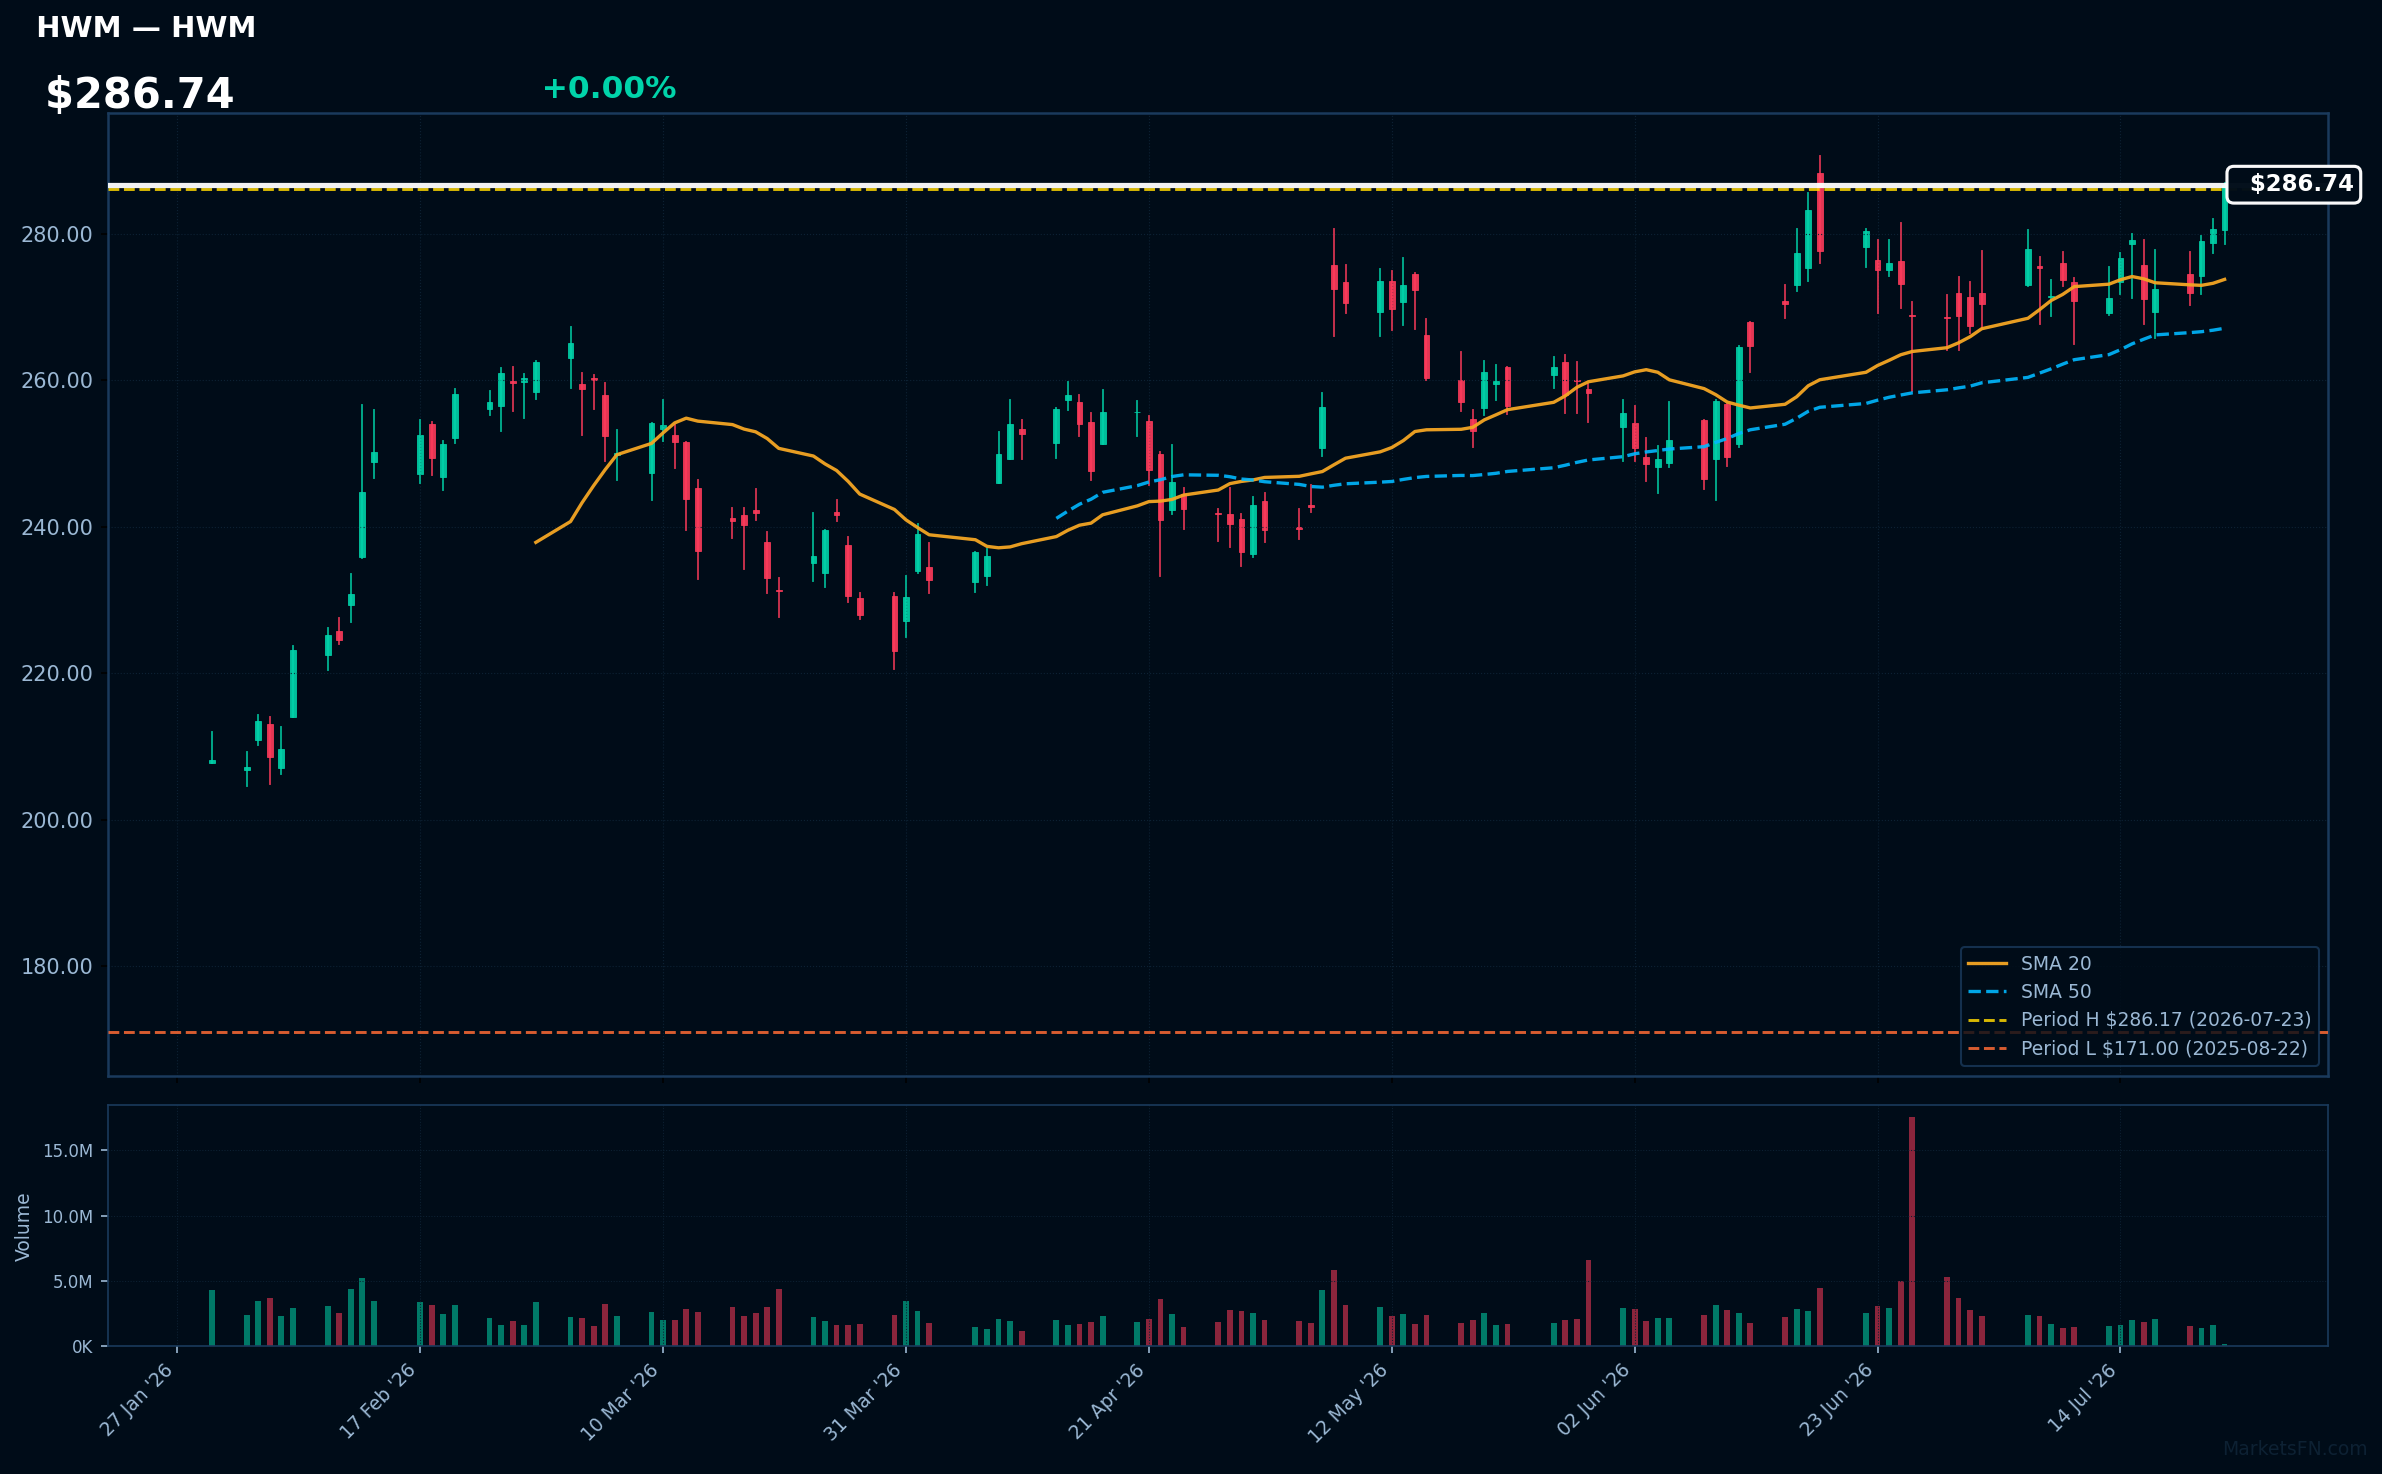
HWM | Howmet Aerospace Inc | Industrials | Price Last: $286.17 | % Realized: +53.53% | RSI: 64.4 | % above MA200: +22.6% | Trend: Above MA20, MA50, MA200
Howmet Aerospace Inc is a manufacturer of aerospace and defense components, including fasteners, structures, and engine parts. Investors should care due to its critical role in the aerospace supply chain and potential for growth driven by increasing demand for air travel and defense spending.
Howmet Aerospace Inc is in a sustained uptrend with price ($286.74) above MA20 > MA50 > MA200. The RSI(14) is 64.4, nearing overbought territory. The stock is 0.0% below its 52-Week high, indicating potential for a breakout, with a 53.5% return over the 52-Week period.
Related headlines
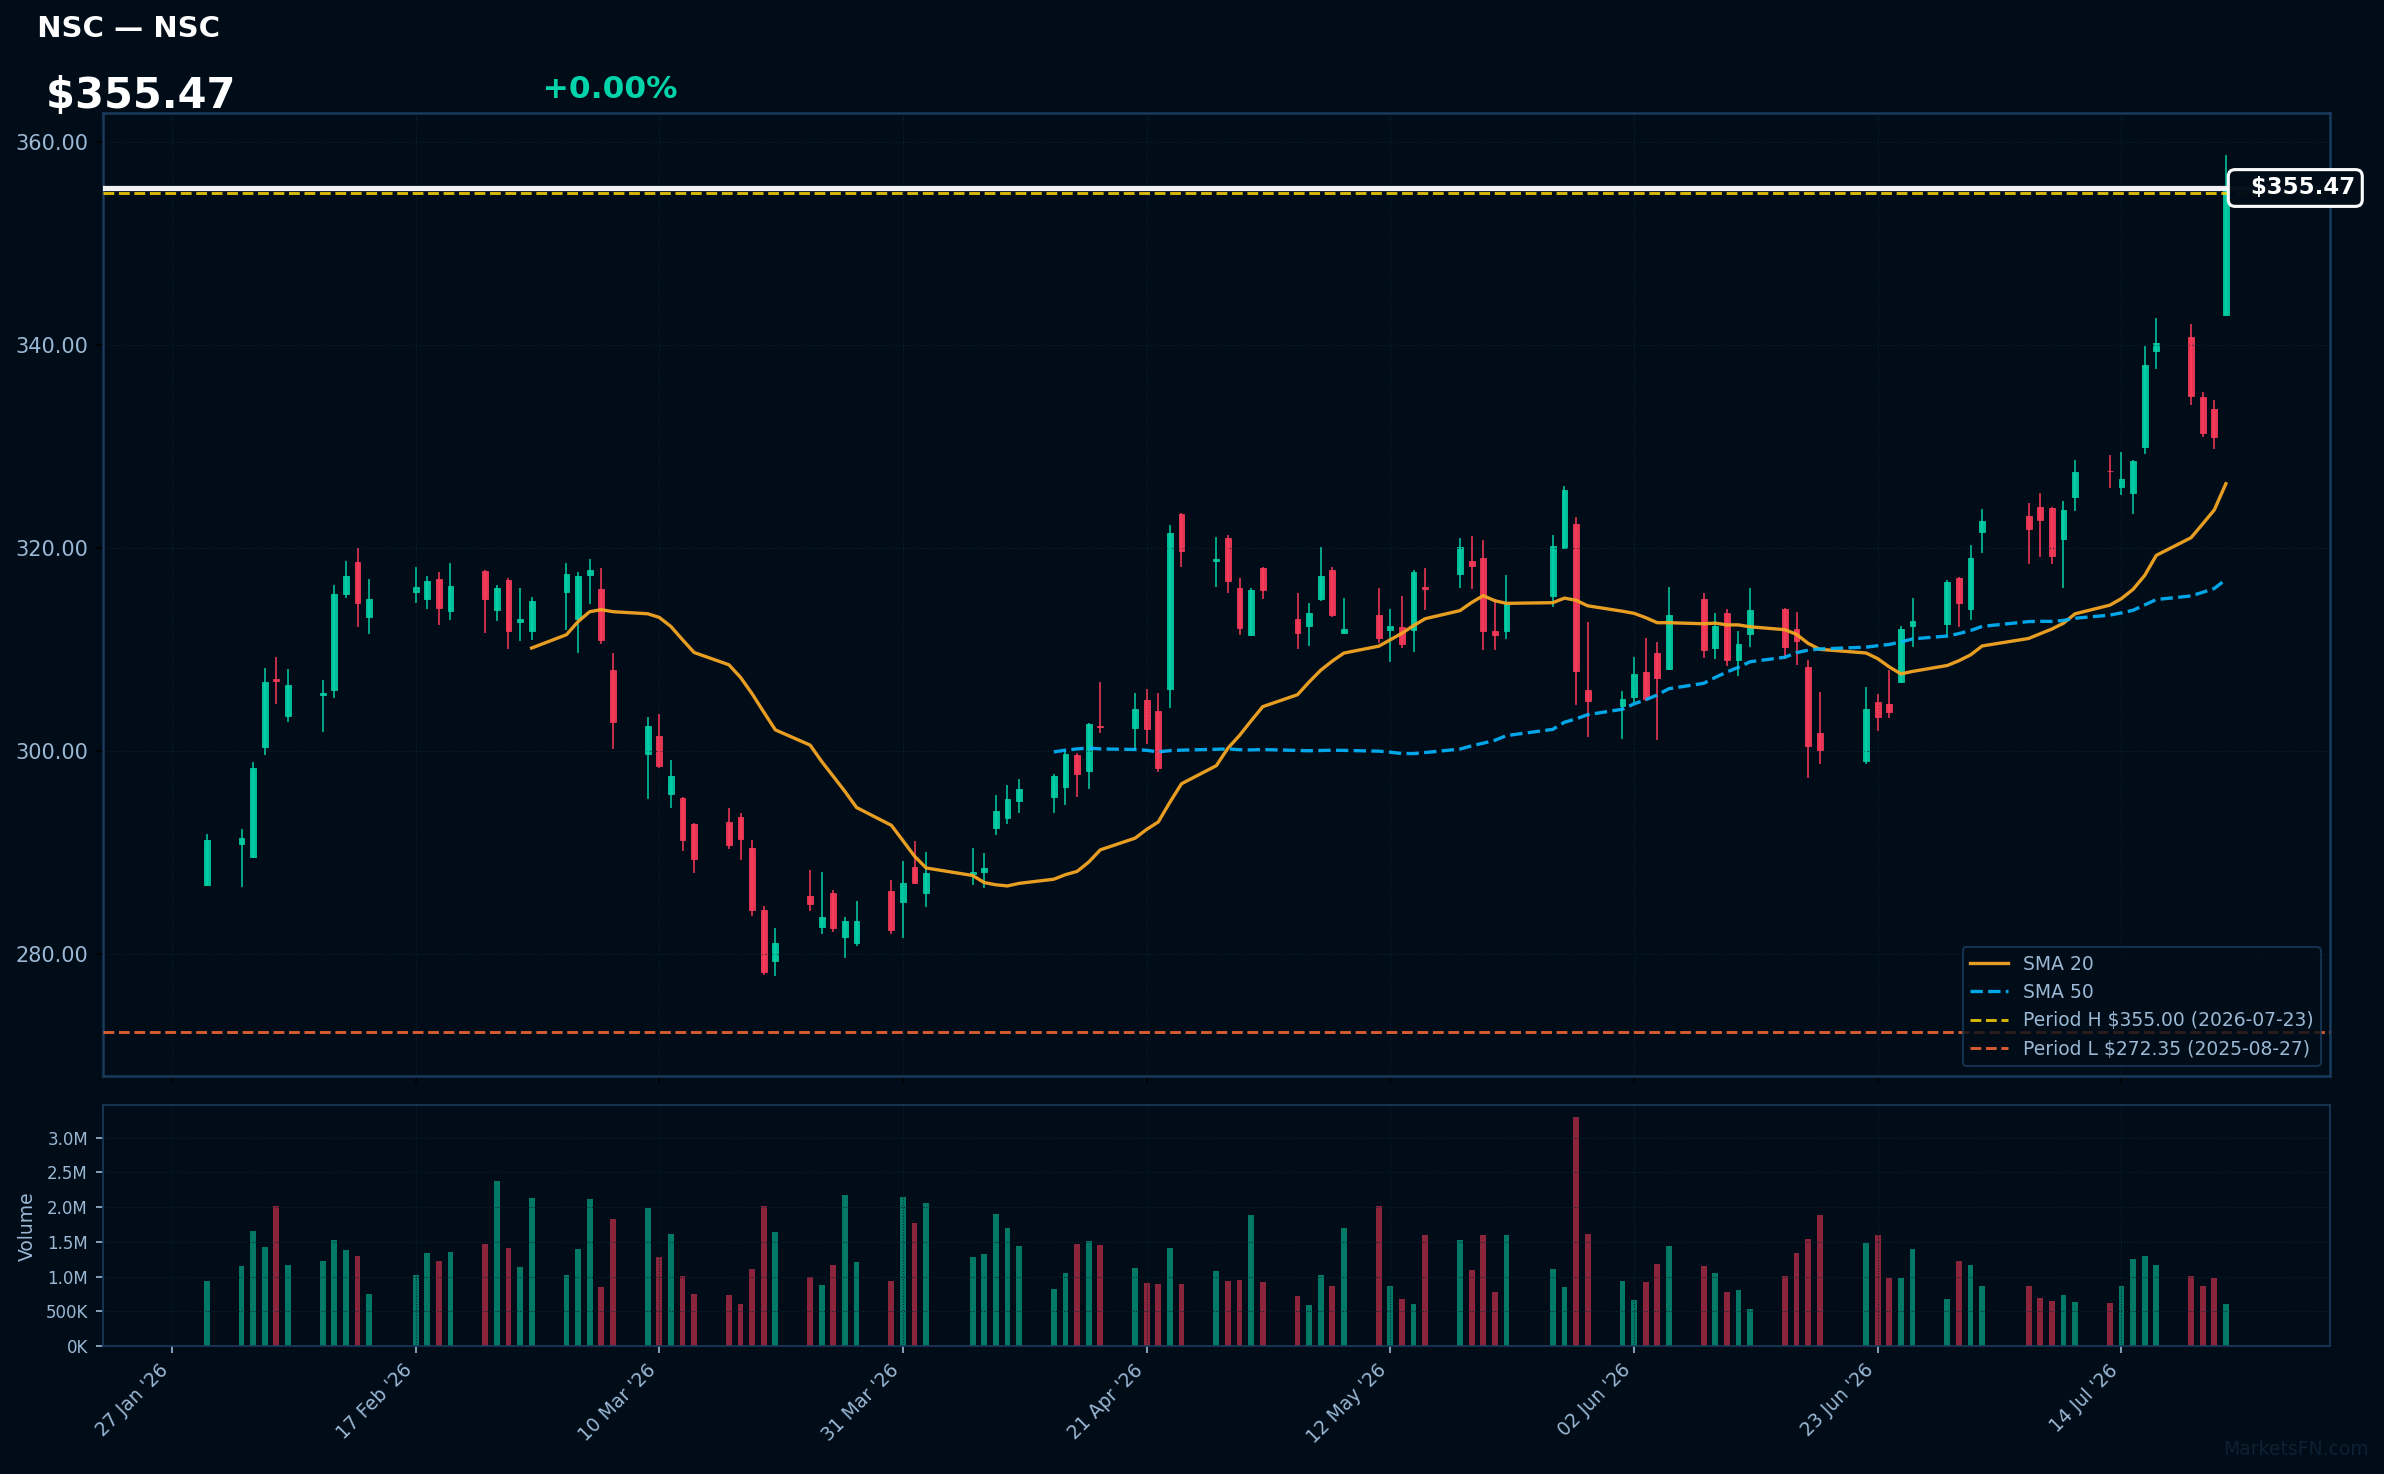
NSC | Norfolk Southern Corp | Industrials | Price Last: $355.00 | % Realized: +26.66% | RSI: 75.1 | % above MA200: +18.1% | Trend: Above MA20, MA50, MA200
Norfolk Southern Corp operates a rail network, transporting goods like coal, intermodal containers, and automotive parts. Investors care about its operational efficiency and market share in the rail industry, as it impacts revenue and profitability.
NSC's RSI(14) is 75.1, indicating strong momentum with price > MA20 > MA50 > MA200, a bullish alignment. At 0.0% below its 52-Week high, it nears a potential breakout, suggesting continued uptrend.
Related headlines
📉 Nearest to 52-Week Low
Sectors represented: Consumer Cyclical (2), Technology (1), Consumer Defensive (1), Healthcare (1)
| Ticker | Company | Sector | Price Last | % Realized | 52-Week Low Date | RSI | % above MA200 | Trend |
|---|---|---|---|---|---|---|---|---|
| IBM | International Business Machines Corp | Technology | $202.49 | -28.20% | 2026-07-23 | 29.0 | -25.7% | Below MA20, MA50, MA200 |
| MCD | McDonald's Corp | Consumer Cyclical | $262.85 | -11.83% | 2026-07-23 | 38.4 | -12.8% | Below MA20, MA50, MA200 |
| PEP | PepsiCo Inc | Consumer Defensive | $134.52 | -7.65% | 2026-07-23 | 39.4 | -10.2% | Below MA20, MA50, MA200 |
| ISRG | Intuitive Surgical Inc | Healthcare | $329.68 | -34.32% | 2026-07-23 | 28.5 | -32.0% | Below MA20, MA50, MA200 |
| LOW | Lowe's Cos., Inc | Consumer Cyclical | $201.51 | -11.85% | 2026-07-23 | 36.0 | -16.1% | Below MA20, MA50, MA200 |
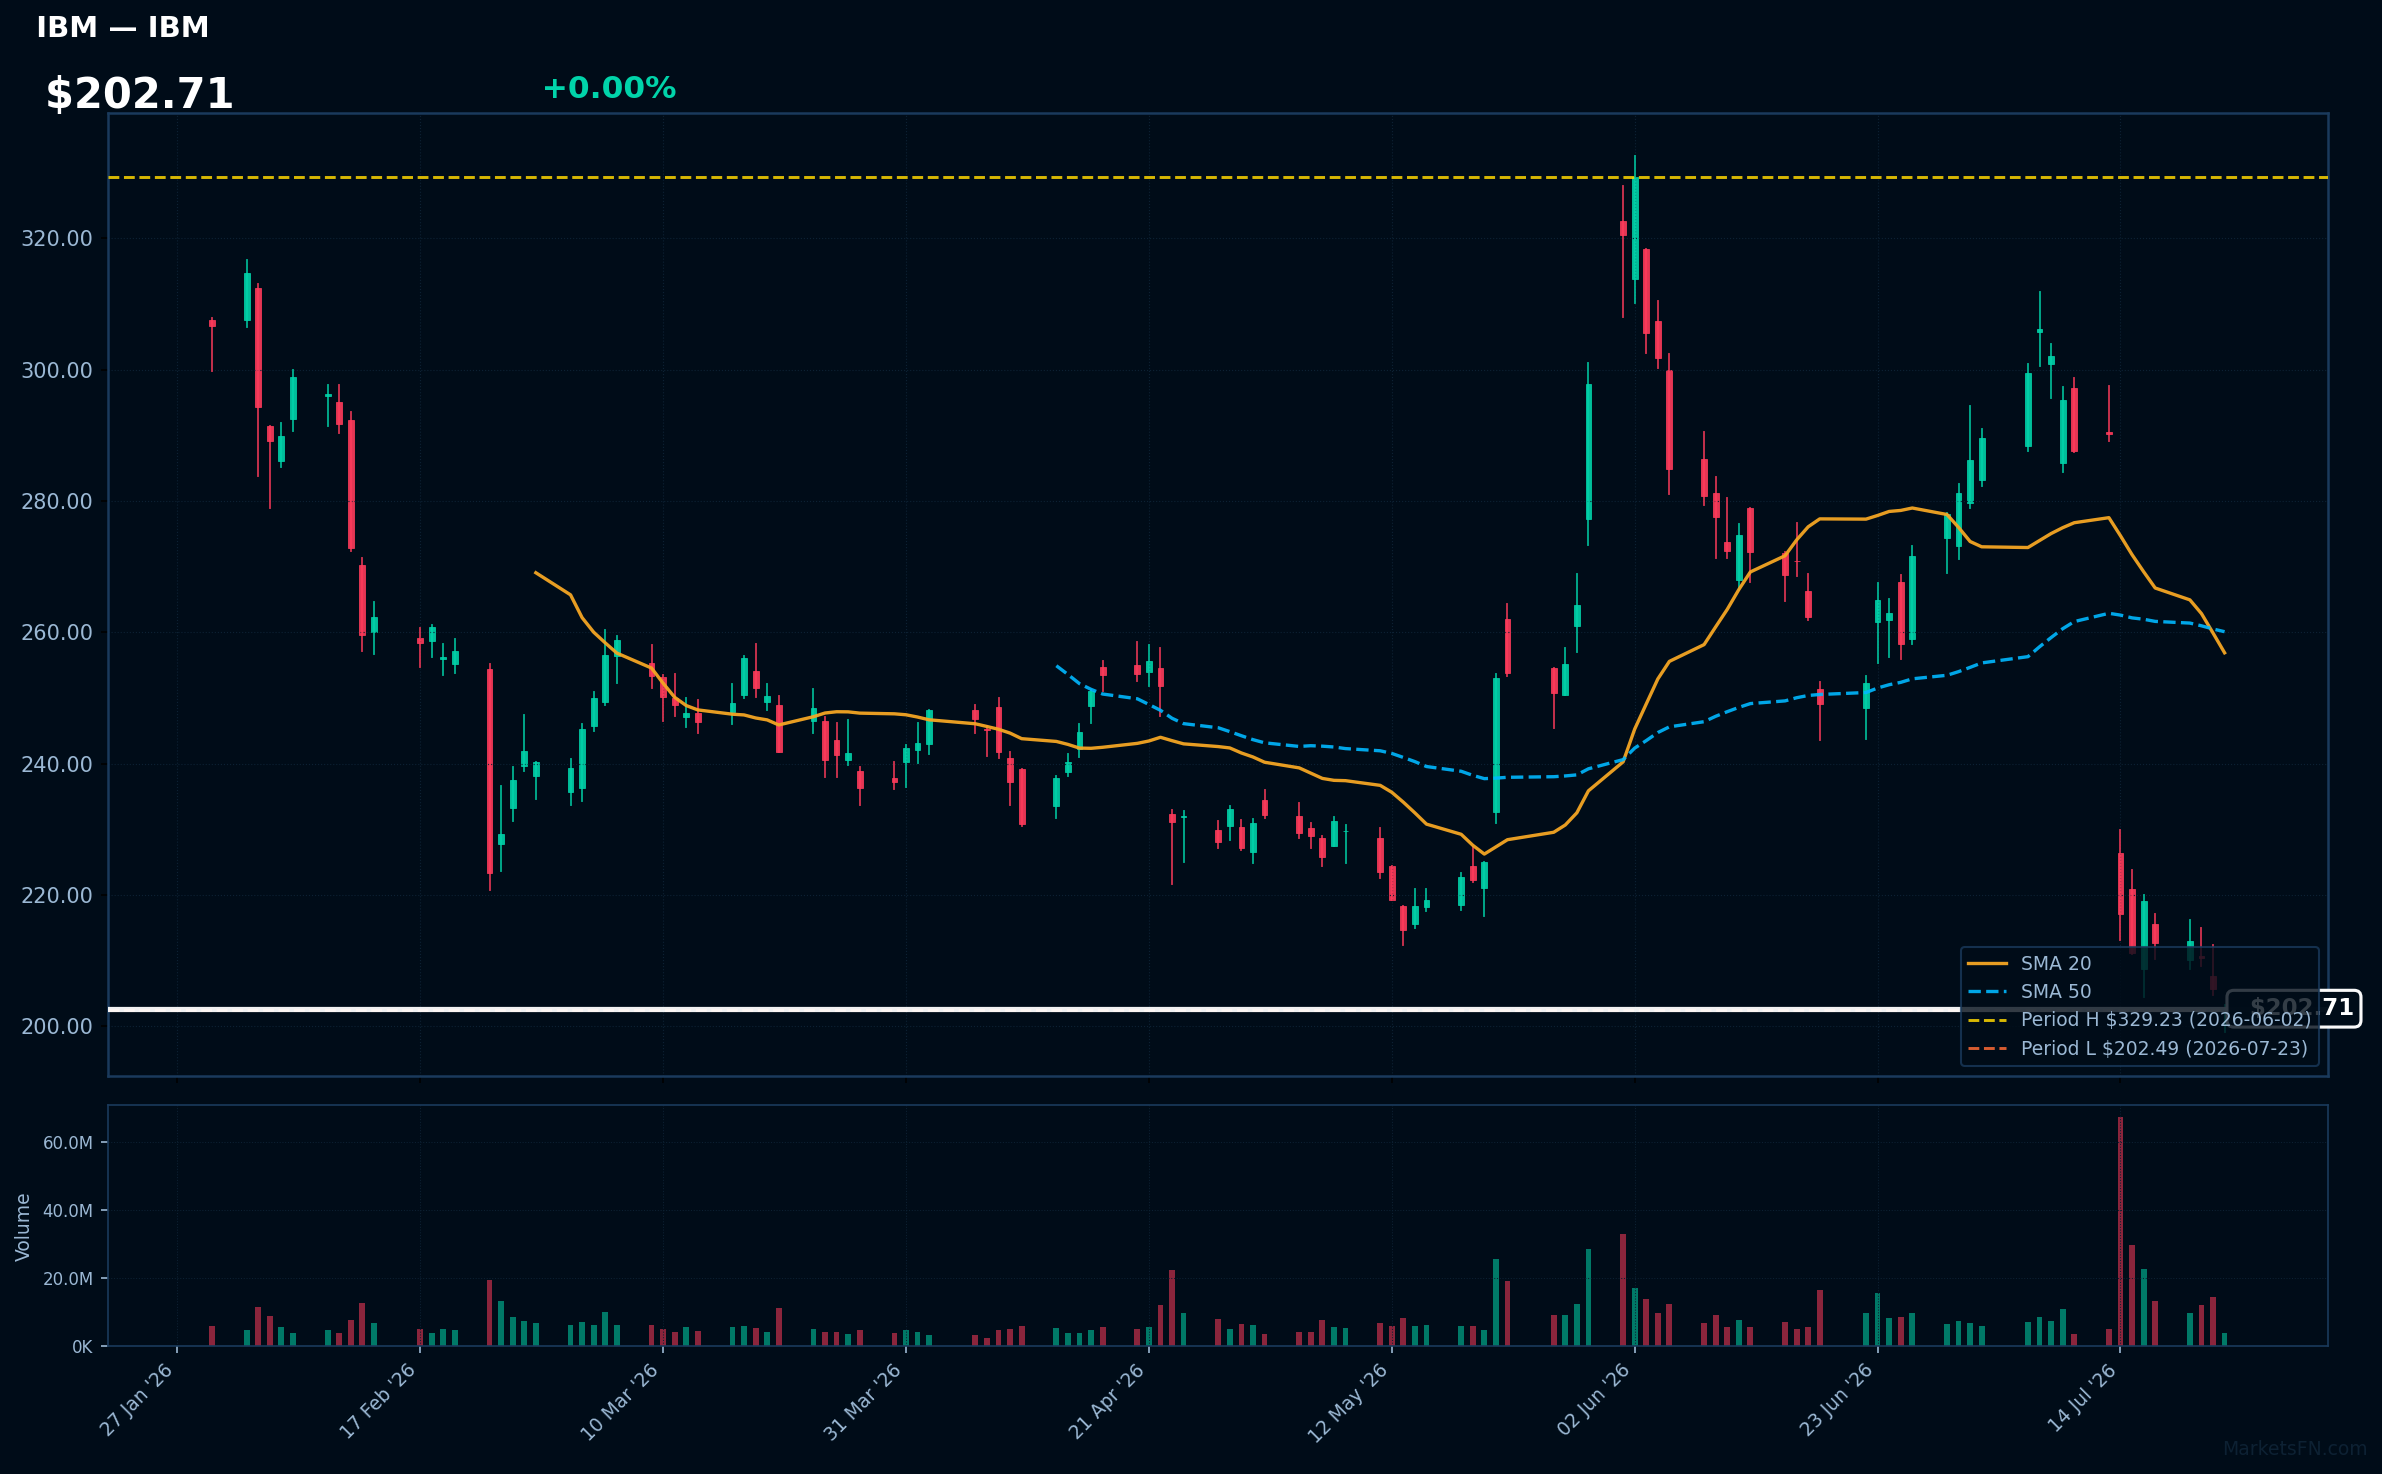
IBM | International Business Machines Corp | Technology | Price Last: $202.49 | % Realized: -28.20% | RSI: 29.0 | % above MA200: -25.7% | Trend: Below MA20, MA50, MA200
International Business Machines Corp (IBM) is a technology company that provides a range of services including cloud computing, artificial intelligence, and IT consulting. Investors should care about its transition to a cloud-focused business and its ability to compete with peers.
IBM's technical situation is bearish, with an RSI(14) of 29.0 indicating oversold conditions, and a sustained downtrend as price ($202.71) remains below MA20, MA50, and MA200, with the stock testing its 52-Week low.
Related headlines
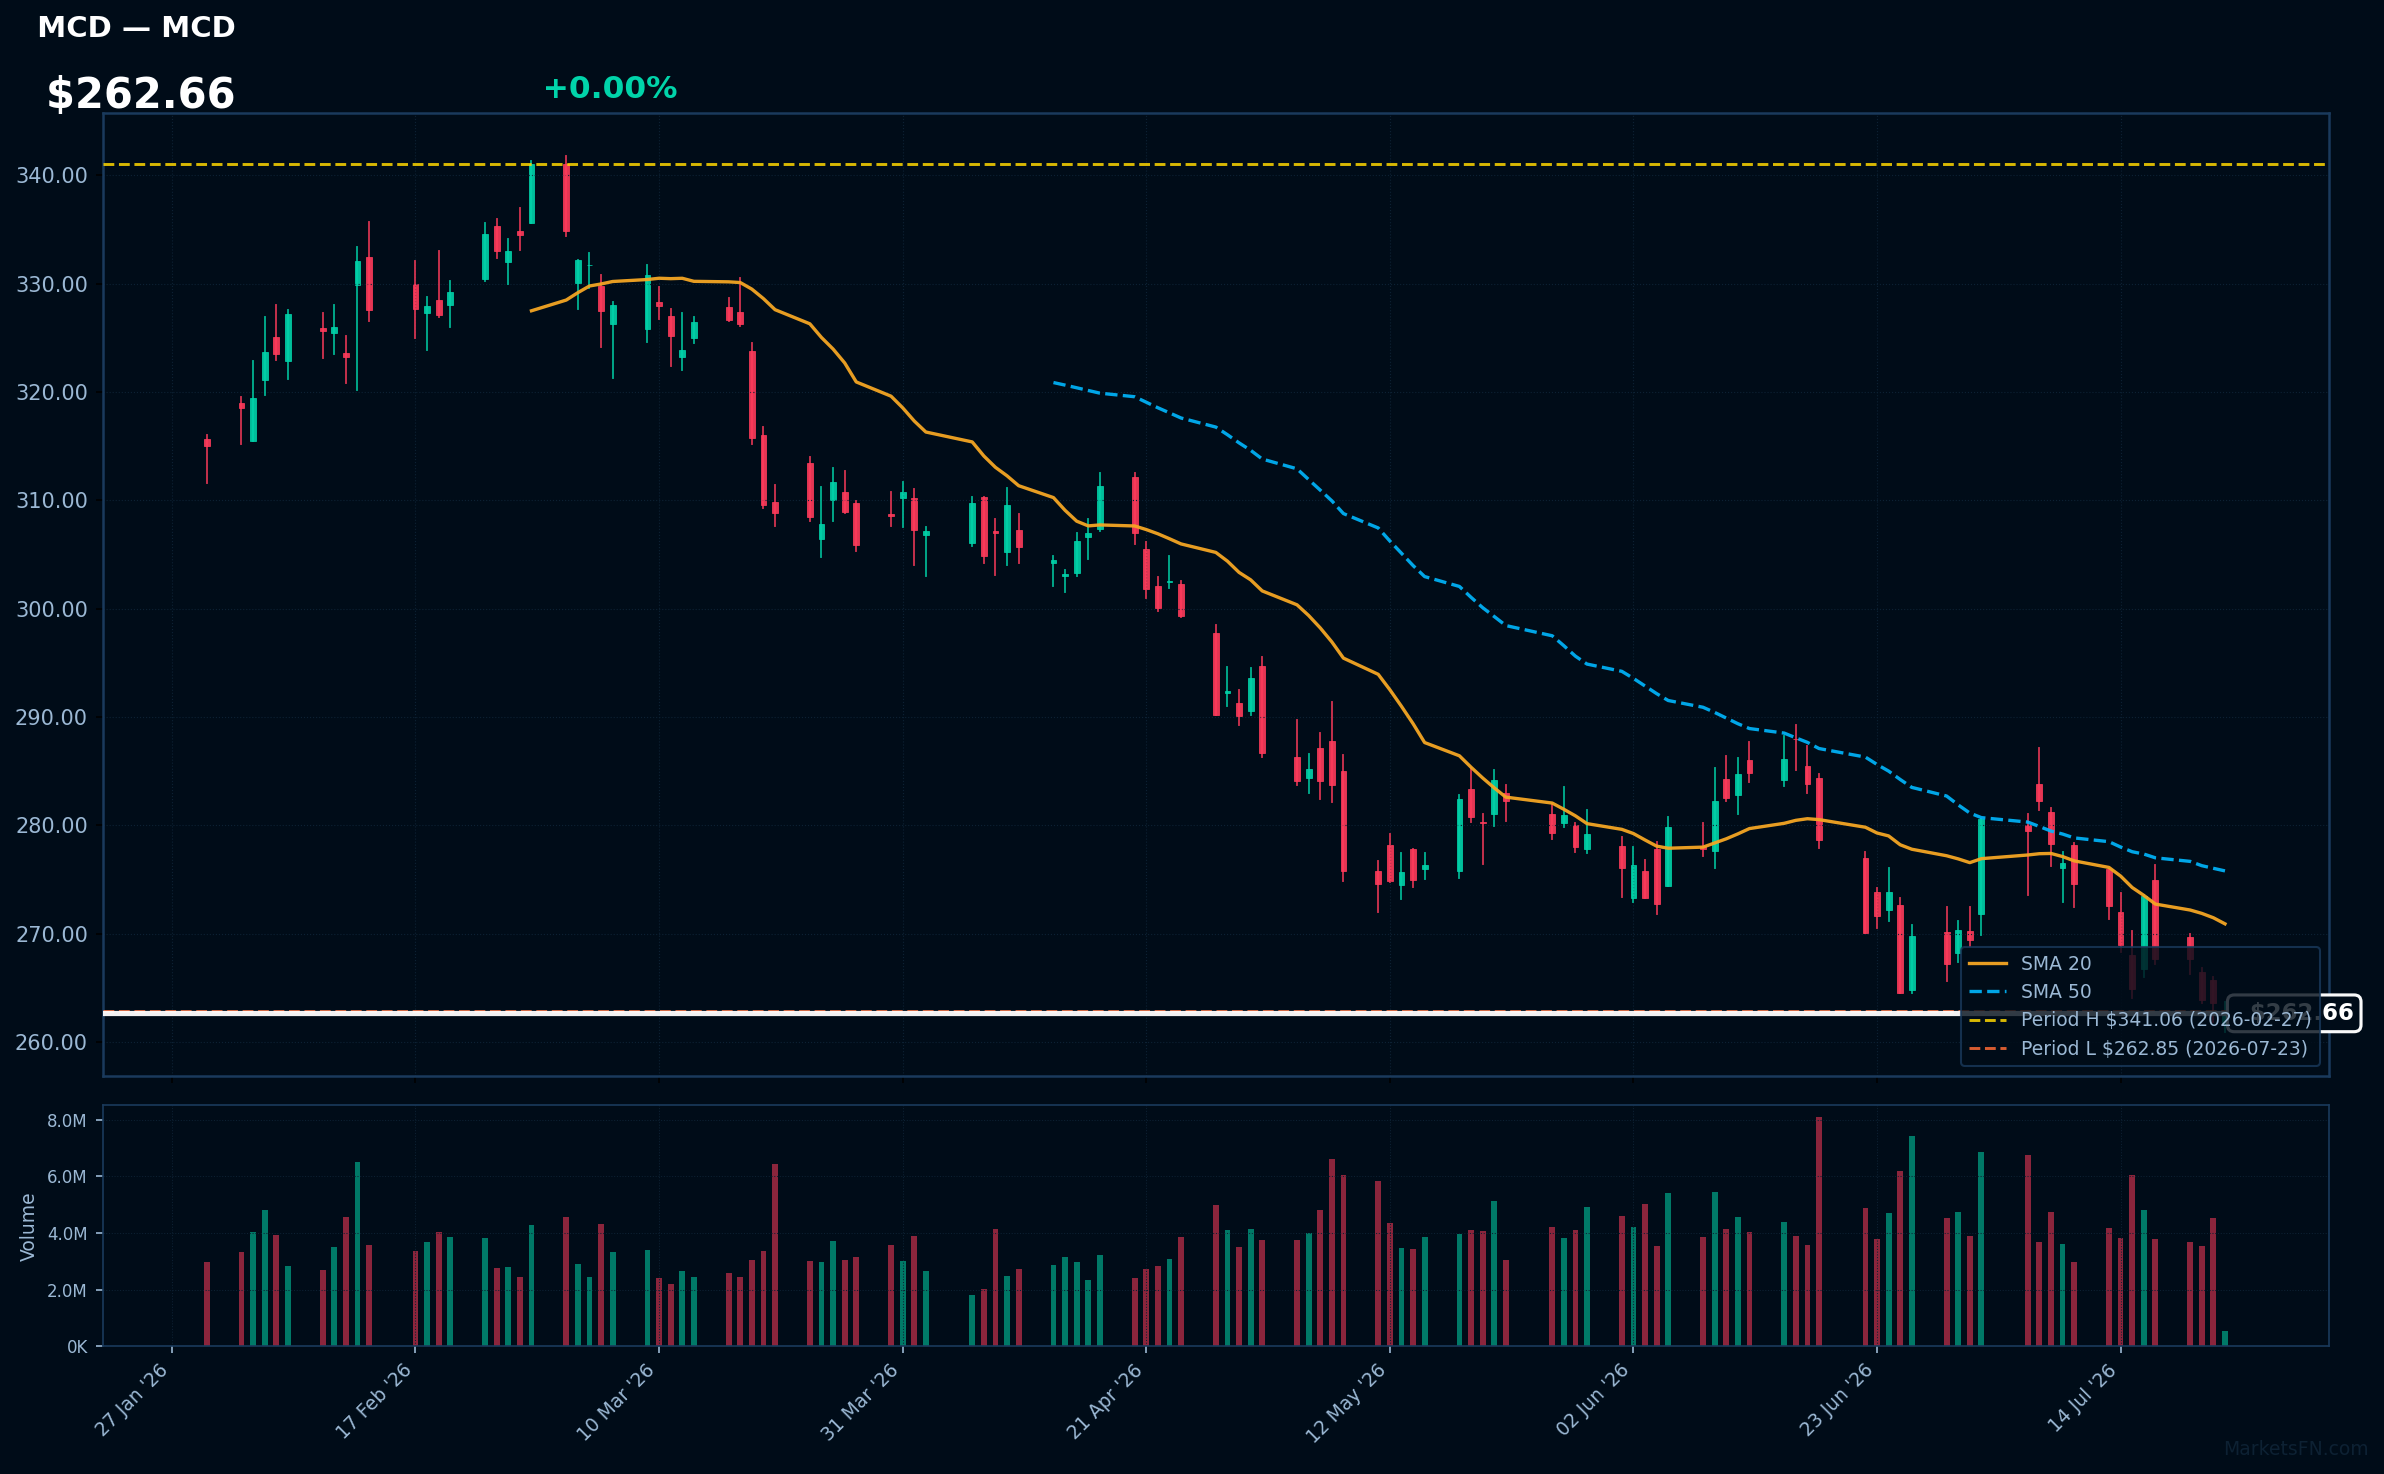
MCD | McDonald's Corp | Consumer Cyclical | Price Last: $262.85 | % Realized: -11.83% | RSI: 38.4 | % above MA200: -12.8% | Trend: Below MA20, MA50, MA200
McDonald's Corp operates quick-service restaurants, serving burgers, fries, and beverages globally. Investors should care about its brand strength, global footprint, and ability to adapt to changing consumer preferences, impacting revenue growth and profitability.
McDonald's Corp is testing major support with its price at 0.0% above its 52-Week low. The RSI(14) is 38.4, and the MA alignment is bearish (price < MA20 < MA50 < MA200), indicating a sustained downtrend and potential further decline, as seen in its -11.8% 52-Week return.
Related headlines
- Why Did PEGA, ISRG, MCD Stocks Plunge To 52-Week Lows Today?
- Why Did PSKY, MCD, NOC Stocks Tumble To 52-Week Lows Today?
- A weak yen turned Tokyo into a steal. A strong shekel turned Tel Aviv into the worlds most expensive city to buy McDonalds
- McDonald's is adding honey brown butter breakfast biscuits to its menu
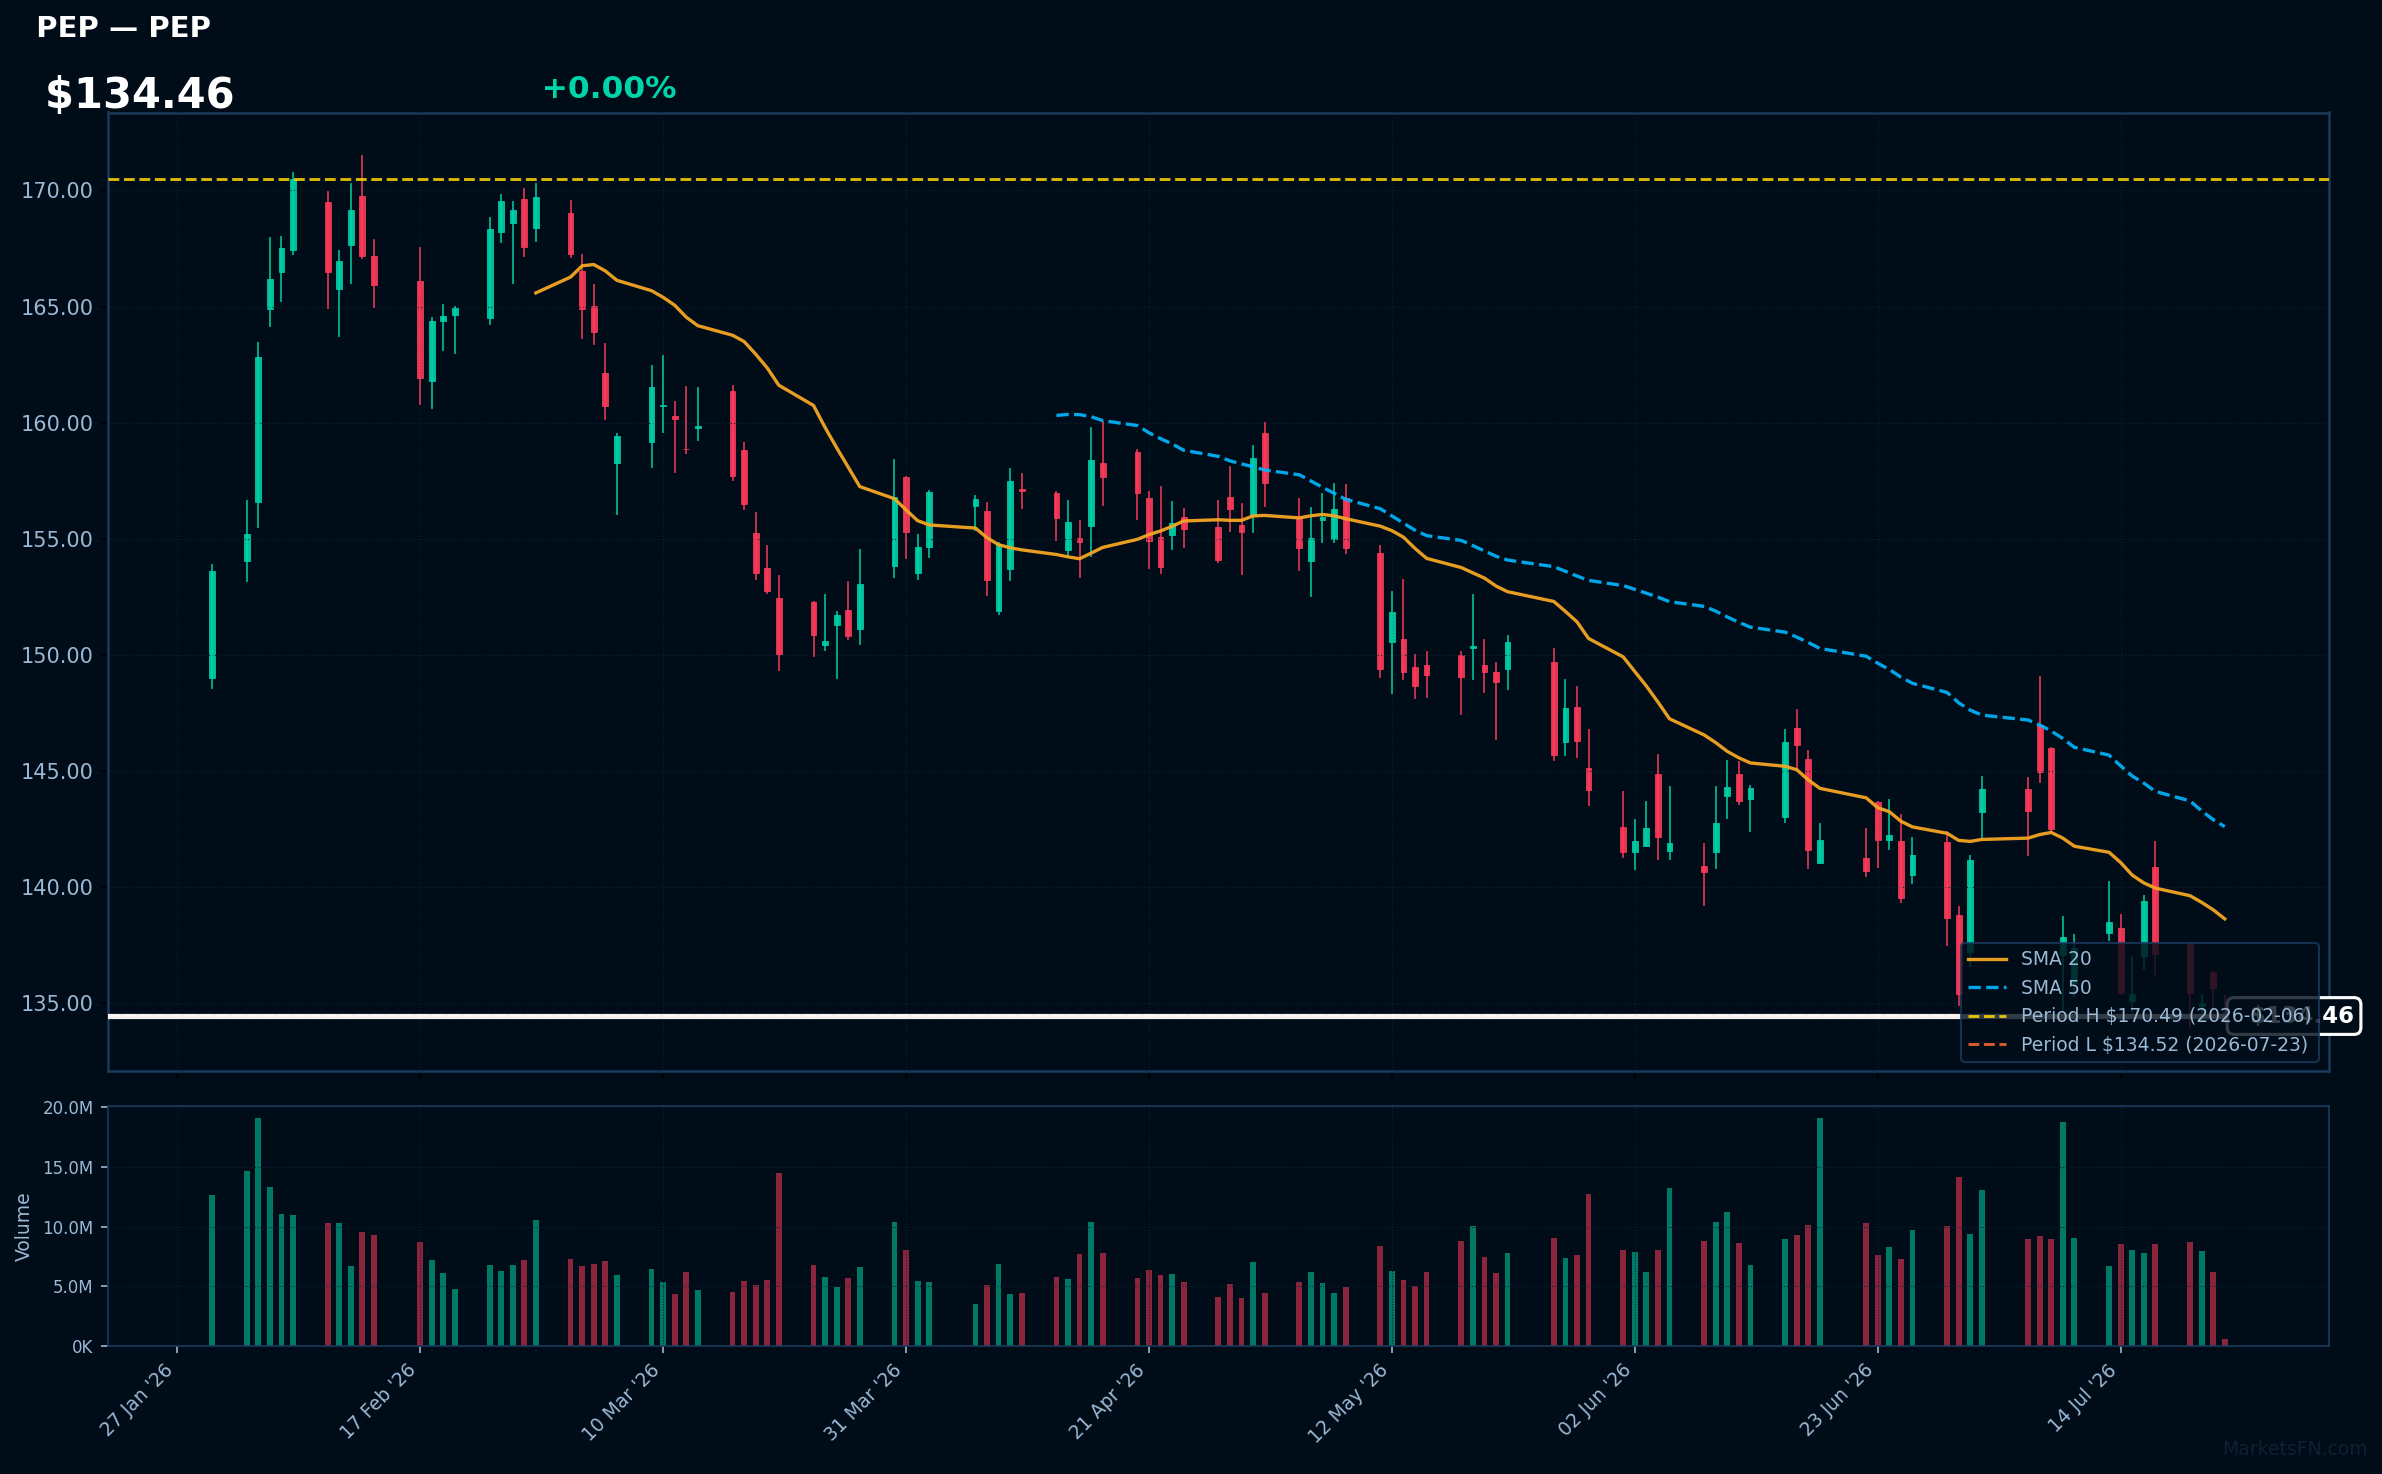
PEP | PepsiCo Inc | Consumer Defensive | Price Last: $134.52 | % Realized: -7.65% | RSI: 39.4 | % above MA200: -10.2% | Trend: Below MA20, MA50, MA200
PepsiCo Inc is a diversified food and beverage company with brands like Pepsi, Lay's, and Gatorade, generating revenue through beverage sales, snack foods, and other categories. Investors care about its performance due to its market share and consumer staples exposure.
PepsiCo's technical situation is bearish, with an RSI(14) of 39.4 indicating oversold conditions, price below all MAs (MA20, MA50, MA200), and a 52-Week low test, suggesting a sustained downtrend and potential further decline, with a 52-Week return of -7.6%.
Related headlines
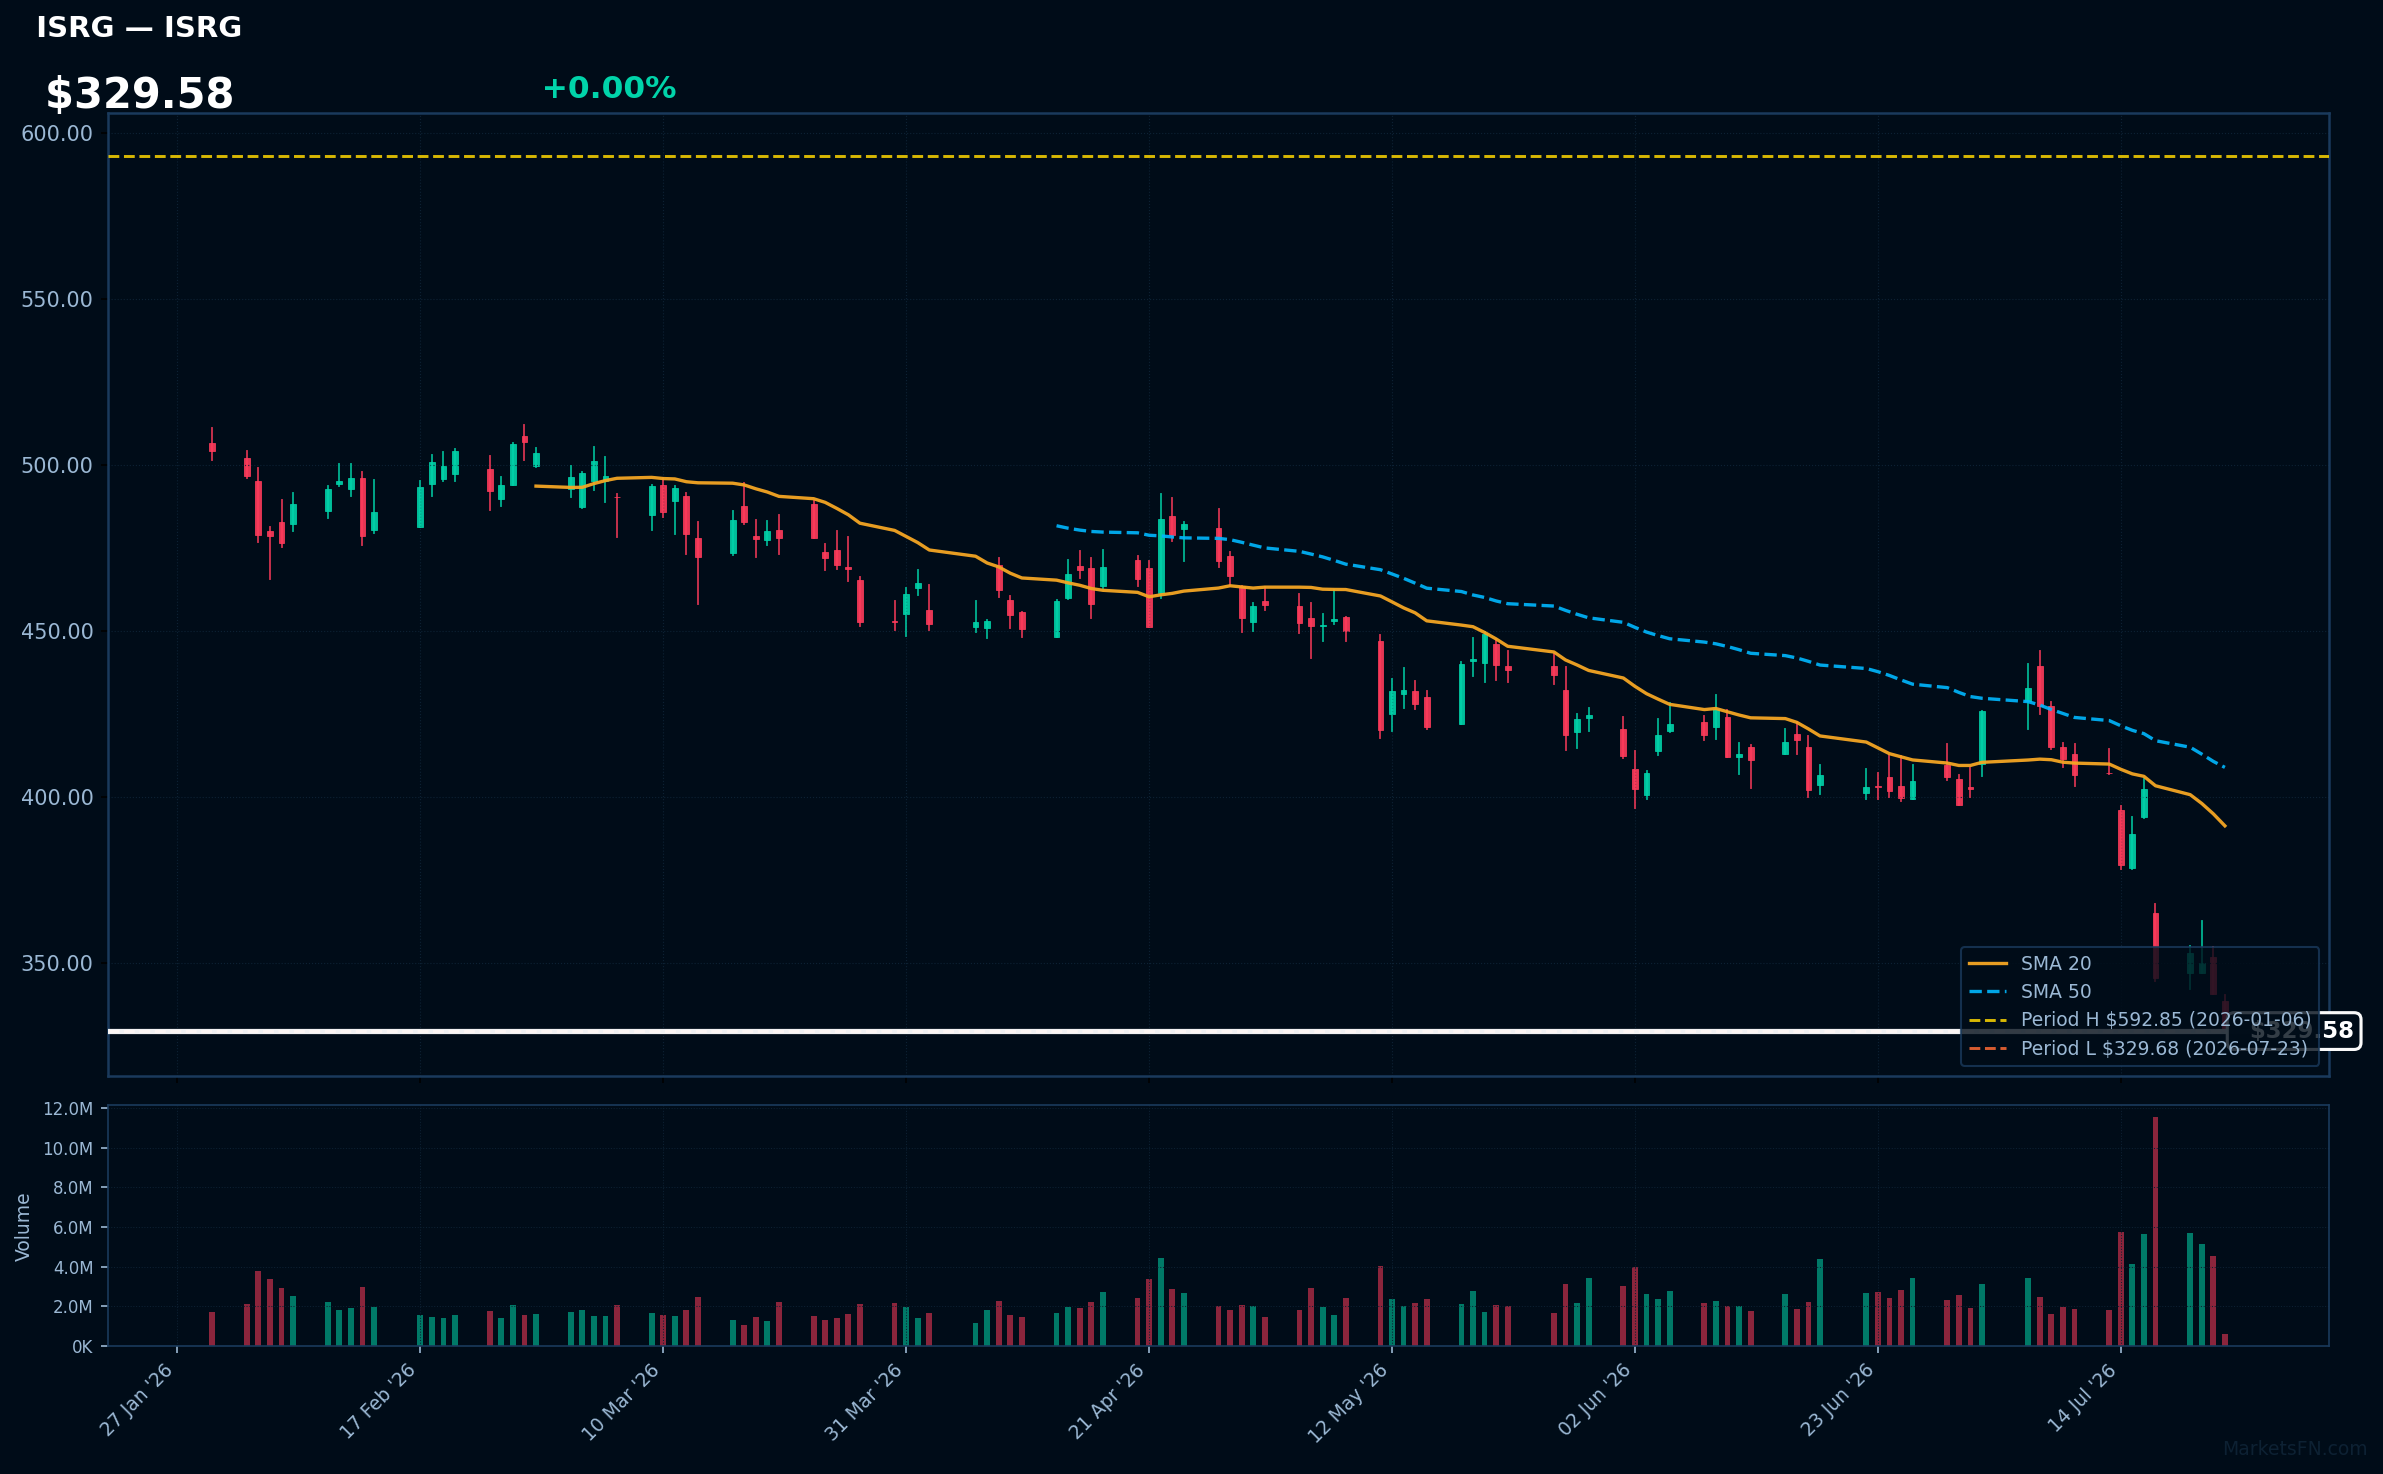
ISRG | Intuitive Surgical Inc | Healthcare | Price Last: $329.68 | % Realized: -34.32% | RSI: 28.5 | % above MA200: -32.0% | Trend: Below MA20, MA50, MA200
Intuitive Surgical Inc develops and markets robotic-assisted surgical systems, primarily the da Vinci Surgical System, enhancing precision and minimally invasive procedures. Investors care due to its market dominance and growth potential in surgical robotics.
ISRG's technicals indicate a warning sign: RSI(14) at 28.5 suggests oversold conditions, with price below all MAs (MA20, MA50, MA200) in a sustained downtrend, and trading 0.0% above its 52-Week low, testing major support.
Related headlines
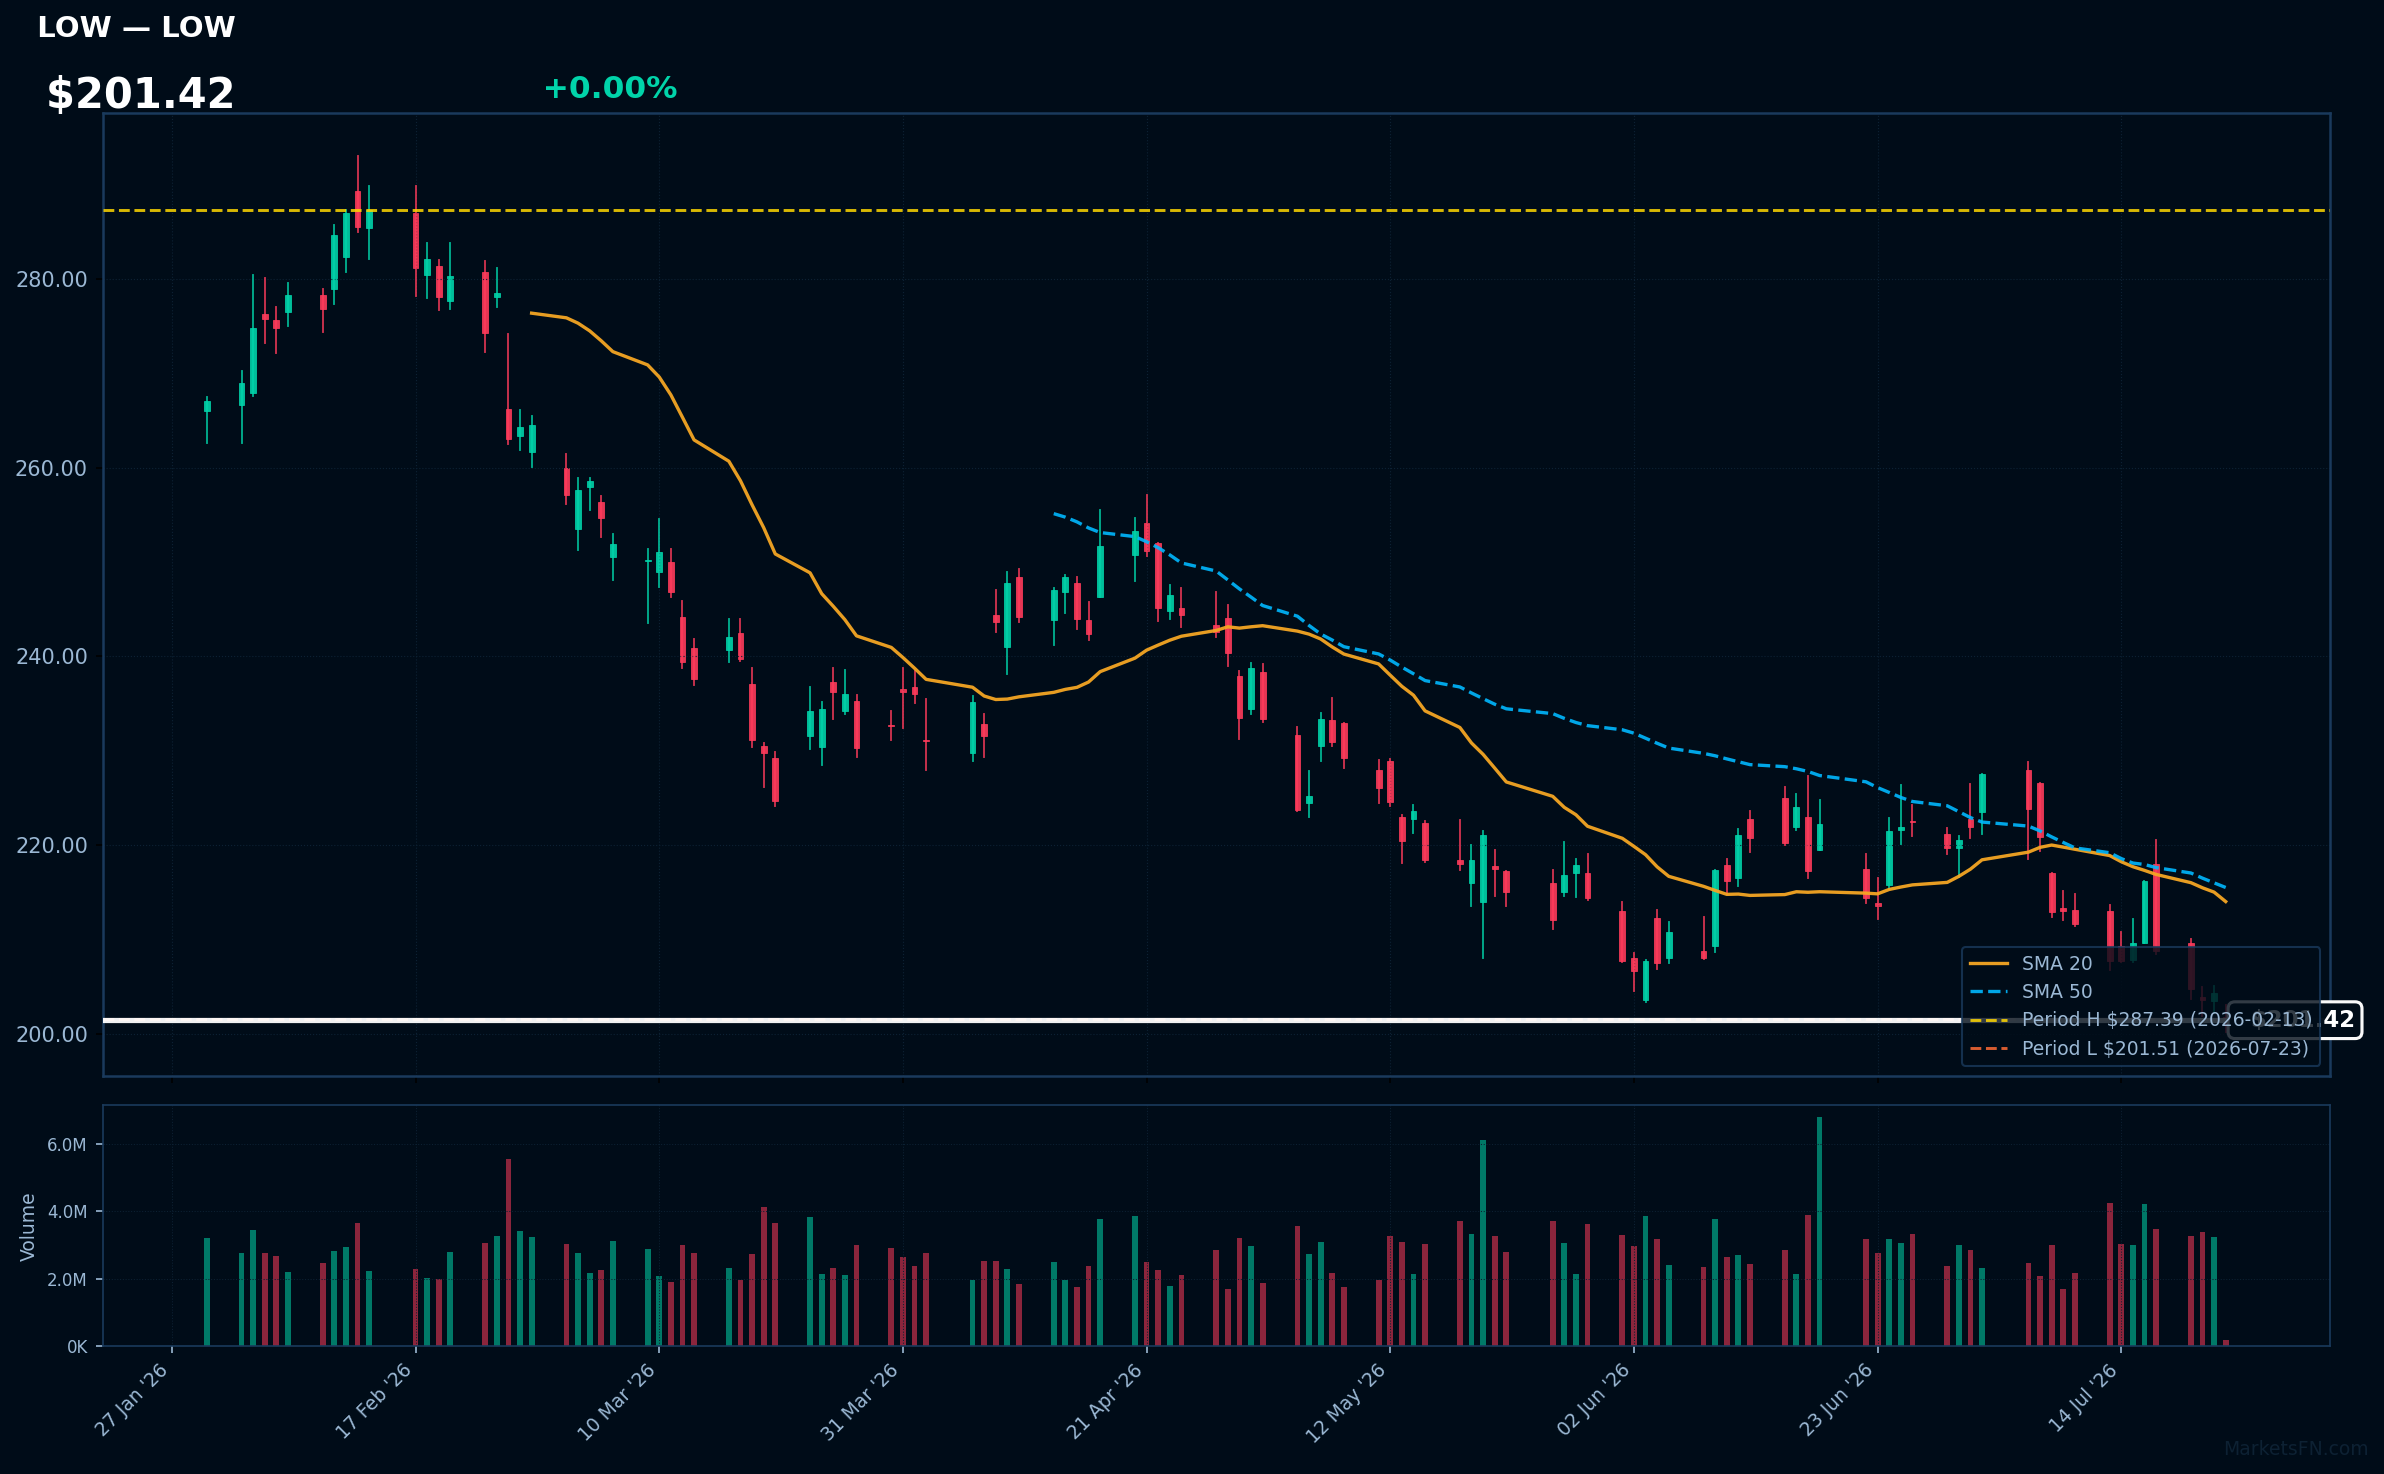
LOW | Lowe's Cos., Inc | Consumer Cyclical | Price Last: $201.51 | % Realized: -11.85% | RSI: 36.0 | % above MA200: -16.1% | Trend: Below MA20, MA50, MA200
Lowe's Cos., Inc operates as a home improvement retailer, selling products such as building materials, tools, and appliances. Investors should care as the company's performance reflects housing market trends and consumer spending habits.
Lowe's is in a sustained downtrend with price ($201.42) below MA20, MA50, and MA200. RSI(14) is 36.0, near oversold territory. The stock is 0.0% above its 52-Week low, testing major support, indicating a potential warning sign.
Related headlines
Market Commentary
The S&P 500 stocks listed are currently trading near their 52-week extremes, with some at highs and others at lows. Stocks at 52-week highs include UNP, WELL, GD, HWM, and NSC, all at their peak price. Conversely, IBM, MCD, PEP, ISRG, and LOW are at their 52-week lows. This indicates a significant price movement, potentially driven by fundamental or macroeconomic factors.
The stocks near 52-week highs are primarily from the industrials and real estate sectors, suggesting a potential rotation into these areas. The presence of ISRG at a 52-week low may indicate a sector-specific issue in healthcare or a reaction to broader market trends. The stocks at highs and lows are from different sectors, potentially reflecting diverse macroeconomic themes and investor sentiment.
Key levels to watch include the current prices of these stocks, as a break above or below their 52-week extremes could signal further price movements. Potential catalysts include earnings reports, macroeconomic data releases, and sector-specific news. Monitoring these stocks and their respective sectors may provide insights into broader market trends and potential investment opportunities.
Methodology: All 503 S&P 500 constituents screened. 52-week high = highest daily close over the past 252 trading days (approx. 1 year). 52-week low = lowest daily close over the same period. Distance = (current price / extreme − 1) × 100. Technical indicators computed on up to 1 year of daily OHLCV data.
Disclaimer: For informational purposes only. Not investment advice. Past performance is not indicative of future results.

