Solana Eyes $70 as RSI Hints at Further Upside, +3.07% Today
· Crypto · QuoteReporter
Solana Eyes $70 as RSI Hints at Further Upside, +3.07% Today
Solana (SOL/USD) | June 26, 2026 $69.6500 +3.07%
🔍 Technical Analysis
### **Technical Analysis: Solana (SOL)**
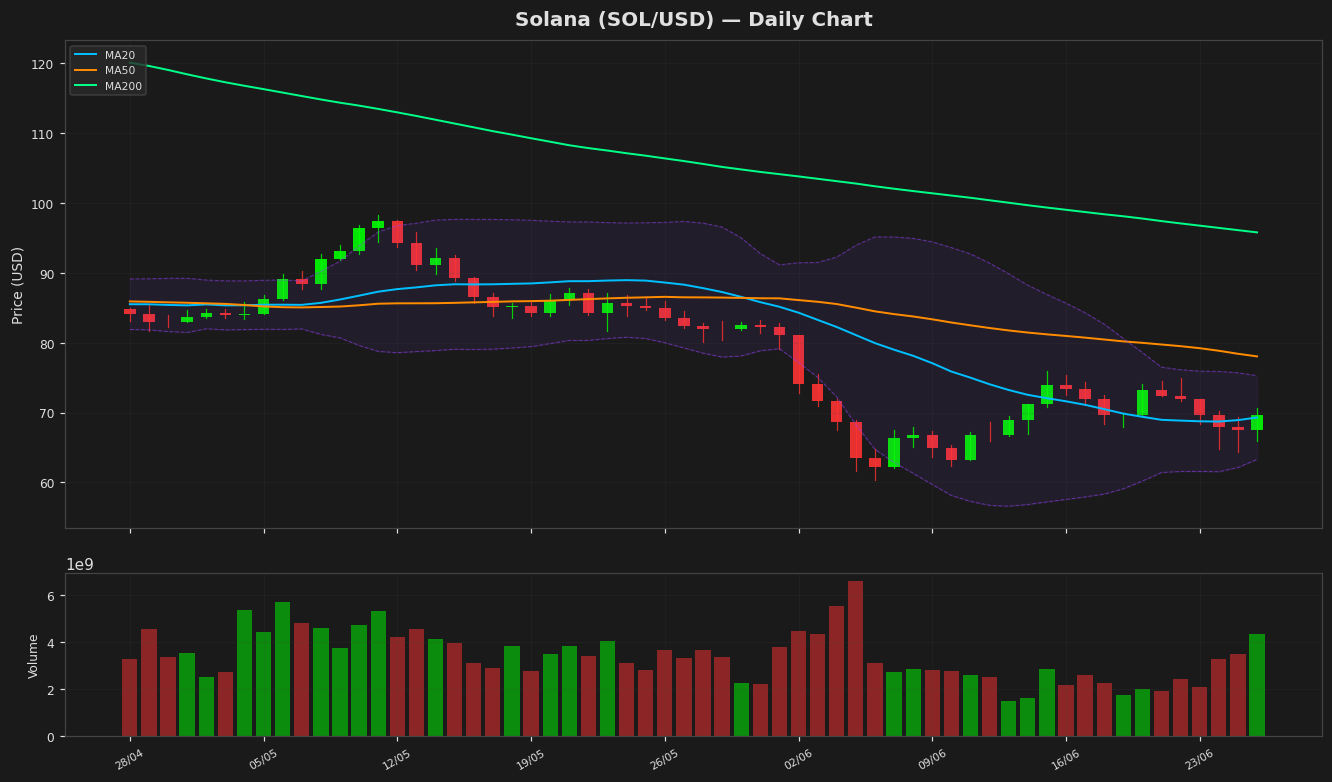
Solana (SOL) is currently trading at **$69.65**, up **3.07%** on the day, showing bullish momentum. The price is hovering near the **20-day moving average (MA20) at $69.29**, indicating short-term consolidation. However, it remains below the **MA50 ($78.04)** and **MA200 ($95.79)**, suggesting persistent bearish pressure in the medium to long term.
Bollinger Bands show a narrowing range, with the upper band at **$75.28** and the lower band at **$63.30**, signaling reduced volatility. The price is currently near the middle band, reflecting neutral momentum.
The **RSI (14) at 56.36** is in neutral territory, neither overbought nor oversold, but leaning slightly bullish. The **MACD (-1.82) remains below its signal line (-2.23)**, indicating weak bearish momentum, though the histogram shows a potential reversal if the MACD crosses upward.
Key resistance levels to watch are **$75.28 (upper Bollinger Band)** and **$78.04 (MA50)**. On the downside, support lies at **$63.30 (lower Bollinger Band)** and the **52-week low of $60.41**. A break above **$75.28** could signal further upside, while a drop below **$63.30** may lead to a retest of yearly lows. Given the mixed signals, traders should watch for confirmation in either direction.
Technical Metrics
| Metric | Value |
|---|---|
| Current Price | $69.6500 |
| Daily Change | +3.07% |
| MA 20 | $69.2930 |
| % from MA20 | +0.52% |
| MA 50 | $78.0409 |
| % from MA50 | -10.75% |
| MA 200 | $95.7912 |
| % from MA200 | -27.29% |
| BB Upper | $75.2847 |
| % from BB Upper | -7.48% |
| BB Lower | $63.3012 |
| % from BB Lower | +10.03% |
| RSI (14) | 56.36 |
| MACD | -1.824564 |
| MACD Signal | -2.230158 |
| ATR (14) | 3.825550 |
| 3-Day High | $70.7035 |
| 3-Day Low | $64.4184 |
| 52-Week High | $205.0201 |
| % from 52W High | -66.03% |
| 52-Week Low | $60.4147 |
| % from 52W Low | +15.29% |
| YTD High | $148.2160 |
| % from YTD High | -53.01% |
| YTD Low | $60.4147 |
| % from YTD Low | +15.29% |
📊 Market Commentary
Solana (SOL) is trading at $69.65, up 3.07% today, showing renewed bullish momentum after recent consolidation. The Relative Strength Index (RSI) at 56.4 suggests SOL is neither overbought nor oversold, leaving room for further movement in either direction. Market sentiment appears cautiously optimistic as traders assess whether the current uptick can sustain above key resistance levels.
The 52-week range of $60.41 to $205.02 highlights SOL’s volatility, with the current price near the lower bound, reflecting a broader downtrend from its yearly highs. Traders are closely watching the $70 psychological level, which has acted as both support and resistance in recent weeks. A sustained break above this level could signal stronger bullish conviction, while failure to hold may see a retest of support near $65 or the yearly low around $60.41.
On-chain activity and network performance remain focal points, with Solana’s high-speed transactions and developer activity continuing to attract attention. However, macroeconomic factors and broader crypto market trends are also influencing price action. Traders are monitoring Bitcoin’s movement and regulatory developments, as these often set the tone for altcoins like SOL. For now, the market appears balanced, with neither strong buying nor selling pressure dominating. The coming sessions will be critical in determining whether SOL can build on today’s gains or face renewed downward pressure.
Disclaimer
The content on MarketsFN.com is provided for educational and informational purposes only. It does not constitute financial advice or investment recommendations. All investments involve risk. Cryptocurrency markets are highly volatile. Past performance does not guarantee future results.