Solana Price Dips to $68.64 Amid Bearish Pressure, RSI at 57.3
· Crypto · QuoteReporter
Solana Price Dips to $68.64 Amid Bearish Pressure, RSI at 57.3
Solana (SOL/USD) | June 23, 2026 $68.6400 -4.54%
🔍 Technical Analysis
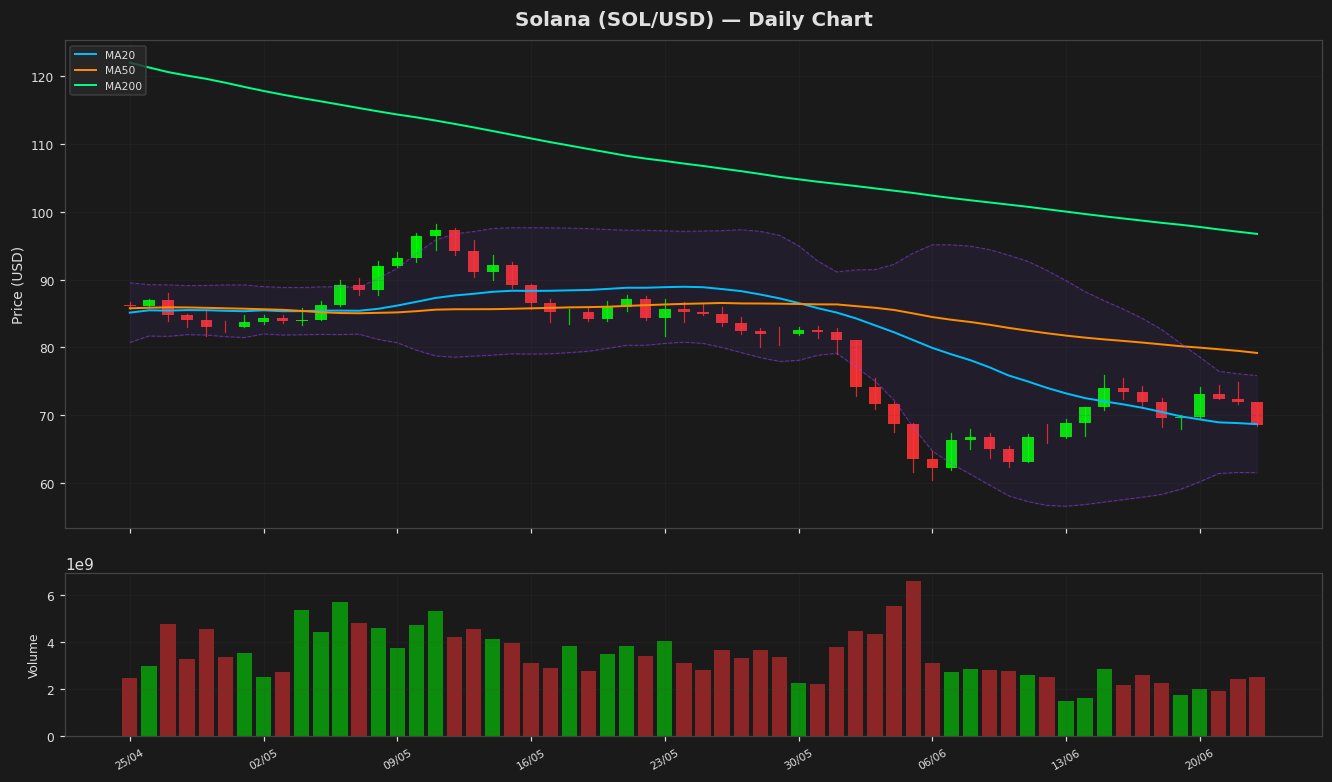
Solana (SOL) is currently trading at $68.64, down 4.54% on the daily chart, reflecting short-term bearish pressure. The price is hovering near the 20-day moving average (MA20) at $68.70, suggesting a critical juncture where a break below could signal further downside. The 50-day moving average (MA50) at $79.19 and the 200-day MA (MA200) at $96.75 both indicate a longer-term bearish trend, as SOL remains below these key levels. Bollinger Bands show the upper band at $75.86 and the lower band at $61.54, with the price currently in the middle range, indicating neutral volatility. The Relative Strength Index (RSI) at 57.30 is in neutral territory, neither overbought nor oversold, leaving room for potential movement in either direction. The MACD histogram is at -1.81, below the signal line at -2.59, suggesting bearish momentum but with weakening downside pressure. Key support lies at the yearly low of $60.41, while resistance is observed near the MA50 at $79.19 and the 52-week high of $208.33. The Average True Range (ATR) of 3.44 indicates moderate volatility. Overall, SOL’s price action remains cautious, with a bearish bias unless it reclaims higher moving averages.
Technical Metrics
| Metric | Value |
|---|---|
| Current Price | $68.6400 |
| Daily Change | -4.54% |
| MA 20 | $68.7022 |
| % from MA20 | -0.09% |
| MA 50 | $79.1941 |
| % from MA50 | -13.33% |
| MA 200 | $96.7488 |
| % from MA200 | -29.05% |
| BB Upper | $75.8628 |
| % from BB Upper | -9.52% |
| BB Lower | $61.5417 |
| % from BB Lower | +11.53% |
| RSI (14) | 57.30 |
| MACD | -1.806880 |
| MACD Signal | -2.594976 |
| ATR (14) | 3.439565 |
| 3-Day High | $74.8915 |
| 3-Day Low | $68.3994 |
| 52-Week High | $208.3312 |
| % from 52W High | -67.05% |
| 52-Week Low | $60.4147 |
| % from 52W Low | +13.61% |
| YTD High | $148.2160 |
| % from YTD High | -53.69% |
| YTD Low | $60.4147 |
| % from YTD Low | +13.61% |
📊 Market Commentary
**Solana (SOL) Market Commentary**
Solana (SOL) is currently trading at $68.64, down 4.54% today, reflecting broader market weakness. The Relative Strength Index (RSI) at 57.3 suggests SOL is neither overbought nor oversold, indicating balanced momentum. Over the past 52 weeks, SOL has ranged between $60.41 and $208.33, with the current price near the lower end of this spectrum.
Market sentiment remains cautious as traders monitor macroeconomic factors and Bitcoin’s price action, which often influences altcoins like SOL. Recent network congestion issues on Solana have also weighed on sentiment, though developers continue working on improvements.
Key support levels to watch include the psychological $65 zone and the 52-week low of $60.41. A break below could trigger further downside. On the upside, resistance is seen near $75, followed by $80, where previous rejections have occurred.
Traders are closely tracking Solana’s on-chain activity, including decentralized exchange (DEX) volumes and NFT sales, which have historically driven demand for SOL. Additionally, institutional interest in Solana-based ETFs, if materialized, could provide a catalyst. For now, SOL remains range-bound, with technical indicators suggesting neutral momentum. A decisive break in either direction will likely dictate the next trend.
Disclaimer
The content on MarketsFN.com is provided for educational and informational purposes only. It does not constitute financial advice or investment recommendations. All investments involve risk. Cryptocurrency markets are highly volatile. Past performance does not guarantee future results.